Shareholder Report
Jun. 30, 2025
USD ($)
Holding
Shareholder Report |
6 Months Ended |
|---|---|
|
Jun. 30, 2025
USD ($)
Holding
| |
| Shareholder Report [Line Items] | |
| Document Type | N-CSRS |
| Amendment Flag | false |
| Registrant Name | Advisors' Inner Circle Fund II |
| Entity Central Index Key | 0000890540 |
| Entity Investment Company Type | N-1A |
| Document Period End Date | Jun. 30, 2025 |
| C000015937 | |
| Shareholder Report [Line Items] | |
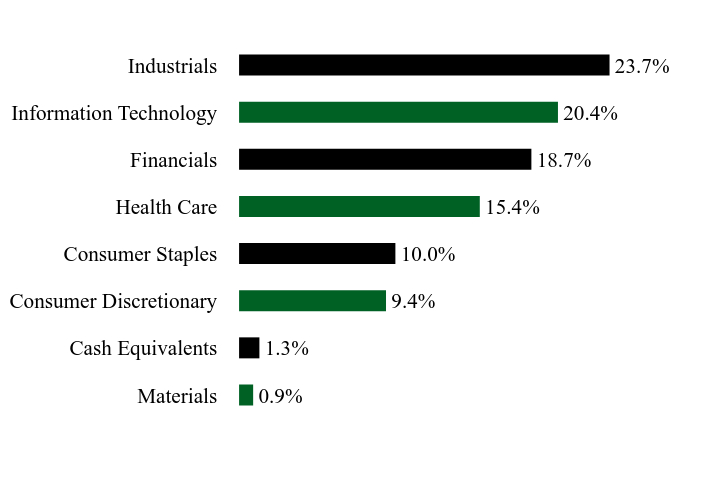
| Fund Name | Champlain Small Company Fund |
| Class Name | Advisor Shares |
| Trading Symbol | CIPSX |
| Annual or Semi-Annual Statement [Text Block] | This semi-annual shareholder report contains important information about Advisor Shares of the Champlain Small Company Fund (the "Fund") for the period from January 1, 2025 to June 30, 2025. |
| Shareholder Report Annual or Semi-Annual | Semi-Annual Shareholder Report |
| Additional Information [Text Block] | You can find additional information about the Fund at https://cipvt.com/documents/. You can also request this information by contacting us at 1-866-773-3238. |
| Additional Information Phone Number | 1-866-773-3238 |
| Additional Information Website | https://cipvt.com/documents/ |
| Expenses [Text Block] | |
| Expenses Paid, Amount | $ 61 |
| Expense Ratio, Percent | 1.24% |
| Performance Past Does Not Indicate Future [Text] | Past performance is not indicative of future performance. |
| No Deduction of Taxes [Text Block] | The table and graph presented above do not reflect the deduction of taxes a shareholder would pay on Fund distributions or the redemption of Fund shares. |
| AssetsNet | $ 1,717,504,548 |
| Holdings Count | Holding | 82 |
| Advisory Fees Paid, Amount | $ 7,427,814 |
| InvestmentCompanyPortfolioTurnover | 28.00% |
| Additional Fund Statistics [Text Block] | |
| Holdings [Text Block] | |
| Largest Holdings [Text Block] | |
| Material Fund Change [Text Block] | |
| Updated Prospectus Phone Number | 1-866-773-3238 |
| Updated Prospectus Web Address | https://cipvt.com/documents/ |
| C000173316 | |
| Shareholder Report [Line Items] | |
| Fund Name | Champlain Small Company Fund |
| Class Name | Institutional Shares |
| Trading Symbol | CIPNX |
| Annual or Semi-Annual Statement [Text Block] | This semi-annual shareholder report contains important information about Institutional Shares of the Champlain Small Company Fund (the "Fund") for the period from January 1, 2025 to June 30, 2025. |
| Shareholder Report Annual or Semi-Annual | Semi-Annual Shareholder Report |
| Additional Information [Text Block] | You can find additional information about the Fund at https://cipvt.com/documents/. You can also request this information by contacting us at 1-866-773-3238. |
| Additional Information Phone Number | 1-866-773-3238 |
| Additional Information Website | https://cipvt.com/documents/ |
| Expenses [Text Block] | |
| Expenses Paid, Amount | $ 49 |
| Expense Ratio, Percent | 0.99% |
| Performance Past Does Not Indicate Future [Text] | Past performance is not indicative of future performance. |
| No Deduction of Taxes [Text Block] | The table and graph presented above do not reflect the deduction of taxes a shareholder would pay on Fund distributions or the redemption of Fund shares. |
| AssetsNet | $ 1,717,504,548 |
| Holdings Count | Holding | 82 |
| Advisory Fees Paid, Amount | $ 7,427,814 |
| InvestmentCompanyPortfolioTurnover | 28.00% |
| Additional Fund Statistics [Text Block] | |
| Holdings [Text Block] | |
| Largest Holdings [Text Block] | |
| Material Fund Change [Text Block] | |
| Updated Prospectus Phone Number | 1-866-773-3238 |
| Updated Prospectus Web Address | https://cipvt.com/documents/ |
| C000065363 | |
| Shareholder Report [Line Items] | |
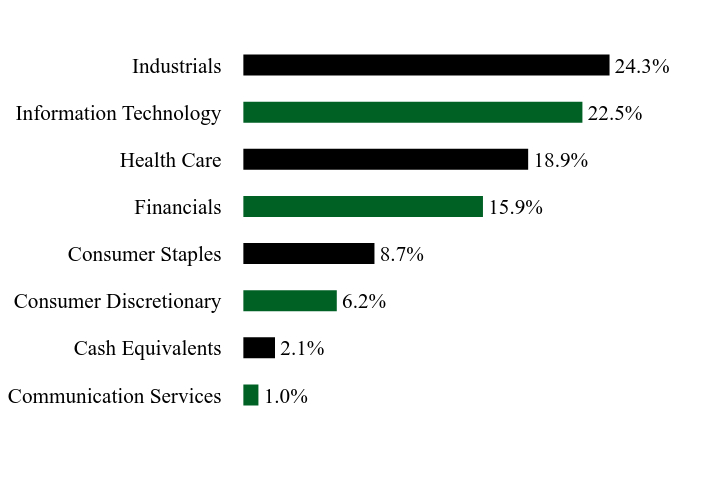
| Fund Name | Champlain Mid Cap Fund |
| Class Name | Advisor Shares |
| Trading Symbol | CIPMX |
| Annual or Semi-Annual Statement [Text Block] | This semi-annual shareholder report contains important information about Advisor Shares of the Champlain Mid Cap Fund (the "Fund") for the period from January 1, 2025 to June 30, 2025. |
| Shareholder Report Annual or Semi-Annual | Semi-Annual Shareholder Report |
| Additional Information [Text Block] | You can find additional information about the Fund at https://cipvt.com/documents/. You can also request this information by contacting us at 1-866-773-3238. |
| Additional Information Phone Number | 1-866-773-3238 |
| Additional Information Website | https://cipvt.com/documents/ |
| Expenses [Text Block] | |
| Expenses Paid, Amount | $ 55 |
| Expense Ratio, Percent | 1.10% |
| Performance Past Does Not Indicate Future [Text] | Past performance is not indicative of future performance. |
| No Deduction of Taxes [Text Block] | The table and graph presented above do not reflect the deduction of taxes a shareholder would pay on Fund distributions or the redemption of Fund shares. |
| AssetsNet | $ 3,926,690,969 |
| Holdings Count | Holding | 73 |
| Advisory Fees Paid, Amount | $ 14,654,708 |
| InvestmentCompanyPortfolioTurnover | 23.00% |
| Additional Fund Statistics [Text Block] | |
| Holdings [Text Block] | |
| Largest Holdings [Text Block] | |
| Material Fund Change [Text Block] | |
| Updated Prospectus Phone Number | 1-866-773-3238 |
| Updated Prospectus Web Address | https://cipvt.com/documents/ |
| C000096284 | |
| Shareholder Report [Line Items] | |
| Fund Name | Champlain Mid Cap Fund |
| Class Name | Institutional Shares |
| Trading Symbol | CIPIX |
| Annual or Semi-Annual Statement [Text Block] | This semi-annual shareholder report contains important information about Institutional Shares of the Champlain Mid Cap Fund (the "Fund") for the period from January 1, 2025 to June 30, 2025. |
| Shareholder Report Annual or Semi-Annual | Semi-Annual Shareholder Report |
| Additional Information [Text Block] | You can find additional information about the Fund at https://cipvt.com/documents/. You can also request this information by contacting us at 1-866-773-3238. |
| Additional Information Phone Number | 1-866-773-3238 |
| Additional Information Website | https://cipvt.com/documents/ |
| Expenses [Text Block] | |
| Expenses Paid, Amount | $ 43 |
| Expense Ratio, Percent | 0.85% |
| Performance Past Does Not Indicate Future [Text] | Past performance is not indicative of future performance. |
| No Deduction of Taxes [Text Block] | The table and graph presented above do not reflect the deduction of taxes a shareholder would pay on Fund distributions or the redemption of Fund shares. |
| AssetsNet | $ 3,926,690,969 |
| Holdings Count | Holding | 73 |
| Advisory Fees Paid, Amount | $ 14,654,708 |
| InvestmentCompanyPortfolioTurnover | 23.00% |
| Additional Fund Statistics [Text Block] | |
| Holdings [Text Block] | |
| Largest Holdings [Text Block] | |
| Material Fund Change [Text Block] | |
| Updated Prospectus Phone Number | 1-866-773-3238 |
| Updated Prospectus Web Address | https://cipvt.com/documents/ |
| C000245657 | |
| Shareholder Report [Line Items] | |
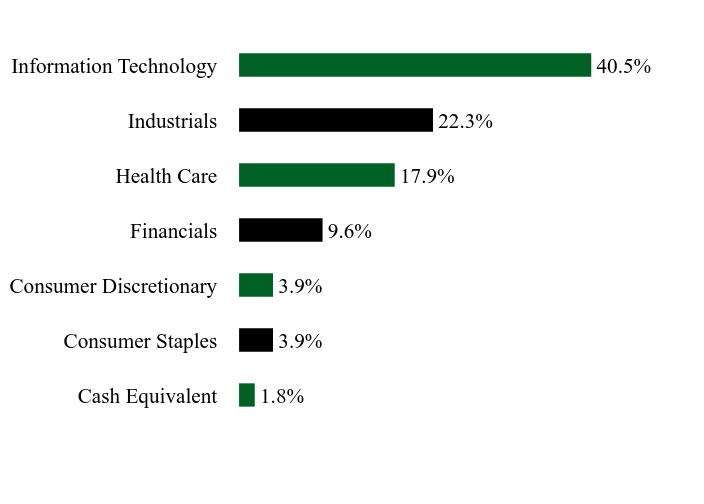
| Fund Name | Champlain Strategic Focus Fund |
| Class Name | Institutional Shares |
| Trading Symbol | CIPTX |
| Annual or Semi-Annual Statement [Text Block] | This semi-annual shareholder report contains important information about Institutional Shares of the Champlain Strategic Focus Fund (the "Fund") for the period from January 1, 2025 to June 30, 2025. |
| Shareholder Report Annual or Semi-Annual | Semi-Annual Shareholder Report |
| Additional Information [Text Block] | You can find additional information about the Fund at https://cipvt.com/documents/. You can also request this information by contacting us at 1-866-773-3238. |
| Additional Information Phone Number | 1-866-773-3238 |
| Additional Information Website | https://cipvt.com/documents/ |
| Expenses [Text Block] | |
| Expenses Paid, Amount | $ 43 |
| Expense Ratio, Percent | 0.85% |
| Performance Past Does Not Indicate Future [Text] | Past performance is not indicative of future performance. |
| No Deduction of Taxes [Text Block] | The table and graph presented above do not reflect the deduction of taxes a shareholder would pay on Fund distributions or the redemption of Fund shares. |
| AssetsNet | $ 4,039,516 |
| Holdings Count | Holding | 28 |
| Advisory Fees Paid, Amount | $ 0 |
| InvestmentCompanyPortfolioTurnover | 21.00% |
| Additional Fund Statistics [Text Block] | |
| Holdings [Text Block] | |
| Largest Holdings [Text Block] | |
| Material Fund Change [Text Block] | |
| Updated Prospectus Phone Number | 1-866-773-3238 |
| Updated Prospectus Web Address | https://cipvt.com/documents/ |