Performance Management - Strategy Shares Nasdaq 7 HANDL(TM) Index ETF
|
Sep. 03, 2025 |
| Prospectus [Line Items] |
|
| Bar Chart and Performance Table [Heading] |
Performance:
|
| Performance Narrative [Text Block] |
The
bar chart and accompanying table shown below provide an indication of the risks of investing in the Fund by showing the total return
of its shares for each full calendar year, and by showing how its average annual returns compare over time with those of the Nasdaq 7HANDLTM
Index, as well as a broad-based market index reflecting the performance of investment grade fixed income securities. How the Fund
has performed in the past (before and after taxes) is not necessarily an indication of how it will perform in the future. Updated performance
information is available at no cost at www.strategysharesetfs.com or by calling (855) 4SS-ETFS or (855) 477-3837.
|
| Performance Past Does Not Indicate Future [Text] |
How the Fund
has performed in the past (before and after taxes) is not necessarily an indication of how it will perform in the future.
|
| Performance Information Illustrates Variability of Returns [Text] |
The
bar chart and accompanying table shown below provide an indication of the risks of investing in the Fund by showing the total return
of its shares for each full calendar year, and by showing how its average annual returns compare over time with those of the Nasdaq 7HANDLTM
Index, as well as a broad-based market index reflecting the performance of investment grade fixed income securities.
|
| Bar Chart [Heading] |
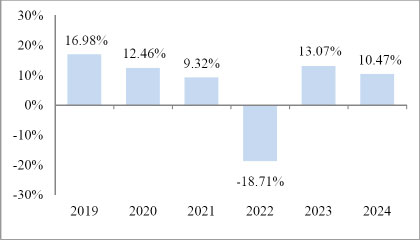
Annual
Total Returns
|
| Bar Chart [Table] |
| |
2019 |
2020 |
2021 |
2022 |
2023 |
2024 |
| |
16.98% |
12.46% |
9.32% |
-18.71% |
13.07% |
10.47% |
|
| Bar Chart Closing [Text Block] |
During
the period shown in the bar chart, the highest return for a quarter was 11.49% (quarter ended June 30,
2020), and the lowest return for a quarter was (12.60)% (quarter ended June
30, 2022).
The
Fund’s year-to-date return as of June 30, 2025 was 5.12%.
|
| Year to Date Return, Label [Optional Text] |
The
Fund’s year-to-date return
|
| Bar Chart, Year to Date Return |
5.12%
|
| Bar Chart, Year to Date Return, Date |
Jun. 30, 2025
|
| Highest Quarterly Return, Label [Optional Text] |
the highest return for a quarter
|
| Highest Quarterly Return |
11.49%
|
| Highest Quarterly Return, Date |
Jun. 30, 2020
|
| Lowest Quarterly Return, Label [Optional Text] |
the lowest return for a quarter
|
| Lowest Quarterly Return |
(12.60%)
|
| Lowest Quarterly Return, Date |
Jun. 30, 2022
|
| Performance Table Heading |
Average
Annual Total Returns
(for
the periods ended December 31, 2024)
|
| Performance [Table] |
| |
1
Year |
5
Years |
Since
Inception
(January 16, 2018) |
| Return
Before Taxes |
10.47% |
4.54% |
4.85% |
| Return
After Taxes on Distributions |
8.42% |
2.68% |
3.12% |
| Return
After Taxes on Distributions and Sale of Fund Shares |
6.37% |
2.71% |
3.02% |
| Nasdaq
7HANDLTM Index (reflects no deduction for fees, expenses or taxes) |
11.72% |
5.99% |
6.29% |
| Bloomberg
U.S. Aggregate Bond Index (reflects no deduction for fees, expenses or taxes) |
1.25% |
(0.33)% |
1.04% |
|
| Index No Deduction for Fees, Expenses, or Taxes [Text] |
reflects no deduction for fees, expenses or taxes
|
| Performance Availability Website Address [Text] |
www.strategysharesetfs.com
|
| Performance Availability Phone [Text] |
(855) 4SS-ETFS or (855) 477-3837
|