Shareholder Report
|
12 Months Ended |
|
Jun. 30, 2025
USD ($)
Holding
|
|---|
| Shareholder Report [Line Items] |
|
|
| Document Type |
N-CSR
|
|
| Amendment Flag |
false
|
|
| Registrant Name |
Victory Portfolios II
|
|
| Entity Central Index Key |
0001547580
|
|
| Entity Investment Company Type |
N-1A
|
|
| Document Period End Date |
Jun. 30, 2025
|
|
| C000116490 |
|
|
| Shareholder Report [Line Items] |
|
|
| Fund Name |
Victory Market Neutral Income Fund
|
|
| Class Name |
Class A
|
|
| Trading Symbol |
CBHAX
|
|
| Annual or Semi-Annual Statement [Text Block] |
Annual Shareholder Report
|
|
| Shareholder Report Annual or Semi-Annual |
annual shareholder report
|
|
| Additional Information [Text Block] |
You can find additional information about the Fund at advisor.vcm.com/literature/mutual-fund-prospectuses. You may also request more information by calling 800-539-3863 or visiting vcm.com/contact-us.
|
|
| Additional Information Phone Number |
800-539-3863
|
|
| Additional Information Website |
vcm.com
|
|
| Expenses [Text Block] |
What were the Fund's costs for the last year?(based on a hypothetical $10,000 investment) Class Name | Costs of a $10,000 Investment | Costs paid as a percentage of a $10,000 Investment |
|---|
Class A | $79 | 0.76% |
|---|
| | |
|---|
|
|
| Expenses Paid, Amount |
$ 79
|
|
| Expense Ratio, Percent |
0.76%
|
|
| Factors Affecting Performance [Text Block] |
What affected the Fund’s performance during the last year?Top contributors to performance: During the reporting period, the Fund’s total return was driven by positive contribution from the Fund’s Global High Dividend Long/Short portfolio (long global dividend stocks and short equity index futures). In the Global High Dividend Long/Short portfolio, the U.S. Large-Cap, U.S. Small-Cap, International Markets, and Emerging Markets dividend sleeves were positive contributors. The negative contribution from shorting core broad market indexes was offset by the positive contribution of the long positions in dividend stocks.
Top detractors from performance: In the Overlay Strategy, gains from the NASDAQ 100 long futures did not offset the negative contribution from the S&P 500 Index short position, resulting in an overall negative impact on the Fund’s total return.
In addition, the Fund's employment of a derivatives strategy overlay to efficiently manage the overall portfolio risks associated with the Fund's strategy contributed negatively to performance during the year. |
|
| Performance Past Does Not Indicate Future [Text] |
The investment return and principal value will fluctuate so that an investor's shares, when redeemed, may be worth more or less than the original cost. Past performance is not a good predictor of the Fund's future performance.
|
|
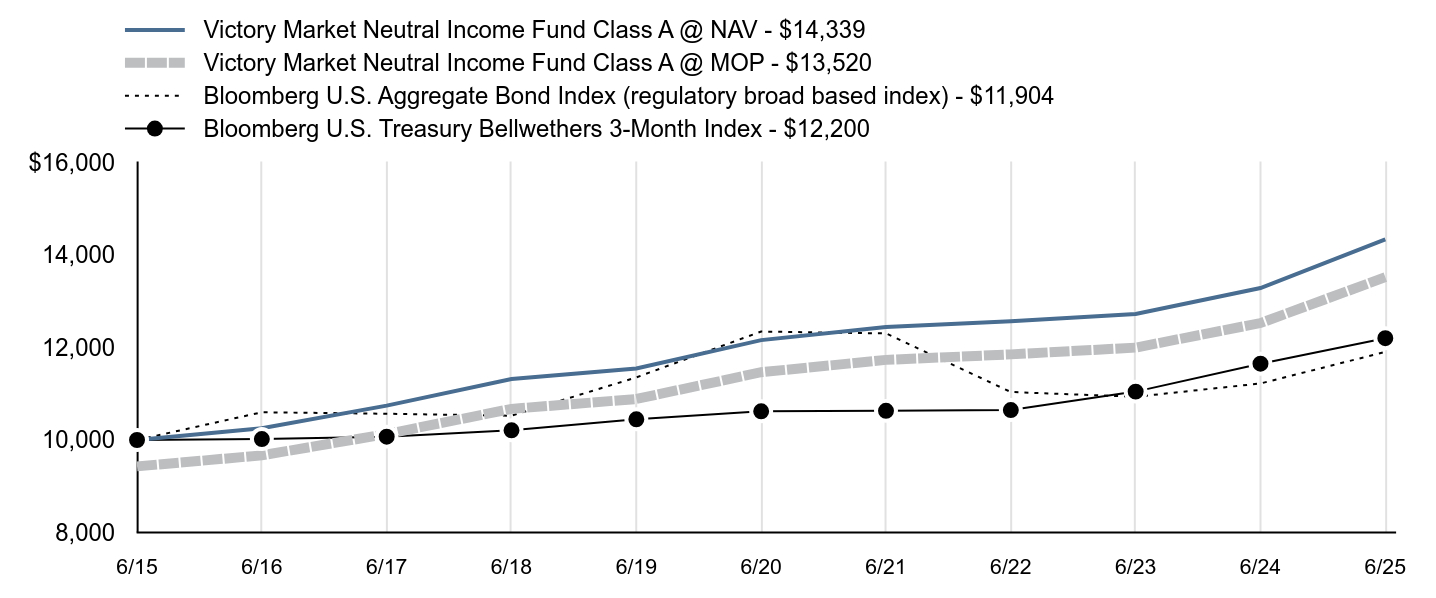
| Line Graph [Table Text Block] |
| Victory Market Neutral Income Fund Class A @ NAV - $14,339 | Victory Market Neutral Income Fund Class A @ MOP - $13,520 | Bloomberg U.S. Aggregate Bond Index (regulatory broad based index) - $11,904 | Bloomberg U.S. Treasury Bellwethers 3-Month Index - $12,200 |
|---|
6/15 | $10,000 | $9,429 | $10,000 | $10,000 |
|---|
6/16 | $10,254 | $9,668 | $10,600 | $10,021 |
|---|
6/17 | $10,743 | $10,129 | $10,567 | $10,072 |
|---|
6/18 | $11,320 | $10,673 | $10,525 | $10,210 |
|---|
6/19 | $11,546 | $10,886 | $11,353 | $10,448 |
|---|
6/20 | $12,159 | $11,465 | $12,345 | $10,620 |
|---|
6/21 | $12,443 | $11,732 | $12,304 | $10,630 |
|---|
6/22 | $12,569 | $11,851 | $11,038 | $10,648 |
|---|
6/23 | $12,723 | $11,997 | $10,934 | $11,046 |
|---|
6/24 | $13,286 | $12,528 | $11,222 | $11,650 |
|---|
6/25 | $14,339 | $13,520 | $11,904 | $12,200 |
|---|
|
|
| Average Annual Return [Table Text Block] |
| 1 Year | 5 Year | 10 Year |
|---|
Class A @ NAV | 7.92% | 3.35% | 3.67% |
|---|
Class A @ MOP | 1.75% | 2.13% | 3.06% |
|---|
Bloomberg U.S. Aggregate Bond Index | 6.08% | -0.73% | 1.76% |
|---|
Bloomberg U.S. Treasury Bellwethers 3-Month Index | 4.73% | 2.81% | 2.01% |
|---|
|
|
| No Deduction of Taxes [Text Block] |
The graph and table total returns do not reflect the deduction of taxes that a shareholder would pay on Fund distributions, or redemption of shares.
|
|
| Previous Investment Adviser [Text Block] |
The maximum offering price (“MOP”) figures reflect a maximum sales charge of 5.75% for Class A. The Net Asset Value ("NAV") figures do not reflect sales charges.
|
|
| AssetsNet |
$ 2,620,750,000
|
|
| Holdings Count | Holding |
421
|
|
| Advisory Fees Paid, Amount |
$ 9,273,000
|
|
| InvestmentCompanyPortfolioTurnover |
60.00%
|
|
| Additional Fund Statistics [Text Block] |
FUND STATISTICS($ amounts in 000s)(as of June 30, 2025)Net Assets | $2,620,750 |
|---|
Number of Holdings | 421 |
|---|
Investment Advisory Fees | $9,273 |
|---|
Portfolio Turnover | 60% |
|---|
|
|
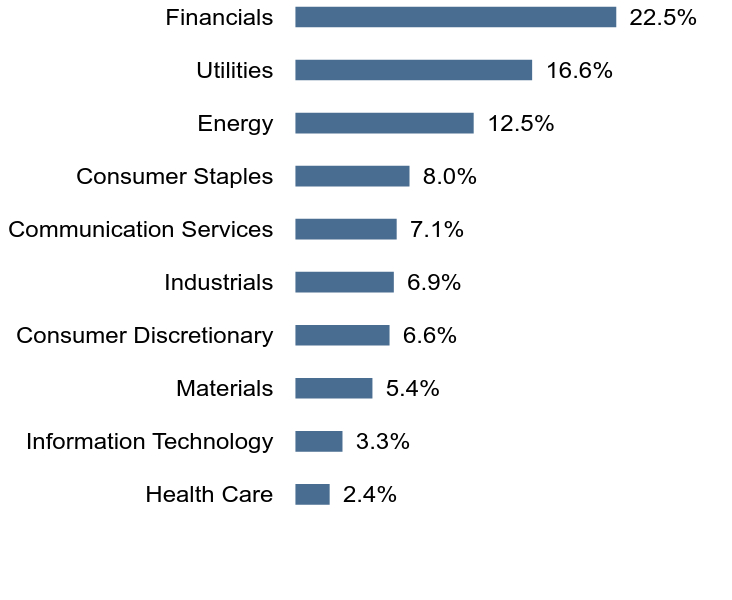
| Holdings [Text Block] |
Top SectorsFootnote Reference* (% of Net Assets)Footnote Reference(as of June 30, 2025)Value | Value |
|---|
Health Care | 2.4% | Information Technology | 3.3% | Materials | 5.4% | Consumer Discretionary | 6.6% | Industrials | 6.9% | Communication Services | 7.1% | Consumer Staples | 8.0% | Energy | 12.5% | Utilities | 16.6% | Financials | 22.5% |
Top 10 HoldingsFootnote Reference* (% of Net Assets)Footnote Reference(as of June 30, 2025)Taiwan Mobile Co. Ltd. | 0.6% |
|---|
Tenaga Nasional Bhd | 0.5% |
|---|
SCB X PCL | 0.5% |
|---|
Ambev SA | 0.5% |
|---|
BB Seguridade Participacoes SA | 0.5% |
|---|
Spire, Inc. | 0.4% |
|---|
CME Group, Inc. | 0.4% |
|---|
ORLEN SA | 0.4% |
|---|
Orange SA | 0.4% |
|---|
Portland General Electric Co. | 0.4% |
|---|
|
|
| Material Fund Change [Text Block] |
|
|
| C000116492 |
|
|
| Shareholder Report [Line Items] |
|
|
| Fund Name |
Victory Market Neutral Income Fund
|
|
| Class Name |
Class C
|
|
| Trading Symbol |
CBHCX
|
|
| Annual or Semi-Annual Statement [Text Block] |
Annual Shareholder Report
|
|
| Shareholder Report Annual or Semi-Annual |
annual shareholder report
|
|
| Additional Information [Text Block] |
You can find additional information about the Fund at advisor.vcm.com/literature/mutual-fund-prospectuses. You may also request more information by calling 800-539-3863 or visiting vcm.com/contact-us.
|
|
| Additional Information Phone Number |
800-539-3863
|
|
| Additional Information Website |
vcm.com
|
|
| Expenses [Text Block] |
What were the Fund's costs for the last year?(based on a hypothetical $10,000 investment) Class Name | Costs of a $10,000 Investment | Costs paid as a percentage of a $10,000 Investment |
|---|
Class C | $156 | 1.51% |
|---|
| | |
|---|
|
|
| Expenses Paid, Amount |
$ 156
|
|
| Expense Ratio, Percent |
1.51%
|
|
| Factors Affecting Performance [Text Block] |
What affected the Fund’s performance during the last year?Top contributors to performance: During the reporting period, the Fund’s total return was driven by positive contribution from the Fund’s Global High Dividend Long/Short portfolio (long global dividend stocks and short equity index futures). In the Global High Dividend Long/Short portfolio, the U.S. Large-Cap, U.S. Small-Cap, International Markets, and Emerging Markets dividend sleeves were positive contributors. The negative contribution from shorting core broad market indexes was offset by the positive contribution of the long positions in dividend stocks.
Top detractors from performance: In the Overlay Strategy, gains from the NASDAQ 100 long futures did not offset the negative contribution from the S&P 500 Index short position, resulting in an overall negative impact on the Fund’s total return.
In addition, the Fund's employment of a derivatives strategy overlay to efficiently manage the overall portfolio risks associated with the Fund's strategy contributed negatively to performance during the year. |
|
| Performance Past Does Not Indicate Future [Text] |
The investment return and principal value will fluctuate so that an investor's shares, when redeemed, may be worth more or less than the original cost. Past performance is not a good predictor of the Fund's future performance.
|
|
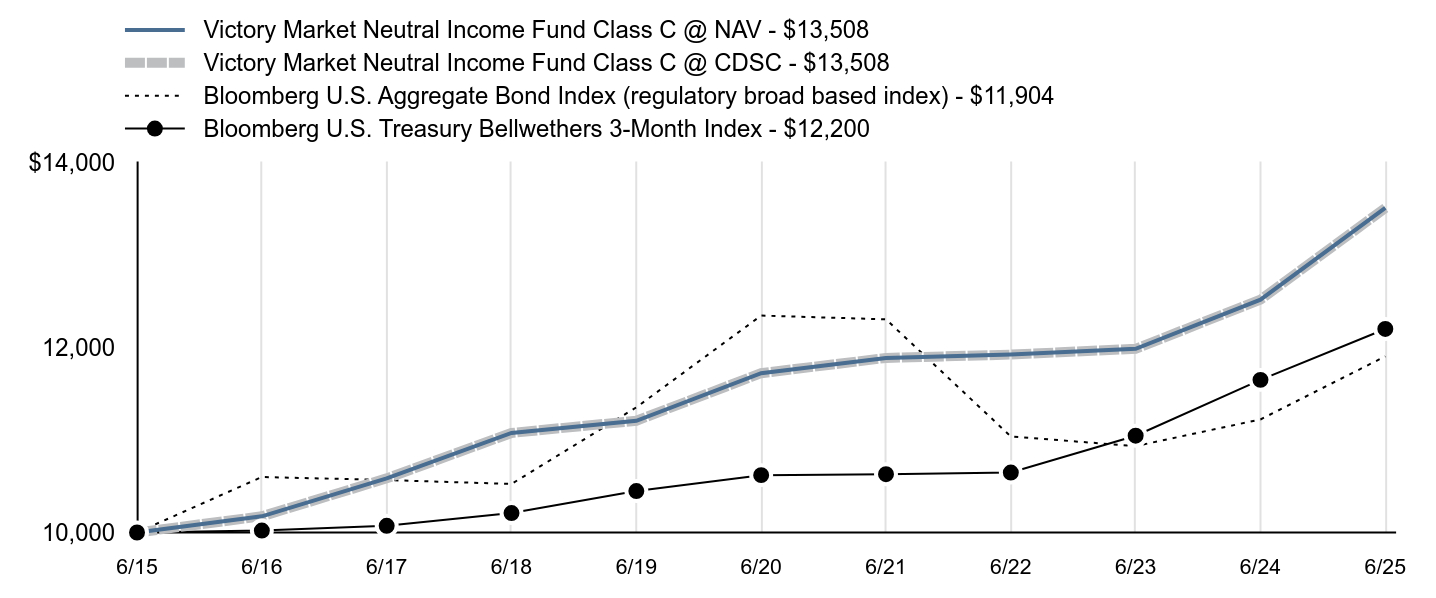
| Line Graph [Table Text Block] |
| Victory Market Neutral Income Fund Class C @ NAV - $13,508 | Victory Market Neutral Income Fund Class C @ CDSC - $13,508 | Bloomberg U.S. Aggregate Bond Index (regulatory broad based index) - $11,904 | Bloomberg U.S. Treasury Bellwethers 3-Month Index - $12,200 |
|---|
6/15 | $10,000 | $10,000 | $10,000 | $10,000 |
|---|
6/16 | $10,175 | $10,175 | $10,600 | $10,021 |
|---|
6/17 | $10,585 | $10,585 | $10,567 | $10,072 |
|---|
6/18 | $11,076 | $11,076 | $10,525 | $10,210 |
|---|
6/19 | $11,208 | $11,208 | $11,353 | $10,448 |
|---|
6/20 | $11,722 | $11,722 | $12,345 | $10,620 |
|---|
6/21 | $11,887 | $11,887 | $12,304 | $10,630 |
|---|
6/22 | $11,923 | $11,923 | $11,038 | $10,648 |
|---|
6/23 | $11,986 | $11,986 | $10,934 | $11,046 |
|---|
6/24 | $12,517 | $12,517 | $11,222 | $11,650 |
|---|
6/25 | $13,508 | $13,508 | $11,904 | $12,200 |
|---|
|
|
| Average Annual Return [Table Text Block] |
| 1 Year | 5 Year | 10 Year |
|---|
Class C @ NAV | 7.16% | 2.57% | 3.05% |
|---|
Class C @ CDSC | 6.16% | 2.57% | 3.05% |
|---|
Bloomberg U.S. Aggregate Bond Index | 6.08% | -0.73% | 1.76% |
|---|
Bloomberg U.S. Treasury Bellwethers 3-Month Index | 4.73% | 2.81% | 2.01% |
|---|
|
|
| No Deduction of Taxes [Text Block] |
The graph and table total returns do not reflect the deduction of taxes that a shareholder would pay on Fund distributions, or redemption of shares.
|
|
| Previous Investment Adviser [Text Block] |
Class C is not subject to an initial sales charge, but is subject to Contingent Deferred Sales Charge (“CDSC”) of 1.00% on shares redeemed within one year of purchase. The Net Asset Value ("NAV") figures do not reflect sales charges.
|
|
| AssetsNet |
$ 2,620,750,000
|
|
| Holdings Count | Holding |
421
|
|
| Advisory Fees Paid, Amount |
$ 9,273,000
|
|
| InvestmentCompanyPortfolioTurnover |
60.00%
|
|
| Additional Fund Statistics [Text Block] |
FUND STATISTICS($ amounts in 000s)(as of June 30, 2025)Net Assets | $2,620,750 |
|---|
Number of Holdings | 421 |
|---|
Investment Advisory Fees | $9,273 |
|---|
Portfolio Turnover | 60% |
|---|
|
|
| Holdings [Text Block] |
Top SectorsFootnote Reference* (% of Net Assets)Footnote Reference(as of June 30, 2025)Value | Value |
|---|
Health Care | 2.4% | Information Technology | 3.3% | Materials | 5.4% | Consumer Discretionary | 6.6% | Industrials | 6.9% | Communication Services | 7.1% | Consumer Staples | 8.0% | Energy | 12.5% | Utilities | 16.6% | Financials | 22.5% |
Top 10 HoldingsFootnote Reference* (% of Net Assets)Footnote Reference(as of June 30, 2025)Taiwan Mobile Co. Ltd. | 0.6% |
|---|
Tenaga Nasional Bhd | 0.5% |
|---|
SCB X PCL | 0.5% |
|---|
Ambev SA | 0.5% |
|---|
BB Seguridade Participacoes SA | 0.5% |
|---|
Spire, Inc. | 0.4% |
|---|
CME Group, Inc. | 0.4% |
|---|
ORLEN SA | 0.4% |
|---|
Orange SA | 0.4% |
|---|
Portland General Electric Co. | 0.4% |
|---|
|
|
| Material Fund Change [Text Block] |
|
|
| C000116493 |
|
|
| Shareholder Report [Line Items] |
|
|
| Fund Name |
Victory Market Neutral Income Fund
|
|
| Class Name |
Class I
|
|
| Trading Symbol |
CBHIX
|
|
| Annual or Semi-Annual Statement [Text Block] |
Annual Shareholder Report
|
|
| Shareholder Report Annual or Semi-Annual |
annual shareholder report
|
|
| Additional Information [Text Block] |
You can find additional information about the Fund at advisor.vcm.com/literature/mutual-fund-prospectuses. You may also request more information by calling 800-539-3863 or visiting vcm.com/contact-us.
|
|
| Additional Information Phone Number |
800-539-3863
|
|
| Additional Information Website |
vcm.com
|
|
| Expenses [Text Block] |
What were the Fund's costs for the last year?(based on a hypothetical $10,000 investment) Class Name | Costs of a $10,000 Investment | Costs paid as a percentage of a $10,000 Investment |
|---|
Class I | $43 | 0.41% |
|---|
| | |
|---|
|
|
| Expenses Paid, Amount |
$ 43
|
|
| Expense Ratio, Percent |
0.41%
|
|
| Factors Affecting Performance [Text Block] |
What affected the Fund’s performance during the last year?Top contributors to performance: During the reporting period, the Fund’s total return was driven by positive contribution from the Fund’s Global High Dividend Long/Short portfolio (long global dividend stocks and short equity index futures). In the Global High Dividend Long/Short portfolio, the U.S. Large-Cap, U.S. Small-Cap, International Markets, and Emerging Markets dividend sleeves were positive contributors. The negative contribution from shorting core broad market indexes was offset by the positive contribution of the long positions in dividend stocks.
Top detractors from performance: In the Overlay Strategy, gains from the NASDAQ 100 long futures did not offset the negative contribution from the S&P 500 Index short position, resulting in an overall negative impact on the Fund’s total return.
In addition, the Fund's employment of a derivatives strategy overlay to efficiently manage the overall portfolio risks associated with the Fund's strategy contributed negatively to performance during the year. |
|
| Performance Past Does Not Indicate Future [Text] |
The investment return and principal value will fluctuate so that an investor's shares, when redeemed, may be worth more or less than the original cost. Past performance is not a good predictor of the Fund's future performance.
|
|
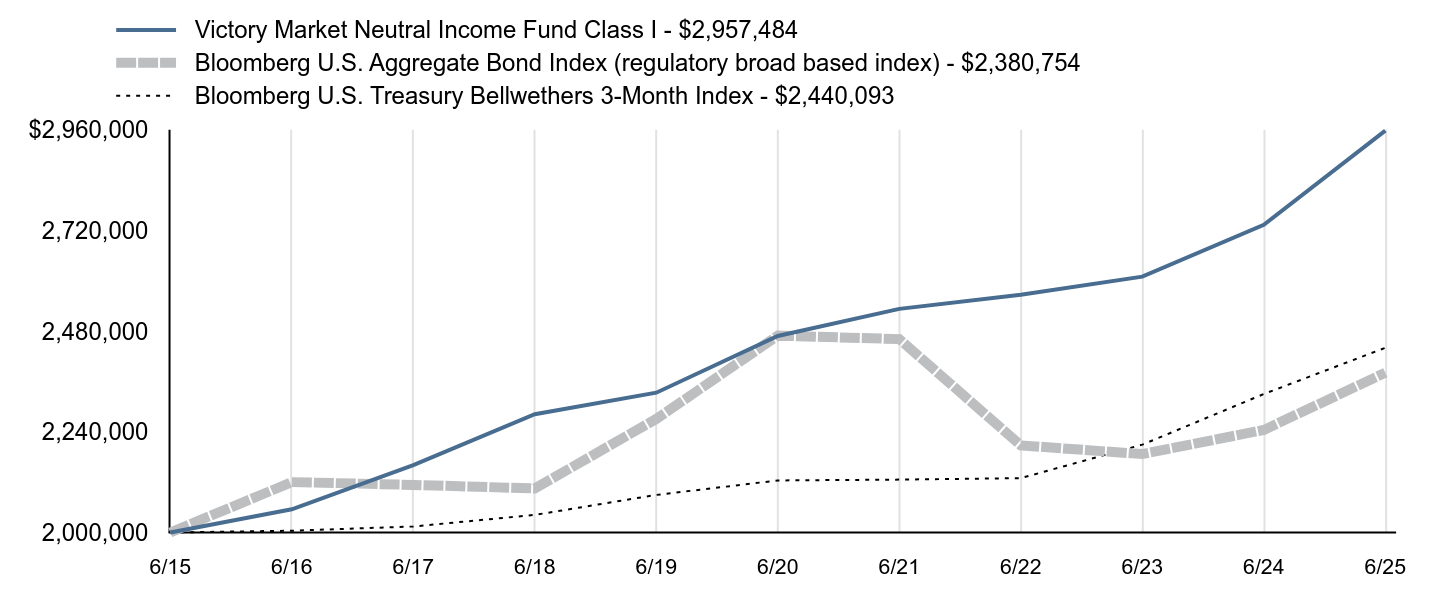
| Line Graph [Table Text Block] |
| Victory Market Neutral Income Fund Class I - $2,957,484 | Bloomberg U.S. Aggregate Bond Index (regulatory broad based index) - $2,380,754 | Bloomberg U.S. Treasury Bellwethers 3-Month Index - $2,440,093 |
|---|
6/15 | $2,000,000 | $2,000,000 | $2,000,000 |
|---|
6/16 | $2,055,344 | $2,120,028 | $2,004,270 |
|---|
6/17 | $2,160,337 | $2,113,357 | $2,014,302 |
|---|
6/18 | $2,281,685 | $2,104,962 | $2,041,939 |
|---|
6/19 | $2,333,100 | $2,270,606 | $2,089,517 |
|---|
6/20 | $2,468,225 | $2,469,049 | $2,124,003 |
|---|
6/21 | $2,532,871 | $2,460,821 | $2,126,017 |
|---|
6/22 | $2,566,346 | $2,207,550 | $2,129,522 |
|---|
6/23 | $2,609,543 | $2,186,848 | $2,209,290 |
|---|
6/24 | $2,733,304 | $2,244,384 | $2,329,949 |
|---|
6/25 | $2,957,484 | $2,380,754 | $2,440,093 |
|---|
|
|
| Average Annual Return [Table Text Block] |
| 1 Year | 5 Year | 10 Year |
|---|
Class I | 8.20% | 3.68% | 3.99% |
|---|
Bloomberg U.S. Aggregate Bond Index | 6.08% | -0.73% | 1.76% |
|---|
Bloomberg U.S. Treasury Bellwethers 3-Month Index | 4.73% | 2.81% | 2.01% |
|---|
|
|
| No Deduction of Taxes [Text Block] |
The graph and table total returns do not reflect the deduction of taxes that a shareholder would pay on Fund distributions, or redemption of shares.
|
|
| AssetsNet |
$ 2,620,750,000
|
|
| Holdings Count | Holding |
421
|
|
| Advisory Fees Paid, Amount |
$ 9,273,000
|
|
| InvestmentCompanyPortfolioTurnover |
60.00%
|
|
| Additional Fund Statistics [Text Block] |
FUND STATISTICS($ amounts in 000s)(as of June 30, 2025)Net Assets | $2,620,750 |
|---|
Number of Holdings | 421 |
|---|
Investment Advisory Fees | $9,273 |
|---|
Portfolio Turnover | 60% |
|---|
|
|
| Holdings [Text Block] |
Top SectorsFootnote Reference* (% of Net Assets)Footnote Reference(as of June 30, 2025)Value | Value |
|---|
Health Care | 2.4% | Information Technology | 3.3% | Materials | 5.4% | Consumer Discretionary | 6.6% | Industrials | 6.9% | Communication Services | 7.1% | Consumer Staples | 8.0% | Energy | 12.5% | Utilities | 16.6% | Financials | 22.5% |
Top 10 HoldingsFootnote Reference* (% of Net Assets)Footnote Reference(as of June 30, 2025)Taiwan Mobile Co. Ltd. | 0.6% |
|---|
Tenaga Nasional Bhd | 0.5% |
|---|
SCB X PCL | 0.5% |
|---|
Ambev SA | 0.5% |
|---|
BB Seguridade Participacoes SA | 0.5% |
|---|
Spire, Inc. | 0.4% |
|---|
CME Group, Inc. | 0.4% |
|---|
ORLEN SA | 0.4% |
|---|
Orange SA | 0.4% |
|---|
Portland General Electric Co. | 0.4% |
|---|
|
|
| Material Fund Change [Text Block] |
|
|
| C000219860 |
|
|
| Shareholder Report [Line Items] |
|
|
| Fund Name |
Victory Market Neutral Income Fund
|
|
| Class Name |
Member Class
|
|
| Trading Symbol |
CBHMX
|
|
| Annual or Semi-Annual Statement [Text Block] |
Annual Shareholder Report
|
|
| Shareholder Report Annual or Semi-Annual |
annual shareholder report
|
|
| Additional Information [Text Block] |
You can find additional information about the Fund at advisor.vcm.com/literature/mutual-fund-prospectuses. You may also request more information by calling 800-235-8396 or visiting vcm.com/contact-us.
|
|
| Additional Information Phone Number |
800-235-8396
|
|
| Additional Information Website |
vcm.com
|
|
| Expenses [Text Block] |
What were the Fund's costs for the last year?(based on a hypothetical $10,000 investment) Class Name | Costs of a $10,000 Investment | Costs paid as a percentage of a $10,000 Investment |
|---|
Member Class | $58 | 0.56% |
|---|
| | |
|---|
|
|
| Expenses Paid, Amount |
$ 58
|
|
| Expense Ratio, Percent |
0.56%
|
|
| Factors Affecting Performance [Text Block] |
What affected the Fund’s performance during the last year?Top contributors to performance: During the reporting period, the Fund’s total return was driven by positive contribution from the Fund’s Global High Dividend Long/Short portfolio (long global dividend stocks and short equity index futures). In the Global High Dividend Long/Short portfolio, the U.S. Large-Cap, U.S. Small-Cap, International Markets, and Emerging Markets dividend sleeves were positive contributors. The negative contribution from shorting core broad market indexes was offset by the positive contribution of the long positions in dividend stocks.
Top detractors from performance: In the Overlay Strategy, gains from the NASDAQ 100 long futures did not offset the negative contribution from the S&P 500 Index short position, resulting in an overall negative impact on the Fund’s total return.
In addition, the Fund's employment of a derivatives strategy overlay to efficiently manage the overall portfolio risks associated with the Fund's strategy contributed negatively to performance during the year. |
|
| Performance Past Does Not Indicate Future [Text] |
The investment return and principal value will fluctuate so that an investor's shares, when redeemed, may be worth more or less than the original cost. Past performance is not a good predictor of the Fund's future performance.
|
|
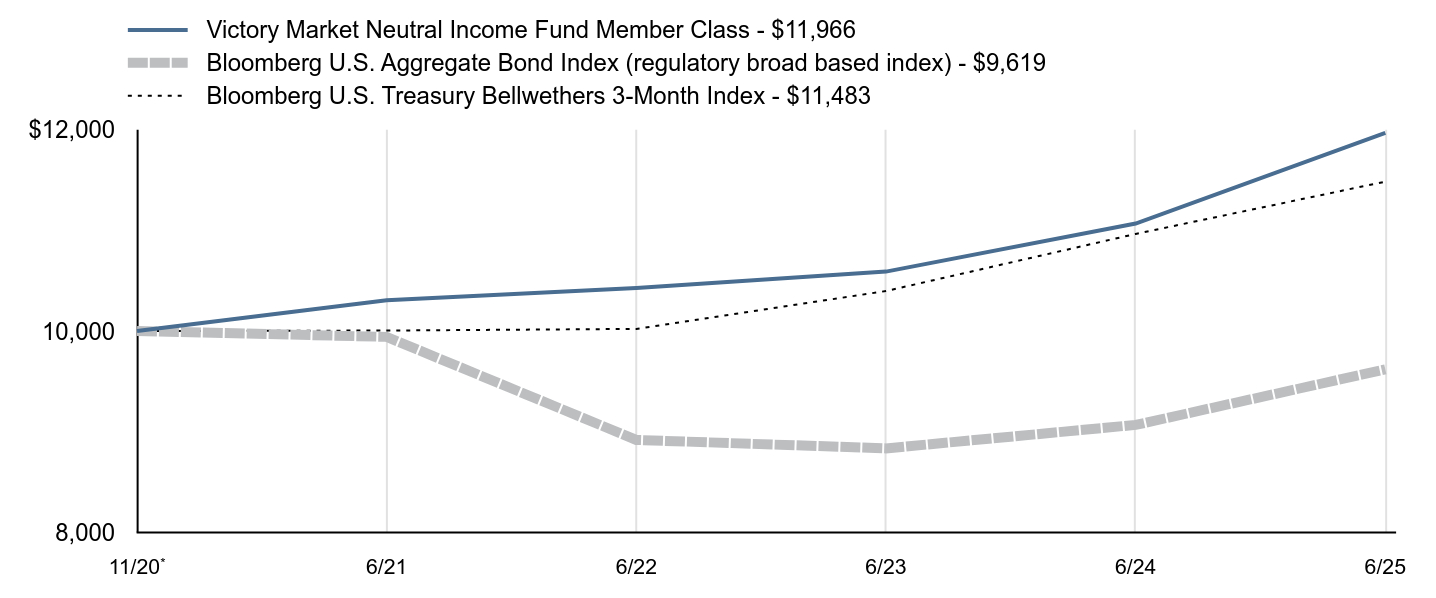
| Line Graph [Table Text Block] |
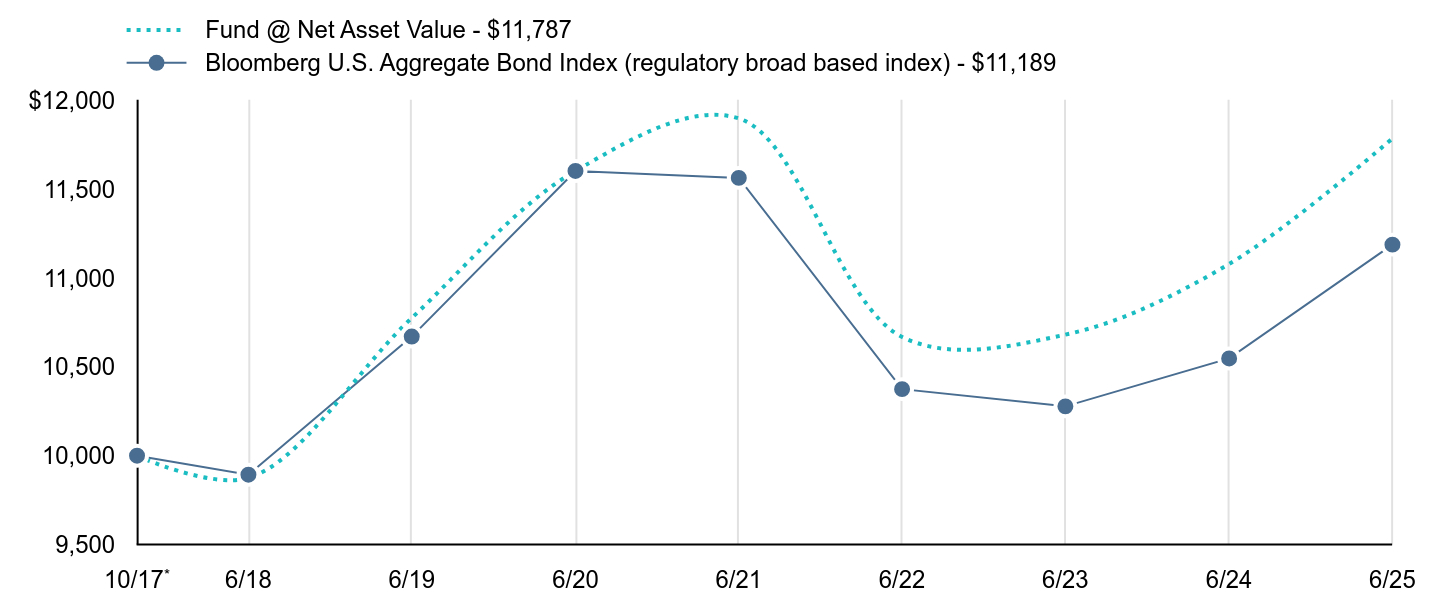
| Victory Market Neutral Income Fund Member Class - $11,966 | Bloomberg U.S. Aggregate Bond Index (regulatory broad based index) - $9,619 | Bloomberg U.S. Treasury Bellwethers 3-Month Index - $11,483 |
|---|
11/20Footnote Reference* | $10,000 | $10,000 | $10,000 |
|---|
6/21 | $10,305 | $9,942 | $10,005 |
|---|
6/22 | $10,428 | $8,919 | $10,021 |
|---|
6/23 | $10,590 | $8,835 | $10,397 |
|---|
6/24 | $11,067 | $9,068 | $10,964 |
|---|
6/25 | $11,966 | $9,619 | $11,483 |
|---|
|
|
| Average Annual Return [Table Text Block] |
| 1 Year | Since Inception |
|---|
Member Class | 8.12% | 3.93% |
|---|
Bloomberg U.S. Aggregate Bond Index | 6.08% | -0.83% |
|---|
Bloomberg U.S. Treasury Bellwethers 3-Month Index | 4.73% | 3.01% |
|---|
|
|
| No Deduction of Taxes [Text Block] |
The graph and table total returns do not reflect the deduction of taxes that a shareholder would pay on Fund distributions, or redemption of shares.
|
|
| AssetsNet |
$ 2,620,750,000
|
|
| Holdings Count | Holding |
421
|
|
| Advisory Fees Paid, Amount |
$ 9,273,000
|
|
| InvestmentCompanyPortfolioTurnover |
60.00%
|
|
| Additional Fund Statistics [Text Block] |
FUND STATISTICS($ amounts in 000s)(as of June 30, 2025)Net Assets | $2,620,750 |
|---|
Number of Holdings | 421 |
|---|
Investment Advisory Fees | $9,273 |
|---|
Portfolio Turnover | 60% |
|---|
|
|
| Holdings [Text Block] |
Top SectorsFootnote Reference* (% of Net Assets)Footnote Reference(as of June 30, 2025)Value | Value |
|---|
Health Care | 2.4% | Information Technology | 3.3% | Materials | 5.4% | Consumer Discretionary | 6.6% | Industrials | 6.9% | Communication Services | 7.1% | Consumer Staples | 8.0% | Energy | 12.5% | Utilities | 16.6% | Financials | 22.5% |
Top 10 HoldingsFootnote Reference* (% of Net Assets)Footnote Reference(as of June 30, 2025)Taiwan Mobile Co. Ltd. | 0.6% |
|---|
Tenaga Nasional Bhd | 0.5% |
|---|
SCB X PCL | 0.5% |
|---|
Ambev SA | 0.5% |
|---|
BB Seguridade Participacoes SA | 0.5% |
|---|
Spire, Inc. | 0.4% |
|---|
CME Group, Inc. | 0.4% |
|---|
ORLEN SA | 0.4% |
|---|
Orange SA | 0.4% |
|---|
Portland General Electric Co. | 0.4% |
|---|
|
|
| Material Fund Change [Text Block] |
|
|
| C000139051 |
|
|
| Shareholder Report [Line Items] |
|
|
| Fund Name |
VictoryShares US 500 Volatility Wtd ETF
|
|
| No Trading Symbol [Flag] |
true
|
|
| Annual or Semi-Annual Statement [Text Block] |
Annual Shareholder Report
|
|
| Shareholder Report Annual or Semi-Annual |
annual shareholder report
|
|
| Additional Information [Text Block] |
You can find additional information about the Fund at advisor.vcm.com/literature/etf-prospectuses. You may also request more information by calling 866-376-7890 or visiting vcm.com/contact-us.
This report describes changes to the Fund that occurred during the period.
|
|
| Additional Information Phone Number |
866-376-7890
|
|
| Additional Information Website |
vcm.com
|
|
| Expenses [Text Block] |
What were the Fund's costs for the last year?(based on a hypothetical $10,000 investment) Fund Name | Costs of a $10,000 Investment | Costs paid as a percentage of a $10,000 Investment |
|---|
US 500 Volatility Wtd ETF | $37 | 0.35% |
|---|
| | |
|---|
|
|
| Expenses Paid, Amount |
$ 37
|
|
| Expense Ratio, Percent |
0.35%
|
|
| Factors Affecting Performance [Text Block] |
What affected the Fund’s performance during the last year?Top contributors to performance: The Fund’s overweight allocation to the industrials sector contributed positively to relative performance; and Stock selection in the health care and consumer discretionary sectors was a positive contributor to relative performance.
Top detractors from performance: The Fund’s underweight allocation to the information technology and communication services sectors detracted from relative performance; and Stock selection in the industrials and financials sectors detracted from performance.
The Fund had a small allocation to derivatives during the period that did not have a material impact on performance. |
|
| Performance Past Does Not Indicate Future [Text] |
The investment return and principal value will fluctuate so that an investor's shares, when redeemed, may be worth more or less than the original cost. Past performance is not a good predictor of the Fund's future performance.
|
|
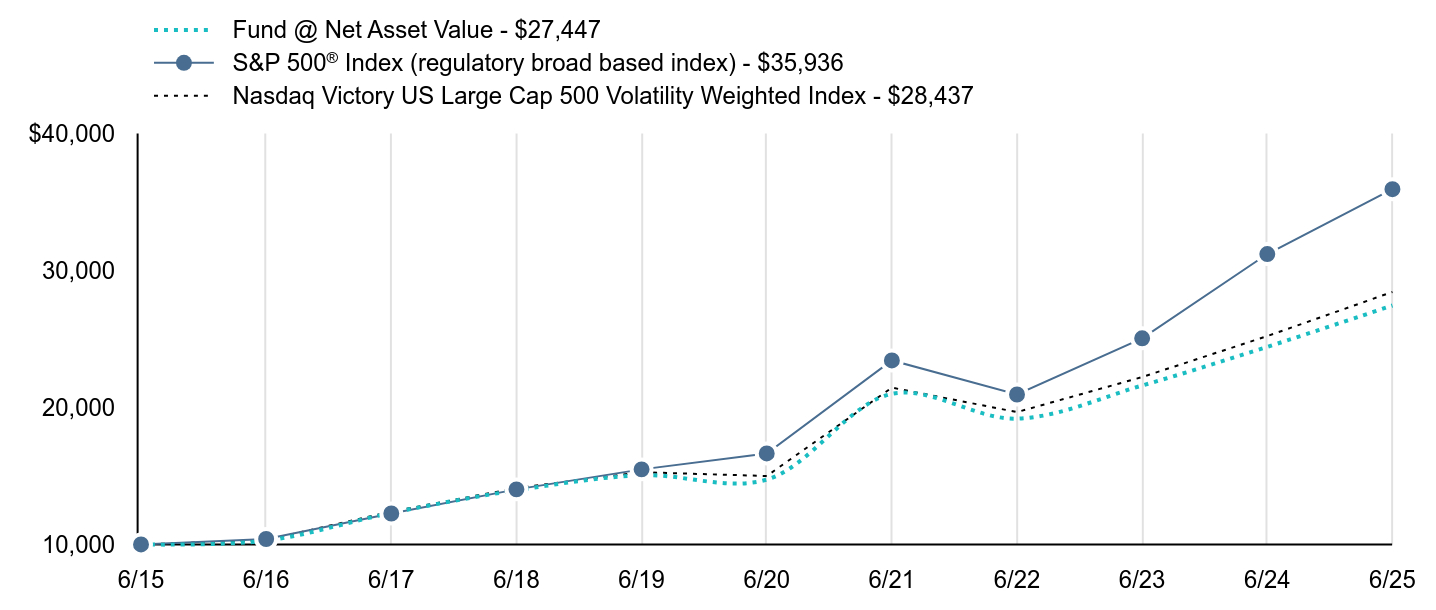
| Line Graph [Table Text Block] |
| Fund @ Net Asset Value - $27,447 | S&P 500® Index (regulatory broad based index) - $35,936 | Nasdaq Victory US Large Cap 500 Volatility Weighted Index - $28,437 |
|---|
6/15 | $10,000 | $10,000 | $10,000 |
|---|
6/16 | $10,278 | $10,399 | $10,319 |
|---|
6/17 | $12,305 | $12,260 | $12,399 |
|---|
6/18 | $13,957 | $14,023 | $14,114 |
|---|
6/19 | $15,053 | $15,483 | $15,276 |
|---|
6/20 | $14,734 | $16,645 | $14,998 |
|---|
6/21 | $20,997 | $23,436 | $21,450 |
|---|
6/22 | $19,184 | $20,948 | $19,666 |
|---|
6/23 | $21,605 | $25,053 | $22,222 |
|---|
6/24 | $24,429 | $31,204 | $25,214 |
|---|
6/25 | $27,447 | $35,936 | $28,437 |
|---|
|
|
| Average Annual Return [Table Text Block] |
| 1 Year | 5 Year | 10 Year |
|---|
Fund @ Net Asset Value | 12.36% | 13.25% | 10.62% |
|---|
S&P 500® Index | 15.16% | 16.64% | 13.65% |
|---|
Nasdaq Victory US Large Cap 500 Volatility Weighted Index | 12.78% | 13.65% | 11.02% |
|---|
|
|
| No Deduction of Taxes [Text Block] |
The graph and table total returns do not reflect the deduction of taxes that a shareholder would pay on Fund distributions, or redemption of shares.
|
|
| AssetsNet |
$ 527,538,000
|
|
| Holdings Count | Holding |
507
|
|
| Advisory Fees Paid, Amount |
$ 1,584,000
|
|
| InvestmentCompanyPortfolioTurnover |
24.00%
|
|
| Additional Fund Statistics [Text Block] |
FUND STATISTICS($ amounts in 000s)(as of June 30, 2025)Net Assets | $527,538 |
|---|
Number of Holdings | 507 |
|---|
Investment Advisory Fees | $1,584 |
|---|
Portfolio Turnover | 24% |
|---|
|
|
| Holdings [Text Block] |
Top SectorsFootnote Reference* (% of Net Assets)Footnote Reference(as of June 30, 2025)Value | Value |
|---|
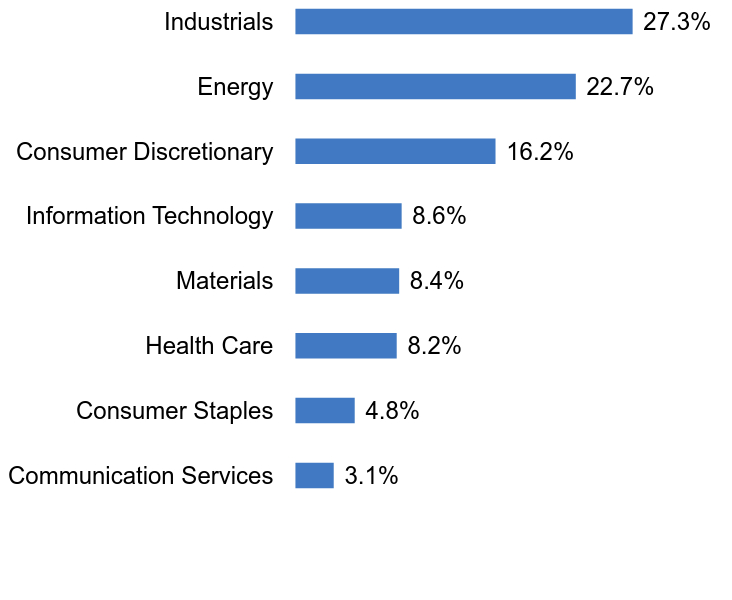
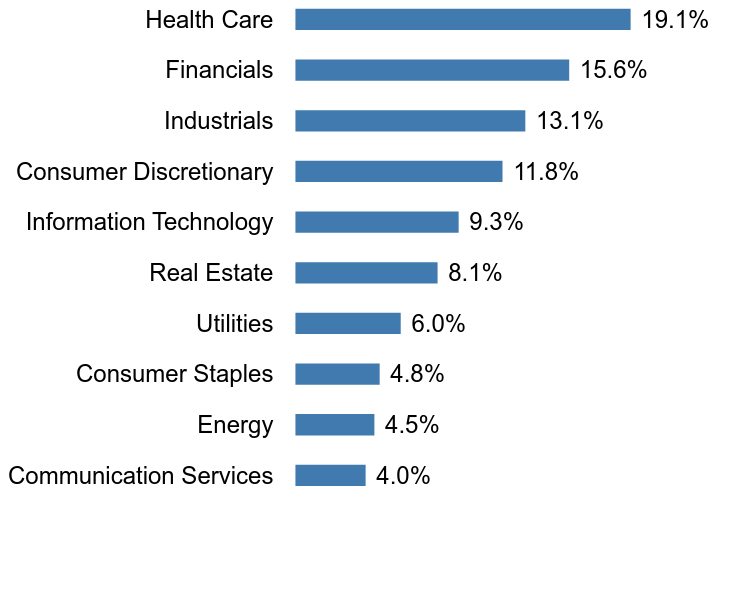
Communication Services | 3.6% | Energy | 4.3% | Materials | 4.8% | Utilities | 7.5% | Consumer Staples | 8.3% | Consumer Discretionary | 9.2% | Health Care | 11.2% | Information Technology | 12.6% | Industrials | 18.7% | Financials | 19.0% |
Top 10 HoldingsFootnote Reference* (% of Net Assets)Footnote Reference(as of June 30, 2025)Evergy, Inc. | 0.4% |
|---|
Linde PLC | 0.4% |
|---|
CME Group, Inc. | 0.4% |
|---|
Atmos Energy Corp. | 0.3% |
|---|
Marsh & McLennan Cos., Inc. | 0.3% |
|---|
Automatic Data Processing, Inc. | 0.3% |
|---|
Cencora, Inc. | 0.3% |
|---|
The Coca-Cola Co. | 0.3% |
|---|
Republic Services, Inc. | 0.3% |
|---|
Intercontinental Exchange, Inc. | 0.3% |
|---|
|
|
| Material Fund Change [Text Block] |
Foreside Fund Services, LLC ("Foreside") served as the Fund’s distributor. Effective March 1, 2025, Victory Capital Services, Inc., an affiliate of Victory Capital Management Inc., replaced Foreside and now serves as Distributor for the Fund pursuant to a Distribution Agreement between the Distributor and the Trust. |
|
| C000157586 |
|
|
| Shareholder Report [Line Items] |
|
|
| Fund Name |
VictoryShares International Volatility Wtd ETF
|
|
| No Trading Symbol [Flag] |
true
|
|
| Annual or Semi-Annual Statement [Text Block] |
Annual Shareholder Report
|
|
| Shareholder Report Annual or Semi-Annual |
annual shareholder report
|
|
| Additional Information [Text Block] |
You can find additional information about the Fund at advisor.vcm.com/literature/etf-prospectuses. You may also request more information by calling 866-376-7890 or visiting vcm.com/contact-us.
This report describes changes to the Fund that occurred during the period.
|
|
| Additional Information Phone Number |
866-376-7890
|
|
| Additional Information Website |
vcm.com
|
|
| Expenses [Text Block] |
What were the Fund's costs for the last year?(based on a hypothetical $10,000 investment) Fund Name | Costs of a $10,000 Investment | Costs paid as a percentage of a $10,000 Investment |
|---|
International Volatility Wtd ETF | $50 | 0.45% |
|---|
| | |
|---|
|
|
| Expenses Paid, Amount |
$ 50
|
|
| Expense Ratio, Percent |
0.45%
|
|
| Factors Affecting Performance [Text Block] |
What affected the Fund’s performance during the last year?Top contributors to performance: The Fund’s underweight allocation to the health care sector was a positive contributor to relative performance; and Stock selection in the health care and materials sectors contributed positively to relative performance.
Top detractors from performance: The Fund had a small allocation to derivatives during the period that did not have a material impact on performance. |
|
| Performance Past Does Not Indicate Future [Text] |
The investment return and principal value will fluctuate so that an investor's shares, when redeemed, may be worth more or less than the original cost. Past performance is not a good predictor of the Fund's future performance.
|
|
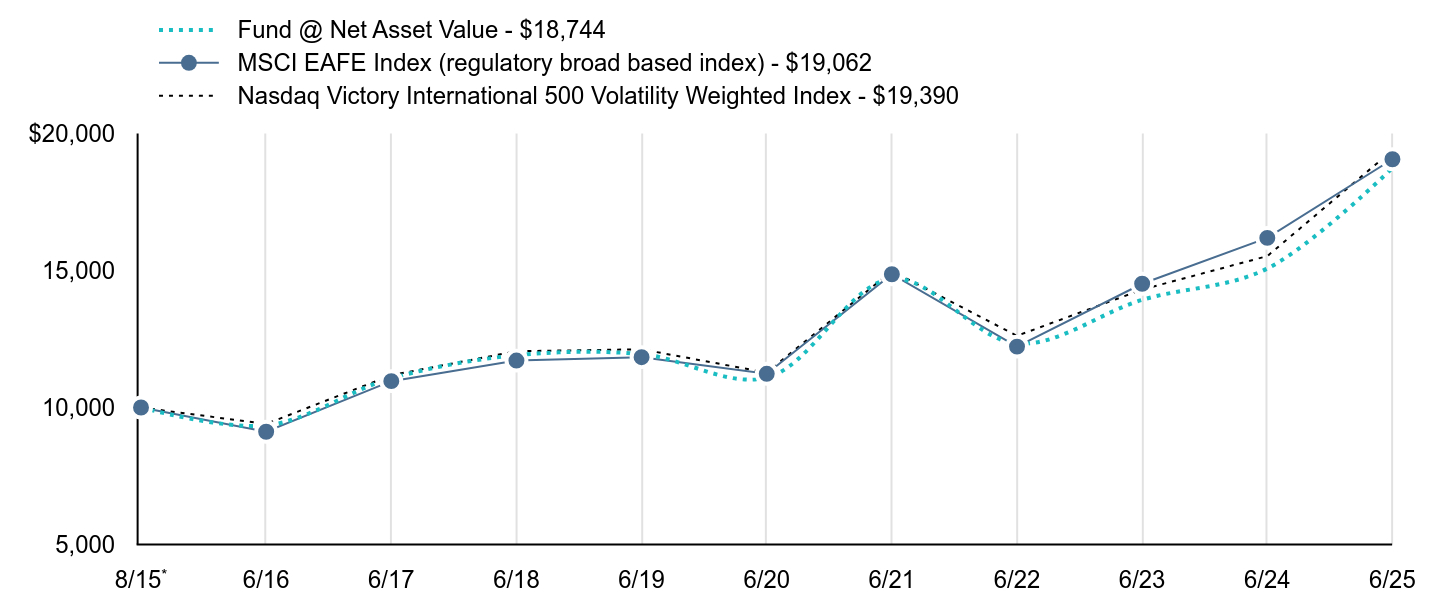
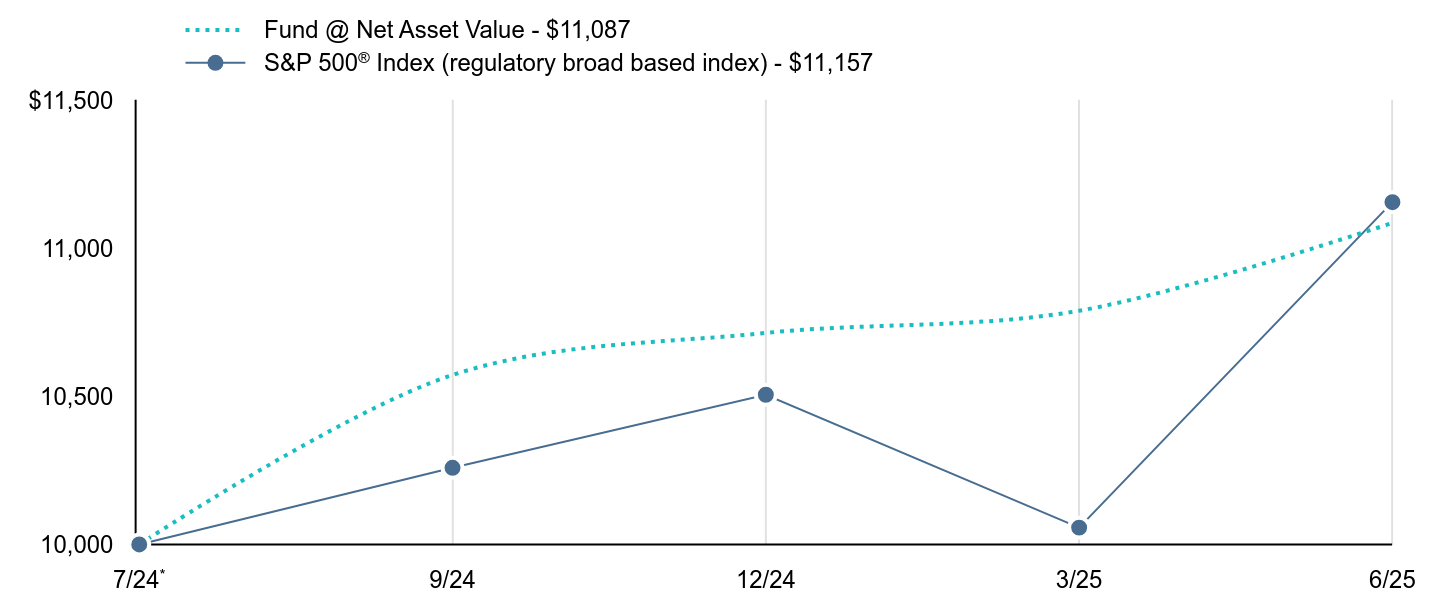
| Line Graph [Table Text Block] |
| Fund @ Net Asset Value - $18,744 | MSCI EAFE Index (regulatory broad based index) - $19,062 | Nasdaq Victory International 500 Volatility Weighted Index - $19,390 |
|---|
8/15Footnote Reference* | $10,000 | $10,000 | $10,000 |
|---|
6/16 | $9,342 | $9,115 | $9,399 |
|---|
6/17 | $11,065 | $10,962 | $11,179 |
|---|
6/18 | $11,908 | $11,712 | $12,054 |
|---|
6/19 | $11,950 | $11,838 | $12,125 |
|---|
6/20 | $11,087 | $11,231 | $11,274 |
|---|
6/21 | $14,699 | $14,864 | $14,985 |
|---|
6/22 | $12,333 | $12,223 | $12,616 |
|---|
6/23 | $13,930 | $14,517 | $14,306 |
|---|
6/24 | $15,073 | $16,192 | $15,527 |
|---|
6/25 | $18,744 | $19,062 | $19,390 |
|---|
|
|
| Average Annual Return [Table Text Block] |
| 1 Year | 5 Year | Since Inception |
|---|
Fund @ Net Asset Value | 24.36%Footnote Reference | 11.07% | 6.58% |
|---|
MSCI EAFE Index | 17.73% | 11.16% | 6.76% |
|---|
Nasdaq Victory International 500 Volatility Weighted Index | 24.88% | 11.46% | 6.94% |
|---|
|
|
| No Deduction of Taxes [Text Block] |
The graph and table total returns do not reflect the deduction of taxes that a shareholder would pay on Fund distributions, or redemption of shares.
|
|
| AssetsNet |
$ 113,859,000
|
|
| Holdings Count | Holding |
507
|
|
| Advisory Fees Paid, Amount |
$ 401,000
|
|
| InvestmentCompanyPortfolioTurnover |
27.00%
|
|
| Additional Fund Statistics [Text Block] |
FUND STATISTICS($ amounts in 000s)(as of June 30, 2025)Net Assets | $113,859 |
|---|
Number of Holdings | 507 |
|---|
Investment Advisory Fees | $401 |
|---|
Portfolio Turnover | 27% |
|---|
|
|
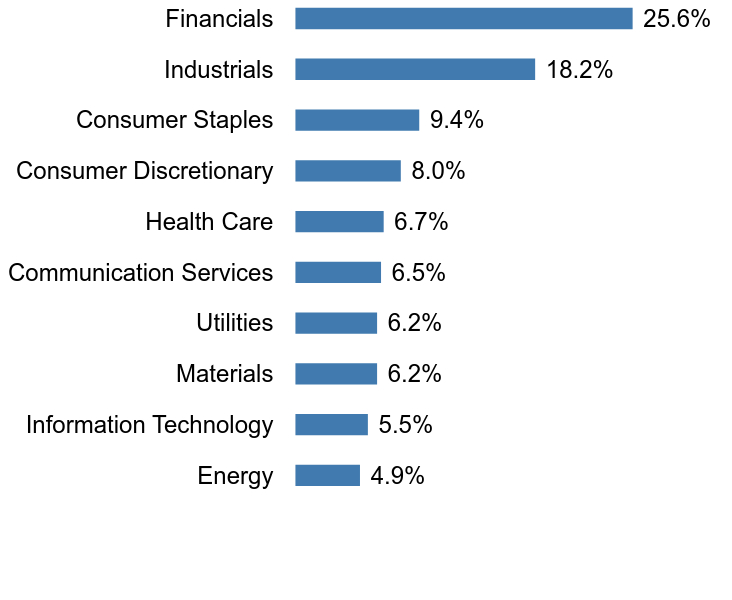
| Holdings [Text Block] |
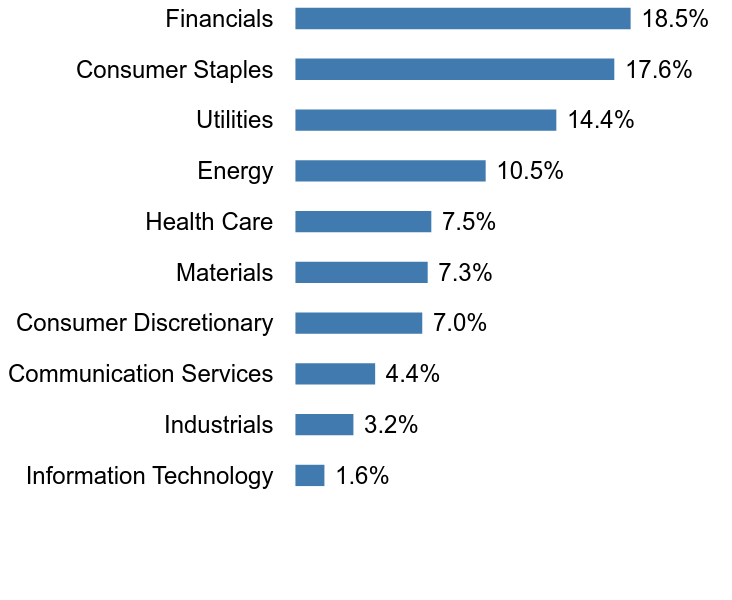
Top SectorsFootnote Reference* (% of Net Assets)Footnote Reference(as of June 30, 2025)Value | Value |
|---|
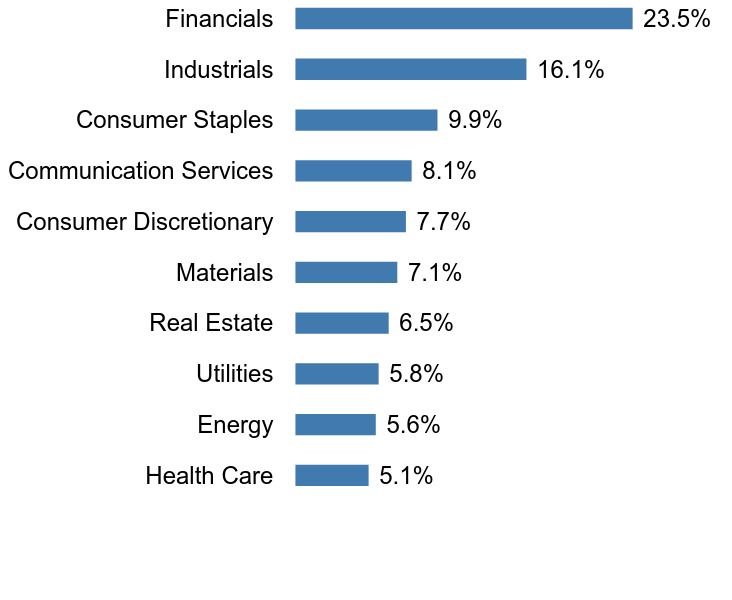
Energy | 4.9% | Information Technology | 5.5% | Materials | 6.2% | Utilities | 6.2% | Communication Services | 6.5% | Health Care | 6.7% | Consumer Discretionary | 8.0% | Consumer Staples | 9.4% | Industrials | 18.2% | Financials | 25.6% |
Top 10 HoldingsFootnote Reference* (% of Net Assets)Footnote Reference(as of June 30, 2025)Swisscom AG, Registered Shares | 0.4% |
|---|
Koninklijke KPN NV | 0.4% |
|---|
Telstra Group Ltd. | 0.4% |
|---|
Coles Group Ltd. | 0.4% |
|---|
Deutsche Boerse AG | 0.4% |
|---|
Danone SA | 0.4% |
|---|
Engie SA | 0.4% |
|---|
Orange SA | 0.4% |
|---|
Terna - Rete Elettrica Nazionale | 0.4% |
|---|
Royal Bank of Canada | 0.4% |
|---|
|
|
| Material Fund Change [Text Block] |
Foreside Fund Services, LLC ("Foreside") served as the Fund’s distributor. Effective March 1, 2025, Victory Capital Services, Inc., an affiliate of Victory Capital Management Inc., replaced Foreside and now serves as Distributor for the Fund pursuant to a Distribution Agreement between the Distributor and the Trust. |
|
| C000157588 |
|
|
| Shareholder Report [Line Items] |
|
|
| Fund Name |
VictoryShares US Large Cap High Div Volatility Wtd ETF
|
|
| No Trading Symbol [Flag] |
true
|
|
| Annual or Semi-Annual Statement [Text Block] |
Annual Shareholder Report
|
|
| Shareholder Report Annual or Semi-Annual |
annual shareholder report
|
|
| Additional Information [Text Block] |
You can find additional information about the Fund at advisor.vcm.com/literature/etf-prospectuses. You may also request more information by calling 866-376-7890 or visiting vcm.com/contact-us.
This report describes changes to the Fund that occurred during the period.
|
|
| Additional Information Phone Number |
866-376-7890
|
|
| Additional Information Website |
vcm.com
|
|
| Expenses [Text Block] |
What were the Fund's costs for the last year?(based on a hypothetical $10,000 investment) Fund Name | Costs of a $10,000 Investment | Costs paid as a percentage of a $10,000 Investment |
|---|
US Large Cap High Div Volatility Wtd ETF | $37 | 0.35% |
|---|
| | |
|---|
|
|
| Expenses Paid, Amount |
$ 37
|
|
| Expense Ratio, Percent |
0.35%
|
|
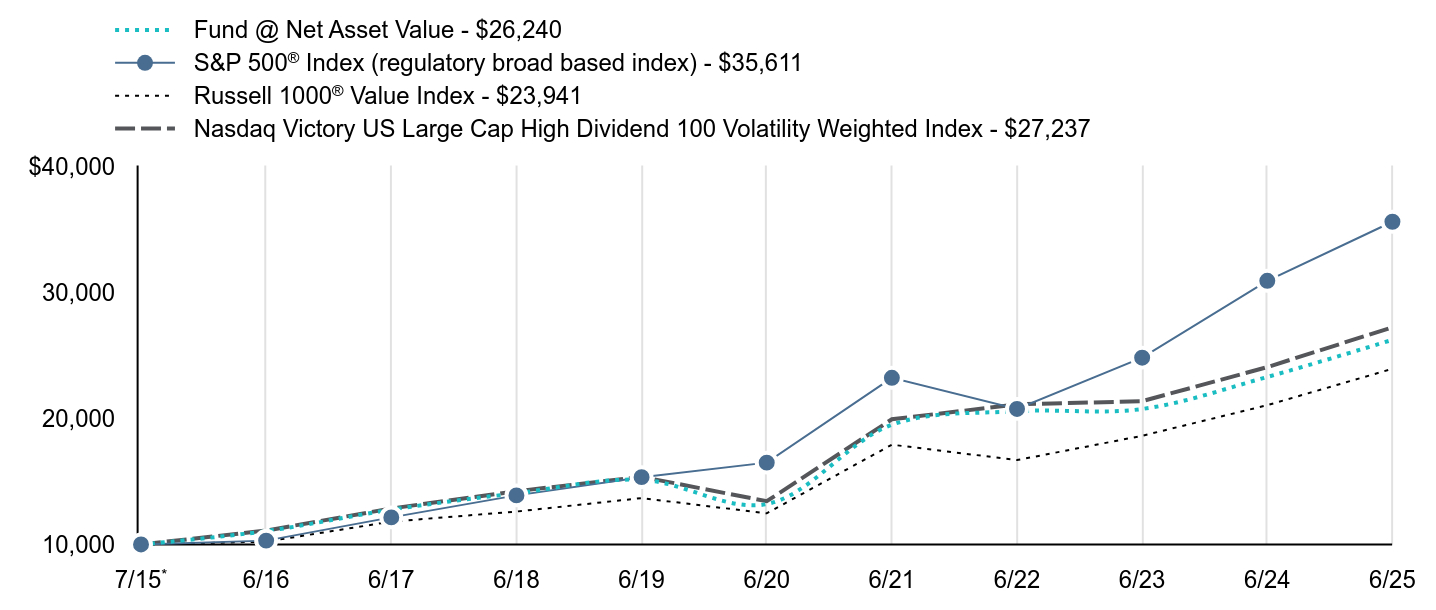
| Factors Affecting Performance [Text Block] |
What affected the Fund’s performance during the last year?Top contributors to performance: The Fund’s underweight allocation to the health care sector, and overweight allocation to the utilities sector, contributed positively to relative performance; and Stock selection in the information technology and health care sectors was a positive contributor to relative performance.
Top detractors from performance: The Fund’s underweight allocation to the industrials sector and overweight allocation to the energy sector detracted from relative performance; and Stock selection in the consumer staples and materials sectors detracted from relative performance.
The Fund had a small allocation to derivatives during the period that did not have a material impact on performance. |
|
| Performance Past Does Not Indicate Future [Text] |
The investment return and principal value will fluctuate so that an investor's shares, when redeemed, may be worth more or less than the original cost. Past performance is not a good predictor of the Fund's future performance.
|
|
| Line Graph [Table Text Block] |
| Fund @ Net Asset Value - $26,240 | S&P 500® Index (regulatory broad based index) - $35,611 | Russell 1000® Value Index - $23,941 | Nasdaq Victory US Large Cap High Dividend 100 Volatility Weighted Index - $27,237 |
|---|
7/15Footnote Reference* | $10,000 | $10,000 | $10,000 | $10,000 |
|---|
6/16 | $11,062 | $10,305 | $10,225 | $11,103 |
|---|
6/17 | $12,762 | $12,150 | $11,813 | $12,857 |
|---|
6/18 | $14,067 | $13,896 | $12,613 | $14,226 |
|---|
6/19 | $15,135 | $15,343 | $13,680 | $15,370 |
|---|
6/20 | $13,201 | $16,495 | $12,471 | $13,431 |
|---|
6/21 | $19,503 | $23,224 | $17,919 | $19,934 |
|---|
6/22 | $20,575 | $20,759 | $16,697 | $21,120 |
|---|
6/23 | $20,752 | $24,826 | $18,624 | $21,372 |
|---|
6/24 | $23,293 | $30,922 | $21,055 | $24,075 |
|---|
6/25 | $26,240 | $35,611 | $23,941 | $27,237 |
|---|
|
|
| Average Annual Return [Table Text Block] |
| 1 Year | 5 Year | Since Inception |
|---|
Fund @ Net Asset Value | 12.65% | 14.73% | 10.15% |
|---|
S&P 500® Index | 15.16% | 16.64% | 13.57% |
|---|
Russell 1000® Value Index | 13.70% | 13.93% | 9.14% |
|---|
Nasdaq Victory US Large Cap High Dividend 100 Volatility Weighted Index | 13.14% | 15.19% | 10.56% |
|---|
|
|
| No Deduction of Taxes [Text Block] |
The graph and table total returns do not reflect the deduction of taxes that a shareholder would pay on Fund distributions, or redemption of shares.
|
|
| AssetsNet |
$ 349,417,000
|
|
| Holdings Count | Holding |
101
|
|
| Advisory Fees Paid, Amount |
$ 1,039,000
|
|
| InvestmentCompanyPortfolioTurnover |
44.00%
|
|
| Additional Fund Statistics [Text Block] |
FUND STATISTICS($ amounts in 000s)(as of June 30, 2025)Net Assets | $349,417 |
|---|
Number of Holdings | 101 |
|---|
Investment Advisory Fees | $1,039 |
|---|
Portfolio Turnover | 44% |
|---|
|
|
| Holdings [Text Block] |
Top SectorsFootnote Reference* (% of Net Assets)Footnote Reference(as of June 30, 2025)Value | Value |
|---|
Materials | 2.4% | Industrials | 2.4% | Consumer Discretionary | 2.9% | Information Technology | 3.2% | Communication Services | 4.1% | Health Care | 7.6% | Energy | 11.5% | Financials | 18.6% | Consumer Staples | 21.7% | Utilities | 24.9% |
Top 10 HoldingsFootnote Reference* (% of Net Assets)Footnote Reference(as of June 30, 2025)Evergy, Inc. | 1.8% |
|---|
CME Group, Inc. | 1.6% |
|---|
The Coca-Cola Co. | 1.5% |
|---|
WEC Energy Group, Inc. | 1.5% |
|---|
PPL Corp. | 1.4% |
|---|
CMS Energy Corp. | 1.4% |
|---|
Duke Energy Corp. | 1.4% |
|---|
The Southern Co. | 1.4% |
|---|
DTE Energy Co. | 1.4% |
|---|
Johnson & Johnson | 1.4% |
|---|
|
|
| Material Fund Change [Text Block] |
Foreside Fund Services, LLC ("Foreside") served as the Fund’s distributor. Effective March 1, 2025, Victory Capital Services, Inc., an affiliate of Victory Capital Management Inc., replaced Foreside and now serves as Distributor for the Fund pursuant to a Distribution Agreement between the Distributor and the Trust. |
|
| C000157589 |
|
|
| Shareholder Report [Line Items] |
|
|
| Fund Name |
VictoryShares US Small Cap High Div Volatility Wtd ETF
|
|
| No Trading Symbol [Flag] |
true
|
|
| Annual or Semi-Annual Statement [Text Block] |
Annual Shareholder Report
|
|
| Shareholder Report Annual or Semi-Annual |
annual shareholder report
|
|
| Additional Information [Text Block] |
You can find additional information about the Fund at advisor.vcm.com/literature/etf-prospectuses. You may also request more information by calling 866-376-7890 or visiting vcm.com/contact-us.
This report describes changes to the Fund that occurred during the period.
|
|
| Additional Information Phone Number |
866-376-7890
|
|
| Additional Information Website |
vcm.com
|
|
| Expenses [Text Block] |
What were the Fund's costs for the last year?(based on a hypothetical $10,000 investment) Fund Name | Costs of a $10,000 Investment | Costs paid as a percentage of a $10,000 Investment |
|---|
US Small Cap High Div Volatility Wtd ETF | $36 | 0.35% |
|---|
| | |
|---|
|
|
| Expenses Paid, Amount |
$ 36
|
|
| Expense Ratio, Percent |
0.35%
|
|
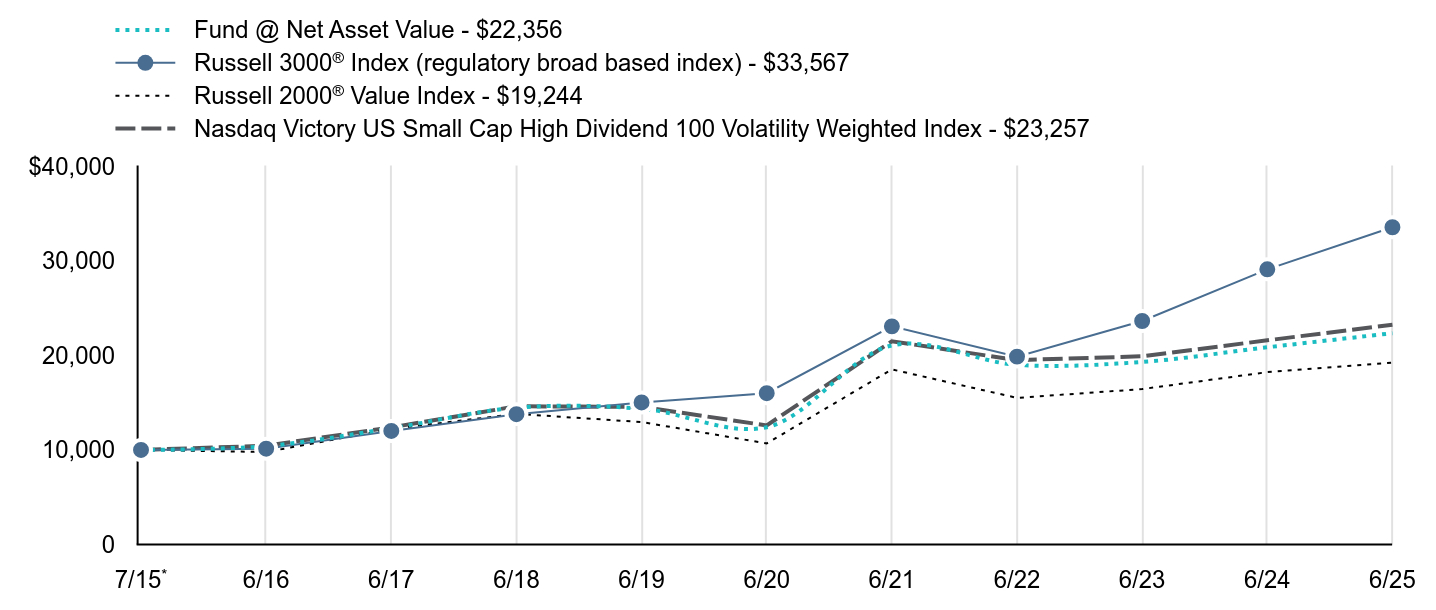
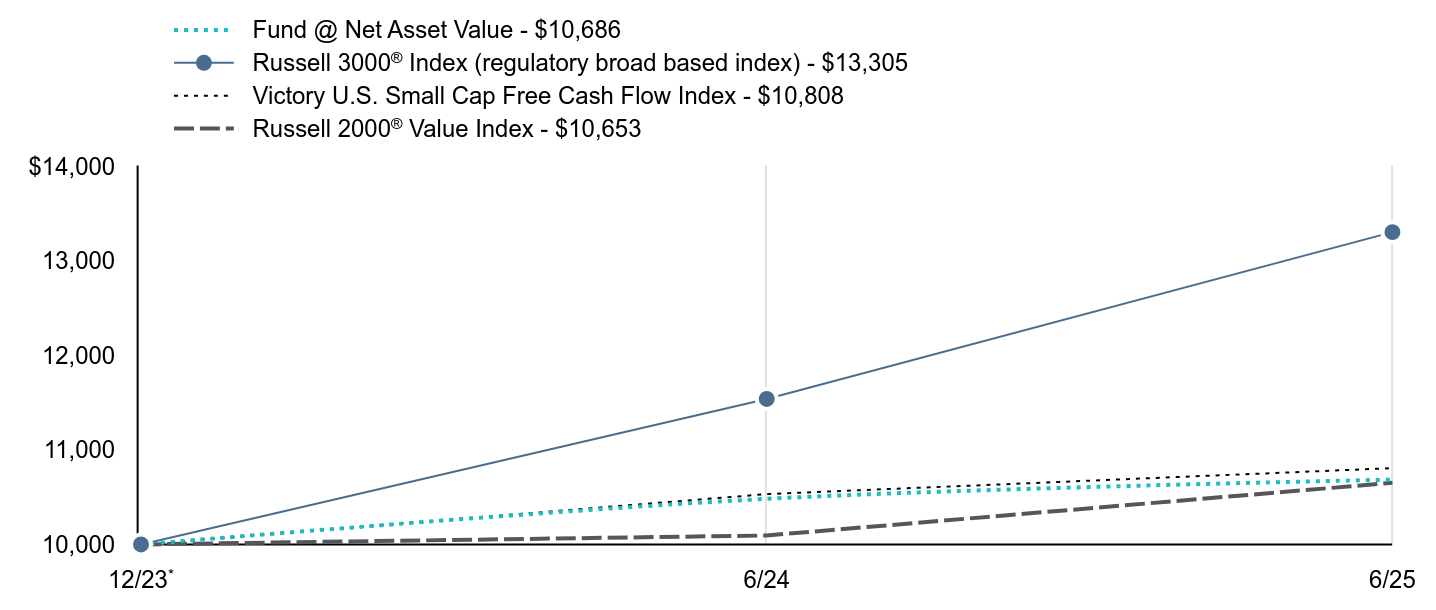
| Factors Affecting Performance [Text Block] |
What affected the Fund’s performance during the last year?Top contributors to performance: The Fund’s underweight allocation to the health care sector contributed positively to relative performance; and Stock selection in the financials sector was a positive contributor to relative performance.
Top detractors from performance: The Fund had a small allocation to derivatives during the period that did not have a material impact on performance. |
|
| Performance Past Does Not Indicate Future [Text] |
The investment return and principal value will fluctuate so that an investor's shares, when redeemed, may be worth more or less than the original cost. Past performance is not a good predictor of the Fund's future performance.
|
|
| Line Graph [Table Text Block] |
| Fund @ Net Asset Value - $22,356 | Russell 3000® Index (regulatory broad based index) - $33,567 | Russell 2000® Value Index - $19,244 | Nasdaq Victory US Small Cap High Dividend 100 Volatility Weighted Index - $23,257 |
|---|
7/15Footnote Reference* | $10,000 | $10,000 | $10,000 | $10,000 |
|---|
6/16 | $10,415 | $10,137 | $9,786 | $10,448 |
|---|
6/17 | $12,298 | $12,013 | $12,218 | $12,389 |
|---|
6/18 | $14,468 | $13,789 | $13,819 | $14,623 |
|---|
6/19 | $14,366 | $15,027 | $12,957 | $14,560 |
|---|
6/20 | $12,411 | $16,008 | $10,693 | $12,596 |
|---|
6/21 | $21,066 | $23,078 | $18,528 | $21,506 |
|---|
6/22 | $19,010 | $19,878 | $15,512 | $19,504 |
|---|
6/23 | $19,317 | $23,646 | $16,443 | $19,910 |
|---|
6/24 | $20,867 | $29,114 | $18,235 | $21,602 |
|---|
6/25 | $22,356 | $33,567 | $19,244 | $23,257 |
|---|
|
|
| Average Annual Return [Table Text Block] |
| 1 Year | 5 Year | Since Inception |
|---|
Fund @ Net Asset Value | 7.14% | 12.49% | 8.39% |
|---|
Russell 3000® Index | 15.30% | 15.96% | 12.90% |
|---|
Russell 2000® Value Index | 5.54% | 12.47% | 6.78% |
|---|
Nasdaq Victory US Small Cap High Dividend 100 Volatility Weighted Index | 7.66% | 13.05% | 8.82% |
|---|
|
|
| No Deduction of Taxes [Text Block] |
The graph and table total returns do not reflect the deduction of taxes that a shareholder would pay on Fund distributions, or redemption of shares.
|
|
| AssetsNet |
$ 271,534,000
|
|
| Holdings Count | Holding |
105
|
|
| Advisory Fees Paid, Amount |
$ 868,000
|
|
| InvestmentCompanyPortfolioTurnover |
66.00%
|
|
| Additional Fund Statistics [Text Block] |
FUND STATISTICS($ amounts in 000s)(as of June 30, 2025)Net Assets | $271,534 |
|---|
Number of Holdings | 105 |
|---|
Investment Advisory Fees | $868 |
|---|
Portfolio Turnover | 66% |
|---|
|
|
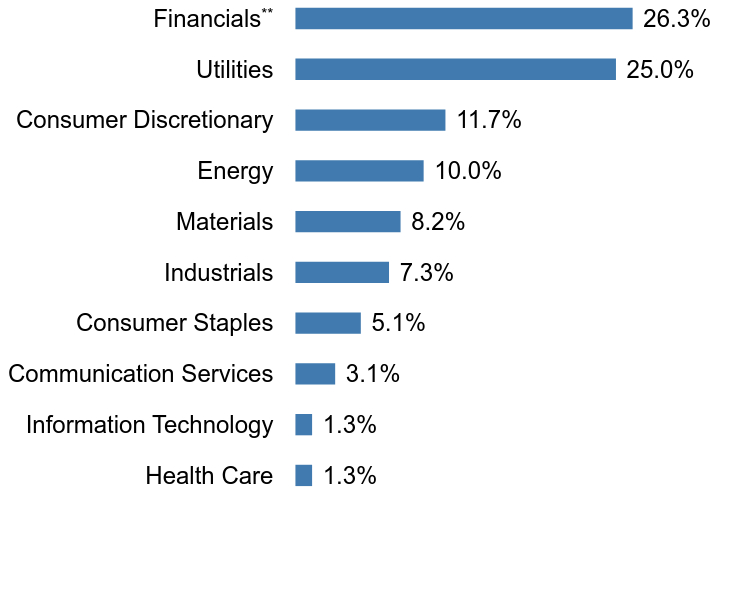
| Holdings [Text Block] |
Top SectorsFootnote Reference* (% of Net Assets)Footnote Reference(as of June 30, 2025)Value | Value |
|---|
Health Care | 1.3% | Information Technology | 1.3% | Communication Services | 3.1% | Consumer Staples | 5.1% | Industrials | 7.3% | Materials | 8.2% | Energy | 10.0% | Consumer Discretionary | 11.7% | Utilities | 25.0% | FinancialsFootnote Reference** | 26.3% |
Top 10 HoldingsFootnote Reference* (% of Net Assets)Footnote Reference(as of June 30, 2025)IDACORP, Inc. | 1.9% |
|---|
Sensient Technologies Corp. | 1.8% |
|---|
TXNM Energy, Inc. | 1.8% |
|---|
Portland General Electric Co. | 1.7% |
|---|
New Jersey Resources Corp. | 1.6% |
|---|
Black Hills Corp. | 1.6% |
|---|
Northwest Natural Holding Co. | 1.5% |
|---|
American States Water Co. | 1.5% |
|---|
ONE Gas, Inc. | 1.5% |
|---|
Avista Corp. | 1.5% |
|---|
|
|
| Material Fund Change [Text Block] |
Foreside Fund Services, LLC ("Foreside") served as the Fund’s distributor. Effective March 1, 2025, Victory Capital Services, Inc., an affiliate of Victory Capital Management Inc., replaced Foreside and now serves as Distributor for the Fund pursuant to a Distribution Agreement between the Distributor and the Trust. |
|
| C000180597 |
|
|
| Shareholder Report [Line Items] |
|
|
| Fund Name |
VictoryShares Dividend Accelerator ETF
|
|
| No Trading Symbol [Flag] |
true
|
|
| Annual or Semi-Annual Statement [Text Block] |
Annual Shareholder Report
|
|
| Shareholder Report Annual or Semi-Annual |
annual shareholder report
|
|
| Additional Information [Text Block] |
You can find additional information about the Fund at advisor.vcm.com/literature/etf-prospectuses. You may also request more information by calling 866-376-7890 or visiting vcm.com/contact-us.
This report describes changes to the Fund that occurred during the period.
|
|
| Additional Information Phone Number |
866-376-7890
|
|
| Additional Information Website |
vcm.com
|
|
| Expenses [Text Block] |
What were the Fund's costs for the last year?(based on a hypothetical $10,000 investment) Fund Name | Costs of a $10,000 Investment | Costs paid as a percentage of a $10,000 Investment |
|---|
Dividend Accelerator ETF | $37 | 0.35% |
|---|
| | |
|---|
|
|
| Expenses Paid, Amount |
$ 37
|
|
| Expense Ratio, Percent |
0.35%
|
|
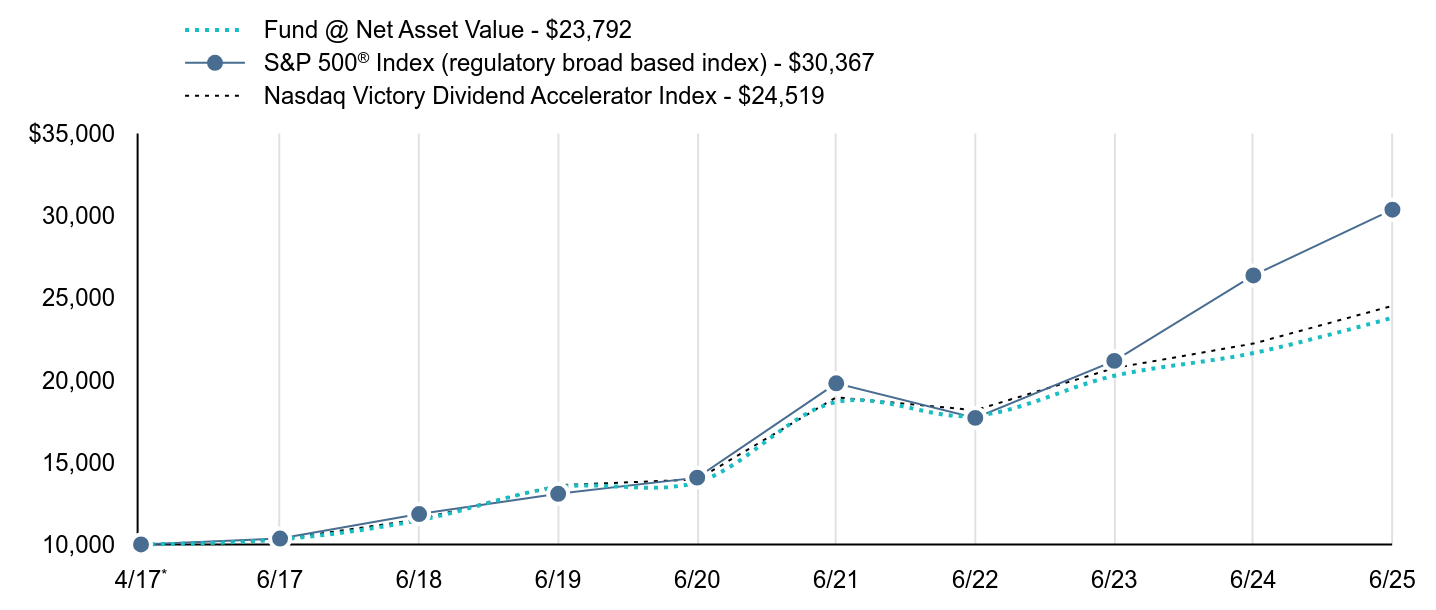
| Factors Affecting Performance [Text Block] |
What affected the Fund’s performance during the last year?Top contributors to performance: The Fund’s overweight allocation to the financials sector was a positive contributor to relative performance; and Stock selection in the health care sector contributed positively to relative performance.
Top detractors from performance: The Fund’s overweight allocation to the consumer staples sector detracted from relative performance; and Stock selection in the consumer staples and industrials sectors detracted from relative performance.
The Fund had a small allocation to derivatives during the period that did not have a material impact on performance. |
|
| Performance Past Does Not Indicate Future [Text] |
The investment return and principal value will fluctuate so that an investor's shares, when redeemed, may be worth more or less than the original cost. Past performance is not a good predictor of the Fund's future performance.
|
|
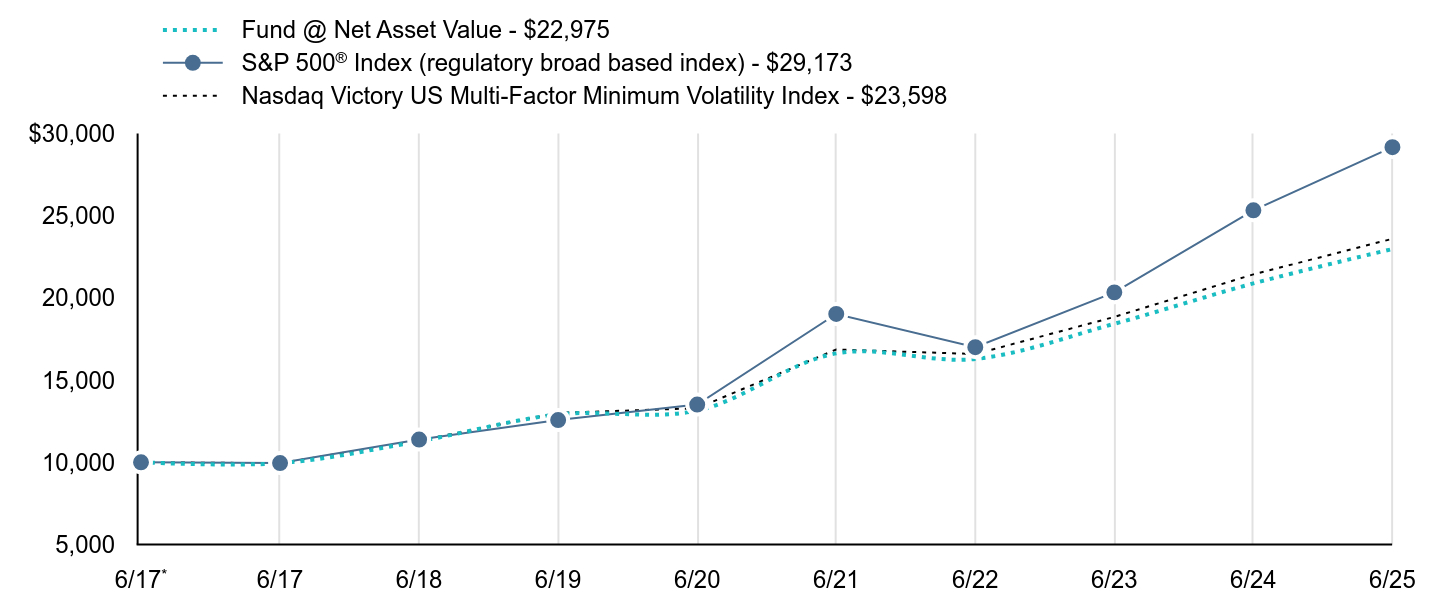
| Line Graph [Table Text Block] |
| Fund @ Net Asset Value - $23,792 | S&P 500® Index (regulatory broad based index) - $30,367 | Nasdaq Victory Dividend Accelerator Index - $24,519 |
|---|
4/17Footnote Reference* | $10,000 | $10,000 | $10,000 |
|---|
6/17 | $10,305 | $10,360 | $10,310 |
|---|
6/18 | $11,473 | $11,850 | $11,521 |
|---|
6/19 | $13,492 | $13,084 | $13,604 |
|---|
6/20 | $13,793 | $14,066 | $13,954 |
|---|
6/21 | $18,666 | $19,804 | $18,952 |
|---|
6/22 | $17,827 | $17,702 | $18,169 |
|---|
6/23 | $20,265 | $21,170 | $20,732 |
|---|
6/24 | $21,645 | $26,369 | $22,221 |
|---|
6/25 | $23,792 | $30,367 | $24,519 |
|---|
|
|
| Average Annual Return [Table Text Block] |
| 1 Year | 5 Year | Since Inception |
|---|
Fund @ Net Asset Value | 9.92% | 11.52% | 11.15% |
|---|
S&P 500® Index | 15.16% | 16.64% | 14.50% |
|---|
Nasdaq Victory Dividend Accelerator Index | 10.34% | 11.93% | 11.55% |
|---|
|
|
| No Deduction of Taxes [Text Block] |
The graph and table total returns do not reflect the deduction of taxes that a shareholder would pay on Fund distributions, or redemption of shares.
|
|
| AssetsNet |
$ 238,219,000
|
|
| Holdings Count | Holding |
76
|
|
| Advisory Fees Paid, Amount |
$ 738,000
|
|
| InvestmentCompanyPortfolioTurnover |
39.00%
|
|
| Additional Fund Statistics [Text Block] |
FUND STATISTICS($ amounts in 000s)(as of June 30, 2025)Net Assets | $238,219 |
|---|
Number of Holdings | 76 |
|---|
Investment Advisory Fees | $738 |
|---|
Portfolio Turnover | 39% |
|---|
|
|
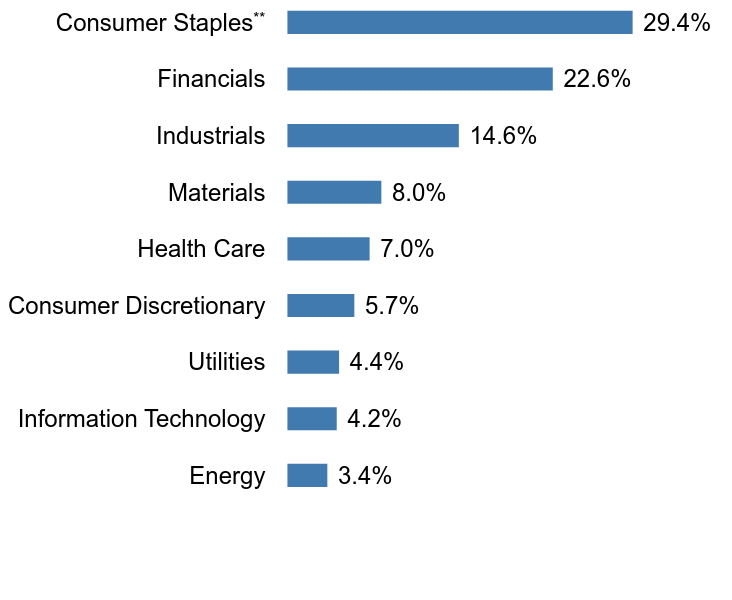
| Holdings [Text Block] |
Top SectorsFootnote Reference* (% of Net Assets)Footnote Reference(as of June 30, 2025)Value | Value |
|---|
Energy | 3.4% | Information Technology | 4.2% | Utilities | 4.4% | Consumer Discretionary | 5.7% | Health Care | 7.0% | Materials | 8.0% | Industrials | 14.6% | Financials | 22.6% | Consumer StaplesFootnote Reference** | 29.4% |
Top 10 HoldingsFootnote Reference* (% of Net Assets)Footnote Reference(as of June 30, 2025)Franklin Resources, Inc. | 4.5% |
|---|
T. Rowe Price Group, Inc. | 3.5% |
|---|
Altria Group, Inc. | 3.5% |
|---|
Hormel Foods Corp. | 2.9% |
|---|
Archer-Daniels-Midland Co. | 2.6% |
|---|
Target Corp. | 2.4% |
|---|
Medtronic PLC | 2.2% |
|---|
Stanley Black & Decker, Inc. | 2.1% |
|---|
Kimberly-Clark Corp. | 2.1% |
|---|
Emerson Electric Co. | 2.0% |
|---|
|
|
| Material Fund Change [Text Block] |
Foreside Fund Services, LLC ("Foreside") served as the Fund’s distributor. Effective March 1, 2025, Victory Capital Services, Inc., an affiliate of Victory Capital Management Inc., replaced Foreside and now serves as Distributor for the Fund pursuant to a Distribution Agreement between the Distributor and the Trust. |
|
| C000180594 |
|
|
| Shareholder Report [Line Items] |
|
|
| Fund Name |
VictoryShares US Multi-Factor Minimum Volatility ETF
|
|
| No Trading Symbol [Flag] |
true
|
|
| Annual or Semi-Annual Statement [Text Block] |
Annual Shareholder Report
|
|
| Shareholder Report Annual or Semi-Annual |
annual shareholder report
|
|
| Additional Information [Text Block] |
You can find additional information about the Fund at advisor.vcm.com/literature/etf-prospectuses. You may also request more information by calling 866-376-7890 or visiting vcm.com/contact-us.
This report describes changes to the Fund that occurred during the period.
|
|
| Additional Information Phone Number |
866-376-7890
|
|
| Additional Information Website |
vcm.com
|
|
| Expenses [Text Block] |
What were the Fund's costs for the last year?(based on a hypothetical $10,000 investment) Fund Name | Costs of a $10,000 Investment | Costs paid as a percentage of a $10,000 Investment |
|---|
US Multi-Factor Minimum Volatility ETF | $37 | 0.35% |
|---|
| | |
|---|
|
|
| Expenses Paid, Amount |
$ 37
|
|
| Expense Ratio, Percent |
0.35%
|
|
| Factors Affecting Performance [Text Block] |
What affected the Fund’s performance during the last year?Top contributors to performance: An overweight allocation to the industrials sector contributed positively to relative performance; and Stock selection in health care and consumer staples sectors was a positive contributor to relative performance.
Top detractors from performance: The Fund’s overweight allocation to the health care sector and underweight allocation to the financials sector detracted from relative performance; and Stock selection in the information technology sector detracted from relative performance.
The Fund had a small allocation to derivatives during the period that did not have a material impact on performance. |
|
| Performance Past Does Not Indicate Future [Text] |
The investment return and principal value will fluctuate so that an investor's shares, when redeemed, may be worth more or less than the original cost. Past performance is not a good predictor of the Fund's future performance.
|
|
| Line Graph [Table Text Block] |
| Fund @ Net Asset Value - $22,975 | S&P 500® Index (regulatory broad based index) - $29,173 | Nasdaq Victory US Multi-Factor Minimum Volatility Index - $23,598 |
|---|
6/17Footnote Reference* | $10,000 | $10,000 | $10,000 |
|---|
6/17 | $9,946 | $9,953 | $9,947 |
|---|
6/18 | $11,279 | $11,384 | $11,322 |
|---|
6/19 | $12,911 | $12,569 | $13,008 |
|---|
6/20 | $13,146 | $13,513 | $13,287 |
|---|
6/21 | $16,626 | $19,025 | $16,864 |
|---|
6/22 | $16,286 | $17,005 | $16,586 |
|---|
6/23 | $18,427 | $20,338 | $18,844 |
|---|
6/24 | $20,884 | $25,332 | $21,432 |
|---|
6/25 | $22,975 | $29,173 | $23,598 |
|---|
|
|
| Average Annual Return [Table Text Block] |
| 1 Year | 5 Year | Since Inception |
|---|
Fund @ Net Asset Value | 10.01% | 11.81% | 10.92% |
|---|
S&P 500® Index | 15.16% | 16.64% | 14.27% |
|---|
Nasdaq Victory US Multi-Factor Minimum Volatility Index | 10.11% | 12.17% | 11.29% |
|---|
|
|
| No Deduction of Taxes [Text Block] |
The graph and table total returns do not reflect the deduction of taxes that a shareholder would pay on Fund distributions, or redemption of shares.
|
|
| AssetsNet |
$ 110,893,000
|
|
| Holdings Count | Holding |
63
|
|
| Advisory Fees Paid, Amount |
$ 365,000
|
|
| InvestmentCompanyPortfolioTurnover |
71.00%
|
|
| Additional Fund Statistics [Text Block] |
FUND STATISTICS($ amounts in 000s)(as of June 30, 2025)Net Assets | $110,893 |
|---|
Number of Holdings | 63 |
|---|
Investment Advisory Fees | $365 |
|---|
Portfolio Turnover | 71% |
|---|
|
|
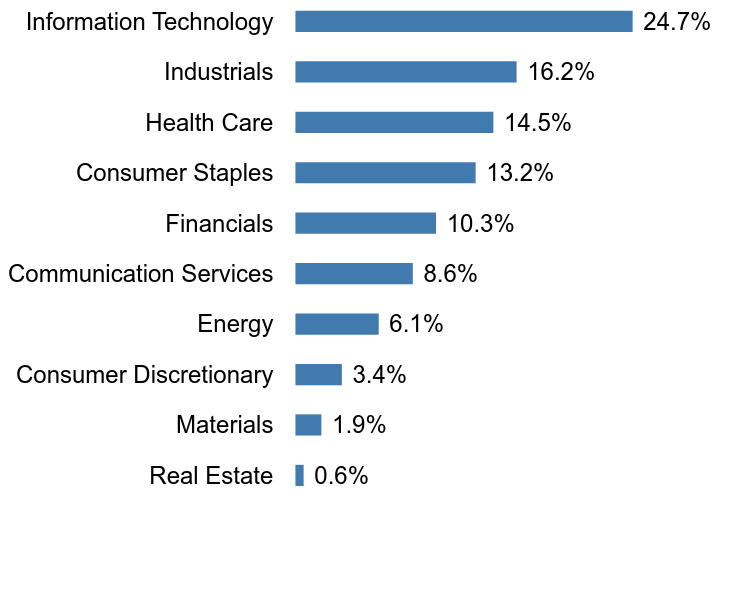
| Holdings [Text Block] |
Top SectorsFootnote Reference* (% of Net Assets)Footnote Reference(as of June 30, 2025)Value | Value |
|---|
Real Estate | 0.6% | Materials | 1.9% | Consumer Discretionary | 3.4% | Energy | 6.1% | Communication Services | 8.6% | Financials | 10.3% | Consumer Staples | 13.2% | Health Care | 14.5% | Industrials | 16.2% | Information Technology | 24.7% |
Top 10 HoldingsFootnote Reference* (% of Net Assets)Footnote Reference(as of June 30, 2025)Apple, Inc. | 9.0% |
|---|
Alphabet, Inc., Class A | 5.5% |
|---|
Walmart, Inc. | 4.2% |
|---|
The Procter & Gamble Co. | 3.5% |
|---|
Johnson & Johnson | 3.5% |
|---|
Lockheed Martin Corp. | 3.3% |
|---|
AbbVie, Inc. | 3.3% |
|---|
Exxon Mobil Corp. | 3.2% |
|---|
The Cigna Group | 3.2% |
|---|
Republic Services, Inc. | 3.1% |
|---|
|
|
| Material Fund Change [Text Block] |
Foreside Fund Services, LLC ("Foreside") served as the Fund’s distributor. Effective March 1, 2025, Victory Capital Services, Inc., an affiliate of Victory Capital Management Inc., replaced Foreside and now serves as Distributor for the Fund pursuant to a Distribution Agreement between the Distributor and the Trust. |
|
| C000139053 |
|
|
| Shareholder Report [Line Items] |
|
|
| Fund Name |
VictoryShares US 500 Enhanced Volatility Wtd ETF
|
|
| No Trading Symbol [Flag] |
true
|
|
| Annual or Semi-Annual Statement [Text Block] |
Annual Shareholder Report
|
|
| Shareholder Report Annual or Semi-Annual |
annual shareholder report
|
|
| Additional Information [Text Block] |
You can find additional information about the Fund at advisor.vcm.com/literature/etf-prospectuses. You may also request more information by calling 866-376-7890 or visiting vcm.com/contact-us.
This report describes changes to the Fund that occurred during the period.
|
|
| Additional Information Phone Number |
866-376-7890
|
|
| Additional Information Website |
vcm.com
|
|
| Expenses [Text Block] |
What were the Fund's costs for the last year?(based on a hypothetical $10,000 investment) Fund Name | Costs of a $10,000 Investment | Costs paid as a percentage of a $10,000 Investment |
|---|
US 500 Enhanced Volatility Wtd ETF | $37 | 0.35% |
|---|
| | |
|---|
|
|
| Expenses Paid, Amount |
$ 37
|
|
| Expense Ratio, Percent |
0.35%
|
|
| Factors Affecting Performance [Text Block] |
What affected the Fund’s performance during the last year?Top contributors to performance: The Fund’s overweight allocation to the industrials sector contributed positively to relative performance; and Stock selection in the health care and consumer discretionary sectors was a positive contributor to relative performance.
Top detractors from performance: The Fund’s underweight position in the information technology and communication services sectors detracted from relative performance; and Stock selection in the industrials and financials sectors detracted from relative performance.
|
|
| Performance Past Does Not Indicate Future [Text] |
The investment return and principal value will fluctuate so that an investor's shares, when redeemed, may be worth more or less than the original cost. Past performance is not a good predictor of the Fund's future performance.
|
|
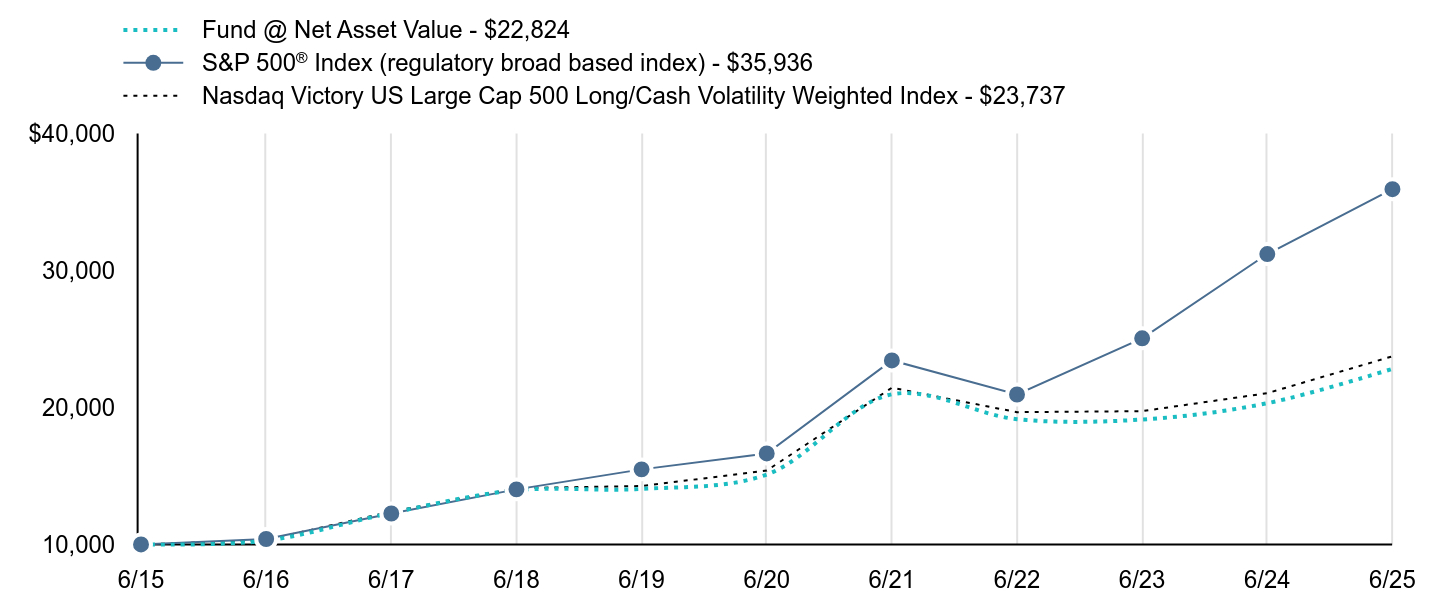
| Line Graph [Table Text Block] |
| Fund @ Net Asset Value - $22,824 | S&P 500® Index (regulatory broad based index) - $35,936 | Nasdaq Victory US Large Cap 500 Long/Cash Volatility Weighted Index - $23,737 |
|---|
6/15 | $10,000 | $10,000 | $10,000 |
|---|
6/16 | $10,279 | $10,399 | $10,319 |
|---|
6/17 | $12,306 | $12,260 | $12,399 |
|---|
6/18 | $13,958 | $14,023 | $14,114 |
|---|
6/19 | $14,054 | $15,483 | $14,265 |
|---|
6/20 | $15,107 | $16,645 | $15,394 |
|---|
6/21 | $20,965 | $23,436 | $21,443 |
|---|
6/22 | $19,147 | $20,948 | $19,659 |
|---|
6/23 | $19,123 | $25,053 | $19,733 |
|---|
6/24 | $20,314 | $31,204 | $21,047 |
|---|
6/25 | $22,824 | $35,936 | $23,737 |
|---|
|
|
| Average Annual Return [Table Text Block] |
| 1 Year | 5 Year | 10 Year |
|---|
Fund @ Net Asset Value | 12.36% | 8.60% | 8.60% |
|---|
S&P 500® Index | 15.16% | 16.64% | 13.65% |
|---|
Nasdaq Victory US Large Cap 500 Long/Cash Volatility Weighted Index | 12.78% | 9.05% | 9.03% |
|---|
|
|
| No Deduction of Taxes [Text Block] |
The graph and table total returns do not reflect the deduction of taxes that a shareholder would pay on Fund distributions, or redemption of shares.
|
|
| AssetsNet |
$ 416,923,000
|
|
| Holdings Count | Holding |
508
|
|
| Advisory Fees Paid, Amount |
$ 1,284,000
|
|
| InvestmentCompanyPortfolioTurnover |
24.00%
|
|
| Additional Fund Statistics [Text Block] |
FUND STATISTICS($ amounts in 000s)(as of June 30, 2025)Net Assets | $416,923 |
|---|
Number of Holdings | 508 |
|---|
Investment Advisory Fees | $1,284 |
|---|
Portfolio Turnover | 24% |
|---|
|
|
| Holdings [Text Block] |
Top SectorsFootnote Reference* (% of Net Assets)Footnote Reference(as of June 30, 2025)Value | Value |
|---|
Communication Services | 3.6% | Energy | 4.3% | Materials | 4.8% | Utilities | 7.5% | Consumer Staples | 8.3% | Consumer Discretionary | 9.2% | Health Care | 11.2% | Information Technology | 12.6% | Industrials | 18.7% | Financials | 19.0% |
Top 10 HoldingsFootnote Reference* (% of Net Assets)Footnote Reference(as of June 30, 2025)Evergy, Inc. | 0.4% |
|---|
Linde PLC | 0.4% |
|---|
CME Group, Inc. | 0.4% |
|---|
Atmos Energy Corp. | 0.3% |
|---|
Marsh & McLennan Cos., Inc. | 0.3% |
|---|
Automatic Data Processing, Inc. | 0.3% |
|---|
Cencora, Inc. | 0.3% |
|---|
The Coca-Cola Co. | 0.3% |
|---|
Republic Services, Inc. | 0.3% |
|---|
Intercontinental Exchange, Inc. | 0.3% |
|---|
|
|
| Material Fund Change [Text Block] |
Foreside Fund Services, LLC ("Foreside") served as the Fund’s distributor. Effective March 1, 2025, Victory Capital Services, Inc., an affiliate of the Adviser, replaced Foreside and now serves as Distributor for the Fund pursuant to a Distribution Agreement between the Distributor and the Trust. |
|
| C000139055 |
|
|
| Shareholder Report [Line Items] |
|
|
| Fund Name |
VictoryShares US EQ Income Enhanced Volatility Wtd ETF
|
|
| No Trading Symbol [Flag] |
true
|
|
| Annual or Semi-Annual Statement [Text Block] |
Annual Shareholder Report
|
|
| Shareholder Report Annual or Semi-Annual |
annual shareholder report
|
|
| Additional Information [Text Block] |
You can find additional information about the Fund at advisor.vcm.com/literature/etf-prospectuses. You may also request more information by calling 866-376-7890 or visiting vcm.com/contact-us.
This report describes changes to the Fund that occurred during the period.
|
|
| Additional Information Phone Number |
866-376-7890
|
|
| Additional Information Website |
vcm.com
|
|
| Expenses [Text Block] |
What were the Fund's costs for the last year?(based on a hypothetical $10,000 investment) Fund Name | Costs of a $10,000 Investment | Costs paid as a percentage of a $10,000 Investment |
|---|
US EQ Income Enhanced Volatility Wtd ETF | $37 | 0.35% |
|---|
| | |
|---|
|
|
| Expenses Paid, Amount |
$ 37
|
|
| Expense Ratio, Percent |
0.35%
|
|
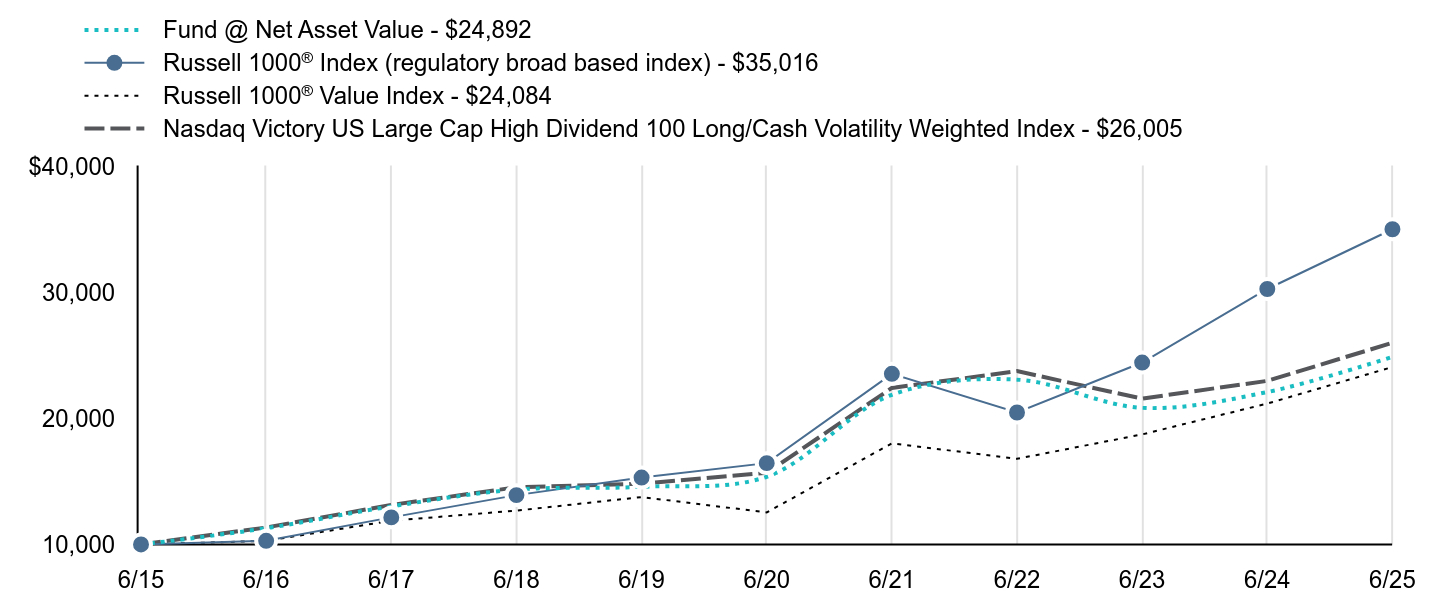
| Factors Affecting Performance [Text Block] |
What affected the Fund’s performance during the last year?Top contributors to performance: The Fund’s underweight allocation to the health care sector, and overweight allocation to the utilities sector, contributed positively to relative performance; and Stock selection in the information technology and health care sectors was a positive contributor to relative performance.
Top detractors from performance: The Fund’s underweight allocation to the industrials sector, and overweight allocation to the energy sector, detracted from relative performance; and Stock selection in the consumer staples and materials sectors detracted from relative performance.
The Fund had a small allocation to derivatives during the period that did not have a material impact on performance. |
|
| Performance Past Does Not Indicate Future [Text] |
The investment return and principal value will fluctuate so that an investor's shares, when redeemed, may be worth more or less than the original cost. Past performance is not a good predictor of the Fund's future performance.
|
|
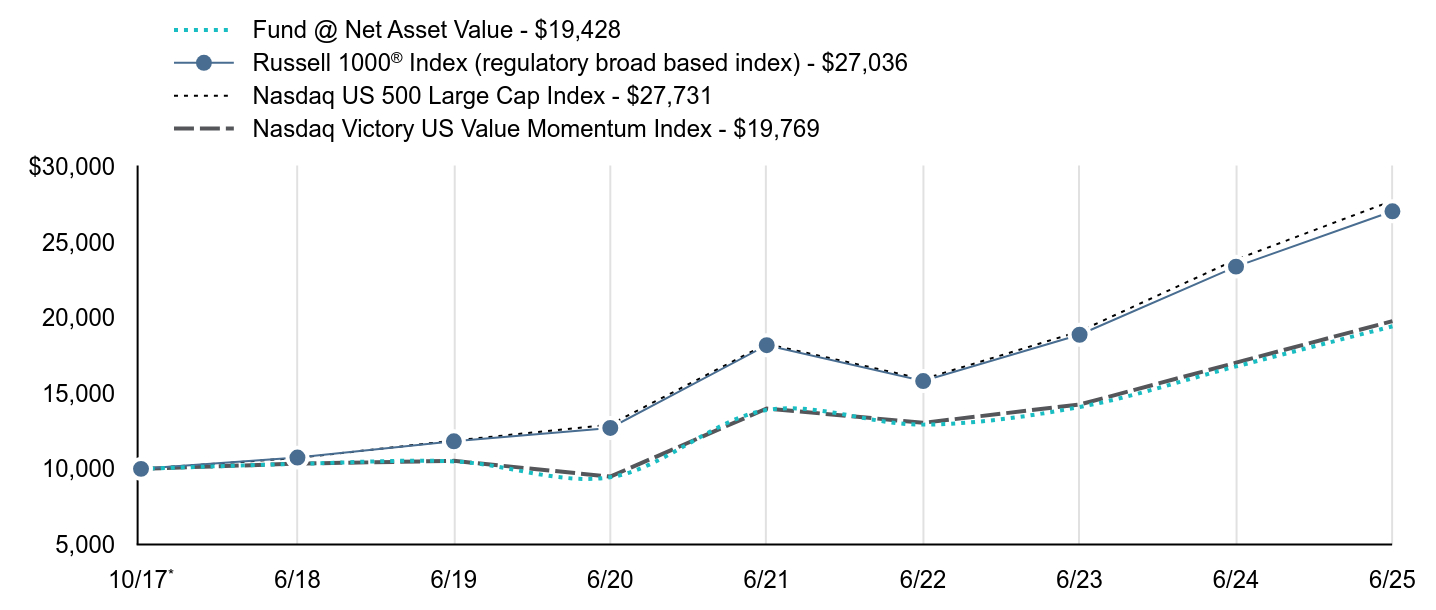
| Line Graph [Table Text Block] |
| Fund @ Net Asset Value - $24,892 | Russell 1000® Index (regulatory broad based index) - $35,016 | Russell 1000® Value Index - $24,084 | Nasdaq Victory US Large Cap High Dividend 100 Long/Cash Volatility Weighted Index - $26,005 |
|---|
6/15 | $10,000 | $10,000 | $10,000 | $10,000 |
|---|
6/16 | $11,289 | $10,293 | $10,286 | $11,346 |
|---|
6/17 | $13,023 | $12,149 | $11,883 | $13,138 |
|---|
6/18 | $14,355 | $13,916 | $12,688 | $14,537 |
|---|
6/19 | $14,574 | $15,310 | $13,762 | $14,825 |
|---|
6/20 | $15,375 | $16,455 | $12,546 | $15,683 |
|---|
6/21 | $21,880 | $23,543 | $18,026 | $22,421 |
|---|
6/22 | $23,080 | $20,474 | $16,797 | $23,755 |
|---|
6/23 | $20,842 | $24,438 | $18,735 | $21,575 |
|---|
6/24 | $22,095 | $30,274 | $21,181 | $22,986 |
|---|
6/25 | $24,892 | $35,016 | $24,084 | $26,005 |
|---|
|
|
| Average Annual Return [Table Text Block] |
| 1 Year | 5 Year | 10 Year |
|---|
Fund @ Net Asset Value | 12.66% | 10.12% | 9.55% |
|---|
Russell 1000® Index | 15.66% | 16.30% | 13.35% |
|---|
Russell 1000® Value Index | 13.70% | 13.93% | 9.19% |
|---|
Nasdaq Victory US Large Cap High Dividend 100 Long/Cash Volatility Weighted Index | 13.14% | 10.64% | 10.03% |
|---|
|
|
| No Deduction of Taxes [Text Block] |
The graph and table total returns do not reflect the deduction of taxes that a shareholder would pay on Fund distributions, or redemption of shares.
|
|
| AssetsNet |
$ 733,712,000
|
|
| Holdings Count | Holding |
102
|
|
| Advisory Fees Paid, Amount |
$ 2,361,000
|
|
| InvestmentCompanyPortfolioTurnover |
45.00%
|
|
| Additional Fund Statistics [Text Block] |
FUND STATISTICS($ amounts in 000s)(as of June 30, 2025)Net Assets | $733,712 |
|---|
Number of Holdings | 102 |
|---|
Investment Advisory Fees | $2,361 |
|---|
Portfolio Turnover | 45% |
|---|
|
|
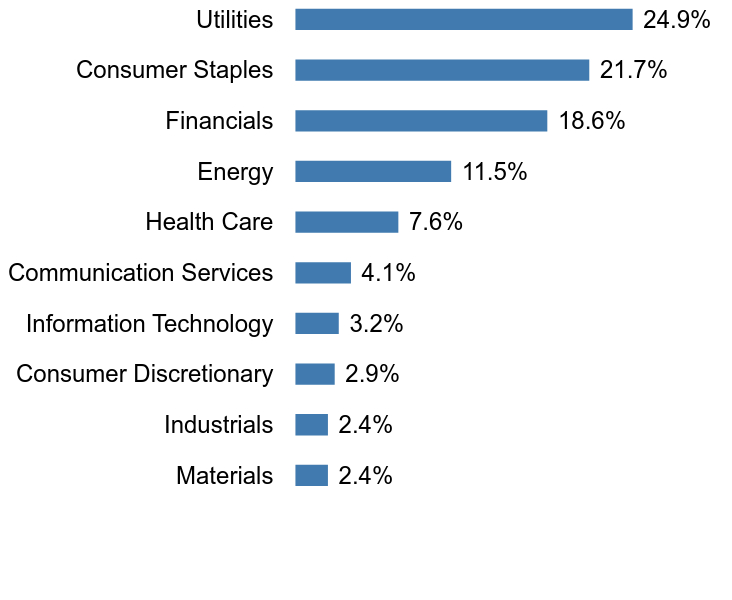
| Holdings [Text Block] |
Top SectorsFootnote Reference* (% of Net Assets)Footnote Reference(as of June 30, 2025)Value | Value |
|---|
Materials | 2.4% | Industrials | 2.4% | Consumer Discretionary | 2.9% | Information Technology | 3.2% | Communication Services | 4.1% | Health Care | 7.6% | Energy | 11.5% | Financials | 18.6% | Consumer Staples | 21.7% | Utilities | 24.9% |
Top 10 HoldingsFootnote Reference* (% of Net Assets)Footnote Reference(as of June 30, 2025)Evergy, Inc. | 1.8% |
|---|
CME Group, Inc. | 1.6% |
|---|
The Coca-Cola Co. | 1.5% |
|---|
WEC Energy Group, Inc. | 1.5% |
|---|
PPL Corp. | 1.4% |
|---|
CMS Energy Corp. | 1.4% |
|---|
Duke Energy Corp. | 1.4% |
|---|
The Southern Co. | 1.4% |
|---|
DTE Energy Co. | 1.4% |
|---|
Johnson & Johnson | 1.4% |
|---|
|
|
| Material Fund Change [Text Block] |
Foreside Fund Services, LLC ("Foreside") served as the Fund’s distributor. Effective March 1, 2025, Victory Capital Services, Inc., an affiliate of Victory Capital Management Inc., replaced Foreside and now serves as Distributor for the Fund pursuant to a Distribution Agreement between the Distributor and the Trust. |
|
| C000243210 |
|
|
| Shareholder Report [Line Items] |
|
|
| Fund Name |
VictoryShares Free Cash Flow ETF
|
|
| No Trading Symbol [Flag] |
true
|
|
| Annual or Semi-Annual Statement [Text Block] |
Annual Shareholder Report
|
|
| Shareholder Report Annual or Semi-Annual |
annual shareholder report
|
|
| Additional Information [Text Block] |
You can find additional information about the Fund at advisor.vcm.com/literature/etf-prospectuses. You may also request more information by calling 866-376-7890 or visiting vcm.com/contact-us.
This report describes changes to the Fund that occurred during the period.
|
|
| Additional Information Phone Number |
866-376-7890
|
|
| Additional Information Website |
vcm.com
|
|
| Expenses [Text Block] |
What were the Fund's costs for the last year?(based on a hypothetical $10,000 investment) Fund Name | Costs of a $10,000 Investment | Costs paid as a percentage of a $10,000 Investment |
|---|
Free Cash Flow ETF | $42 | 0.39% |
|---|
| | |
|---|
|
|
| Expenses Paid, Amount |
$ 42
|
|
| Expense Ratio, Percent |
0.39%
|
|
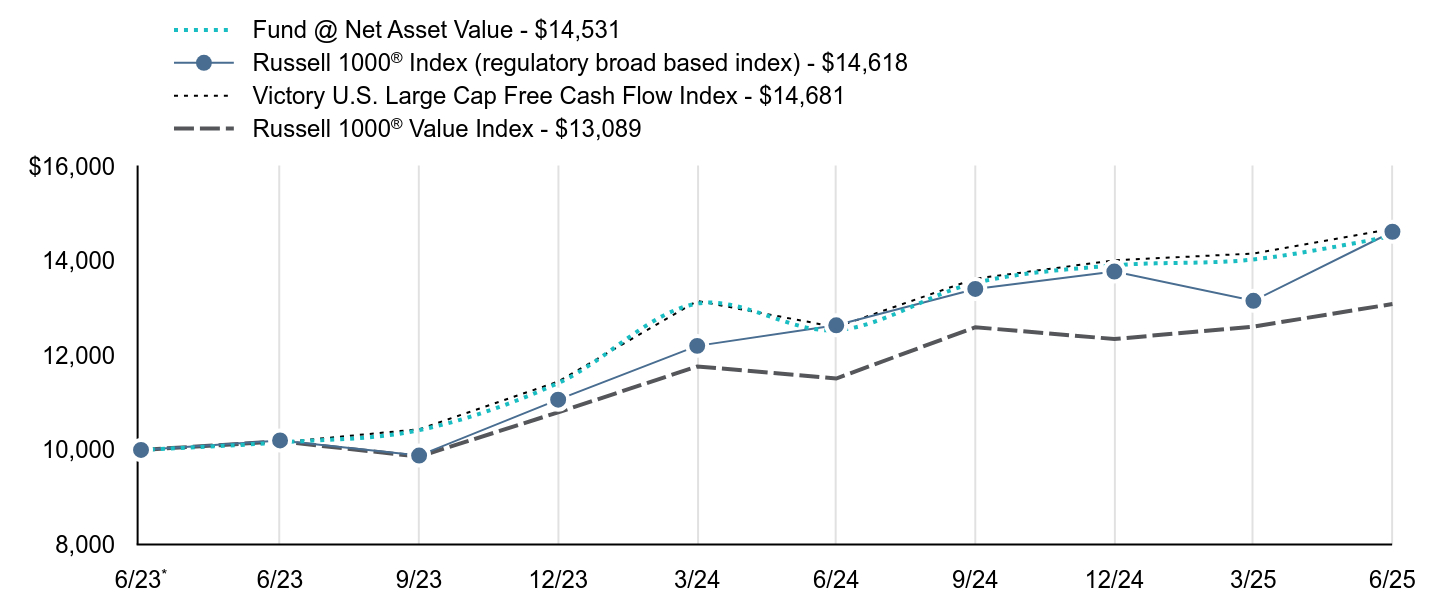
| Factors Affecting Performance [Text Block] |
What affected the Fund’s performance during the last year?Top contributors to performance: The Fund’s overweight allocation to the information technology sector contributed positively to relative performance; and Stock selection in the information technology sector was a positive contributor to relative performance.
Top detractors from performance: The Fund had a small allocation to derivatives during the period that did not have a material impact on performance. |
|
| Performance Past Does Not Indicate Future [Text] |
The investment return and principal value will fluctuate so that an investor's shares, when redeemed, may be worth more or less than the original cost. Past performance is not a good predictor of the Fund's future performance.
|
|
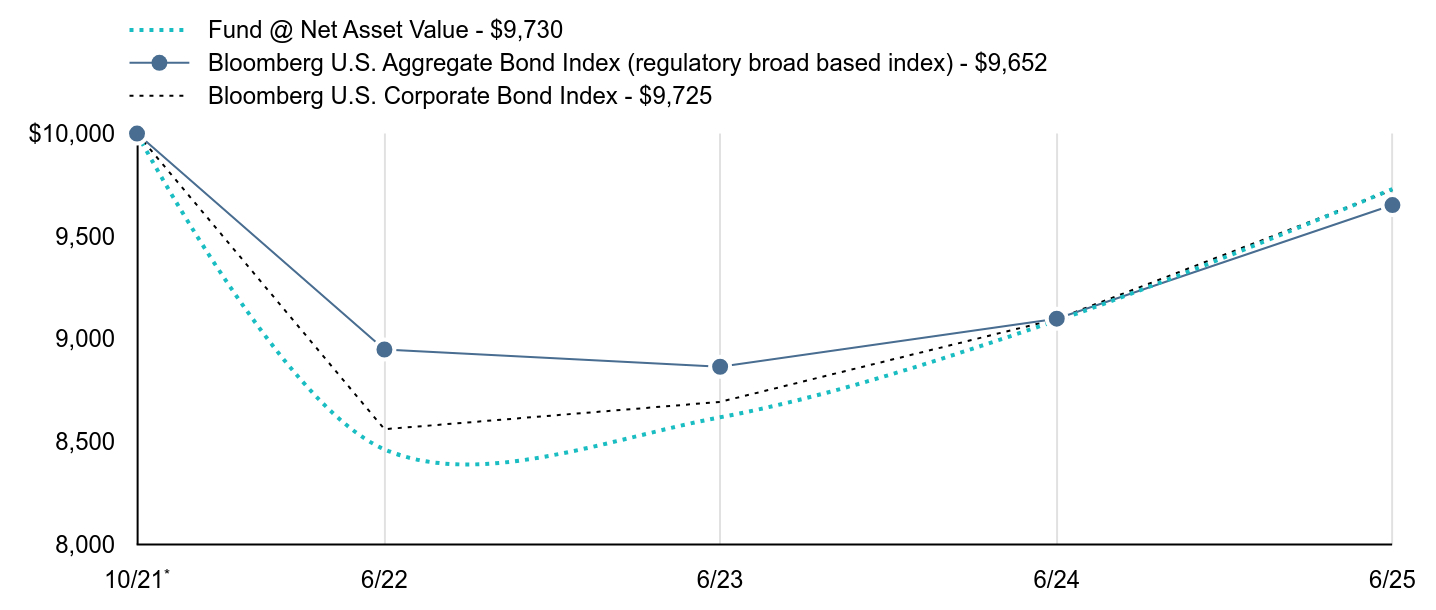
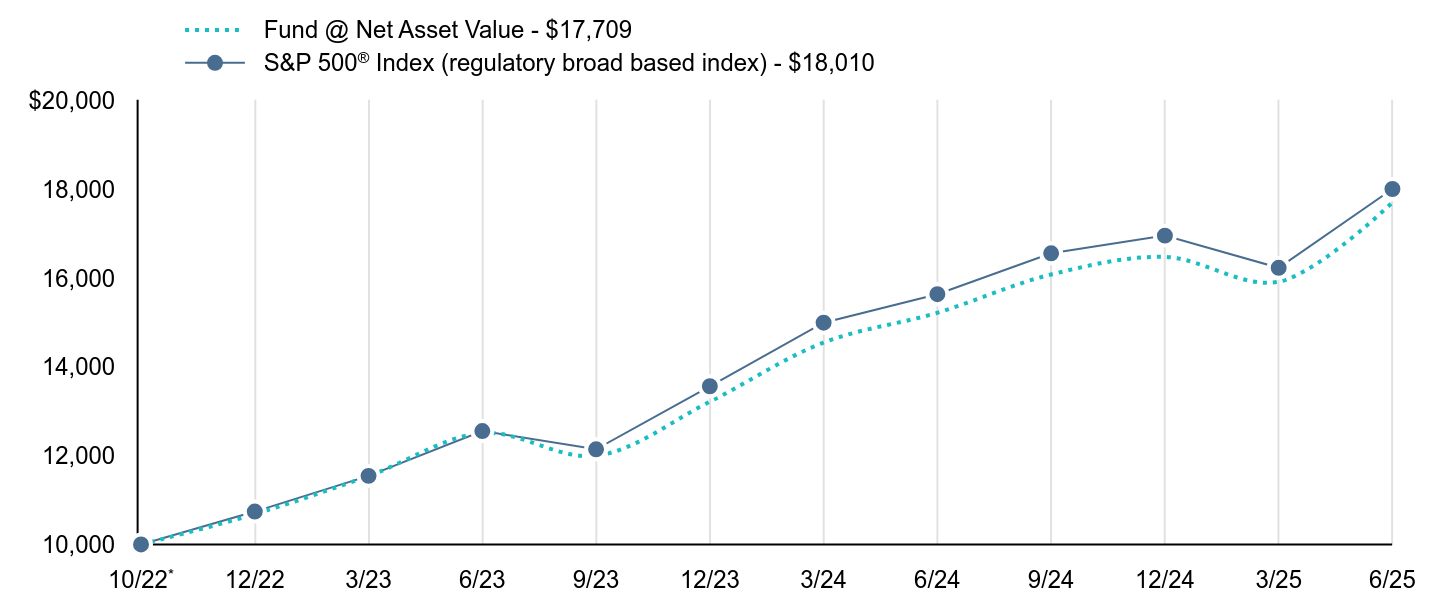
| Line Graph [Table Text Block] |
| Fund @ Net Asset Value - $14,531 | Russell 1000® Index (regulatory broad based index) - $14,618 | Victory U.S. Large Cap Free Cash Flow Index - $14,681 | Russell 1000® Value Index - $13,089 |
|---|
6/23Footnote Reference* | $10,000 | $10,000 | $10,000 | $10,000 |
|---|
6/23 | $10,159 | $10,202 | $10,161 | $10,182 |
|---|
9/23 | $10,419 | $9,881 | $10,438 | $9,860 |
|---|
12/23 | $11,416 | $11,064 | $11,448 | $10,796 |
|---|
3/24 | $13,098 | $12,203 | $13,153 | $11,767 |
|---|
6/24 | $12,535 | $12,638 | $12,599 | $11,512 |
|---|
9/24 | $13,537 | $13,407 | $13,625 | $12,597 |
|---|
12/24 | $13,906 | $13,775 | $14,013 | $12,348 |
|---|
3/25 | $14,031 | $13,157 | $14,158 | $12,611 |
|---|
6/25 | $14,531 | $14,618 | $14,681 | $13,089 |
|---|
|
|
| Average Annual Return [Table Text Block] |
| 1 Year | Since Inception |
|---|
Fund @ Net Asset Value | 15.93%Footnote Reference | 20.27%Footnote Reference |
|---|
Russell 1000® Index | 15.66% | 20.63% |
|---|
Victory U.S. Large Cap Free Cash Flow Index | 16.52% | 20.88% |
|---|
Russell 1000® Value Index | 13.70% | 14.22% |
|---|
|
|
| No Deduction of Taxes [Text Block] |
The graph and table total returns do not reflect the deduction of taxes that a shareholder would pay on Fund distributions, or redemption of shares.
|
|
| AssetsNet |
$ 4,303,779,000
|
|
| Holdings Count | Holding |
51
|
|
| Advisory Fees Paid, Amount |
$ 7,366,000
|
|
| InvestmentCompanyPortfolioTurnover |
142.00%
|
|
| Additional Fund Statistics [Text Block] |
FUND STATISTICS($ amounts in 000s)(as of June 30, 2025)Net Assets | $4,303,779 |
|---|
Number of Holdings | 51 |
|---|
Investment Advisory Fees | $7,366 |
|---|
Portfolio Turnover | 142% |
|---|
|
|
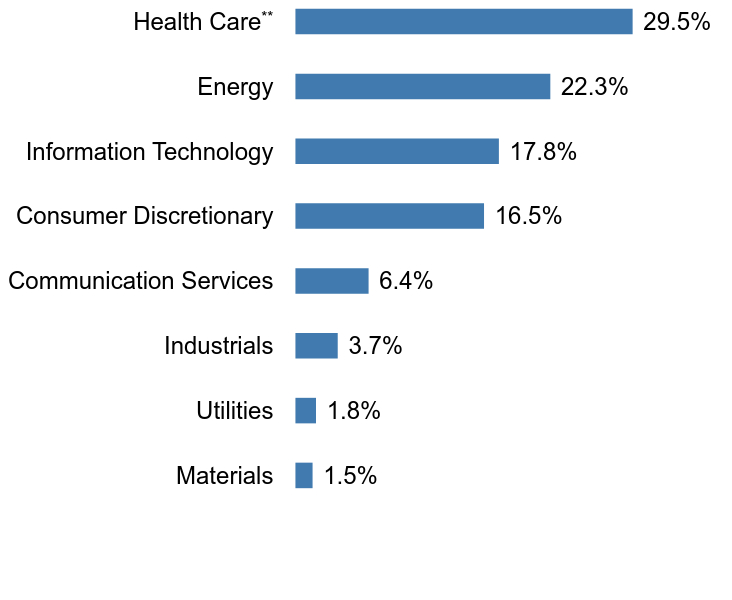
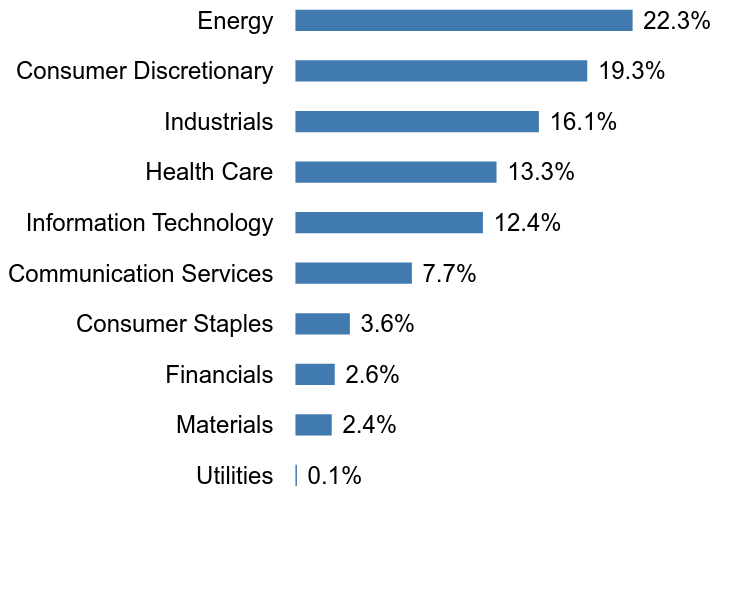
| Holdings [Text Block] |
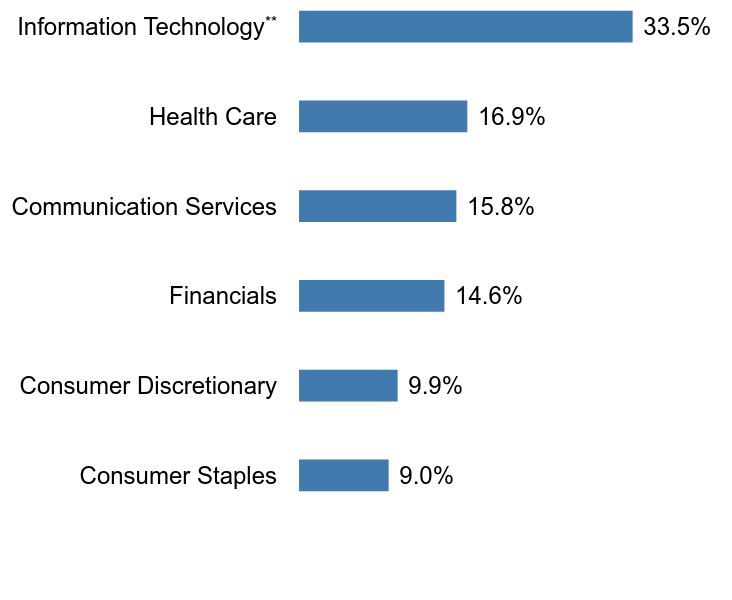
Top SectorsFootnote Reference* (% of Net Assets)Footnote Reference(as of June 30, 2025)Value | Value |
|---|
Materials | 1.5% | Utilities | 1.8% | Industrials | 3.7% | Communication Services | 6.4% | Consumer Discretionary | 16.5% | Information Technology | 17.8% | Energy | 22.3% | Health CareFootnote Reference** | 29.5% |
Top 10 HoldingsFootnote Reference* (% of Net Assets)Footnote Reference(as of June 30, 2025)QUALCOMM, Inc. | 4.0% |
|---|
The Cigna Group | 3.9% |
|---|
UnitedHealth Group, Inc. | 3.7% |
|---|
Merck & Co., Inc. | 3.6% |
|---|
Expedia Group, Inc. | 3.1% |
|---|
Royalty Pharma PLC, Class A | 2.9% |
|---|
Zoom Communications, Inc. | 2.8% |
|---|
Exxon Mobil Corp. | 2.6% |
|---|
Omnicom Group, Inc. | 2.5% |
|---|
Amgen, Inc. | 2.5% |
|---|
|
|
| Material Fund Change [Text Block] |
Foreside Fund Services, LLC ("Foreside") served as the Fund’s distributor. Effective March 1, 2025, Victory Capital Services, Inc., an affiliate of Victory Capital Management Inc., replaced Foreside and now serves as Distributor for the Fund pursuant to a Distribution Agreement between the Distributor and the Trust. |
|
| C000243212 |
|
|
| Shareholder Report [Line Items] |
|
|
| Fund Name |
VictoryShares Small Cap Free Cash Flow ETF
|
|
| No Trading Symbol [Flag] |
true
|
|
| Annual or Semi-Annual Statement [Text Block] |
Annual Shareholder Report
|
|
| Shareholder Report Annual or Semi-Annual |
annual shareholder report
|
|
| Additional Information [Text Block] |
You can find additional information about the Fund at advisor.vcm.com/literature/etf-prospectuses. You may also request more information by calling 866-376-7890 or visiting vcm.com/contact-us.
This report describes changes to the Fund that occurred during the period.
|
|
| Additional Information Phone Number |
866-376-7890
|
|
| Additional Information Website |
vcm.com
|
|
| Expenses [Text Block] |
What were the Fund's costs for the last year?(based on a hypothetical $10,000 investment) Fund Name | Costs of a $10,000 Investment | Costs paid as a percentage of a $10,000 Investment |
|---|
Small Cap Free Cash Flow ETF | $49 | 0.49% |
|---|
| | |
|---|
|
|
| Expenses Paid, Amount |
$ 49
|
|
| Expense Ratio, Percent |
0.49%
|
|
| Factors Affecting Performance [Text Block] |
What affected the Fund’s performance during the last year?Top contributors to performance: The Fund’s overweight allocation to the information technology sector contributed positively to relative performance; and Stock selection in the health care and industrials sectors was a positive contributor to relative performance.
Top detractors from performance: The Fund had a small allocation to derivatives during the period that did not have a material impact on performance. |
|
| Performance Past Does Not Indicate Future [Text] |
The investment return and principal value will fluctuate so that an investor's shares, when redeemed, may be worth more or less than the original cost. Past performance is not a good predictor of the Fund's future performance.
|
|
| Line Graph [Table Text Block] |
| Fund @ Net Asset Value - $10,686 | Russell 3000® Index (regulatory broad based index) - $13,305 | Victory U.S. Small Cap Free Cash Flow Index - $10,808 | Russell 2000® Value Index - $10,653 |
|---|
12/23Footnote Reference* | $10,000 | $10,000 | $10,000 | $10,000 |
|---|
6/24 | $10,483 | $11,540 | $10,533 | $10,095 |
|---|
6/25 | $10,686 | $13,305 | $10,808 | $10,653 |
|---|
|
|
| Average Annual Return [Table Text Block] |
| 1 Year | Since Inception |
|---|
Fund @ Net Asset Value | 1.94% | 4.43% |
|---|
Russell 3000® Index | 15.30% | 20.54% |
|---|
Victory U.S. Small Cap Free Cash Flow Index | 2.61% | 5.22% |
|---|
Russell 2000® Value Index | 5.54% | 4.23% |
|---|
|
|
| No Deduction of Taxes [Text Block] |
The graph and table total returns do not reflect the deduction of taxes that a shareholder would pay on Fund distributions, or redemption of shares.
|
|
| AssetsNet |
$ 281,914,000
|
|
| Holdings Count | Holding |
205
|
|
| Advisory Fees Paid, Amount |
$ 794,000
|
|
| InvestmentCompanyPortfolioTurnover |
125.00%
|
|
| Additional Fund Statistics [Text Block] |
FUND STATISTICS($ amounts in 000s)(as of June 30, 2025)Net Assets | $281,914 |
|---|
Number of Holdings | 205 |
|---|
Investment Advisory Fees | $794 |
|---|
Portfolio Turnover | 125% |
|---|
|
|
| Holdings [Text Block] |
Top SectorsFootnote Reference* (% of Net Assets)Footnote Reference(as of June 30, 2025)Value | Value |
|---|
Utilities | 0.1% | Materials | 2.4% | Financials | 2.6% | Consumer Staples | 3.6% | Communication Services | 7.7% | Information Technology | 12.4% | Health Care | 13.3% | Industrials | 16.1% | Consumer Discretionary | 19.3% | Energy | 22.3% |
Top 10 HoldingsFootnote Reference* (% of Net Assets)Footnote Reference(as of June 30, 2025)Jazz Pharmaceuticals PLC | 1.7% |
|---|
Oscar Health, Inc., Class A | 1.6% |
|---|
Symbotic, Inc. | 1.5% |
|---|
Cal-Maine Foods, Inc. | 1.5% |
|---|
Lyft, Inc., Class A | 1.4% |
|---|
Chord Energy Corp. | 1.4% |
|---|
Core Natural Resources, Inc. | 1.3% |
|---|
Clear Secure, Inc., Class A | 1.2% |
|---|
Toll Brothers, Inc. | 1.2% |
|---|
RingCentral, Inc., Class A | 1.2% |
|---|
|
|
| Material Fund Change [Text Block] |
Foreside Fund Services, LLC ("Foreside") served as the Fund’s distributor. Effective March 1, 2025, Victory Capital Services, Inc., an affiliate of Victory Capital Management Inc., replaced Foreside and now serves as Distributor for the Fund pursuant to a Distribution Agreement between the Distributor and the Trust. |
|
| C000255423 |
|
|
| Shareholder Report [Line Items] |
|
|
| Fund Name |
VictoryShares Free Cash Flow Growth ETF
|
|
| No Trading Symbol [Flag] |
true
|
|
| Annual or Semi-Annual Statement [Text Block] |
Annual Shareholder Report
|
|
| Shareholder Report Annual or Semi-Annual |
annual shareholder report
|
|
| Additional Information [Text Block] |
This report describes changes to the Fund that occurred during the period.
|
|
| Additional Information Phone Number |
866-376-7890
|
|
| Additional Information Website |
vcm.com
|
|
| Expenses [Text Block] |
What were the Fund's costs for the last reporting period?(based on a hypothetical $10,000 investment) Fund Name | Costs of a $10,000 Investment | Costs paid as a percentage of a $10,000 InvestmentFootnote Reference* |
|---|
Free Cash Flow Growth ETF | $23Footnote Reference** | 0.39% |
|---|
| | |
|---|
| Footnote | Description | Footnote* | Annualized | Footnote** | The Fund commenced operations during the reporting period. Expenses for a full reporting period would be higher than the amount shown. |
|
|
| Expenses Paid, Amount |
$ 23
|
[1] |
| Expense Ratio, Percent |
0.39%
|
|
| Factors Affecting Performance [Text Block] |
What affected the Fund’s performance during the last reporting period?Top contributors to performance: The Fund’s overweight allocation to the industrials sector contributed positively to relative performance; and Stock selection in the communication services and consumer discretionary sectors contributed to relative performance.
Top detractors from performance: The Fund had a small allocation to derivatives during the period that did not have a material impact on performance. |
|
| Performance Past Does Not Indicate Future [Text] |
The investment return and principal value will fluctuate so that an investor's shares, when redeemed, may be worth more or less than the original cost. Past performance is not a good predictor of the Fund's future performance.
|
|
| Line Graph [Table Text Block] |
| Fund @ Net Asset Value - $10,518 | Russell 1000® Index (regulatory broad based index) - $10,288 | Russell 1000® Growth Index - $10,546 | Victory US Free Cash Flow Growth Index - $10,560 |
|---|
12/24Footnote Reference* | $10,000 | $10,000 | $10,000 | $10,000 |
|---|
12/24 | $9,514 | $9,694 | $9,941 | $9,516 |
|---|
1/25 | $9,936 | $10,003 | $10,137 | $9,941 |
|---|
2/25 | $9,468 | $9,828 | $9,773 | $9,475 |
|---|
3/25 | $8,679 | $9,259 | $8,950 | $8,689 |
|---|
4/25 | $9,193 | $9,204 | $9,108 | $9,208 |
|---|
5/25 | $10,023 | $9,792 | $9,914 | $10,042 |
|---|
6/25 | $10,518 | $10,288 | $10,546 | $10,560 |
|---|
|
|
| Average Annual Return [Table Text Block] |
| Since Inception |
|---|
Fund @ Net Asset Value | 5.18% |
|---|
Russell 1000® Index | 2.88% |
|---|
Russell 1000® Growth Index | 5.46% |
|---|
Victory US Free Cash Flow Growth Index | 5.60% |
|---|
|
|
| No Deduction of Taxes [Text Block] |
The graph and table total returns do not reflect the deduction of taxes that a shareholder would pay on Fund distributions, or redemption of shares.
|
|
| AssetsNet |
$ 538,630,000
|
|
| Holdings Count | Holding |
101
|
|
| Advisory Fees Paid, Amount |
$ 528,000
|
|
| InvestmentCompanyPortfolioTurnover |
96.00%
|
|
| Additional Fund Statistics [Text Block] |
FUND STATISTICS($ amounts in 000s)(as of June 30, 2025)Net Assets | $538,630 |
|---|
Number of Holdings | 101 |
|---|
Investment Advisory Fees | $528 |
|---|
Portfolio Turnover | 96% |
|---|
|
|
| Holdings [Text Block] |
Top SectorsFootnote Reference* (% of Net Assets)Footnote Reference(as of June 30, 2025)Value | Value |
|---|
Consumer Staples | 2.1% | Health Care | 10.1% | Communication Services | 13.3% | Consumer Discretionary | 18.1% | Industrials | 18.4% | Information TechnologyFootnote Reference** | 37.6% |
Top 10 HoldingsFootnote Reference* (% of Net Assets)Footnote Reference(as of June 30, 2025)Broadcom, Inc. | 4.1% |
|---|
Netflix, Inc. | 3.9% |
|---|
Meta Platforms, Inc., Class A | 3.2% |
|---|
Booking Holdings, Inc. | 2.8% |
|---|
Spotify Technology SA | 2.8% |
|---|
GE Vernova, Inc. | 2.6% |
|---|
AppLovin Corp., Class A | 2.4% |
|---|
DoorDash, Inc., Class A | 2.4% |
|---|
Palantir Technologies, Inc., Class A | 2.1% |
|---|
NVIDIA Corp. | 2.1% |
|---|
|
|
| Material Fund Change [Text Block] |
Foreside Fund Services, LLC ("Foreside") served as the Fund’s distributor. Effective March 1, 2025, Victory Capital Services, Inc., an affiliate of Victory Capital Management Inc., replaced Foreside and now serves as Distributor for the Fund pursuant to a Distribution Agreement between the Distributor and the Trust. |
|
| C000261505 |
|
|
| Shareholder Report [Line Items] |
|
|
| Fund Name |
VictoryShares International Free Cash Flow ETF
|
|
| No Trading Symbol [Flag] |
true
|
|
| Annual or Semi-Annual Statement [Text Block] |
Annual Shareholder Report
|
|
| Shareholder Report Annual or Semi-Annual |
annual shareholder report
|
|
| Additional Information [Text Block] |
|
|
| Additional Information Phone Number |
866-376-7890
|
|
| Additional Information Website |
vcm.com
|
|
| Expenses [Text Block] |
What were the Fund's costs for the last reporting period?(based on a hypothetical $10,000 investment) Fund Name | Costs of a $10,000 Investment | Costs paid as a percentage of a $10,000 InvestmentFootnote Reference* |
|---|
International Free Cash Flow ETF | $1Footnote Reference** | 0.56% |
|---|
| | |
|---|
| Footnote | Description | Footnote* | Annualized | Footnote** | The Fund commenced operations during the reporting period. Expenses for a full reporting period would be higher than the amount shown. |
|
|
| Expenses Paid, Amount |
$ 1
|
[2] |
| Expense Ratio, Percent |
0.56%
|
|
| Performance Past Does Not Indicate Future [Text] |
The investment return and principal value will fluctuate so that an investor's shares, when redeemed, may be worth more or less than the original cost. Past performance is not a good predictor of the Fund's future performance.
|
|
| Material Change Description [Text Block] |
What affected the Fund’s performance during the last reporting period?Given the Fund’s recent commencement of operations (June 26, 2025), there is limited attribution data for this fiscal year. However, during the period referenced, the slight outperformance relative to the Index can be attributed to the Fund’s overweight allocation to the industrials sector, as well as security selection in the materials sector. The Fund’s overweight allocation to the energy sector detracted from relative performance during the period. |
|
| AssetsNet |
$ 11,533,000
|
|
| Holdings Count | Holding |
100
|
|
| Advisory Fees Paid, Amount |
$ 0
|
[3] |
| InvestmentCompanyPortfolioTurnover |
0.00%
|
[4] |
| Additional Fund Statistics [Text Block] |
FUND STATISTICS($ amounts in 000s)(as of June 30, 2025)Net Assets | $11,533 |
|---|
Number of Holdings | 100 |
|---|
Investment Advisory Fees | $-Footnote Reference(a) |
|---|
Portfolio Turnover | -%Footnote Reference* |
|---|
| Footnote | Description | Footnote* | No turnover rate due to the commencement of operations close to the reporting period end.
| Footnote(a) | Rounds to less than $1 thousand. |
|
|
| Holdings [Text Block] |
Top SectorsFootnote Reference* (% of Net Assets)Footnote Reference(as of June 30, 2025)Value | Value |
|---|
Communication Services | 3.1% | Consumer Staples | 4.8% | Health Care | 8.2% | Materials | 8.4% | Information Technology | 8.6% | Consumer Discretionary | 16.2% | Energy | 22.7% | Industrials | 27.3% |
Top 10 HoldingsFootnote Reference* (% of Net Assets)Footnote Reference(as of June 30, 2025)Shell PLC | 4.0% |
|---|
Denso Corp. | 2.4% |
|---|
BP PLC | 2.3% |
|---|
Equinor ASA | 2.2% |
|---|
Shin-Etsu Chemical Co. Ltd. | 1.9% |
|---|
Sanofi SA | 1.8% |
|---|
LVMH Moet Hennessy Louis Vuitton SE | 1.8% |
|---|
Canadian Natural Resources Ltd. | 1.7% |
|---|
Takeda Pharmaceutical Co. Ltd. | 1.7% |
|---|
International Consolidated Airlines Group SA | 1.7% |
|---|
|
|
| Material Fund Change [Text Block] |
|
|
| C000261506 |
|
|
| Shareholder Report [Line Items] |
|
|
| Fund Name |
VictoryShares International Free Cash Flow Growth ETF
|
|
| No Trading Symbol [Flag] |
true
|
|
| Annual or Semi-Annual Statement [Text Block] |
Annual Shareholder Report
|
|
| Shareholder Report Annual or Semi-Annual |
annual shareholder report
|
|
| Additional Information [Text Block] |
|
|
| Additional Information Phone Number |
866-376-7890
|
|
| Additional Information Website |
vcm.com
|
|
| Expenses [Text Block] |
What were the Fund's costs for the last reporting period?(based on a hypothetical $10,000 investment) Fund Name | Costs of a $10,000 Investment | Costs paid as a percentage of a $10,000 InvestmentFootnote Reference* |
|---|
International Free Cash Flow Growth ETF | $1Footnote Reference** | 0.56% |
|---|
| | |
|---|
| Footnote | Description | Footnote* | Annualized | Footnote** | The Fund commenced operations during the reporting period. Expenses for a full reporting period would be higher than the amount shown. |
|
|
| Expenses Paid, Amount |
$ 1
|
[5] |
| Expense Ratio, Percent |
0.56%
|
|
| Performance Past Does Not Indicate Future [Text] |
The investment return and principal value will fluctuate so that an investor's shares, when redeemed, may be worth more or less than the original cost. Past performance is not a good predictor of the Fund's future performance.
|
|
| Material Change Description [Text Block] |
What affected the Fund’s performance during the last reporting period?Given the Fund’s recent commencement of operations (June 26, 2025), there is limited attribution data for this fiscal year. However, during the period referenced, the slight outperformance relative to the Index can be attributed to the Fund’s underweight allocation to the financials sector, as well as the Fund’s overweight allocation to the industrials sector. There were no material detractors during the period. |
|
| AssetsNet |
$ 11,568,000
|
|
| Holdings Count | Holding |
99
|
|
| Advisory Fees Paid, Amount |
$ 0
|
[6] |
| InvestmentCompanyPortfolioTurnover |
0.00%
|
[7] |
| Additional Fund Statistics [Text Block] |
FUND STATISTICS($ amounts in 000s)(as of June 30, 2025)Net Assets | $11,568 |
|---|
Number of Holdings | 99 |
|---|
Investment Advisory Fees | $-Footnote Reference(a) |
|---|
Portfolio Turnover | -%Footnote Reference* |
|---|
| Footnote | Description | Footnote* | No turnover rate due to the commencement of operations close to the reporting period end.
| Footnote(a) | Rounds to less than $1 thousand. |
|
|
| Holdings [Text Block] |
Top SectorsFootnote Reference* (% of Net Assets)Footnote Reference(as of June 30, 2025)Value | Value |
|---|
Consumer Staples | 1.1% | Energy | 2.9% | Materials | 7.3% | Health Care | 7.5% | Communication Services | 7.7% | Consumer Discretionary | 16.7% | Information Technology | 19.2% | Industrials | 37.1% |
Top 10 HoldingsFootnote Reference* (% of Net Assets)Footnote Reference(as of June 30, 2025)Siemens Energy AG | 3.8% |
|---|
Rolls-Royce Holdings PLC | 3.7% |
|---|
Sea Ltd., ADR | 3.3% |
|---|
International Consolidated Airlines Group SA | 3.0% |
|---|
Agnico Eagle Mines Ltd., ADR | 2.6% |
|---|
Rheinmetall AG | 2.5% |
|---|
Novo Nordisk A/S, Class B | 2.3% |
|---|
Kinross Gold Corp. | 2.3% |
|---|
ASML Holding NV | 2.2% |
|---|
Thales SA | 2.1% |
|---|
|
|
| Material Fund Change [Text Block] |
|
|
| C000210928 |
|
|
| Shareholder Report [Line Items] |
|
|
| Fund Name |
VictoryShares Short-Term Bond ETF
|
|
| No Trading Symbol [Flag] |
true
|
|
| Annual or Semi-Annual Statement [Text Block] |
Annual Shareholder Report
|
|
| Shareholder Report Annual or Semi-Annual |
annual shareholder report
|
|
| Additional Information [Text Block] |
You can find additional information about the Fund at advisor.vcm.com/literature/etf-prospectuses. You may also request more information by calling 866-376-7890 or visiting vcm.com/contact-us.
This report describes changes to the Fund that occurred during the period.
|
|
| Additional Information Phone Number |
866-376-7890
|
|
| Additional Information Website |
vcm.com
|
|
| Expenses [Text Block] |
What were the Fund's costs for the last year?(based on a hypothetical $10,000 investment) Fund Name | Costs of a $10,000 Investment | Costs paid as a percentage of a $10,000 Investment |
|---|
Short-Term Bond ETF | $35 | 0.34% |
|---|
| | |
|---|
|
|
| Expenses Paid, Amount |
$ 35
|
|
| Expense Ratio, Percent |
0.34%
|
|
| Factors Affecting Performance [Text Block] |
What affected the Fund’s performance during the last year?The Fund outperformed its benchmark, the Bloomberg 1-3 YR Credit Index (the “Index”). for the 12-month period ending June 30, 2025. The Fund continued to hold a diversified portfolio of primarily investment-grade bonds. Top contributors to performance: Top sectors that outperformed relative to the Index included tobacco, real estate investment trusts, non-agency commercial mortgage-backed securities, property & casualty, and banking. From a credit perspective, while all rating categories contributed to outperformance relative to the Index, the Fund’s allocation to below investment grade, BBB and single A rated bonds performed the best. Security selection and allocation were the biggest drivers of return relative to the Index. The Fund’s duration relative to the Index added slightly to relative performance.
Top detractors from performance: Sectors that underperformed relative to the Index included taxable municipal bonds, Treasuries, independent exploration & production, collateralized mortgage obligations, and chemicals. From a credit perspective, the Fund’s allocation to AA and AAA rated bonds provided the least benefit relative to the Index.
|
|
| Performance Past Does Not Indicate Future [Text] |
The investment return and principal value will fluctuate so that an investor's shares, when redeemed, may be worth more or less than the original cost. Past performance is not a good predictor of the Fund's future performance.
|
|
| Line Graph [Table Text Block] |
| Fund @ Net Asset Value - $12,897 | Bloomberg U.S. Aggregate Bond Index (regulatory broad based index) - $11,189 | Bloomberg 1-3 Year Credit Index - $12,164 |
|---|
10/17Footnote Reference* | $10,000 | $10,000 | $10,000 |
|---|
6/18 | $10,006 | $9,893 | $9,999 |
|---|
6/19 | $10,497 | $10,671 | $10,480 |
|---|
6/20 | $10,922 | $11,604 | $10,933 |
|---|
6/21 | $11,303 | $11,565 | $11,076 |
|---|
6/22 | $10,881 | $10,375 | $10,664 |
|---|
6/23 | $11,242 | $10,278 | $10,812 |
|---|
6/24 | $12,059 | $10,548 | $11,421 |
|---|
6/25 | $12,897 | $11,189 | $12,164 |
|---|
|
|
| Average Annual Return [Table Text Block] |
| 1 Year | 5 Year | Since Inception |
|---|
Fund @ Net Asset Value | 6.95% | 3.38% | 3.37% |
|---|
Bloomberg U.S. Aggregate Bond Index | 6.08% | -0.73% | 1.47% |
|---|
Bloomberg 1-3 Year Credit Index | 6.50% | 2.16% | 2.58% |
|---|
|
|
| No Deduction of Taxes [Text Block] |
The graph and table total returns do not reflect the deduction of taxes that a shareholder would pay on Fund distributions, or redemption of shares.
|
|
| AssetsNet |
$ 1,289,242,000
|
|
| Holdings Count | Holding |
819
|
|
| Advisory Fees Paid, Amount |
$ 2,303,000
|
|
| InvestmentCompanyPortfolioTurnover |
33.00%
|
|
| Additional Fund Statistics [Text Block] |
FUND STATISTICS($ amounts in 000s)(as of June 30, 2025)Net Assets | $1,289,242 |
|---|
Number of Holdings | 819 |
|---|
Investment Advisory Fees | $2,303 |
|---|
Portfolio Turnover | 33% |
|---|
|
|
| Holdings [Text Block] |
Asset AllocationFootnote Reference* ^ (% of Net Assets)(as of June 30, 2025)Value | Value |
|---|
Corporate Bonds | 34.2% | Asset-Backed Securities | 25.9% | U.S. Treasury Obligations | 16.5% | Yankee Dollars | 7.7% | Collateralized Mortgage Obligations | 3.6% | OtherFootnote Reference** | 2.1% |
|
|
| Material Fund Change [Text Block] |
Foreside Fund Services, LLC ("Foreside") served as the Fund’s distributor. Effective March 1, 2025, Victory Capital Services, Inc., an affiliate of Victory Capital Management Inc., replaced Foreside and now serves as Distributor for the Fund pursuant to a Distribution Agreement between the Distributor and the Trust. |
|
| C000210929 |
|
|
| Shareholder Report [Line Items] |
|
|
| Fund Name |
VictoryShares Core Intermediate Bond ETF
|
|
| No Trading Symbol [Flag] |
true
|
|
| Annual or Semi-Annual Statement [Text Block] |
Annual Shareholder Report
|
|
| Shareholder Report Annual or Semi-Annual |
annual shareholder report
|
|
| Additional Information [Text Block] |
You can find additional information about the Fund at advisor.vcm.com/literature/etf-prospectuses. You may also request more information by calling 866-376-7890 or visiting vcm.com/contact-us.
This report describes changes to the Fund that occurred during the period.
|
|
| Additional Information Phone Number |
866-376-7890
|
|
| Additional Information Website |
vcm.com
|
|
| Expenses [Text Block] |
What were the Fund's costs for the last year?(based on a hypothetical $10,000 investment) Fund Name | Costs of a $10,000 Investment | Costs paid as a percentage of a $10,000 Investment |
|---|
Core Intermediate Bond ETF | $39 | 0.38% |
|---|
| | |
|---|
|
|
| Expenses Paid, Amount |
$ 39
|
|
| Expense Ratio, Percent |
0.38%
|
|
| Factors Affecting Performance [Text Block] |
What affected the Fund’s performance during the last year?We believe we have positioned the Fund to be more defensive. This includes a higher allocation to Treasuries, agency mortgage-backed securities, and highly rated asset-backed securities and a reduced allocation to corporate bonds. Top contributors to performance: The Fund’s security selection within corporate bonds was the primary contributor to outperformance. Banking, insurance, food & beverage, health care, and technology were the sub-sectors that contributed most positively to relative performance. The Fund’s overweight to, and security selection within, commercial mortgage-backed securities contributed to relative performance. Security selection in Agency Callable securities contributed to relative performance. The Fund’s overweight allocation to and security selection of BBB-rated securities were the largest credit rating factors that contributed to relative performance.
Top detractors from performance: |
|
| Performance Past Does Not Indicate Future [Text] |
The investment return and principal value will fluctuate so that an investor's shares, when redeemed, may be worth more or less than the original cost. Past performance is not a good predictor of the Fund's future performance.
|
|
| Line Graph [Table Text Block] |
| Fund @ Net Asset Value - $11,787 | Bloomberg U.S. Aggregate Bond Index (regulatory broad based index) - $11,189 |
|---|
10/17Footnote Reference* | $10,000 | $10,000 |
|---|
6/18 | $9,875 | $9,893 |
|---|
6/19 | $10,776 | $10,671 |
|---|
6/20 | $11,604 | $11,604 |
|---|
6/21 | $11,900 | $11,565 |
|---|
6/22 | $10,669 | $10,375 |
|---|
6/23 | $10,682 | $10,278 |
|---|
6/24 | $11,080 | $10,548 |
|---|
6/25 | $11,787 | $11,189 |
|---|
|
|
| Average Annual Return [Table Text Block] |
| 1 Year | 5 Year | Since Inception |
|---|
Fund @ Net Asset Value | 6.38% | 0.31% | 2.16% |
|---|
Bloomberg U.S. Aggregate Bond Index | 6.08% | -0.73% | 1.47% |
|---|
|
|
| No Deduction of Taxes [Text Block] |
The graph and table total returns do not reflect the deduction of taxes that a shareholder would pay on Fund distributions, or redemption of shares.
|
|
| AssetsNet |
$ 2,342,613,000
|
|
| Holdings Count | Holding |
1,128
|
|
| Advisory Fees Paid, Amount |
$ 6,945,000
|
|
| InvestmentCompanyPortfolioTurnover |
19.00%
|
|
| Additional Fund Statistics [Text Block] |
FUND STATISTICS($ amounts in 000s)(as of June 30, 2025)Net Assets | $2,342,613 |
|---|
Number of Holdings | 1,128 |
|---|
Investment Advisory Fees | $6,945 |
|---|
Portfolio Turnover | 19% |
|---|
|
|
| Holdings [Text Block] |
Asset AllocationFootnote Reference* ^ (% of Net Assets)(as of June 30, 2025)Value | Value |
|---|
U.S. Treasury Obligations | 39.3% | Corporate Bonds | 22.4% | U.S. Government Agency Mortgages | 13.3% | Asset-Backed Securities | 13.0% | Collateralized Mortgage Obligations | 5.2% | Yankee Dollars | 5.0% | OtherFootnote Reference** | 1.4% |
|
|
| Material Fund Change [Text Block] |
Foreside Fund Services, LLC ("Foreside") served as the Fund’s distributor. Effective March 1, 2025, Victory Capital Services, Inc., an affiliate of Victory Capital Management Inc., replaced Foreside and now serves as Distributor for the Fund pursuant to a Distribution Agreement between the Distributor and the Trust. |
|
| C000230774 |
|
|
| Shareholder Report [Line Items] |
|
|
| Fund Name |
VictoryShares Core Plus Intermediate Bond ETF
|
|
| No Trading Symbol [Flag] |
true
|
|
| Annual or Semi-Annual Statement [Text Block] |
Annual Shareholder Report
|
|
| Shareholder Report Annual or Semi-Annual |
annual shareholder report
|
|
| Additional Information [Text Block] |
You can find additional information about the Fund at advisor.vcm.com/literature/etf-prospectuses. You may also request more information by calling 866-376-7890 or visiting vcm.com/contact-us.
This report describes changes to the Fund that occurred during the period.
|
|
| Additional Information Phone Number |
866-376-7890
|
|
| Additional Information Website |
vcm.com
|
|
| Expenses [Text Block] |
What were the Fund's costs for the last year?(based on a hypothetical $10,000 investment) Fund Name | Costs of a $10,000 Investment | Costs paid as a percentage of a $10,000 Investment |
|---|
Core Plus Intermediate Bond ETF | $41 | 0.40% |
|---|
| | |
|---|
|
|
| Expenses Paid, Amount |
$ 41
|
|
| Expense Ratio, Percent |
0.40%
|
|
| Factors Affecting Performance [Text Block] |
What affected the Fund’s performance during the last year?We believe we have positioned the Fund to be more defensive. This includes a lower allocation to lower rated corporate and high yield bonds, and a higher allocation to higher rated bonds, Treasuries, and agency residential mortgages-backed securities. The Fund’s performance was driven primarily by security selection and asset allocation. Top contributors to performance: Relative to the Bloomberg U.S. Aggregate Bond Index, our best performing security types and sectors were asset-backed securities, the insurance sector, and the consumer cyclical sector. In addition, an underweight allocation to commercial mortgage-backed securities, equipment asset-backed securities, and other asset-backed securities contributed positively to relative performance.
Top detractors from performance: The Fund had a small allocation to derivatives during the period that did not have a material impact on performance. |
|
| Performance Past Does Not Indicate Future [Text] |
The investment return and principal value will fluctuate so that an investor's shares, when redeemed, may be worth more or less than the original cost. Past performance is not a good predictor of the Fund's future performance.
|
|
| Line Graph [Table Text Block] |
| Fund @ Net Asset Value - $10,081 | Bloomberg U.S. Aggregate Bond Index (regulatory broad based index) - $9,652 |
|---|
10/21Footnote Reference* | $10,000 | $10,000 |
|---|
6/22 | $8,880 | $8,949 |
|---|
6/23 | $9,037 | $8,865 |
|---|
6/24 | $9,431 | $9,099 |
|---|
6/25 | $10,081 | $9,652 |
|---|
|
|
| Average Annual Return [Table Text Block] |
| 1 Year | Since Inception |
|---|
Fund @ Net Asset Value | 6.89% | 0.22% |
|---|
Bloomberg U.S. Aggregate Bond Index | 6.08% | -0.94% |
|---|
|
|
| No Deduction of Taxes [Text Block] |
The graph and table total returns do not reflect the deduction of taxes that a shareholder would pay on Fund distributions, or redemption of shares.
|
|
| AssetsNet |
$ 1,023,207,000
|
|
| Holdings Count | Holding |
1,195
|
|
| Advisory Fees Paid, Amount |
$ 1,921,000
|
|
| InvestmentCompanyPortfolioTurnover |
51.00%
|
|
| Additional Fund Statistics [Text Block] |
FUND STATISTICS($ amounts in 000s)(as of June 30, 2025)Net Assets | $1,023,207 |
|---|
Number of Holdings | 1,195 |
|---|
Investment Advisory Fees | $1,921 |
|---|
Portfolio Turnover | 51% |
|---|
|
|
| Holdings [Text Block] |
Asset AllocationFootnote Reference* ^ (% of Net Assets)(as of June 30, 2025)Value | Value |
|---|
U.S. Treasury Obligations | 22.6% | Corporate Bonds | 18.7% | Asset-Backed Securities | 18.0% | U.S. Government Agency Mortgages | 16.8% | Collateralized Mortgage Obligations | 9.2% | Yankee Dollars | 4.4% | Municipal Bonds | 3.6% | Senior Secured Loans | 2.3% | OtherFootnote Reference** | 0.9% |
|
|
| Material Fund Change [Text Block] |
Foreside Fund Services, LLC ("Foreside") served as the Fund’s distributor. Effective March 1, 2025, Victory Capital Services, Inc., an affiliate of Victory Capital Management Inc., replaced Foreside and now serves as Distributor for the Fund pursuant to a Distribution Agreement between the Distributor and the Trust. |
|
| C000230773 |
|
|
| Shareholder Report [Line Items] |
|
|
| Fund Name |
VictoryShares Corporate Bond ETF
|
|
| No Trading Symbol [Flag] |
true
|
|
| Annual or Semi-Annual Statement [Text Block] |
Annual Shareholder Report
|
|
| Shareholder Report Annual or Semi-Annual |
annual shareholder report
|
|
| Additional Information [Text Block] |
You can find additional information about the Fund at advisor.vcm.com/literature/etf-prospectuses. You may also request more information by calling 866-376-7890 or visiting vcm.com/contact-us.
This report describes changes to the Fund that occurred during the period.
|
|
| Additional Information Phone Number |
866-376-7890
|
|
| Additional Information Website |
vcm.com
|
|
| Expenses [Text Block] |
What were the Fund's costs for the last year?(based on a hypothetical $10,000 investment) Fund Name | Costs of a $10,000 Investment | Costs paid as a percentage of a $10,000 Investment |
|---|
Corporate Bond ETF | $41 | 0.40% |
|---|
| | |
|---|
|
|
| Expenses Paid, Amount |
$ 41
|
|
| Expense Ratio, Percent |
0.40%
|
|
| Factors Affecting Performance [Text Block] |
What affected the Fund’s performance during the last year?We believe we have positioned the Fund to be more defensive. This includes a higher allocation to Treasuries and a lower allocation to high yield and lower-rated corporate bonds. The Fund’s performance was driven primarily by security selection. Top contributors to performance: Relative to the Bloomberg U.S. Corporate Bond Index, the Fund’s best performing sectors included banking, electric utilities and technology. The Fund benefited from an overweight allocation to, and security selection in, BBB-rated securities. Changes in yield across the maturity spectrum throughout the reporting period contributed to relative performance for the Fund.
Top detractors from performance: |
|
| Performance Past Does Not Indicate Future [Text] |
The investment return and principal value will fluctuate so that an investor's shares, when redeemed, may be worth more or less than the original cost. Past performance is not a good predictor of the Fund's future performance.
|
|
| Line Graph [Table Text Block] |
| Fund @ Net Asset Value - $9,730 | Bloomberg U.S. Aggregate Bond Index (regulatory broad based index) - $9,652 | Bloomberg U.S. Corporate Bond Index - $9,725 |
|---|
10/21Footnote Reference* | $10,000 | $10,000 | $10,000 |
|---|
6/22 | $8,463 | $8,949 | $8,561 |
|---|
6/23 | $8,619 | $8,865 | $8,694 |
|---|
6/24 | $9,090 | $9,099 | $9,097 |
|---|
6/25 | $9,730 | $9,652 | $9,725 |
|---|
|
|
| Average Annual Return [Table Text Block] |
| 1 Year | Since Inception |
|---|
Fund @ Net Asset Value | 7.05% | -0.73% |
|---|
Bloomberg U.S. Aggregate Bond Index | 6.08% | -0.94% |
|---|
Bloomberg U.S. Corporate Bond Index | 6.91% | -0.74% |
|---|
|
|
| No Deduction of Taxes [Text Block] |
The graph and table total returns do not reflect the deduction of taxes that a shareholder would pay on Fund distributions, or redemption of shares.
|
|
| AssetsNet |
$ 139,979,000
|
|
| Holdings Count | Holding |
416
|
|
| Advisory Fees Paid, Amount |
$ 482,000
|
|
| InvestmentCompanyPortfolioTurnover |
16.00%
|
|
| Additional Fund Statistics [Text Block] |
FUND STATISTICS($ amounts in 000s)(as of June 30, 2025)Net Assets | $139,979 |
|---|
Number of Holdings | 416 |
|---|
Investment Advisory Fees | $482 |
|---|
Portfolio Turnover | 16% |
|---|
|
|
| Holdings [Text Block] |
Asset AllocationFootnote Reference* ^ (% of Net Assets)(as of June 30, 2025)Value | Value |
|---|
Corporate Bonds | 77.9% | Yankee Dollars | 16.6% | U.S. Treasury Obligations | 3.9% |
|
|
| Material Fund Change [Text Block] |
Foreside Fund Services, LLC ("Foreside") served as the Fund’s distributor. Effective March 1, 2025, Victory Capital Services, Inc., an affiliate of Victory Capital Management Inc., replaced Foreside and now serves as Distributor for the Fund pursuant to a Distribution Agreement between the Distributor and the Trust. |
|
| C000250755 |
|
|
| Shareholder Report [Line Items] |
|
|
| Fund Name |
VictoryShares WestEnd Economic Cycle Bond ETF
|
|
| No Trading Symbol [Flag] |
true
|
|
| Annual or Semi-Annual Statement [Text Block] |
Annual Shareholder Report
|
|
| Shareholder Report Annual or Semi-Annual |
annual shareholder report
|
|
| Additional Information [Text Block] |
You can find additional information about the Fund at advisor.vcm.com/literature/etf-prospectuses. You may also request more information by calling 866-376-7890 or visiting vcm.com/contact-us.
This report describes changes to the Fund that occurred during the period.
|
|
| Additional Information Phone Number |
866-376-7890
|
|
| Additional Information Website |
vcm.com
|
|
| Expenses [Text Block] |
What were the Fund's costs for the last year?(based on a hypothetical $10,000 investment) Fund Name | Costs of a $10,000 Investment | Costs paid as a percentage of a $10,000 Investment |
|---|
WestEnd Economic Cycle Bond ETF | $41 | 0.40% |
|---|
| | |
|---|
|
|
| Expenses Paid, Amount |
$ 41
|
|
| Expense Ratio, Percent |
0.40%
|
|
| Factors Affecting Performance [Text Block] |
What affected the Fund’s performance during the last year?We believe we have positioned the Fund for a maturing economic cycle, with moderate economic activity and an increase in economic and trade policy uncertainty. Top contributors to performance: Top detractors from performance: |
|
| Performance Past Does Not Indicate Future [Text] |
The investment return and principal value will fluctuate so that an investor's shares, when redeemed, may be worth more or less than the original cost. Past performance is not a good predictor of the Fund's future performance.
|
|
| Line Graph [Table Text Block] |
| WestEnd Economic Cycle Bond ETF - $10,467 | Bloomberg U.S. Aggregate Bond Index (regulatory broad based index) - $10,541 | Bloomberg U.S. Government/Credit Bond Index - $10,529 |
|---|
6/24Footnote Reference* | $10,000 | $10,000 | $10,000 |
|---|
6/24 | $9,929 | $9,937 | $9,943 |
|---|
9/24 | $10,478 | $10,453 | $10,451 |
|---|
12/24 | $10,055 | $10,133 | $10,129 |
|---|
3/25 | $10,355 | $10,415 | $10,402 |
|---|
6/25 | $10,467 | $10,541 | $10,529 |
|---|
|
|
| Average Annual Return [Table Text Block] |
| 1 Year | Since Inception |
|---|
Fund @ Net Asset Value | 5.42% | 4.55% |
|---|
Bloomberg U.S. Aggregate Bond Index | 6.08% | 5.26% |
|---|
Bloomberg U.S. Government/Credit Bond Index | 5.89% | 5.14% |
|---|
|
|
| No Deduction of Taxes [Text Block] |
The graph and table total returns do not reflect the deduction of taxes that a shareholder would pay on Fund distributions, or redemption of shares.
|
|
| AssetsNet |
$ 113,378,000
|
|
| Holdings Count | Holding |
424
|
|
| Advisory Fees Paid, Amount |
$ 229,000
|
|
| InvestmentCompanyPortfolioTurnover |
35.00%
|
|
| Additional Fund Statistics [Text Block] |
FUND STATISTICS($ amounts in 000s)(as of June 30, 2025)Net Assets | $113,378 |
|---|
Number of Holdings | 424 |
|---|
Investment Advisory Fees | $229 |
|---|
Portfolio Turnover | 35% |
|---|
|
|
| Holdings [Text Block] |
Asset AllocationFootnote Reference* ^ (% of Net Assets)(as of June 30, 2025)Value | Value |
|---|
U.S. Treasury Obligations | 62.1% | Corporate Bonds | 31.7% | Yankee Dollars | 4.9% |
|
|
| Material Fund Change [Text Block] |
Foreside Fund Services, LLC ("Foreside") served as the Fund’s distributor. Effective March 1, 2025, Victory Capital Services, Inc., an affiliate of Victory Capital Management Inc., replaced Foreside and now serves as Distributor for the Fund pursuant to a Distribution Agreement between the Distributor and the Trust. |
|
| C000261507 |
|
|
| Shareholder Report [Line Items] |
|
|
| Fund Name |
VictoryShares Pioneer Asset-Based Income ETF
|
|
| No Trading Symbol [Flag] |
true
|
|
| Annual or Semi-Annual Statement [Text Block] |
Annual Shareholder Report
|
|
| Shareholder Report Annual or Semi-Annual |
annual shareholder report
|
|
| Additional Information [Text Block] |
|
|
| Additional Information Phone Number |
866-376-7890
|
|
| Additional Information Website |
vcm.com
|
|
| Expenses [Text Block] |
What were the Fund's costs for the last reporting period?(based on a hypothetical $10,000 investment) Fund Name | Costs of a $10,000 Investment | Costs paid as a percentage of a $10,000 InvestmentFootnote Reference* |
|---|
Pioneer Asset-Based Income ETF | $1Footnote Reference** | 0.70% |
|---|
| | |
|---|
| Footnote | Description | Footnote* | Annualized | Footnote** | The Fund commenced operations during the reporting period. Expenses for a full reporting period would be higher than the amount shown. |
|
|
| Expenses Paid, Amount |
$ 1
|
[8] |
| Expense Ratio, Percent |
0.70%
|
|
| Performance Past Does Not Indicate Future [Text] |
The investment return and principal value will fluctuate so that an investor's shares, when redeemed, may be worth more or less than the original cost. Past performance is not a good predictor of the Fund's future performance.
|
|
| AssetsNet |
$ 2,501,000
|
|
| Holdings Count | Holding |
2
|
|
| Advisory Fees Paid, Amount |
$ 0
|
[9] |
| InvestmentCompanyPortfolioTurnover |
0.00%
|
[10] |
| Additional Fund Statistics [Text Block] |
FUND STATISTICS($ amounts in 000s)(as of June 30, 2025)Net Assets | $2,501 |
|---|
Number of Holdings | 2 |
|---|
Investment Advisory Fees | $-Footnote Reference(a) |
|---|
Portfolio Turnover | -%Footnote Reference* |
|---|
| Footnote | Description | Footnote* | No turnover rate due to the commencement of operations close to the reporting period end.
| Footnote(a) | Rounds to less than $1 thousand. |
|
|
| Holdings [Text Block] |
Asset AllocationFootnote Reference* ^ (% of Net Assets)(as of June 30, 2025)Value | Value |
|---|
U.S. Treasury Obligations | 59.9% |
|
|
| Material Fund Change [Text Block] |
|
|
| C000210925 |
|
|
| Shareholder Report [Line Items] |
|
|
| Fund Name |
VictoryShares US Value Momentum ETF
|
|
| No Trading Symbol [Flag] |
true
|
|
| Annual or Semi-Annual Statement [Text Block] |
Annual Shareholder Report
|
|
| Shareholder Report Annual or Semi-Annual |
annual shareholder report
|
|
| Additional Information [Text Block] |
You can find additional information about the Fund at advisor.vcm.com/literature/etf-prospectuses. You may also request more information by calling 866-376-7890 or visiting vcm.com/contact-us.
This report describes changes to the Fund that occurred during the period.
|
|
| Additional Information Phone Number |
866-376-7890
|
|
| Additional Information Website |
vcm.com
|
|
| Expenses [Text Block] |
What were the Fund's costs for the last year?(based on a hypothetical $10,000 investment) Fund Name | Costs of a $10,000 Investment | Costs paid as a percentage of a $10,000 Investment |
|---|
US Value Momentum ETF | $22 | 0.20% |
|---|
| | |
|---|
|
|
| Expenses Paid, Amount |
$ 22
|
|
| Expense Ratio, Percent |
0.20%
|
|
| Factors Affecting Performance [Text Block] |
What affected the Fund’s performance during the last year?Top contributors to performance: The Fund’s overweight allocation to the financials sector contributed positively to relative performance; and Stock selection in the consumer staples sector was a positive contributor to relative performance.
Top detractors from performance: The Fund’s overweight allocation to the materials sector detracted from relative performance; and Stock selection in the industrials and consumer discretionary sectors detracted from relative performance.
The Fund had a small allocation to derivatives during the period that did not have a material impact on performance. |
|
| Performance Past Does Not Indicate Future [Text] |
The investment return and principal value will fluctuate so that an investor's shares, when redeemed, may be worth more or less than the original cost. Past performance is not a good predictor of the Fund's future performance.
|
|
| Line Graph [Table Text Block] |
| Fund @ Net Asset Value - $19,428 | Russell 1000® Index (regulatory broad based index) - $27,036 | Nasdaq US 500 Large Cap Index - $27,731 | Nasdaq Victory US Value Momentum Index - $19,769 |
|---|
10/17Footnote Reference* | $10,000 | $10,000 | $10,000 | $10,000 |
|---|
6/18 | $10,330 | $10,745 | $10,721 | $10,346 |
|---|
6/19 | $10,491 | $11,821 | $11,870 | $10,530 |
|---|
6/20 | $9,448 | $12,705 | $12,928 | $9,488 |
|---|
6/21 | $13,890 | $18,178 | $18,266 | $13,991 |
|---|
6/22 | $12,926 | $15,808 | $15,934 | $13,045 |
|---|
6/23 | $14,088 | $18,869 | $19,093 | $14,254 |
|---|
6/24 | $16,775 | $23,375 | $23,844 | $17,022 |
|---|
6/25 | $19,428 | $27,036 | $27,731 | $19,769 |
|---|
|
|
| Average Annual Return [Table Text Block] |
| 1 Year | 5 Year | Since Inception |
|---|
Fund @ Net Asset Value | 15.81%Footnote Reference | 15.51%Footnote Reference | 9.03% |
|---|
Russell 1000® Index | 15.66% | 16.30% | 13.82% |
|---|
Nasdaq US 500 Large Cap Index | 16.30% | 16.49% | 14.20% |
|---|
Nasdaq Victory US Value Momentum Index | 16.14% | 15.81% | 9.28% |
|---|
|
|
| No Deduction of Taxes [Text Block] |
The graph and table total returns do not reflect the deduction of taxes that a shareholder would pay on Fund distributions, or redemption of shares.
|
|
| AssetsNet |
$ 166,121,000
|
|
| Holdings Count | Holding |
126
|
|
| Advisory Fees Paid, Amount |
$ 234,000
|
|
| InvestmentCompanyPortfolioTurnover |
95.00%
|
|
| Additional Fund Statistics [Text Block] |
FUND STATISTICS($ amounts in 000s)(as of June 30, 2025)Net Assets | $166,121 |
|---|
Number of Holdings | 126 |
|---|
Investment Advisory Fees | $234 |
|---|
Portfolio Turnover | 95% |
|---|
|
|
| Holdings [Text Block] |
Top SectorsFootnote Reference* (% of Net Assets)Footnote Reference(as of June 30, 2025)Value | Value |
|---|
Materials | 3.9% | Consumer Discretionary | 5.8% | Real Estate | 6.4% | Communication Services | 7.2% | Utilities | 8.1% | Consumer Staples | 8.3% | Industrials | 9.4% | Health Care | 12.4% | Information Technology | 14.1% | Financials | 21.0% |
Top 10 HoldingsFootnote Reference* (% of Net Assets)Footnote Reference(as of June 30, 2025)Atmos Energy Corp. | 1.3% |
|---|
CenterPoint Energy, Inc. | 1.2% |
|---|
The TJX Cos., Inc. | 1.2% |
|---|
Duke Energy Corp. | 1.2% |
|---|
CME Group, Inc. | 1.2% |
|---|
VICI Properties, Inc. | 1.2% |
|---|
NiSource, Inc. | 1.2% |
|---|
Ameren Corp. | 1.2% |
|---|
Exelon Corp. | 1.2% |
|---|
Abbott Laboratories | 1.1% |
|---|
|
|
| Material Fund Change [Text Block] |
Foreside Fund Services, LLC ("Foreside") served as the Fund’s distributor. Effective March 1, 2025, Victory Capital Services, Inc., an affiliate of Victory Capital Management Inc., replaced Foreside and now serves as Distributor for the Fund pursuant to a Distribution Agreement between the Distributor and the Trust. |
|
| C000210930 |
|
|
| Shareholder Report [Line Items] |
|
|
| Fund Name |
VictoryShares US Small Mid Cap Value Momentum ETF
|
|
| No Trading Symbol [Flag] |
true
|
|
| Annual or Semi-Annual Statement [Text Block] |
Annual Shareholder Report
|
|
| Shareholder Report Annual or Semi-Annual |
annual shareholder report
|
|
| Additional Information [Text Block] |
You can find additional information about the Fund at advisor.vcm.com/literature/etf-prospectuses. You may also request more information by calling 866-376-7890 or visiting vcm.com/contact-us.
This report describes changes to the Fund that occurred during the period.
|
|
| Additional Information Phone Number |
866-376-7890
|
|
| Additional Information Website |
vcm.com
|
|
| Expenses [Text Block] |
What were the Fund's costs for the last year?(based on a hypothetical $10,000 investment) Fund Name | Costs of a $10,000 Investment | Costs paid as a percentage of a $10,000 Investment |
|---|
US Small Mid Cap Value Momentum ETF | $26 | 0.25% |
|---|
| | |
|---|
|
|
| Expenses Paid, Amount |
$ 26
|
|
| Expense Ratio, Percent |
0.25%
|
|
| Factors Affecting Performance [Text Block] |
What affected the Fund’s performance during the last year?Top contributors to performance: The Fund’s overweight allocation to the real estate and utilities sectors contributed positively to relative performance; and Stock selection in the industrials sector was a positive contributor to relative performance.
Top detractors from performance: In addition, the Fund's employment of a derivatives strategy overlay to efficiently manage the overall portfolio risks associated with the Fund's strategy contributed negatively to performance during the year. |
|
| Performance Past Does Not Indicate Future [Text] |
The investment return and principal value will fluctuate so that an investor's shares, when redeemed, may be worth more or less than the original cost. Past performance is not a good predictor of the Fund's future performance.
|
|
| Line Graph [Table Text Block] |
| Fund @ Net Asset Value - $18,789 | Russell 3000® Index (regulatory broad based index) - $26,215 | Nasdaq US 1300 Small Mid Cap Index - $19,042 | Nasdaq Victory US Small Mid Cap Value Momentum Index - $19,303 |
|---|
10/17Footnote Reference* | $10,000 | $10,000 | $10,000 | $10,000 |
|---|
6/18 | $10,842 | $10,768 | $11,029 | $10,873 |
|---|
6/19 | $10,417 | $11,736 | $11,073 | $10,471 |
|---|
6/20 | $9,453 | $12,502 | $10,388 | $9,531 |
|---|
6/21 | $15,169 | $18,024 | $16,787 | $15,333 |
|---|
6/22 | $12,858 | $15,524 | $13,272 | $13,031 |
|---|
6/23 | $14,444 | $18,467 | $15,520 | $14,712 |
|---|
6/24 | $17,010 | $22,737 | $17,487 | $17,402 |
|---|
6/25 | $18,789 | $26,215 | $19,042 | $19,303 |
|---|
|
|
| Average Annual Return [Table Text Block] |
| 1 Year | 5 Year | Since Inception |
|---|
Fund @ Net Asset Value | 10.46% | 14.73% | 8.56% |
|---|
Russell 3000® Index | 15.30% | 15.96% | 13.37% |
|---|
Nasdaq US 1300 Small Mid Cap Index | 8.89% | 12.89% | 8.75% |
|---|
Nasdaq Victory US Small Mid Cap Value Momentum Index | 10.92% | 15.16% | 8.94% |
|---|
|
|
| No Deduction of Taxes [Text Block] |
The graph and table total returns do not reflect the deduction of taxes that a shareholder would pay on Fund distributions, or redemption of shares.
|
|
| AssetsNet |
$ 953,774,000
|
|
| Holdings Count | Holding |
295
|
|
| Advisory Fees Paid, Amount |
$ 808,000
|
|
| InvestmentCompanyPortfolioTurnover |
112.00%
|
|
| Additional Fund Statistics [Text Block] |
FUND STATISTICS($ amounts in 000s)(as of June 30, 2025)Net Assets | $953,774 |
|---|
Number of Holdings | 295 |
|---|
Investment Advisory Fees | $808 |
|---|
Portfolio Turnover | 112% |
|---|
|
|
| Holdings [Text Block] |
Top SectorsFootnote Reference* (% of Net Assets)Footnote Reference(as of June 30, 2025)Value | Value |
|---|
Communication Services | 4.0% | Energy | 4.5% | Consumer Staples | 4.8% | Utilities | 6.0% | Real Estate | 8.1% | Information Technology | 9.3% | Consumer Discretionary | 11.8% | Industrials | 13.1% | Financials | 15.6% | Health Care | 19.1% |
Top 10 HoldingsFootnote Reference* (% of Net Assets)Footnote Reference(as of June 30, 2025)Innoviva, Inc. | 0.8% |
|---|
Evergy, Inc. | 0.8% |
|---|
Pinnacle West Capital Corp. | 0.7% |
|---|
Agree Realty Corp. | 0.7% |
|---|
OGE Energy Corp. | 0.7% |
|---|
Post Holdings, Inc. | 0.6% |
|---|
Dynex Capital, Inc. | 0.6% |
|---|
Avista Corp. | 0.6% |
|---|
Enact Holdings, Inc. | 0.6% |
|---|
Black Hills Corp. | 0.6% |
|---|
|
|
| Material Fund Change [Text Block] |
Foreside Fund Services, LLC ("Foreside") served as the Fund’s distributor. Effective March 1, 2025, Victory Capital Services, Inc., an affiliate of Victory Capital Management Inc., replaced Foreside and now serves as Distributor for the Fund pursuant to a Distribution Agreement between the Distributor and the Trust. |
|
| C000210926 |
|
|
| Shareholder Report [Line Items] |
|
|
| Fund Name |
VictoryShares International Value Momentum ETF
|
|
| No Trading Symbol [Flag] |
true
|
|
| Annual or Semi-Annual Statement [Text Block] |
Annual Shareholder Report
|
|
| Shareholder Report Annual or Semi-Annual |
annual shareholder report
|
|
| Additional Information [Text Block] |
You can find additional information about the Fund at advisor.vcm.com/literature/etf-prospectuses. You may also request more information by calling 866-376-7890 or visiting vcm.com/contact-us.
This report describes changes to the Fund that occurred during the period.
|
|
| Additional Information Phone Number |
866-376-7890
|
|
| Additional Information Website |
vcm.com
|
|
| Expenses [Text Block] |
What were the Fund's costs for the last year?(based on a hypothetical $10,000 investment) Fund Name | Costs of a $10,000 Investment | Costs paid as a percentage of a $10,000 Investment |
|---|
International Value Momentum ETF | $40 | 0.35% |
|---|
| | |
|---|
|
|
| Expenses Paid, Amount |
$ 40
|
|
| Expense Ratio, Percent |
0.35%
|
|
| Factors Affecting Performance [Text Block] |
What affected the Fund’s performance during the last year?Top contributors to performance: The Fund’s underweight allocation to the health care sector contributed positively to relative performance; and Stock selection in the financials and health care sectors was a positive contributor to relative performance.
Top detractors from performance: The Fund had a small allocation to derivatives during the period that did not have a material impact on performance. |
|
| Performance Past Does Not Indicate Future [Text] |
The investment return and principal value will fluctuate so that an investor's shares, when redeemed, may be worth more or less than the original cost. Past performance is not a good predictor of the Fund's future performance.
|
|
| Line Graph [Table Text Block] |
| Fund @ Net Asset Value - $15,146 | MSCI All Country World Index (regulatory broad based index) - $21,180 | Nasdaq DM Ex United States Large Mid Cap Index - $16,190 | Nasdaq Victory International Value Momentum Index - $15,616 |
|---|
10/17Footnote Reference* | $10,000 | $10,000 | $10,000 | $10,000 |
|---|
6/18 | $9,782 | $10,345 | $9,986 | $9,809 |
|---|
6/19 | $9,402 | $10,940 | $10,036 | $9,449 |
|---|
6/20 | $8,234 | $11,170 | $9,580 | $8,299 |
|---|
6/21 | $10,923 | $15,556 | $12,886 | $11,060 |
|---|
6/22 | $9,163 | $13,106 | $10,575 | $9,309 |
|---|
6/23 | $10,308 | $15,273 | $12,395 | $10,540 |
|---|
6/24 | $11,732 | $18,232 | $13,748 | $12,047 |
|---|
6/25 | $15,146 | $21,180 | $16,190 | $15,616 |
|---|
|
|
| Average Annual Return [Table Text Block] |
| 1 Year | 5 Year | Since Inception |
|---|
Fund @ Net Asset Value | 29.09%Footnote Reference | 12.96% | 5.55% |
|---|
MSCI All Country World Index | 16.17% | 13.65% | 10.26% |
|---|
Nasdaq DM Ex United States Large Mid Cap Index | 17.76% | 11.06% | 6.47% |
|---|
Nasdaq Victory International Value Momentum Index | 29.62% | 13.48% | 5.97% |
|---|
|
|
| No Deduction of Taxes [Text Block] |
The graph and table total returns do not reflect the deduction of taxes that a shareholder would pay on Fund distributions, or redemption of shares.
|
|
| AssetsNet |
$ 264,953,000
|
|
| Holdings Count | Holding |
191
|
|
| Advisory Fees Paid, Amount |
$ 584,000
|
|
| InvestmentCompanyPortfolioTurnover |
99.00%
|
|
| Additional Fund Statistics [Text Block] |
FUND STATISTICS($ amounts in 000s)(as of June 30, 2025)Net Assets | $264,953 |
|---|
Number of Holdings | 191 |
|---|
Investment Advisory Fees | $584 |
|---|
Portfolio Turnover | 99% |
|---|
|
|
| Holdings [Text Block] |
Top SectorsFootnote Reference* (% of Net Assets)Footnote Reference(as of June 30, 2025)Value | Value |
|---|
Health Care | 5.1% | Energy | 5.6% | Utilities | 5.8% | Real Estate | 6.5% | Materials | 7.1% | Consumer Discretionary | 7.7% | Communication Services | 8.1% | Consumer Staples | 9.9% | Industrials | 16.1% | Financials | 23.5% |
Top 10 HoldingsFootnote Reference* (% of Net Assets)Footnote Reference(as of June 30, 2025)Swiss Prime Site AG, Registered Shares | 1.1% |
|---|
Ageas SA | 0.9% |
|---|
Klepierre SA | 0.9% |
|---|
Orange SA | 0.9% |
|---|
Metro, Inc. | 0.9% |
|---|
Poste Italiane SpA | 0.9% |
|---|
Emera, Inc. | 0.8% |
|---|
Enbridge, Inc. | 0.8% |
|---|
Singapore Airlines Ltd. | 0.8% |
|---|
Power Corp. of Canada | 0.8% |
|---|
|
|
| Material Fund Change [Text Block] |
Foreside Fund Services, LLC ("Foreside") served as the Fund’s distributor. Effective March 1, 2025, Victory Capital Services, Inc., an affiliate of Victory Capital Management Inc., replaced Foreside and now serves as Distributor for the Fund pursuant to a Distribution Agreement between the Distributor and the Trust. |
|
| C000210927 |
|
|
| Shareholder Report [Line Items] |
|
|
| Fund Name |
VictoryShares Emerging Markets Value Momentum ETF
|
|
| No Trading Symbol [Flag] |
true
|
|
| Annual or Semi-Annual Statement [Text Block] |
Annual Shareholder Report
|
|
| Shareholder Report Annual or Semi-Annual |
annual shareholder report
|
|
| Additional Information [Text Block] |
You can find additional information about the Fund at advisor.vcm.com/literature/etf-prospectuses. You may also request more information by calling 866-376-7890 or visiting vcm.com/contact-us.
This report describes changes to the Fund that occurred during the period.
|
|
| Additional Information Phone Number |
866-376-7890
|
|
| Additional Information Website |
vcm.com
|
|
| Expenses [Text Block] |
What were the Fund's costs for the last year?(based on a hypothetical $10,000 investment) Fund Name | Costs of a $10,000 Investment | Costs paid as a percentage of a $10,000 Investment |
|---|
Emerging Markets Value Momentum ETF | $48 | 0.45% |
|---|
| | |
|---|
|
|
| Expenses Paid, Amount |
$ 48
|
|
| Expense Ratio, Percent |
0.45%
|
|
| Factors Affecting Performance [Text Block] |
What affected the Fund’s performance during the last year?Top contributors to performance: The Fund’s underweight allocation to the consumer discretionary sector was a positive contributor to relative performance; and Stock selection in the financials and health care sectors contributed positively to relative performance.
Top detractors from performance: The Fund’s overweight allocation to the utilities sector detracted from relative performance; and Stock selection in the consumer discretionary and information technology sectors detracted from relative performance.
In addition, the Fund's employment of a derivatives strategy overlay to efficiently manage the overall portfolio risks associated with the Fund's strategy contributed positively to performance during the year. |
|
| Performance Past Does Not Indicate Future [Text] |
The investment return and principal value will fluctuate so that an investor's shares, when redeemed, may be worth more or less than the original cost. Past performance is not a good predictor of the Fund's future performance.
|
|
| Line Graph [Table Text Block] |
| Fund @ Net Asset Value - $13,695 | MSCI All Country World Index (regulatory broad based index) - $21,180 | Nasdaq Emerging Market Large Mid Cap Index - $14,577 | Nasdaq Victory Emerging Market Value Momentum Index - $14,941 |
|---|
10/17Footnote Reference* | $10,000 | $10,000 | $10,000 | $10,000 |
|---|
6/18 | $9,438 | $10,345 | $9,768 | $9,480 |
|---|
6/19 | $9,209 | $10,940 | $10,441 | $9,309 |
|---|
6/20 | $8,041 | $11,170 | $9,668 | $8,188 |
|---|
6/21 | $11,376 | $15,556 | $13,215 | $11,623 |
|---|
6/22 | $9,290 | $13,106 | $10,255 | $9,575 |
|---|
6/23 | $10,015 | $15,273 | $10,747 | $10,520 |
|---|
6/24 | $12,205 | $18,232 | $12,332 | $13,236 |
|---|
6/25 | $13,695 | $21,180 | $14,577 | $14,941 |
|---|
|
|
| Average Annual Return [Table Text Block] |
| 1 Year | 5 Year | Since Inception |
|---|
Fund @ Net Asset Value | 11.51% | 11.24% | 4.18% |
|---|
MSCI All Country World Index | 16.17% | 13.65% | 10.26% |
|---|
Nasdaq Emerging Market Large Mid Cap Index | 18.21% | 8.56% | 5.03% |
|---|
Nasdaq Victory Emerging Market Value Momentum Index | 12.88% | 12.78% | 5.37% |
|---|
|
|
| No Deduction of Taxes [Text Block] |
The graph and table total returns do not reflect the deduction of taxes that a shareholder would pay on Fund distributions, or redemption of shares.
|
|
| AssetsNet |
$ 225,510,000
|
|
| Holdings Count | Holding |
196
|
|
| Advisory Fees Paid, Amount |
$ 569,000
|
|
| InvestmentCompanyPortfolioTurnover |
118.00%
|
|
| Additional Fund Statistics [Text Block] |
FUND STATISTICS($ amounts in 000s)(as of June 30, 2025)Net Assets | $225,510 |
|---|
Number of Holdings | 196 |
|---|
Investment Advisory Fees | $569 |
|---|
Portfolio Turnover | 118% |
|---|
|
|
| Holdings [Text Block] |
Top SectorsFootnote Reference* (% of Net Assets)Footnote Reference(as of June 30, 2025)Value | Value |
|---|
Communication Services | 2.8% | Consumer Staples | 5.7% | Energy | 6.1% | Health Care | 6.7% | Utilities | 7.0% | Materials | 8.1% | Consumer Discretionary | 8.9% | Information Technology | 11.8% | Industrials | 14.5% | Financials | 25.2% |
Top 10 HoldingsFootnote Reference* (% of Net Assets)Footnote Reference(as of June 30, 2025)RHB Bank Bhd | 1.3% |
|---|
Tenaga Nasional Bhd | 1.2% |
|---|
SCB X PCL | 1.1% |
|---|
Kasikornbank PCL | 1.0% |
|---|
Sun Pharmaceutical Industries Ltd. | 1.0% |
|---|
Bank of Communications Co. Ltd., Class H | 1.0% |
|---|
Industrial & Commercial Bank of China Ltd., Class H | 0.9% |
|---|
AMMB Holdings Bhd | 0.9% |
|---|
China Construction Bank Corp., Class H | 0.9% |
|---|
Narayana Hrudayalaya Ltd. | 0.9% |
|---|
|
|
| Material Fund Change [Text Block] |
Foreside Fund Services, LLC ("Foreside") served as the Fund’s distributor. Effective March 1, 2025, Victory Capital Services, Inc., an affiliate of Victory Capital Management Inc., replaced Foreside and now serves as Distributor for the Fund pursuant to a Distribution Agreement between the Distributor and the Trust. |
|
| C000238316 |
|
|
| Shareholder Report [Line Items] |
|
|
| Fund Name |
VictoryShares WestEnd U.S. Sector ETF
|
|
| No Trading Symbol [Flag] |
true
|
|
| Annual or Semi-Annual Statement [Text Block] |
Annual Shareholder Report
|
|
| Shareholder Report Annual or Semi-Annual |
annual shareholder report
|
|
| Additional Information [Text Block] |
You can find additional information about the Fund at advisor.vcm.com/literature/etf-prospectuses. You may also request more information by calling 866-376-7890 or visiting vcm.com/contact-us.
This report describes changes to the Fund that occurred during the period.
|
|
| Additional Information Phone Number |
866-376-7890
|
|
| Additional Information Website |
vcm.com
|
|
| Expenses [Text Block] |
What were the Fund's costs for the last year?(based on a hypothetical $10,000 investment) Fund Name | Costs of a $10,000 Investment | Costs paid as a percentage of a $10,000 Investment |
|---|
WestEnd U.S. Sector ETF | $50 | 0.46% |
|---|
| | |
|---|
|
|
| Expenses Paid, Amount |
$ 50
|
|
| Expense Ratio, Percent |
0.46%
|
|
| Factors Affecting Performance [Text Block] |
What affected the Fund’s performance during the last year?We believe we have positioned the Fund for a maturing economic cycle with moderate economic activity and an increase in economic and trade policy uncertainty. Top contributors to performance: The largest positive contributor to relative returns for the Fund was avoidance of some of the most economically-sensitive, or cyclical sectors (i.e. energy, materials). Collectively, these sectors underperformed the broader market, which we believe is evidence of a slowing-growth environment. The Fund maintained overweight positions in the financials and communication services sectors, both of which outperformed the S&P 500® Index during the fiscal year. The Fund positioned itself within the information technology sector, particularly within the software industry, which contributed positively to relative performance during the fiscal year.
Top detractors from performance: The Fund’s overweight allocation to more traditional defensive sectors, such as health care and consumer staples, that offer consistent but slower earnings growth, was among the largest detractors from relative performance during the fiscal year. The Fund’s avoidance of the industrials sector, which is typically considered to be more cyclical, or economically-sensitive, detracted from relative performance during the fiscal year.
The Fund had a small allocation to derivatives during the period that did not have a material impact on performance. |
|
| Performance Past Does Not Indicate Future [Text] |
The investment return and principal value will fluctuate so that an investor's shares, when redeemed, may be worth more or less than the original cost. Past performance is not a good predictor of the Fund's future performance.
|
|
| Line Graph [Table Text Block] |
| Fund @ Net Asset Value - $17,709 | S&P 500® Index (regulatory broad based index) - $18,010 |
|---|
10/22Footnote Reference* | $10,000 | $10,000 |
|---|
12/22 | $10,684 | $10,741 |
|---|
3/23 | $11,543 | $11,546 |
|---|
6/23 | $12,510 | $12,556 |
|---|
9/23 | $11,999 | $12,145 |
|---|
12/23 | $13,218 | $13,565 |
|---|
3/24 | $14,550 | $14,997 |
|---|
6/24 | $15,221 | $15,639 |
|---|
9/24 | $16,084 | $16,560 |
|---|
12/24 | $16,479 | $16,959 |
|---|
3/25 | $15,921 | $16,234 |
|---|
6/25 | $17,709 | $18,010 |
|---|
|
|
| Average Annual Return [Table Text Block] |
| 1 Year | Since Inception |
|---|
Fund @ Net Asset Value | 16.35%Footnote Reference | 23.40%Footnote Reference |
|---|
S&P 500® Index | 15.16% | 24.17% |
|---|
|
|
| No Deduction of Taxes [Text Block] |
The graph and table total returns do not reflect the deduction of taxes that a shareholder would pay on Fund distributions, or redemption of shares.
|
|
| AssetsNet |
$ 559,301,000
|
|
| Holdings Count | Holding |
321
|
|
| Advisory Fees Paid, Amount |
$ 1,806,000
|
|
| InvestmentCompanyPortfolioTurnover |
31.00%
|
|
| Additional Fund Statistics [Text Block] |
FUND STATISTICS($ amounts in 000s)(as of June 30, 2025)Net Assets | $559,301 |
|---|
Number of Holdings | 321 |
|---|
Investment Advisory Fees | $1,806 |
|---|
Portfolio Turnover | 31% |
|---|
|
|
| Holdings [Text Block] |
Top SectorsFootnote Reference* (% of Net Assets)Footnote Reference(as of June 30, 2025)Value | Value |
|---|
Consumer Staples | 9.0% | Consumer Discretionary | 9.9% | Financials | 14.6% | Communication Services | 15.8% | Health Care | 16.9% | Information TechnologyFootnote Reference** | 33.5% |
Top 10 HoldingsFootnote Reference* (% of Net Assets)Footnote Reference(as of June 30, 2025)Microsoft Corp. | 9.9% |
|---|
NVIDIA Corp. | 5.2% |
|---|
Meta Platforms, Inc., Class A | 4.7% |
|---|
Apple, Inc. | 4.3% |
|---|
Amazon.com, Inc. | 3.8% |
|---|
Alphabet, Inc., Class A | 3.0% |
|---|
Alphabet, Inc., Class C | 2.6% |
|---|
Eli Lilly & Co. | 2.3% |
|---|
Broadcom, Inc. | 1.8% |
|---|
Netflix, Inc. | 1.7% |
|---|
|
|
| Material Fund Change [Text Block] |
Foreside Fund Services, LLC ("Foreside") served as the Fund’s distributor. Effective March 1, 2025, Victory Capital Services, Inc., an affiliate of Victory Capital Management Inc., replaced Foreside and now serves as Distributor for the Fund pursuant to a Distribution Agreement between the Distributor and the Trust. |
|
| C000250754 |
|
|
| Shareholder Report [Line Items] |
|
|
| Fund Name |
VictoryShares WestEnd Global Equity ETF
|
|
| No Trading Symbol [Flag] |
true
|
|
| Annual or Semi-Annual Statement [Text Block] |
Annual Shareholder Report
|
|
| Shareholder Report Annual or Semi-Annual |
annual shareholder report
|
|
| Additional Information [Text Block] |
You can find additional information about the Fund at advisor.vcm.com/literature/etf-prospectuses. You may also request more information by calling 866-376-7890 or visiting vcm.com/contact-us.
This report describes changes to the Fund that occurred during the period.
|
|
| Additional Information Phone Number |
866-376-7890
|
|
| Additional Information Website |
vcm.com
|
|
| Expenses [Text Block] |
What were the Fund's costs for the last year?(based on a hypothetical $10,000 investment) Fund Name | Costs of a $10,000 Investment | Costs paid as a percentage of a $10,000 Investment |
|---|
WestEnd Global Equity ETF | $64 | 0.60% |
|---|
| | |
|---|
|
|
| Expenses Paid, Amount |
$ 64
|
|
| Expense Ratio, Percent |
0.60%
|
|
| Factors Affecting Performance [Text Block] |
What affected the Fund’s performance during the last year?We believe we have positioned the Fund for a global economic cycle that continues to exhibit signs of being at an advanced stage, particularly within developed economies. Top contributors to performance: The largest positive contributor to relative returns was avoidance of some of the most economically-sensitive, or cyclical, U.S. sectors (i.e. energy, materials). Collectively, these sectors underperformed the broader market, which we believe is evidence of a slowing-growth environment. The Fund maintained overweight allocations to the U.S. financials and communication services sectors, both of which outperformed the S&P 500® Index during the fiscal year. The Fund positioned itself within the U.S. information technology sector, particularly within the software industry, which contributed positively to relative performance during the fiscal year. The Fund’s international positioning, particularly within Asia, contributed positively to relative performance during the fiscal year.
Top detractors from performance: The Fund’s overweight allocation to more traditional defensive U.S. sectors, such as health care and consumer staples, that offer consistent but slower earnings growth, was among the largest detractors from relative performance during the fiscal year. The Fund’s avoidance of the U.S. industrials sector, which is typically considered to be more cyclical, or economically-sensitive, detracted from relative performance during the fiscal year.
|
|
| Performance Past Does Not Indicate Future [Text] |
The investment return and principal value will fluctuate so that an investor's shares, when redeemed, may be worth more or less than the original cost. Past performance is not a good predictor of the Fund's future performance.
|
|
| Line Graph [Table Text Block] |
| Fund @ Net Asset Value - $11,479 | S&P 500® Index (regulatory broad based index) - $11,493 |
|---|
6/24Footnote Reference* | $10,000 | $10,000 |
|---|
6/24 | $10,006 | $9,979 |
|---|
9/24 | $10,656 | $10,567 |
|---|
12/24 | $10,440 | $10,821 |
|---|
3/25 | $10,422 | $10,359 |
|---|
6/25 | $11,479 | $11,493 |
|---|
|
|
| Average Annual Return [Table Text Block] |
| 1 Year | Since Inception |
|---|
Fund @ Net Asset Value | 14.72% | 14.37% |
|---|
S&P 500® Index | 15.16% | 14.50% |
|---|
|
|
| No Deduction of Taxes [Text Block] |
The graph and table total returns do not reflect the deduction of taxes that a shareholder would pay on Fund distributions, or redemption of shares.
|
|
| AssetsNet |
$ 4,811,000
|
|
| Holdings Count | Holding |
11
|
|
| Advisory Fees Paid, Amount |
$ 31,000
|
|
| InvestmentCompanyPortfolioTurnover |
37.00%
|
|
| Additional Fund Statistics [Text Block] |
FUND STATISTICS($ amounts in 000s)(as of June 30, 2025)Net Assets | $4,811 |
|---|
Number of Holdings | 11 |
|---|
Investment Advisory Fees | $31 |
|---|
Portfolio Turnover | 37% |
|---|
|
|
| Holdings [Text Block] |
Top 10 HoldingsFootnote Reference* (% of Net Assets)Footnote Reference(as of June 30, 2025)Top CountriesFootnote Reference*^ (% of Net Assets) (as of June 30, 2025) Value | Value |
|---|
United States | 67.7% | Japan | 6.4% | China | 3.4% | Taiwan | 2.4% | India | 2.4% | South Korea | 2.2% | Australia | 1.9% | United Kingdom | 1.8% | Switzerland | 1.3% | France | 1.2% |
Technology Select Sector SPDR Fund | 18.1% |
|---|
Vanguard FTSE All-World ex-US ETF | 12.5% |
|---|
Health Care Select Sector SPDR Fund | 11.6% |
|---|
Communication Services Select Sector SPDR Fund | 10.7% |
|---|
Financial Select Sector SPDR Fund | 10.2% |
|---|
Vanguard FTSE Pacific ETF | 7.5% |
|---|
iShares MSCI Emerging Markets Asia ETF | 7.5% |
|---|
Consumer Discretionary Select Sector SPDR Fund | 7.0% |
|---|
Consumer Staples Select Sector SPDR Fund | 6.0% |
|---|
iShares Expanded Tech-Software Sector ETF | 5.8% |
|---|
|
|
| Material Fund Change [Text Block] |
Foreside Fund Services, LLC ("Foreside") served as the Fund’s distributor. Effective March 1, 2025, Victory Capital Services, Inc., an affiliate of Victory Capital Management Inc., replaced Foreside and now serves as Distributor for the Fund pursuant to a Distribution Agreement between the Distributor and the Trust. |
|
| C000250756 |
|
|
| Shareholder Report [Line Items] |
|
|
| Fund Name |
VictoryShares Hedged Equity Income ETF
|
|
| No Trading Symbol [Flag] |
true
|
|
| Annual or Semi-Annual Statement [Text Block] |
Annual Shareholder Report
|
|
| Shareholder Report Annual or Semi-Annual |
annual shareholder report
|
|
| Additional Information [Text Block] |
This report describes changes to the Fund that occurred during the period.
|
|
| Additional Information Phone Number |
866-376-7890
|
|
| Additional Information Website |
vcm.com
|
|
| Expenses [Text Block] |
What were the Fund's costs for the last reporting period?(based on a hypothetical $10,000 investment) Fund Name | Costs of a $10,000 Investment | Costs paid as a percentage of a $10,000 InvestmentFootnote Reference* |
|---|
Hedged Equity Income ETF | $56Footnote Reference** | 0.55% |
|---|
| | |
|---|
| Footnote | Description | Footnote* | Annualized | Footnote** | The Fund commenced operations during the reporting period. Expenses for a full reporting period would be higher than the amount shown. |
|
|
| Expenses Paid, Amount |
$ 56
|
[11] |
| Expense Ratio, Percent |
0.55%
|
|
| Factors Affecting Performance [Text Block] |
What affected the Fund’s performance during the last reporting period?Top contributors to performance: The Fund’s overweight allocation to the utilities sector contributed positively to relative performance; and Stock selection in the health care sector was a positive contributor to relative performance.
Top detractors from performance: In addition, the Fund's employment of a derivatives strategy overlay to efficiently manage the overall portfolio risks associated with the Fund's strategy contributed positively to performance during the year. |
|
| Performance Past Does Not Indicate Future [Text] |
The investment return and principal value will fluctuate so that an investor's shares, when redeemed, may be worth more or less than the original cost. Past performance is not a good predictor of the Fund's future performance.
|
|
| Line Graph [Table Text Block] |
| Fund @ Net Asset Value - $11,087 | S&P 500® Index (regulatory broad based index) - $11,157 |
|---|
7/24Footnote Reference* | $10,000 | $10,000 |
|---|
9/24 | $10,573 | $10,259 |
|---|
12/24 | $10,715 | $10,506 |
|---|
3/25 | $10,790 | $10,057 |
|---|
6/25 | $11,087 | $11,157 |
|---|
|
|
| Average Annual Return [Table Text Block] |
| Since Inception |
|---|
Fund @ Net Asset Value | 10.87% |
|---|
S&P 500® Index | 11.57% |
|---|
|
|
| No Deduction of Taxes [Text Block] |
The graph and table total returns do not reflect the deduction of taxes that a shareholder would pay on Fund distributions, or redemption of shares.
|
|
| AssetsNet |
$ 36,434,000
|
|
| Holdings Count | Holding |
221
|
|
| Advisory Fees Paid, Amount |
$ 117,000
|
|
| InvestmentCompanyPortfolioTurnover |
76.00%
|
|
| Additional Fund Statistics [Text Block] |
FUND STATISTICS($ amounts in 000s)(as of June 30, 2025)Net Assets | $36,434 |
|---|
Number of Holdings | 221 |
|---|
Investment Advisory Fees | $117 |
|---|
Portfolio Turnover | 76% |
|---|
|
|
| Holdings [Text Block] |
Top SectorsFootnote Reference* (% of Net Assets)Footnote Reference(as of June 30, 2025)Value | Value |
|---|
Information Technology | 1.6% | Industrials | 3.2% | Communication Services | 4.4% | Consumer Discretionary | 7.0% | Materials | 7.3% | Health Care | 7.5% | Energy | 10.5% | Utilities | 14.4% | Consumer Staples | 17.6% | Financials | 18.5% |
Top 10 HoldingsFootnote Reference* (% of Net Assets)Footnote Reference(as of June 30, 2025)Flowers Foods, Inc. | 1.9% |
|---|
Verizon Communications, Inc. | 1.6% |
|---|
General Mills, Inc. | 1.6% |
|---|
PepsiCo, Inc. | 1.6% |
|---|
Altria Group, Inc. | 1.5% |
|---|
Amcor PLC | 1.5% |
|---|
AT&T, Inc. | 1.5% |
|---|
Merck & Co., Inc. | 1.4% |
|---|
The Campbell's Company | 1.4% |
|---|
Kinder Morgan, Inc. | 1.4% |
|---|
|
|
| Material Fund Change [Text Block] |
Foreside Fund Services, LLC ("Foreside") served as the Fund’s distributor. Effective March 1, 2025, Victory Capital Services, Inc., an affiliate of Victory Capital Management Inc., replaced Foreside and now serves as Distributor for the Fund pursuant to a Distribution Agreement between the Distributor and the Trust. |
|
|
|