Shareholder Report
|
6 Months Ended |
Jul. 01, 2025 |
Jun. 30, 2025
USD ($)
Holding
|
| Shareholder Report [Line Items] |
|
|
| Document Type |
|
N-CSRS
|
| Amendment Flag |
|
false
|
| Registrant Name |
|
LOOMIS SAYLES FUNDS II
|
| Entity Central Index Key |
|
0000872649
|
| Entity Investment Company Type |
|
N-1A
|
| Document Period End Date |
|
Jun. 30, 2025
|
| C000018231 |
|
|
| Shareholder Report [Line Items] |
|
|
| Fund Name |
|
Loomis Sayles High Income Fund
|
| Class Name |
|
Class A
|
| Trading Symbol |
|
NEFHX
|
| Annual or Semi-Annual Statement [Text Block] |
|
This semi-annual shareholder report contains important information about Loomis Sayles High Income Fund for the period of January 1, 2025 to June 30, 2025.
|
| Shareholder Report Annual or Semi-Annual |
|
Semi-annual Shareholder Report
|
| Additional Information [Text Block] |
|
You can find additional information (including tax information) about the Fund at im.natixis.com/funddocuments. You can also request the information by contacting us at (800) 225-5478 or by contacting your financial intermediary directly.
|
| Additional Information Phone Number |
|
(800) 225-5478
|
| Additional Information Website |
|
<span style="box-sizing: border-box; color: rgb(0, 0, 0); display: inline; flex-wrap: nowrap; font-size: 12px; font-weight: 400; grid-area: auto; line-height: 18px; margin: 0px; overflow: visible; text-align: left; text-align-last: auto; white-space-collapse: preserve-breaks;">im.natixis.com/funddocuments</span>
|
| Expenses [Text Block] |
|
What were the fund costs for the last six months? (based on a hypothetical $10,000 investment)
Class Name |
Costs of a $10,000 investment |
Costs paid as a percentage of a $10,000 investmentFootnote Reference† |
Class A |
$48 |
0.95% |
| Footnote |
Description |
Footnote† |
Annualized for periods less than one year (if applicable). | |
| Expenses Paid, Amount |
|
$ 48
|
| Expense Ratio, Percent |
|
0.95%
|
| AssetsNet |
|
$ 78,965,115
|
| Holdings Count | Holding |
|
368
|
| Advisory Fees Paid, Amount |
|
$ 56,084
|
| InvestmentCompanyPortfolioTurnover |
|
48.00%
|
| Additional Fund Statistics [Text Block] |
|
- Total Net Assets$78,965,115
- # of Portfolio Holdings (including overnight repurchase agreements and derivatives)368
- Portfolio Turnover Rate48%
- Total Advisory Fees Paid (after waiver/reimbursement, if applicable)$56,084
|
| Holdings [Text Block] |
|
Value |
Value |
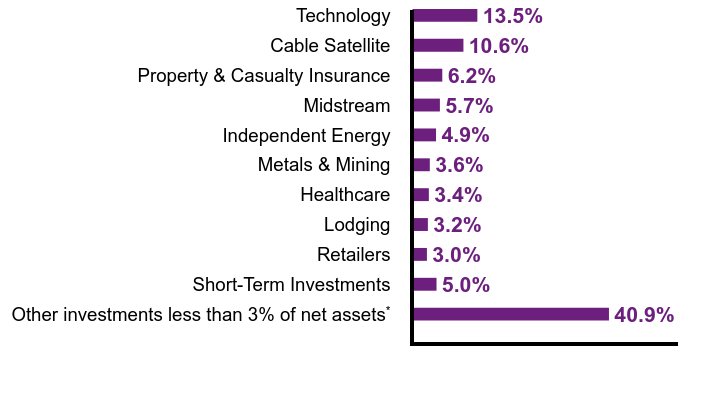
Other investments less than 3% of net assetsFootnote Reference* |
40.9% |
Short-Term Investments |
5.0% |
Retailers |
3.0% |
Lodging |
3.2% |
Healthcare |
3.4% |
Metals & Mining |
3.6% |
Independent Energy |
4.9% |
Midstream |
5.7% |
Property & Casualty Insurance |
6.2% |
Cable Satellite |
10.6% |
Technology |
13.5% |
| Footnote |
Description |
Footnote* |
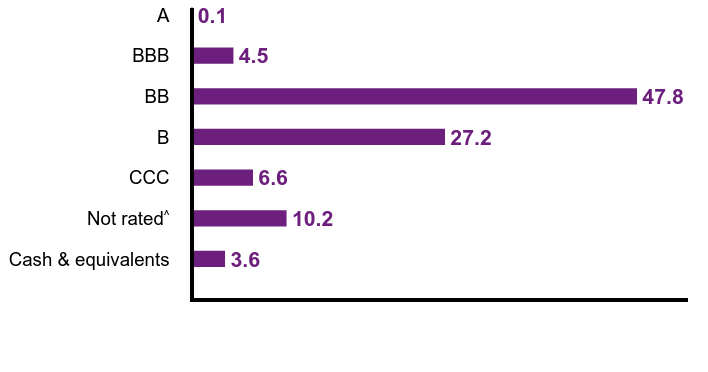
Net of other assets less liabilities (including futures contracts) | Credit QualityFootnote Reference†
Value |
Value |
Cash & equivalents |
3.6 |
Not ratedFootnote Reference^ |
10.2 |
CCC |
6.6 |
B |
27.2 |
BB |
47.8 |
BBB |
4.5 |
A |
0.1 |
| Footnote |
Description |
Footnote† |
Credit ratings are by S&P Global Ratings. A credit rating is an assessment provided by a nationally recognized statistical rating organization (NRSRO) of the creditworthiness of an issuer with respect to debt obligations except for those debt obligations that are only privately rated. Ratings are measured on a scale that generally ranges from AAA (highest) to D (lowest). The credit ratings shown relate to the creditworthiness of the issuers of the underlying securities in the Fund, and not to the Fund or its shares. Credit ratings are subject to change. |
Footnote^ |
Not Rated category represents only those securities not rated by S&P Global Ratings. Such securities may be rated by other NRSROs not shown here. | |
| Credit Quality Explanation [Text Block] |
|
Credit ratings are by S&P Global Ratings. A credit rating is an assessment provided by a nationally recognized statistical rating organization (NRSRO) of the creditworthiness of an issuer with respect to debt obligations except for those debt obligations that are only privately rated. Ratings are measured on a scale that generally ranges from AAA (highest) to D (lowest). The credit ratings shown relate to the creditworthiness of the issuers of the underlying securities in the Fund, and not to the Fund or its shares. Credit ratings are subject to change.
|
| Material Fund Change [Text Block] |
|
There were no material fund changes during the period. |
| C000018233 |
|
|
| Shareholder Report [Line Items] |
|
|
| Fund Name |
|
Loomis Sayles High Income Fund
|
| Class Name |
|
Class C
|
| Trading Symbol |
|
NEHCX
|
| Annual or Semi-Annual Statement [Text Block] |
|
This semi-annual shareholder report contains important information about Loomis Sayles High Income Fund for the period of January 1, 2025 to June 30, 2025.
|
| Shareholder Report Annual or Semi-Annual |
|
Semi-annual Shareholder Report
|
| Additional Information [Text Block] |
|
You can find additional information (including tax information) about the Fund at im.natixis.com/funddocuments. You can also request the information by contacting us at (800) 225-5478 or by contacting your financial intermediary directly.
|
| Additional Information Phone Number |
|
(800) 225-5478
|
| Additional Information Website |
|
<span style="box-sizing: border-box; color: rgb(0, 0, 0); display: inline; flex-wrap: nowrap; font-size: 12px; font-weight: 400; grid-area: auto; line-height: 18px; margin: 0px; overflow: visible; text-align: left; text-align-last: auto; white-space-collapse: preserve-breaks;">im.natixis.com/funddocuments</span>
|
| Expenses [Text Block] |
|
What were the fund costs for the last six months? (based on a hypothetical $10,000 investment)
Class Name |
Costs of a $10,000 investment |
Costs paid as a percentage of a $10,000 investmentFootnote Reference† |
Class C |
$86 |
1.70% |
| Footnote |
Description |
Footnote† |
Annualized for periods less than one year (if applicable). | |
| Expenses Paid, Amount |
|
$ 86
|
| Expense Ratio, Percent |
|
1.70%
|
| AssetsNet |
|
$ 78,965,115
|
| Holdings Count | Holding |
|
368
|
| Advisory Fees Paid, Amount |
|
$ 56,084
|
| InvestmentCompanyPortfolioTurnover |
|
48.00%
|
| Additional Fund Statistics [Text Block] |
|
- Total Net Assets$78,965,115
- # of Portfolio Holdings (including overnight repurchase agreements and derivatives)368
- Portfolio Turnover Rate48%
- Total Advisory Fees Paid (after waiver/reimbursement, if applicable)$56,084
|
| Holdings [Text Block] |
|
Value |
Value |
Other investments less than 3% of net assetsFootnote Reference* |
40.9% |
Short-Term Investments |
5.0% |
Retailers |
3.0% |
Lodging |
3.2% |
Healthcare |
3.4% |
Metals & Mining |
3.6% |
Independent Energy |
4.9% |
Midstream |
5.7% |
Property & Casualty Insurance |
6.2% |
Cable Satellite |
10.6% |
Technology |
13.5% |
| Footnote |
Description |
Footnote* |
Net of other assets less liabilities (including futures contracts) | Credit QualityFootnote Reference†
Value |
Value |
Cash & equivalents |
3.6 |
Not ratedFootnote Reference^ |
10.2 |
CCC |
6.6 |
B |
27.2 |
BB |
47.8 |
BBB |
4.5 |
A |
0.1 |
| Footnote |
Description |
Footnote† |
Credit ratings are by S&P Global Ratings. A credit rating is an assessment provided by a nationally recognized statistical rating organization (NRSRO) of the creditworthiness of an issuer with respect to debt obligations except for those debt obligations that are only privately rated. Ratings are measured on a scale that generally ranges from AAA (highest) to D (lowest). The credit ratings shown relate to the creditworthiness of the issuers of the underlying securities in the Fund, and not to the Fund or its shares. Credit ratings are subject to change. |
Footnote^ |
Not Rated category represents only those securities not rated by S&P Global Ratings. Such securities may be rated by other NRSROs not shown here. | |
| Credit Quality Explanation [Text Block] |
|
Credit ratings are by S&P Global Ratings. A credit rating is an assessment provided by a nationally recognized statistical rating organization (NRSRO) of the creditworthiness of an issuer with respect to debt obligations except for those debt obligations that are only privately rated. Ratings are measured on a scale that generally ranges from AAA (highest) to D (lowest). The credit ratings shown relate to the creditworthiness of the issuers of the underlying securities in the Fund, and not to the Fund or its shares. Credit ratings are subject to change.
|
| Material Fund Change [Text Block] |
|
There were no material fund changes during the period. |
| C000175112 |
|
|
| Shareholder Report [Line Items] |
|
|
| Fund Name |
|
Loomis Sayles High Income Fund
|
| Class Name |
|
Class N
|
| Trading Symbol |
|
LSHNX
|
| Annual or Semi-Annual Statement [Text Block] |
|
This semi-annual shareholder report contains important information about Loomis Sayles High Income Fund for the period of January 1, 2025 to June 30, 2025.
|
| Shareholder Report Annual or Semi-Annual |
|
Semi-annual Shareholder Report
|
| Additional Information [Text Block] |
|
You can find additional information (including tax information) about the Fund at im.natixis.com/funddocuments. You can also request the information by contacting us at (800) 225-5478 or by contacting your financial intermediary directly.
|
| Additional Information Phone Number |
|
(800) 225-5478
|
| Additional Information Website |
|
<span style="box-sizing: border-box; color: rgb(0, 0, 0); display: inline; flex-wrap: nowrap; font-size: 12px; font-weight: 400; grid-area: auto; line-height: 18px; margin: 0px; overflow: visible; text-align: left; text-align-last: auto; white-space-collapse: preserve-breaks;">im.natixis.com/funddocuments</span>
|
| Expenses [Text Block] |
|
What were the fund costs for the last six months? (based on a hypothetical $10,000 investment)
Class Name |
Costs of a $10,000 investment |
Costs paid as a percentage of a $10,000 investmentFootnote Reference† |
Class N |
$33 |
0.65% |
| Footnote |
Description |
Footnote† |
Annualized for periods less than one year (if applicable). | |
| Expenses Paid, Amount |
|
$ 33
|
| Expense Ratio, Percent |
|
0.65%
|
| AssetsNet |
|
$ 78,965,115
|
| Holdings Count | Holding |
|
368
|
| Advisory Fees Paid, Amount |
|
$ 56,084
|
| InvestmentCompanyPortfolioTurnover |
|
48.00%
|
| Additional Fund Statistics [Text Block] |
|
- Total Net Assets$78,965,115
- # of Portfolio Holdings (including overnight repurchase agreements and derivatives)368
- Portfolio Turnover Rate48%
- Total Advisory Fees Paid (after waiver/reimbursement, if applicable)$56,084
|
| Holdings [Text Block] |
|
Value |
Value |
Other investments less than 3% of net assetsFootnote Reference* |
40.9% |
Short-Term Investments |
5.0% |
Retailers |
3.0% |
Lodging |
3.2% |
Healthcare |
3.4% |
Metals & Mining |
3.6% |
Independent Energy |
4.9% |
Midstream |
5.7% |
Property & Casualty Insurance |
6.2% |
Cable Satellite |
10.6% |
Technology |
13.5% |
| Footnote |
Description |
Footnote* |
Net of other assets less liabilities (including futures contracts) | Credit QualityFootnote Reference†
Value |
Value |
Cash & equivalents |
3.6 |
Not ratedFootnote Reference^ |
10.2 |
CCC |
6.6 |
B |
27.2 |
BB |
47.8 |
BBB |
4.5 |
A |
0.1 |
| Footnote |
Description |
Footnote† |
Credit ratings are by S&P Global Ratings. A credit rating is an assessment provided by a nationally recognized statistical rating organization (NRSRO) of the creditworthiness of an issuer with respect to debt obligations except for those debt obligations that are only privately rated. Ratings are measured on a scale that generally ranges from AAA (highest) to D (lowest). The credit ratings shown relate to the creditworthiness of the issuers of the underlying securities in the Fund, and not to the Fund or its shares. Credit ratings are subject to change. |
Footnote^ |
Not Rated category represents only those securities not rated by S&P Global Ratings. Such securities may be rated by other NRSROs not shown here. | |
| Credit Quality Explanation [Text Block] |
|
Credit ratings are by S&P Global Ratings. A credit rating is an assessment provided by a nationally recognized statistical rating organization (NRSRO) of the creditworthiness of an issuer with respect to debt obligations except for those debt obligations that are only privately rated. Ratings are measured on a scale that generally ranges from AAA (highest) to D (lowest). The credit ratings shown relate to the creditworthiness of the issuers of the underlying securities in the Fund, and not to the Fund or its shares. Credit ratings are subject to change.
|
| Material Fund Change [Text Block] |
|
There were no material fund changes during the period. |
| C000069253 |
|
|
| Shareholder Report [Line Items] |
|
|
| Fund Name |
|
Loomis Sayles High Income Fund
|
| Class Name |
|
Class Y
|
| Trading Symbol |
|
NEHYX
|
| Annual or Semi-Annual Statement [Text Block] |
|
This semi-annual shareholder report contains important information about Loomis Sayles High Income Fund for the period of January 1, 2025 to June 30, 2025.
|
| Shareholder Report Annual or Semi-Annual |
|
Semi-annual Shareholder Report
|
| Additional Information [Text Block] |
|
You can find additional information (including tax information) about the Fund at im.natixis.com/funddocuments. You can also request the information by contacting us at (800) 225-5478 or by contacting your financial intermediary directly.
|
| Additional Information Phone Number |
|
(800) 225-5478
|
| Additional Information Website |
|
<span style="box-sizing: border-box; color: rgb(0, 0, 0); display: inline; flex-wrap: nowrap; font-size: 12px; font-weight: 400; grid-area: auto; line-height: 18px; margin: 0px; overflow: visible; text-align: left; text-align-last: auto; white-space-collapse: preserve-breaks;">im.natixis.com/funddocuments</span>
|
| Expenses [Text Block] |
|
What were the fund costs for the last six months? (based on a hypothetical $10,000 investment)
Class Name |
Costs of a $10,000 investment |
Costs paid as a percentage of a $10,000 investmentFootnote Reference† |
Class Y |
$35 |
0.70% |
| Footnote |
Description |
Footnote† |
Annualized for periods less than one year (if applicable). | |
| Expenses Paid, Amount |
|
$ 35
|
| Expense Ratio, Percent |
|
0.70%
|
| AssetsNet |
|
$ 78,965,115
|
| Holdings Count | Holding |
|
368
|
| Advisory Fees Paid, Amount |
|
$ 56,084
|
| InvestmentCompanyPortfolioTurnover |
|
48.00%
|
| Additional Fund Statistics [Text Block] |
|
- Total Net Assets$78,965,115
- # of Portfolio Holdings (including overnight repurchase agreements and derivatives)368
- Portfolio Turnover Rate48%
- Total Advisory Fees Paid (after waiver/reimbursement, if applicable)$56,084
|
| Holdings [Text Block] |
|
Value |
Value |
Other investments less than 3% of net assetsFootnote Reference* |
40.9% |
Short-Term Investments |
5.0% |
Retailers |
3.0% |
Lodging |
3.2% |
Healthcare |
3.4% |
Metals & Mining |
3.6% |
Independent Energy |
4.9% |
Midstream |
5.7% |
Property & Casualty Insurance |
6.2% |
Cable Satellite |
10.6% |
Technology |
13.5% |
| Footnote |
Description |
Footnote* |
Net of other assets less liabilities (including futures contracts) | Credit QualityFootnote Reference†
Value |
Value |
Cash & equivalents |
3.6 |
Not ratedFootnote Reference^ |
10.2 |
CCC |
6.6 |
B |
27.2 |
BB |
47.8 |
BBB |
4.5 |
A |
0.1 |
| Footnote |
Description |
Footnote† |
Credit ratings are by S&P Global Ratings. A credit rating is an assessment provided by a nationally recognized statistical rating organization (NRSRO) of the creditworthiness of an issuer with respect to debt obligations except for those debt obligations that are only privately rated. Ratings are measured on a scale that generally ranges from AAA (highest) to D (lowest). The credit ratings shown relate to the creditworthiness of the issuers of the underlying securities in the Fund, and not to the Fund or its shares. Credit ratings are subject to change. |
Footnote^ |
Not Rated category represents only those securities not rated by S&P Global Ratings. Such securities may be rated by other NRSROs not shown here. | |
| Credit Quality Explanation [Text Block] |
|
Credit ratings are by S&P Global Ratings. A credit rating is an assessment provided by a nationally recognized statistical rating organization (NRSRO) of the creditworthiness of an issuer with respect to debt obligations except for those debt obligations that are only privately rated. Ratings are measured on a scale that generally ranges from AAA (highest) to D (lowest). The credit ratings shown relate to the creditworthiness of the issuers of the underlying securities in the Fund, and not to the Fund or its shares. Credit ratings are subject to change.
|
| Material Fund Change [Text Block] |
|
There were no material fund changes during the period. |
| C000223747 |
|
|
| Shareholder Report [Line Items] |
|
|
| Fund Name |
|
Loomis Sayles International Growth Fund
|
| Class Name |
|
Class A
|
| Trading Symbol |
|
LIGGX
|
| Annual or Semi-Annual Statement [Text Block] |
|
This semi-annual shareholder report contains important information about Loomis Sayles International Growth Fund for the period of January 1, 2025 to June 30, 2025.
|
| Shareholder Report Annual or Semi-Annual |
|
Semi-annual Shareholder Report
|
| Additional Information [Text Block] |
|
You can find additional information (including tax information) about the Fund at im.natixis.com/funddocuments. You can also request the information by contacting us at (800) 225-5478 or by contacting your financial intermediary directly.
|
| Additional Information Phone Number |
|
(800) 225-5478
|
| Additional Information Website |
|
<span style="box-sizing: border-box; color: rgb(0, 0, 0); display: inline; flex-wrap: nowrap; font-size: 12px; font-weight: 400; grid-area: auto; line-height: 18px; margin: 0px; overflow: visible; text-align: left; text-align-last: auto; white-space-collapse: preserve-breaks;">im.natixis.com/funddocuments</span>
|
| Expenses [Text Block] |
|
What were the fund costs for the last six months? (based on a hypothetical $10,000 investment)
Class Name |
Costs of a $10,000 investment |
Costs paid as a percentage of a $10,000 investmentFootnote Reference† |
Class A |
$62 |
1.20% |
| Footnote |
Description |
Footnote† |
Annualized for periods less than one year (if applicable). | |
| Expenses Paid, Amount |
|
$ 62
|
| Expense Ratio, Percent |
|
1.20%
|
| AssetsNet |
|
$ 31,022,864
|
| Holdings Count | Holding |
|
36
|
| Advisory Fees Paid, Amount |
|
$ 3,900
|
| InvestmentCompanyPortfolioTurnover |
|
6.00%
|
| Additional Fund Statistics [Text Block] |
|
- Total Net Assets$31,022,864
- # of Portfolio Holdings (including overnight repurchase agreements)36
- Portfolio Turnover Rate6%
- Total Advisory Fees Paid (after waiver/reimbursement, if applicable)$3,900
|
| Holdings [Text Block] |
|
Value |
Value |
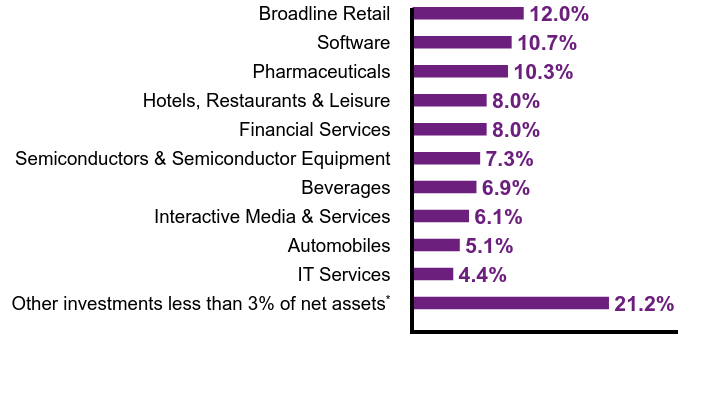
Other investments less than 3% of net assetsFootnote Reference* |
21.2% |
IT Services |
4.4% |
Automobiles |
5.1% |
Interactive Media & Services |
6.1% |
Beverages |
6.9% |
Semiconductors & Semiconductor Equipment |
7.3% |
Financial Services |
8.0% |
Hotels, Restaurants & Leisure |
8.0% |
Pharmaceuticals |
10.3% |
Software |
10.7% |
Broadline Retail |
12.0% |
| Footnote |
Description |
Footnote* |
Net of other assets less liabilities |
Value |
Value |
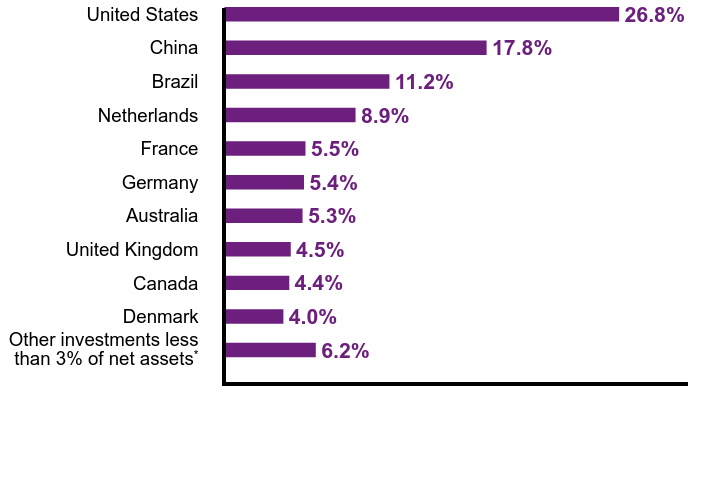
Other investments less than 3% of net assetsFootnote Reference* |
6.2% |
Denmark |
4.0% |
Canada |
4.4% |
United Kingdom |
4.5% |
Australia |
5.3% |
Germany |
5.4% |
France |
5.5% |
Netherlands |
8.9% |
Brazil |
11.2% |
China |
17.8% |
United States |
26.8% |
| Footnote |
Description |
Footnote* |
Net of other assets less liabilities | |
| Largest Holdings [Text Block] |
|
MercadoLibre, Inc. |
8.9% |
Adyen NV |
6.4% |
SAP SE |
5.4% |
WiseTech Global Ltd. |
5.3% |
Tesla, Inc. |
5.1% |
Tencent Holdings Ltd. |
5.0% |
ARM Holdings PLC, ADR |
4.8% |
Trip.com Group Ltd., ADR |
4.5% |
Shopify, Inc., Class A |
4.4% |
Novo Nordisk AS, Class B |
4.0% | |
| Material Fund Change [Text Block] |
|
There were no material fund changes during the period. |
| C000223748 |
|
|
| Shareholder Report [Line Items] |
|
|
| Fund Name |
|
Loomis Sayles International Growth Fund
|
| Class Name |
|
Class C
|
| Trading Symbol |
|
LIGCX
|
| Annual or Semi-Annual Statement [Text Block] |
|
This semi-annual shareholder report contains important information about Loomis Sayles International Growth Fund for the period of January 1, 2025 to June 30, 2025.
|
| Shareholder Report Annual or Semi-Annual |
|
Semi-annual Shareholder Report
|
| Additional Information [Text Block] |
|
You can find additional information (including tax information) about the Fund at im.natixis.com/funddocuments. You can also request the information by contacting us at (800) 225-5478 or by contacting your financial intermediary directly.
|
| Additional Information Phone Number |
|
(800) 225-5478
|
| Additional Information Website |
|
<span style="box-sizing: border-box; color: rgb(0, 0, 0); display: inline; flex-wrap: nowrap; font-size: 12px; font-weight: 400; grid-area: auto; line-height: 18px; margin: 0px; overflow: visible; text-align: left; text-align-last: auto; white-space-collapse: preserve-breaks;">im.natixis.com/funddocuments</span>
|
| Expenses [Text Block] |
|
What were the fund costs for the last six months? (based on a hypothetical $10,000 investment)
Class Name |
Costs of a $10,000 investment |
Costs paid as a percentage of a $10,000 investmentFootnote Reference† |
Class C |
$101 |
1.95% |
| Footnote |
Description |
Footnote† |
Annualized for periods less than one year (if applicable). | |
| Expenses Paid, Amount |
|
$ 101
|
| Expense Ratio, Percent |
|
1.95%
|
| AssetsNet |
|
$ 31,022,864
|
| Holdings Count | Holding |
|
36
|
| Advisory Fees Paid, Amount |
|
$ 3,900
|
| InvestmentCompanyPortfolioTurnover |
|
6.00%
|
| Additional Fund Statistics [Text Block] |
|
- Total Net Assets$31,022,864
- # of Portfolio Holdings (including overnight repurchase agreements)36
- Portfolio Turnover Rate6%
- Total Advisory Fees Paid (after waiver/reimbursement, if applicable)$3,900
|
| Holdings [Text Block] |
|
Value |
Value |
Other investments less than 3% of net assetsFootnote Reference* |
21.2% |
IT Services |
4.4% |
Automobiles |
5.1% |
Interactive Media & Services |
6.1% |
Beverages |
6.9% |
Semiconductors & Semiconductor Equipment |
7.3% |
Financial Services |
8.0% |
Hotels, Restaurants & Leisure |
8.0% |
Pharmaceuticals |
10.3% |
Software |
10.7% |
Broadline Retail |
12.0% |
| Footnote |
Description |
Footnote* |
Net of other assets less liabilities |
Value |
Value |
Other investments less than 3% of net assetsFootnote Reference* |
6.2% |
Denmark |
4.0% |
Canada |
4.4% |
United Kingdom |
4.5% |
Australia |
5.3% |
Germany |
5.4% |
France |
5.5% |
Netherlands |
8.9% |
Brazil |
11.2% |
China |
17.8% |
United States |
26.8% |
| Footnote |
Description |
Footnote* |
Net of other assets less liabilities | |
| Largest Holdings [Text Block] |
|
MercadoLibre, Inc. |
8.9% |
Adyen NV |
6.4% |
SAP SE |
5.4% |
WiseTech Global Ltd. |
5.3% |
Tesla, Inc. |
5.1% |
Tencent Holdings Ltd. |
5.0% |
ARM Holdings PLC, ADR |
4.8% |
Trip.com Group Ltd., ADR |
4.5% |
Shopify, Inc., Class A |
4.4% |
Novo Nordisk AS, Class B |
4.0% | |
| Material Fund Change [Text Block] |
|
There were no material fund changes during the period. |
| C000223749 |
|
|
| Shareholder Report [Line Items] |
|
|
| Fund Name |
|
Loomis Sayles International Growth Fund
|
| Class Name |
|
Class N
|
| Trading Symbol |
|
LIGNX
|
| Annual or Semi-Annual Statement [Text Block] |
|
This semi-annual shareholder report contains important information about Loomis Sayles International Growth Fund for the period of January 1, 2025 to June 30, 2025.
|
| Shareholder Report Annual or Semi-Annual |
|
Semi-annual Shareholder Report
|
| Additional Information [Text Block] |
|
You can find additional information (including tax information) about the Fund at im.natixis.com/funddocuments. You can also request the information by contacting us at (800) 225-5478 or by contacting your financial intermediary directly.
|
| Additional Information Phone Number |
|
(800) 225-5478
|
| Additional Information Website |
|
<span style="box-sizing: border-box; color: rgb(0, 0, 0); display: inline; flex-wrap: nowrap; font-size: 12px; font-weight: 400; grid-area: auto; line-height: 18px; margin: 0px; overflow: visible; text-align: left; text-align-last: auto; white-space-collapse: preserve-breaks;">im.natixis.com/funddocuments</span>
|
| Expenses [Text Block] |
|
What were the fund costs for the last six months? (based on a hypothetical $10,000 investment)
Class Name |
Costs of a $10,000 investment |
Costs paid as a percentage of a $10,000 investmentFootnote Reference† |
Class N |
$47 |
0.90% |
| Footnote |
Description |
Footnote† |
Annualized for periods less than one year (if applicable). | |
| Expenses Paid, Amount |
|
$ 47
|
| Expense Ratio, Percent |
|
0.90%
|
| AssetsNet |
|
$ 31,022,864
|
| Holdings Count | Holding |
|
36
|
| Advisory Fees Paid, Amount |
|
$ 3,900
|
| InvestmentCompanyPortfolioTurnover |
|
6.00%
|
| Additional Fund Statistics [Text Block] |
|
- Total Net Assets$31,022,864
- # of Portfolio Holdings (including overnight repurchase agreements)36
- Portfolio Turnover Rate6%
- Total Advisory Fees Paid (after waiver/reimbursement, if applicable)$3,900
|
| Holdings [Text Block] |
|
Value |
Value |
Other investments less than 3% of net assetsFootnote Reference* |
21.2% |
IT Services |
4.4% |
Automobiles |
5.1% |
Interactive Media & Services |
6.1% |
Beverages |
6.9% |
Semiconductors & Semiconductor Equipment |
7.3% |
Financial Services |
8.0% |
Hotels, Restaurants & Leisure |
8.0% |
Pharmaceuticals |
10.3% |
Software |
10.7% |
Broadline Retail |
12.0% |
| Footnote |
Description |
Footnote* |
Net of other assets less liabilities |
Value |
Value |
Other investments less than 3% of net assetsFootnote Reference* |
6.2% |
Denmark |
4.0% |
Canada |
4.4% |
United Kingdom |
4.5% |
Australia |
5.3% |
Germany |
5.4% |
France |
5.5% |
Netherlands |
8.9% |
Brazil |
11.2% |
China |
17.8% |
United States |
26.8% |
| Footnote |
Description |
Footnote* |
Net of other assets less liabilities | |
| Largest Holdings [Text Block] |
|
MercadoLibre, Inc. |
8.9% |
Adyen NV |
6.4% |
SAP SE |
5.4% |
WiseTech Global Ltd. |
5.3% |
Tesla, Inc. |
5.1% |
Tencent Holdings Ltd. |
5.0% |
ARM Holdings PLC, ADR |
4.8% |
Trip.com Group Ltd., ADR |
4.5% |
Shopify, Inc., Class A |
4.4% |
Novo Nordisk AS, Class B |
4.0% | |
| Material Fund Change [Text Block] |
|
There were no material fund changes during the period. |
| C000223746 |
|
|
| Shareholder Report [Line Items] |
|
|
| Fund Name |
|
Loomis Sayles International Growth Fund
|
| Class Name |
|
Class Y
|
| Trading Symbol |
|
LIGYX
|
| Annual or Semi-Annual Statement [Text Block] |
|
This semi-annual shareholder report contains important information about Loomis Sayles International Growth Fund for the period of January 1, 2025 to June 30, 2025.
|
| Shareholder Report Annual or Semi-Annual |
|
Semi-annual Shareholder Report
|
| Additional Information [Text Block] |
|
You can find additional information (including tax information) about the Fund at im.natixis.com/funddocuments. You can also request the information by contacting us at (800) 225-5478 or by contacting your financial intermediary directly.
|
| Additional Information Phone Number |
|
(800) 225-5478
|
| Additional Information Website |
|
<span style="box-sizing: border-box; color: rgb(0, 0, 0); display: inline; flex-wrap: nowrap; font-size: 12px; font-weight: 400; grid-area: auto; line-height: 18px; margin: 0px; overflow: visible; text-align: left; text-align-last: auto; white-space-collapse: preserve-breaks;">im.natixis.com/funddocuments</span>
|
| Expenses [Text Block] |
|
What were the fund costs for the last six months? (based on a hypothetical $10,000 investment)
Class Name |
Costs of a $10,000 investment |
Costs paid as a percentage of a $10,000 investmentFootnote Reference† |
Class Y |
$49 |
0.95% |
| Footnote |
Description |
Footnote† |
Annualized for periods less than one year (if applicable). | |
| Expenses Paid, Amount |
|
$ 49
|
| Expense Ratio, Percent |
|
0.95%
|
| AssetsNet |
|
$ 31,022,864
|
| Holdings Count | Holding |
|
36
|
| Advisory Fees Paid, Amount |
|
$ 3,900
|
| InvestmentCompanyPortfolioTurnover |
|
6.00%
|
| Additional Fund Statistics [Text Block] |
|
- Total Net Assets$31,022,864
- # of Portfolio Holdings (including overnight repurchase agreements)36
- Portfolio Turnover Rate6%
- Total Advisory Fees Paid (after waiver/reimbursement, if applicable)$3,900
|
| Holdings [Text Block] |
|
Value |
Value |
Other investments less than 3% of net assetsFootnote Reference* |
21.2% |
IT Services |
4.4% |
Automobiles |
5.1% |
Interactive Media & Services |
6.1% |
Beverages |
6.9% |
Semiconductors & Semiconductor Equipment |
7.3% |
Financial Services |
8.0% |
Hotels, Restaurants & Leisure |
8.0% |
Pharmaceuticals |
10.3% |
Software |
10.7% |
Broadline Retail |
12.0% |
| Footnote |
Description |
Footnote* |
Net of other assets less liabilities |
Value |
Value |
Other investments less than 3% of net assetsFootnote Reference* |
6.2% |
Denmark |
4.0% |
Canada |
4.4% |
United Kingdom |
4.5% |
Australia |
5.3% |
Germany |
5.4% |
France |
5.5% |
Netherlands |
8.9% |
Brazil |
11.2% |
China |
17.8% |
United States |
26.8% |
| Footnote |
Description |
Footnote* |
Net of other assets less liabilities | |
| Largest Holdings [Text Block] |
|
MercadoLibre, Inc. |
8.9% |
Adyen NV |
6.4% |
SAP SE |
5.4% |
WiseTech Global Ltd. |
5.3% |
Tesla, Inc. |
5.1% |
Tencent Holdings Ltd. |
5.0% |
ARM Holdings PLC, ADR |
4.8% |
Trip.com Group Ltd., ADR |
4.5% |
Shopify, Inc., Class A |
4.4% |
Novo Nordisk AS, Class B |
4.0% | |
| Material Fund Change [Text Block] |
|
There were no material fund changes during the period. |
| C000018234 |
|
|
| Shareholder Report [Line Items] |
|
|
| Fund Name |
|
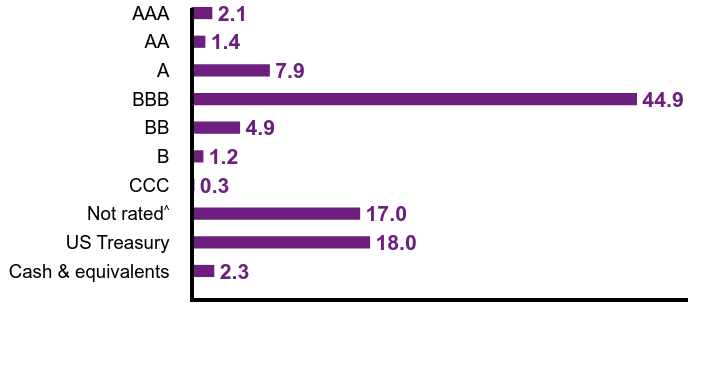
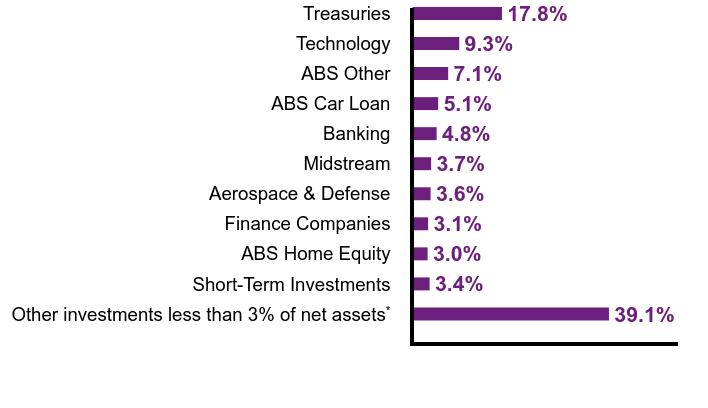
Loomis Sayles Investment Grade Bond Fund
|
| Class Name |
|
Class A
|
| Trading Symbol |
|
LIGRX
|
| Annual or Semi-Annual Statement [Text Block] |
|
This semi-annual shareholder report contains important information about Loomis Sayles Investment Grade Bond Fund for the period of January 1, 2025 to June 30, 2025.
|
| Shareholder Report Annual or Semi-Annual |
|
Semi-annual Shareholder Report
|
| Additional Information [Text Block] |
|
You can find additional information (including tax information) about the Fund at im.natixis.com/funddocuments. You can also request the information by contacting us at 800-225-5478 or by contacting your financial intermediary directly.
|
| Material Fund Change Notice [Text Block] |
|
This report describes changes to the Fund that occurred during the reporting period.
|
| Additional Information Phone Number |
|
800-225-5478
|
| Additional Information Website |
|
<span style="box-sizing: border-box; color: rgb(0, 0, 0); display: inline; flex-wrap: nowrap; font-size: 12px; font-weight: 400; grid-area: auto; line-height: 18px; margin: 0px; overflow: visible; text-align: left; text-align-last: auto; white-space-collapse: preserve-breaks;">im.natixis.com/funddocuments</span>
|
| Expenses [Text Block] |
|
What were the fund costs for the last six months? (based on a hypothetical $10,000 investment)
Class Name |
Costs of a $10,000 investment |
Costs paid as a percentage of a $10,000 investmentFootnote Reference† |
Class A |
$37 |
0.74% |
| Footnote |
Description |
Footnote† |
Annualized for periods less than one year (if applicable). | |
| Expenses Paid, Amount |
|
$ 37
|
| Expense Ratio, Percent |
|
0.74%
|
| Material Change Date |
Jul. 01, 2025
|
|
| AssetsNet |
|
$ 15,946,414,461
|
| Holdings Count | Holding |
|
998
|
| Advisory Fees Paid, Amount |
|
$ 26,134,119
|
| InvestmentCompanyPortfolioTurnover |
|
34.00%
|
| Additional Fund Statistics [Text Block] |
|
- Total Net Assets$15,946,414,461
- # of Portfolio Holdings (including overnight repurchase agreements and derivatives)998
- Portfolio Turnover Rate34%
- Total Advisory Fees Paid (after waiver/reimbursement, if applicable)$26,134,119
|
| Holdings [Text Block] |
|
Value |
Value |
Other investments less than 3% of net assetsFootnote Reference* |
39.1% |
Short-Term Investments |
3.4% |
ABS Home Equity |
3.0% |
Finance Companies |
3.1% |
Aerospace & Defense |
3.6% |
Midstream |
3.7% |
Banking |
4.8% |
ABS Car Loan |
5.1% |
ABS Other |
7.1% |
Technology |
9.3% |
Treasuries |
17.8% |
| Footnote |
Description |
Footnote* |
Net of other assets less liabilities (including futures contracts) | Credit QualityFootnote Reference†
Value |
Value |
Cash & equivalents |
2.3 |
US Treasury |
18.0 |
Not ratedFootnote Reference^ |
17.0 |
CCC |
0.3 |
B |
1.2 |
BB |
4.9 |
BBB |
44.9 |
A |
7.9 |
AA |
1.4 |
AAA |
2.1 |
| Footnote |
Description |
Footnote† |
Credit ratings are by S&P Global Ratings. A credit rating is an assessment provided by a nationally recognized statistical rating organization (NRSRO) of the creditworthiness of an issuer with respect to debt obligations except for those debt obligations that are only privately rated. Ratings are measured on a scale that generally ranges from AAA (highest) to D (lowest). The credit ratings shown relate to the creditworthiness of the issuers of the underlying securities in the Fund, and not to the Fund or its shares. Credit ratings are subject to change. |
Footnote^ |
Not Rated category represents only those securities not rated by S&P Global Ratings. Such securities may be rated by other NRSROs not shown here. | |
| Credit Quality Explanation [Text Block] |
|
Credit ratings are by S&P Global Ratings. A credit rating is an assessment provided by a nationally recognized statistical rating organization (NRSRO) of the creditworthiness of an issuer with respect to debt obligations except for those debt obligations that are only privately rated. Ratings are measured on a scale that generally ranges from AAA (highest) to D (lowest). The credit ratings shown relate to the creditworthiness of the issuers of the underlying securities in the Fund, and not to the Fund or its shares. Credit ratings are subject to change.
|
| Material Fund Change [Text Block] |
|
Effective July 1, 2025, the Fund had the following material changes, which were reported in a supplement to the Fund's prospectus. For more information, you may review the Fund's prospectus at im.natixis.com/funddocuments or upon request at 800-225-5478 or through your financial intermediary. Expenses:The expense limit as a percentage of average daily net assets was reduced to 0.73% from 0.74%. Fees:The advisory fee rate as a percentage of average daily net assets will be 0.40% on the first $15 billion of assets, and 0.35% thereafter. |
| Material Fund Change Expenses [Text Block] |
|
Expenses:The expense limit as a percentage of average daily net assets was reduced to 0.73% from 0.74%. Fees:The advisory fee rate as a percentage of average daily net assets will be 0.40% on the first $15 billion of assets, and 0.35% thereafter.
|
| Summary of Change Legend [Text Block] |
|
Effective July 1, 2025, the Fund had the following material changes, which were reported in a supplement to the Fund's prospectus. For more information, you may review the Fund's prospectus at im.natixis.com/funddocuments or upon request at 800-225-5478 or through your financial intermediary.
|
| Updated Prospectus Phone Number |
|
800-225-5478
|
| Updated Prospectus Web Address |
|
<span style="box-sizing: border-box; color: rgb(0, 0, 0); display: inline; flex-wrap: nowrap; font-size: 10.6667px; font-weight: 400; grid-area: auto; line-height: 16px; margin: 0px; overflow: visible; text-align: left; text-align-last: auto; white-space-collapse: preserve-breaks;">im.natixis.com/funddocuments</span>
|
| C000018236 |
|
|
| Shareholder Report [Line Items] |
|
|
| Fund Name |
|
Loomis Sayles Investment Grade Bond Fund
|
| Class Name |
|
Class C
|
| Trading Symbol |
|
LGBCX
|
| Annual or Semi-Annual Statement [Text Block] |
|
This semi-annual shareholder report contains important information about Loomis Sayles Investment Grade Bond Fund for the period of January 1, 2025 to June 30, 2025.
|
| Shareholder Report Annual or Semi-Annual |
|
Semi-annual Shareholder Report
|
| Additional Information [Text Block] |
|
You can find additional information (including tax information) about the Fund at im.natixis.com/funddocuments. You can also request the information by contacting us at 800-225-5478 or by contacting your financial intermediary directly.
|
| Material Fund Change Notice [Text Block] |
|
This report describes changes to the Fund that occurred during the reporting period.
|
| Additional Information Phone Number |
|
800-225-5478
|
| Additional Information Website |
|
<span style="box-sizing: border-box; color: rgb(0, 0, 0); display: inline; flex-wrap: nowrap; font-size: 12px; font-weight: 400; grid-area: auto; line-height: 18px; margin: 0px; overflow: visible; text-align: left; text-align-last: auto; white-space-collapse: preserve-breaks;">im.natixis.com/funddocuments</span>
|
| Expenses [Text Block] |
|
What were the fund costs for the last six months? (based on a hypothetical $10,000 investment)
Class Name |
Costs of a $10,000 investment |
Costs paid as a percentage of a $10,000 investmentFootnote Reference† |
Class C |
$75 |
1.49% |
| Footnote |
Description |
Footnote† |
Annualized for periods less than one year (if applicable). | |
| Expenses Paid, Amount |
|
$ 75
|
| Expense Ratio, Percent |
|
1.49%
|
| Material Change Date |
Jul. 01, 2025
|
|
| AssetsNet |
|
$ 15,946,414,461
|
| Holdings Count | Holding |
|
998
|
| Advisory Fees Paid, Amount |
|
$ 26,134,119
|
| InvestmentCompanyPortfolioTurnover |
|
34.00%
|
| Additional Fund Statistics [Text Block] |
|
- Total Net Assets$15,946,414,461
- # of Portfolio Holdings (including overnight repurchase agreements and derivatives)998
- Portfolio Turnover Rate34%
- Total Advisory Fees Paid (after waiver/reimbursement, if applicable)$26,134,119
|
| Holdings [Text Block] |
|
Value |
Value |
Other investments less than 3% of net assetsFootnote Reference* |
39.1% |
Short-Term Investments |
3.4% |
ABS Home Equity |
3.0% |
Finance Companies |
3.1% |
Aerospace & Defense |
3.6% |
Midstream |
3.7% |
Banking |
4.8% |
ABS Car Loan |
5.1% |
ABS Other |
7.1% |
Technology |
9.3% |
Treasuries |
17.8% |
| Footnote |
Description |
Footnote* |
Net of other assets less liabilities (including futures contracts) | Credit QualityFootnote Reference†
Value |
Value |
Cash & equivalents |
2.3 |
US Treasury |
18.0 |
Not ratedFootnote Reference^ |
17.0 |
CCC |
0.3 |
B |
1.2 |
BB |
4.9 |
BBB |
44.9 |
A |
7.9 |
AA |
1.4 |
AAA |
2.1 |
| Footnote |
Description |
Footnote† |
Credit ratings are by S&P Global Ratings. A credit rating is an assessment provided by a nationally recognized statistical rating organization (NRSRO) of the creditworthiness of an issuer with respect to debt obligations except for those debt obligations that are only privately rated. Ratings are measured on a scale that generally ranges from AAA (highest) to D (lowest). The credit ratings shown relate to the creditworthiness of the issuers of the underlying securities in the Fund, and not to the Fund or its shares. Credit ratings are subject to change. |
Footnote^ |
Not Rated category represents only those securities not rated by S&P Global Ratings. Such securities may be rated by other NRSROs not shown here. | |
| Credit Quality Explanation [Text Block] |
|
Credit ratings are by S&P Global Ratings. A credit rating is an assessment provided by a nationally recognized statistical rating organization (NRSRO) of the creditworthiness of an issuer with respect to debt obligations except for those debt obligations that are only privately rated. Ratings are measured on a scale that generally ranges from AAA (highest) to D (lowest). The credit ratings shown relate to the creditworthiness of the issuers of the underlying securities in the Fund, and not to the Fund or its shares. Credit ratings are subject to change.
|
| Material Fund Change [Text Block] |
|
Effective July 1, 2025, the Fund had the following material changes, which were reported in a supplement to the Fund's prospectus. For more information, you may review the Fund's prospectus at im.natixis.com/funddocuments or upon request at 800-225-5478 or through your financial intermediary. Expenses:The expense limit as a percentage of average daily net assets was reduced to 1.48% from 1.49%. Fees:The advisory fee rate as a percentage of average daily net assets will be 0.40% on the first $15 billion of assets, and 0.35% thereafter. |
| Material Fund Change Expenses [Text Block] |
|
Expenses:The expense limit as a percentage of average daily net assets was reduced to 1.48% from 1.49%. Fees:The advisory fee rate as a percentage of average daily net assets will be 0.40% on the first $15 billion of assets, and 0.35% thereafter.
|
| Summary of Change Legend [Text Block] |
|
Effective July 1, 2025, the Fund had the following material changes, which were reported in a supplement to the Fund's prospectus. For more information, you may review the Fund's prospectus at im.natixis.com/funddocuments or upon request at 800-225-5478 or through your financial intermediary.
|
| Updated Prospectus Phone Number |
|
800-225-5478
|
| Updated Prospectus Web Address |
|
<span style="box-sizing: border-box; color: rgb(0, 0, 0); display: inline; flex-wrap: nowrap; font-size: 10.6667px; font-weight: 400; grid-area: auto; line-height: 16px; margin: 0px; overflow: visible; text-align: left; text-align-last: auto; white-space-collapse: preserve-breaks;">im.natixis.com/funddocuments</span>
|
| C000125485 |
|
|
| Shareholder Report [Line Items] |
|
|
| Fund Name |
|
Loomis Sayles Investment Grade Bond Fund
|
| Class Name |
|
Class N
|
| Trading Symbol |
|
LGBNX
|
| Annual or Semi-Annual Statement [Text Block] |
|
This semi-annual shareholder report contains important information about Loomis Sayles Investment Grade Bond Fund for the period of January 1, 2025 to June 30, 2025.
|
| Shareholder Report Annual or Semi-Annual |
|
Semi-annual Shareholder Report
|
| Additional Information [Text Block] |
|
You can find additional information (including tax information) about the Fund at im.natixis.com/funddocuments. You can also request the information by contacting us at 800-225-5478 or by contacting your financial intermediary directly.
|
| Material Fund Change Notice [Text Block] |
|
This report describes changes to the Fund that occurred during the reporting period.
|
| Additional Information Phone Number |
|
800-225-5478
|
| Additional Information Website |
|
<span style="box-sizing: border-box; color: rgb(0, 0, 0); display: inline; flex-wrap: nowrap; font-size: 12px; font-weight: 400; grid-area: auto; line-height: 18px; margin: 0px; overflow: visible; text-align: left; text-align-last: auto; white-space-collapse: preserve-breaks;">im.natixis.com/funddocuments</span>
|
| Expenses [Text Block] |
|
What were the fund costs for the last six months? (based on a hypothetical $10,000 investment)
Class Name |
Costs of a $10,000 investment |
Costs paid as a percentage of a $10,000 investmentFootnote Reference† |
Class N |
$22 |
0.44% |
| Footnote |
Description |
Footnote† |
Annualized for periods less than one year (if applicable). | |
| Expenses Paid, Amount |
|
$ 22
|
| Expense Ratio, Percent |
|
0.44%
|
| Material Change Date |
Jul. 01, 2025
|
|
| AssetsNet |
|
$ 15,946,414,461
|
| Holdings Count | Holding |
|
998
|
| Advisory Fees Paid, Amount |
|
$ 26,134,119
|
| InvestmentCompanyPortfolioTurnover |
|
34.00%
|
| Additional Fund Statistics [Text Block] |
|
- Total Net Assets$15,946,414,461
- # of Portfolio Holdings (including overnight repurchase agreements and derivatives)998
- Portfolio Turnover Rate34%
- Total Advisory Fees Paid (after waiver/reimbursement, if applicable)$26,134,119
|
| Holdings [Text Block] |
|
Value |
Value |
Other investments less than 3% of net assetsFootnote Reference* |
39.1% |
Short-Term Investments |
3.4% |
ABS Home Equity |
3.0% |
Finance Companies |
3.1% |
Aerospace & Defense |
3.6% |
Midstream |
3.7% |
Banking |
4.8% |
ABS Car Loan |
5.1% |
ABS Other |
7.1% |
Technology |
9.3% |
Treasuries |
17.8% |
| Footnote |
Description |
Footnote* |
Net of other assets less liabilities (including futures contracts) | Credit QualityFootnote Reference†
Value |
Value |
Cash & equivalents |
2.3 |
US Treasury |
18.0 |
Not ratedFootnote Reference^ |
17.0 |
CCC |
0.3 |
B |
1.2 |
BB |
4.9 |
BBB |
44.9 |
A |
7.9 |
AA |
1.4 |
AAA |
2.1 |
| Footnote |
Description |
Footnote† |
Credit ratings are by S&P Global Ratings. A credit rating is an assessment provided by a nationally recognized statistical rating organization (NRSRO) of the creditworthiness of an issuer with respect to debt obligations except for those debt obligations that are only privately rated. Ratings are measured on a scale that generally ranges from AAA (highest) to D (lowest). The credit ratings shown relate to the creditworthiness of the issuers of the underlying securities in the Fund, and not to the Fund or its shares. Credit ratings are subject to change. |
Footnote^ |
Not Rated category represents only those securities not rated by S&P Global Ratings. Such securities may be rated by other NRSROs not shown here. | |
| Credit Quality Explanation [Text Block] |
|
Credit ratings are by S&P Global Ratings. A credit rating is an assessment provided by a nationally recognized statistical rating organization (NRSRO) of the creditworthiness of an issuer with respect to debt obligations except for those debt obligations that are only privately rated. Ratings are measured on a scale that generally ranges from AAA (highest) to D (lowest). The credit ratings shown relate to the creditworthiness of the issuers of the underlying securities in the Fund, and not to the Fund or its shares. Credit ratings are subject to change.
|
| Material Fund Change [Text Block] |
|
Effective July 1, 2025, the Fund had the following material changes, which were reported in a supplement to the Fund's prospectus. For more information, you may review the Fund's prospectus at im.natixis.com/funddocuments or upon request at 800-225-5478 or through your financial intermediary. Expenses:The expense limit as a percentage of average daily net assets was reduced to 0.43% from 0.44%. Fees:The advisory fee rate as a percentage of average daily net assets will be 0.40% on the first $15 billion of assets, and 0.35% thereafter. |
| Material Fund Change Expenses [Text Block] |
|
Expenses:The expense limit as a percentage of average daily net assets was reduced to 0.43% from 0.44%. Fees:The advisory fee rate as a percentage of average daily net assets will be 0.40% on the first $15 billion of assets, and 0.35% thereafter.
|
| Summary of Change Legend [Text Block] |
|
Effective July 1, 2025, the Fund had the following material changes, which were reported in a supplement to the Fund's prospectus. For more information, you may review the Fund's prospectus at im.natixis.com/funddocuments or upon request at 800-225-5478 or through your financial intermediary.
|
| Updated Prospectus Phone Number |
|
800-225-5478
|
| Updated Prospectus Web Address |
|
<span style="box-sizing: border-box; color: rgb(0, 0, 0); display: inline; flex-wrap: nowrap; font-size: 10.6667px; font-weight: 400; grid-area: auto; line-height: 16px; margin: 0px; overflow: visible; text-align: left; text-align-last: auto; white-space-collapse: preserve-breaks;">im.natixis.com/funddocuments</span>
|
| C000018238 |
|
|
| Shareholder Report [Line Items] |
|
|
| Fund Name |
|
Loomis Sayles Investment Grade Bond Fund
|
| Class Name |
|
Class Y
|
| Trading Symbol |
|
LSIIX
|
| Annual or Semi-Annual Statement [Text Block] |
|
This semi-annual shareholder report contains important information about Loomis Sayles Investment Grade Bond Fund for the period of January 1, 2025 to June 30, 2025.
|
| Shareholder Report Annual or Semi-Annual |
|
Semi-annual Shareholder Report
|
| Additional Information [Text Block] |
|
You can find additional information (including tax information) about the Fund at im.natixis.com/funddocuments. You can also request the information by contacting us at 800-225-5478 or by contacting your financial intermediary directly.
|
| Material Fund Change Notice [Text Block] |
|
This report describes changes to the Fund that occurred during the reporting period.
|
| Additional Information Phone Number |
|
800-225-5478
|
| Additional Information Website |
|
<span style="box-sizing: border-box; color: rgb(0, 0, 0); display: inline; flex-wrap: nowrap; font-size: 12px; font-weight: 400; grid-area: auto; line-height: 18px; margin: 0px; overflow: visible; text-align: left; text-align-last: auto; white-space-collapse: preserve-breaks;">im.natixis.com/funddocuments</span>
|
| Expenses [Text Block] |
|
What were the fund costs for the last six months? (based on a hypothetical $10,000 investment)
Class Name |
Costs of a $10,000 investment |
Costs paid as a percentage of a $10,000 investmentFootnote Reference† |
Class Y |
$25 |
0.49% |
| Footnote |
Description |
Footnote† |
Annualized for periods less than one year (if applicable). | |
| Expenses Paid, Amount |
|
$ 25
|
| Expense Ratio, Percent |
|
0.49%
|
| Material Change Date |
Jul. 01, 2025
|
|
| AssetsNet |
|
$ 15,946,414,461
|
| Holdings Count | Holding |
|
998
|
| Advisory Fees Paid, Amount |
|
$ 26,134,119
|
| InvestmentCompanyPortfolioTurnover |
|
34.00%
|
| Additional Fund Statistics [Text Block] |
|
- Total Net Assets$15,946,414,461
- # of Portfolio Holdings (including overnight repurchase agreements and derivatives)998
- Portfolio Turnover Rate34%
- Total Advisory Fees Paid (after waiver/reimbursement, if applicable)$26,134,119
|
| Holdings [Text Block] |
|
Value |
Value |
Other investments less than 3% of net assetsFootnote Reference* |
39.1% |
Short-Term Investments |
3.4% |
ABS Home Equity |
3.0% |
Finance Companies |
3.1% |
Aerospace & Defense |
3.6% |
Midstream |
3.7% |
Banking |
4.8% |
ABS Car Loan |
5.1% |
ABS Other |
7.1% |
Technology |
9.3% |
Treasuries |
17.8% |
| Footnote |
Description |
Footnote* |
Net of other assets less liabilities (including futures contracts) | Credit QualityFootnote Reference†
Value |
Value |
Cash & equivalents |
2.3 |
US Treasury |
18.0 |
Not ratedFootnote Reference^ |
17.0 |
CCC |
0.3 |
B |
1.2 |
BB |
4.9 |
BBB |
44.9 |
A |
7.9 |
AA |
1.4 |
AAA |
2.1 |
| Footnote |
Description |
Footnote† |
Credit ratings are by S&P Global Ratings. A credit rating is an assessment provided by a nationally recognized statistical rating organization (NRSRO) of the creditworthiness of an issuer with respect to debt obligations except for those debt obligations that are only privately rated. Ratings are measured on a scale that generally ranges from AAA (highest) to D (lowest). The credit ratings shown relate to the creditworthiness of the issuers of the underlying securities in the Fund, and not to the Fund or its shares. Credit ratings are subject to change. |
Footnote^ |
Not Rated category represents only those securities not rated by S&P Global Ratings. Such securities may be rated by other NRSROs not shown here. | |
| Credit Quality Explanation [Text Block] |
|
Credit ratings are by S&P Global Ratings. A credit rating is an assessment provided by a nationally recognized statistical rating organization (NRSRO) of the creditworthiness of an issuer with respect to debt obligations except for those debt obligations that are only privately rated. Ratings are measured on a scale that generally ranges from AAA (highest) to D (lowest). The credit ratings shown relate to the creditworthiness of the issuers of the underlying securities in the Fund, and not to the Fund or its shares. Credit ratings are subject to change.
|
| Material Fund Change [Text Block] |
|
Effective July 1, 2025, the Fund had the following material changes, which were reported in a supplement to the Fund's prospectus. For more information, you may review the Fund's prospectus at im.natixis.com/funddocuments or upon request at 800-225-5478 or through your financial intermediary. Expenses:The expense limit as a percentage of average daily net assets was reduced to 0.48% from 0.49%. Fees:The advisory fee rate as a percentage of average daily net assets will be 0.40% on the first $15 billion of assets, and 0.35% thereafter. |
| Material Fund Change Expenses [Text Block] |
|
Expenses:The expense limit as a percentage of average daily net assets was reduced to 0.48% from 0.49%. Fees:The advisory fee rate as a percentage of average daily net assets will be 0.40% on the first $15 billion of assets, and 0.35% thereafter.
|
| Summary of Change Legend [Text Block] |
|
Effective July 1, 2025, the Fund had the following material changes, which were reported in a supplement to the Fund's prospectus. For more information, you may review the Fund's prospectus at im.natixis.com/funddocuments or upon request at 800-225-5478 or through your financial intermediary.
|
| Updated Prospectus Phone Number |
|
800-225-5478
|
| Updated Prospectus Web Address |
|
<span style="box-sizing: border-box; color: rgb(0, 0, 0); display: inline; flex-wrap: nowrap; font-size: 10.6667px; font-weight: 400; grid-area: auto; line-height: 16px; margin: 0px; overflow: visible; text-align: left; text-align-last: auto; white-space-collapse: preserve-breaks;">im.natixis.com/funddocuments</span>
|
| C000082998 |
|
|
| Shareholder Report [Line Items] |
|
|
| Fund Name |
|
Loomis Sayles Investment Grade Bond Fund
|
| Class Name |
|
Admin Class
|
| Trading Symbol |
|
LIGAX
|
| Annual or Semi-Annual Statement [Text Block] |
|
This semi-annual shareholder report contains important information about Loomis Sayles Investment Grade Bond Fund for the period of January 1, 2025 to June 30, 2025.
|
| Shareholder Report Annual or Semi-Annual |
|
Semi-annual Shareholder Report
|
| Additional Information [Text Block] |
|
You can find additional information (including tax information) about the Fund at im.natixis.com/funddocuments. You can also request the information by contacting us at 800-225-5478 or by contacting your financial intermediary directly.
|
| Material Fund Change Notice [Text Block] |
|
This report describes changes to the Fund that occurred during the reporting period.
|
| Additional Information Phone Number |
|
800-225-5478
|
| Additional Information Website |
|
<span style="box-sizing: border-box; color: rgb(0, 0, 0); display: inline; flex-wrap: nowrap; font-size: 12px; font-weight: 400; grid-area: auto; line-height: 18px; margin: 0px; overflow: visible; text-align: left; text-align-last: auto; white-space-collapse: preserve-breaks;">im.natixis.com/funddocuments</span>
|
| Expenses [Text Block] |
|
What were the fund costs for the last six months? (based on a hypothetical $10,000 investment)
Class Name |
Costs of a $10,000 investment |
Costs paid as a percentage of a $10,000 investmentFootnote Reference† |
Admin Class |
$50 |
0.99% |
| Footnote |
Description |
Footnote† |
Annualized for periods less than one year (if applicable). | |
| Expenses Paid, Amount |
|
$ 50
|
| Expense Ratio, Percent |
|
0.99%
|
| Material Change Date |
Jul. 01, 2025
|
|
| AssetsNet |
|
$ 15,946,414,461
|
| Holdings Count | Holding |
|
998
|
| Advisory Fees Paid, Amount |
|
$ 26,134,119
|
| InvestmentCompanyPortfolioTurnover |
|
34.00%
|
| Additional Fund Statistics [Text Block] |
|
- Total Net Assets$15,946,414,461
- # of Portfolio Holdings (including overnight repurchase agreements and derivatives)998
- Portfolio Turnover Rate34%
- Total Advisory Fees Paid (after waiver/reimbursement, if applicable)$26,134,119
|
| Holdings [Text Block] |
|
Value |
Value |
Other investments less than 3% of net assetsFootnote Reference* |
39.1% |
Short-Term Investments |
3.4% |
ABS Home Equity |
3.0% |
Finance Companies |
3.1% |
Aerospace & Defense |
3.6% |
Midstream |
3.7% |
Banking |
4.8% |
ABS Car Loan |
5.1% |
ABS Other |
7.1% |
Technology |
9.3% |
Treasuries |
17.8% |
| Footnote |
Description |
Footnote* |
Net of other assets less liabilities (including futures contracts) | Credit QualityFootnote Reference†
Value |
Value |
Cash & equivalents |
2.3 |
US Treasury |
18.0 |
Not ratedFootnote Reference^ |
17.0 |
CCC |
0.3 |
B |
1.2 |
BB |
4.9 |
BBB |
44.9 |
A |
7.9 |
AA |
1.4 |
AAA |
2.1 |
| Footnote |
Description |
Footnote† |
Credit ratings are by S&P Global Ratings. A credit rating is an assessment provided by a nationally recognized statistical rating organization (NRSRO) of the creditworthiness of an issuer with respect to debt obligations except for those debt obligations that are only privately rated. Ratings are measured on a scale that generally ranges from AAA (highest) to D (lowest). The credit ratings shown relate to the creditworthiness of the issuers of the underlying securities in the Fund, and not to the Fund or its shares. Credit ratings are subject to change. |
Footnote^ |
Not Rated category represents only those securities not rated by S&P Global Ratings. Such securities may be rated by other NRSROs not shown here. | |
| Credit Quality Explanation [Text Block] |
|
Credit ratings are by S&P Global Ratings. A credit rating is an assessment provided by a nationally recognized statistical rating organization (NRSRO) of the creditworthiness of an issuer with respect to debt obligations except for those debt obligations that are only privately rated. Ratings are measured on a scale that generally ranges from AAA (highest) to D (lowest). The credit ratings shown relate to the creditworthiness of the issuers of the underlying securities in the Fund, and not to the Fund or its shares. Credit ratings are subject to change.
|
| Material Fund Change [Text Block] |
|
Effective July 1, 2025, the Fund had the following material changes, which were reported in a supplement to the Fund's prospectus. For more information, you may review the Fund's prospectus at im.natixis.com/funddocuments or upon request at 800-225-5478 or through your financial intermediary. Expenses:The expense limit as a percentage of average daily net assets was reduced to 0.98% from 0.99%. Fees:The advisory fee rate as a percentage of average daily net assets will be 0.40% on the first $15 billion of assets, and 0.35% thereafter. |
| Material Fund Change Expenses [Text Block] |
|
Expenses:The expense limit as a percentage of average daily net assets was reduced to 0.98% from 0.99%. Fees:The advisory fee rate as a percentage of average daily net assets will be 0.40% on the first $15 billion of assets, and 0.35% thereafter.
|
| Summary of Change Legend [Text Block] |
|
Effective July 1, 2025, the Fund had the following material changes, which were reported in a supplement to the Fund's prospectus. For more information, you may review the Fund's prospectus at im.natixis.com/funddocuments or upon request at 800-225-5478 or through your financial intermediary.
|
| Updated Prospectus Phone Number |
|
800-225-5478
|
| Updated Prospectus Web Address |
|
<span style="box-sizing: border-box; color: rgb(0, 0, 0); display: inline; flex-wrap: nowrap; font-size: 10.6667px; font-weight: 400; grid-area: auto; line-height: 16px; margin: 0px; overflow: visible; text-align: left; text-align-last: auto; white-space-collapse: preserve-breaks;">im.natixis.com/funddocuments</span>
|
| C000018251 |
|
|
| Shareholder Report [Line Items] |
|
|
| Fund Name |
|
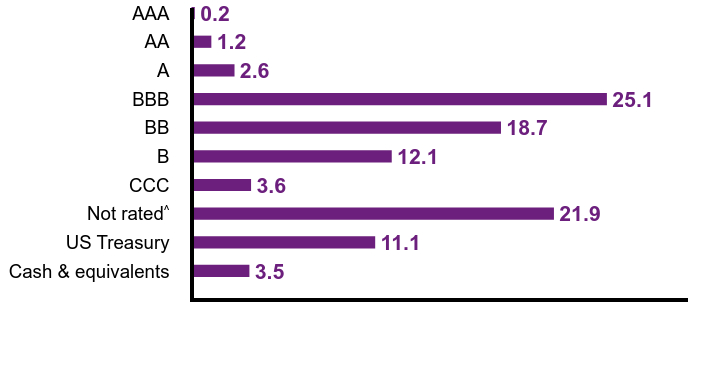
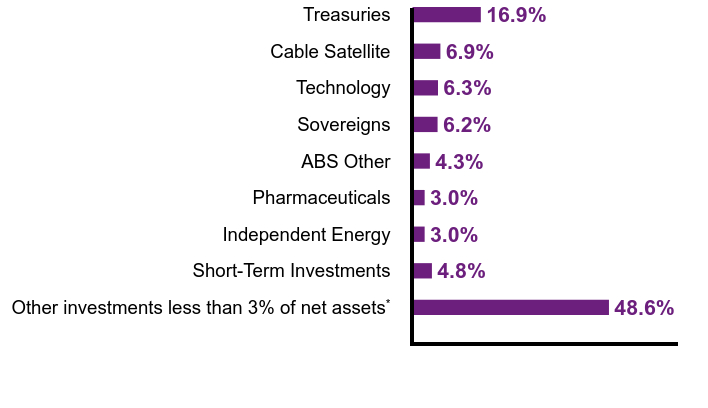
Loomis Sayles Strategic Income Fund
|
| Class Name |
|
Class A
|
| Trading Symbol |
|
NEFZX
|
| Annual or Semi-Annual Statement [Text Block] |
|
This semi-annual shareholder report contains important information about Loomis Sayles Strategic Income Fund for the period of January 1, 2025 to June 30, 2025.
|
| Shareholder Report Annual or Semi-Annual |
|
Semi-annual Shareholder Report
|
| Additional Information [Text Block] |
|
You can find additional information (including tax information) about the Fund at im.natixis.com/funddocuments. You can also request the information by contacting us at (800) 225-5478 or by contacting your financial intermediary directly.
|
| Additional Information Phone Number |
|
(800) 225-5478
|
| Additional Information Website |
|
<span style="box-sizing: border-box; color: rgb(0, 0, 0); display: inline; flex-wrap: nowrap; font-size: 12px; font-weight: 400; grid-area: auto; line-height: 18px; margin: 0px; overflow: visible; text-align: left; text-align-last: auto; white-space-collapse: preserve-breaks;">im.natixis.com/funddocuments</span>
|
| Expenses [Text Block] |
|
What were the fund costs for the last six months? (based on a hypothetical $10,000 investment)
Class Name |
Costs of a $10,000 investment |
Costs paid as a percentage of a $10,000 investmentFootnote Reference† |
Class A |
$47 |
0.92% |
| Footnote |
Description |
Footnote† |
Annualized for periods less than one year (if applicable). | |
| Expenses Paid, Amount |
|
$ 47
|
| Expense Ratio, Percent |
|
0.92%
|
| AssetsNet |
|
$ 2,613,697,240
|
| Holdings Count | Holding |
|
567
|
| Advisory Fees Paid, Amount |
|
$ 6,611,554
|
| InvestmentCompanyPortfolioTurnover |
|
59.00%
|
| Additional Fund Statistics [Text Block] |
|
- Total Net Assets$2,613,697,240
- # of Portfolio Holdings (including overnight repurchase agreements and derivatives)567
- Portfolio Turnover Rate59%
- Total Advisory Fees Paid (after waiver/reimbursement, if applicable)$6,611,554
|
| Holdings [Text Block] |
|
Value |
Value |
Other investments less than 3% of net assetsFootnote Reference* |
48.6% |
Short-Term Investments |
4.8% |
Independent Energy |
3.0% |
Pharmaceuticals |
3.0% |
ABS Other |
4.3% |
Sovereigns |
6.2% |
Technology |
6.3% |
Cable Satellite |
6.9% |
Treasuries |
16.9% |
| Footnote |
Description |
Footnote* |
Net of other assets less liabilities (including open written options, forward foreign currency contracts, and futures contracts) | Credit QualityFootnote Reference†
Value |
Value |
Cash & equivalents |
3.5 |
US Treasury |
11.1 |
Not ratedFootnote Reference^ |
21.9 |
CCC |
3.6 |
B |
12.1 |
BB |
18.7 |
BBB |
25.1 |
A |
2.6 |
AA |
1.2 |
AAA |
0.2 |
| Footnote |
Description |
Footnote† |
Credit ratings are by S&P Global Ratings. A credit rating is an assessment provided by a nationally recognized statistical rating organization (NRSRO) of the creditworthiness of an issuer with respect to debt obligations except for those debt obligations that are only privately rated. Ratings are measured on a scale that generally ranges from AAA (highest) to D (lowest). The credit ratings shown relate to the creditworthiness of the issuers of the underlying securities in the Fund, and not to the Fund or its shares. Credit ratings are subject to change. |
Footnote^ |
Not Rated category represents only those securities not rated by S&P Global Ratings. Such securities may be rated by other NRSROs not shown here. | |
| Credit Quality Explanation [Text Block] |
|
Credit ratings are by S&P Global Ratings. A credit rating is an assessment provided by a nationally recognized statistical rating organization (NRSRO) of the creditworthiness of an issuer with respect to debt obligations except for those debt obligations that are only privately rated. Ratings are measured on a scale that generally ranges from AAA (highest) to D (lowest). The credit ratings shown relate to the creditworthiness of the issuers of the underlying securities in the Fund, and not to the Fund or its shares. Credit ratings are subject to change.
|
| Material Fund Change [Text Block] |
|
There were no material fund changes during the period. |
| C000018253 |
|
|
| Shareholder Report [Line Items] |
|
|
| Fund Name |
|
Loomis Sayles Strategic Income Fund
|
| Class Name |
|
Class C
|
| Trading Symbol |
|
NECZX
|
| Annual or Semi-Annual Statement [Text Block] |
|
This semi-annual shareholder report contains important information about Loomis Sayles Strategic Income Fund for the period of January 1, 2025 to June 30, 2025.
|
| Shareholder Report Annual or Semi-Annual |
|
Semi-annual Shareholder Report
|
| Additional Information [Text Block] |
|
You can find additional information (including tax information) about the Fund at im.natixis.com/funddocuments. You can also request the information by contacting us at (800) 225-5478 or by contacting your financial intermediary directly.
|
| Additional Information Phone Number |
|
(800) 225-5478
|
| Additional Information Website |
|
<span style="box-sizing: border-box; color: rgb(0, 0, 0); display: inline; flex-wrap: nowrap; font-size: 12px; font-weight: 400; grid-area: auto; line-height: 18px; margin: 0px; overflow: visible; text-align: left; text-align-last: auto; white-space-collapse: preserve-breaks;">im.natixis.com/funddocuments</span>
|
| Expenses [Text Block] |
|
What were the fund costs for the last six months? (based on a hypothetical $10,000 investment)
Class Name |
Costs of a $10,000 investment |
Costs paid as a percentage of a $10,000 investmentFootnote Reference† |
Class C |
$85 |
1.67% |
| Footnote |
Description |
Footnote† |
Annualized for periods less than one year (if applicable). | |
| Expenses Paid, Amount |
|
$ 85
|
| Expense Ratio, Percent |
|
1.67%
|
| AssetsNet |
|
$ 2,613,697,240
|
| Holdings Count | Holding |
|
567
|
| Advisory Fees Paid, Amount |
|
$ 6,611,554
|
| InvestmentCompanyPortfolioTurnover |
|
59.00%
|
| Additional Fund Statistics [Text Block] |
|
- Total Net Assets$2,613,697,240
- # of Portfolio Holdings (including overnight repurchase agreements and derivatives)567
- Portfolio Turnover Rate59%
- Total Advisory Fees Paid (after waiver/reimbursement, if applicable)$6,611,554
|
| Holdings [Text Block] |
|
Value |
Value |
Other investments less than 3% of net assetsFootnote Reference* |
48.6% |
Short-Term Investments |
4.8% |
Independent Energy |
3.0% |
Pharmaceuticals |
3.0% |
ABS Other |
4.3% |
Sovereigns |
6.2% |
Technology |
6.3% |
Cable Satellite |
6.9% |
Treasuries |
16.9% |
| Footnote |
Description |
Footnote* |
Net of other assets less liabilities (including open written options, forward foreign currency contracts, and futures contracts) | Credit QualityFootnote Reference†
Value |
Value |
Cash & equivalents |
3.5 |
US Treasury |
11.1 |
Not ratedFootnote Reference^ |
21.9 |
CCC |
3.6 |
B |
12.1 |
BB |
18.7 |
BBB |
25.1 |
A |
2.6 |
AA |
1.2 |
AAA |
0.2 |
| Footnote |
Description |
Footnote† |
Credit ratings are by S&P Global Ratings. A credit rating is an assessment provided by a nationally recognized statistical rating organization (NRSRO) of the creditworthiness of an issuer with respect to debt obligations except for those debt obligations that are only privately rated. Ratings are measured on a scale that generally ranges from AAA (highest) to D (lowest). The credit ratings shown relate to the creditworthiness of the issuers of the underlying securities in the Fund, and not to the Fund or its shares. Credit ratings are subject to change. |
Footnote^ |
Not Rated category represents only those securities not rated by S&P Global Ratings. Such securities may be rated by other NRSROs not shown here. | |
| Credit Quality Explanation [Text Block] |
|
Credit ratings are by S&P Global Ratings. A credit rating is an assessment provided by a nationally recognized statistical rating organization (NRSRO) of the creditworthiness of an issuer with respect to debt obligations except for those debt obligations that are only privately rated. Ratings are measured on a scale that generally ranges from AAA (highest) to D (lowest). The credit ratings shown relate to the creditworthiness of the issuers of the underlying securities in the Fund, and not to the Fund or its shares. Credit ratings are subject to change.
|
| Material Fund Change [Text Block] |
|
There were no material fund changes during the period. |
| C000125487 |
|
|
| Shareholder Report [Line Items] |
|
|
| Fund Name |
|
Loomis Sayles Strategic Income Fund
|
| Class Name |
|
Class N
|
| Trading Symbol |
|
NEZNX
|
| Annual or Semi-Annual Statement [Text Block] |
|
This semi-annual shareholder report contains important information about Loomis Sayles Strategic Income Fund for the period of January 1, 2025 to June 30, 2025.
|
| Shareholder Report Annual or Semi-Annual |
|
Semi-annual Shareholder Report
|
| Additional Information [Text Block] |
|
You can find additional information (including tax information) about the Fund at im.natixis.com/funddocuments. You can also request the information by contacting us at (800) 225-5478 or by contacting your financial intermediary directly.
|
| Additional Information Phone Number |
|
(800) 225-5478
|
| Additional Information Website |
|
<span style="box-sizing: border-box; color: rgb(0, 0, 0); display: inline; flex-wrap: nowrap; font-size: 12px; font-weight: 400; grid-area: auto; line-height: 18px; margin: 0px; overflow: visible; text-align: left; text-align-last: auto; white-space-collapse: preserve-breaks;">im.natixis.com/funddocuments</span>
|
| Expenses [Text Block] |
|
What were the fund costs for the last six months? (based on a hypothetical $10,000 investment)
Class Name |
Costs of a $10,000 investment |
Costs paid as a percentage of a $10,000 investmentFootnote Reference† |
Class N |
$32 |
0.62% |
| Footnote |
Description |
Footnote† |
Annualized for periods less than one year (if applicable). | |
| Expenses Paid, Amount |
|
$ 32
|
| Expense Ratio, Percent |
|
0.62%
|
| AssetsNet |
|
$ 2,613,697,240
|
| Holdings Count | Holding |
|
567
|
| Advisory Fees Paid, Amount |
|
$ 6,611,554
|
| InvestmentCompanyPortfolioTurnover |
|
59.00%
|
| Additional Fund Statistics [Text Block] |
|
- Total Net Assets$2,613,697,240
- # of Portfolio Holdings (including overnight repurchase agreements and derivatives)567
- Portfolio Turnover Rate59%
- Total Advisory Fees Paid (after waiver/reimbursement, if applicable)$6,611,554
|
| Holdings [Text Block] |
|
Value |
Value |
Other investments less than 3% of net assetsFootnote Reference* |
48.6% |
Short-Term Investments |
4.8% |
Independent Energy |
3.0% |
Pharmaceuticals |
3.0% |
ABS Other |
4.3% |
Sovereigns |
6.2% |
Technology |
6.3% |
Cable Satellite |
6.9% |
Treasuries |
16.9% |
| Footnote |
Description |
Footnote* |
Net of other assets less liabilities (including open written options, forward foreign currency contracts, and futures contracts) | Credit QualityFootnote Reference†
Value |
Value |
Cash & equivalents |
3.5 |
US Treasury |
11.1 |
Not ratedFootnote Reference^ |
21.9 |
CCC |
3.6 |
B |
12.1 |
BB |
18.7 |
BBB |
25.1 |
A |
2.6 |
AA |
1.2 |
AAA |
0.2 |
| Footnote |
Description |
Footnote† |
Credit ratings are by S&P Global Ratings. A credit rating is an assessment provided by a nationally recognized statistical rating organization (NRSRO) of the creditworthiness of an issuer with respect to debt obligations except for those debt obligations that are only privately rated. Ratings are measured on a scale that generally ranges from AAA (highest) to D (lowest). The credit ratings shown relate to the creditworthiness of the issuers of the underlying securities in the Fund, and not to the Fund or its shares. Credit ratings are subject to change. |
Footnote^ |
Not Rated category represents only those securities not rated by S&P Global Ratings. Such securities may be rated by other NRSROs not shown here. | |
| Credit Quality Explanation [Text Block] |
|
Credit ratings are by S&P Global Ratings. A credit rating is an assessment provided by a nationally recognized statistical rating organization (NRSRO) of the creditworthiness of an issuer with respect to debt obligations except for those debt obligations that are only privately rated. Ratings are measured on a scale that generally ranges from AAA (highest) to D (lowest). The credit ratings shown relate to the creditworthiness of the issuers of the underlying securities in the Fund, and not to the Fund or its shares. Credit ratings are subject to change.
|
| Material Fund Change [Text Block] |
|
There were no material fund changes during the period. |
| C000018254 |
|
|
| Shareholder Report [Line Items] |
|
|
| Fund Name |
|
Loomis Sayles Strategic Income Fund
|
| Class Name |
|
Class Y
|
| Trading Symbol |
|
NEZYX
|
| Annual or Semi-Annual Statement [Text Block] |
|
This semi-annual shareholder report contains important information about Loomis Sayles Strategic Income Fund for the period of January 1, 2025 to June 30, 2025.
|
| Shareholder Report Annual or Semi-Annual |
|
Semi-annual Shareholder Report
|
| Additional Information [Text Block] |
|
You can find additional information (including tax information) about the Fund at im.natixis.com/funddocuments. You can also request the information by contacting us at (800) 225-5478 or by contacting your financial intermediary directly.
|
| Additional Information Phone Number |
|
(800) 225-5478
|
| Additional Information Website |
|
<span style="box-sizing: border-box; color: rgb(0, 0, 0); display: inline; flex-wrap: nowrap; font-size: 12px; font-weight: 400; grid-area: auto; line-height: 18px; margin: 0px; overflow: visible; text-align: left; text-align-last: auto; white-space-collapse: preserve-breaks;">im.natixis.com/funddocuments</span>
|
| Expenses [Text Block] |
|
What were the fund costs for the last six months? (based on a hypothetical $10,000 investment)
Class Name |
Costs of a $10,000 investment |
Costs paid as a percentage of a $10,000 investmentFootnote Reference† |
Class Y |
$34 |
0.67% |
| Footnote |
Description |
Footnote† |
Annualized for periods less than one year (if applicable). | |
| Expenses Paid, Amount |
|
$ 34
|
| Expense Ratio, Percent |
|
0.67%
|
| AssetsNet |
|
$ 2,613,697,240
|
| Holdings Count | Holding |
|
567
|
| Advisory Fees Paid, Amount |
|
$ 6,611,554
|
| InvestmentCompanyPortfolioTurnover |
|
59.00%
|
| Additional Fund Statistics [Text Block] |
|
- Total Net Assets$2,613,697,240
- # of Portfolio Holdings (including overnight repurchase agreements and derivatives)567
- Portfolio Turnover Rate59%
- Total Advisory Fees Paid (after waiver/reimbursement, if applicable)$6,611,554
|
| Holdings [Text Block] |
|
Value |
Value |
Other investments less than 3% of net assetsFootnote Reference* |
48.6% |
Short-Term Investments |
4.8% |
Independent Energy |
3.0% |
Pharmaceuticals |
3.0% |
ABS Other |
4.3% |
Sovereigns |
6.2% |
Technology |
6.3% |
Cable Satellite |
6.9% |
Treasuries |
16.9% |
| Footnote |
Description |
Footnote* |
Net of other assets less liabilities (including open written options, forward foreign currency contracts, and futures contracts) | Credit QualityFootnote Reference†
Value |
Value |
Cash & equivalents |
3.5 |
US Treasury |
11.1 |
Not ratedFootnote Reference^ |
21.9 |
CCC |
3.6 |
B |
12.1 |
BB |
18.7 |
BBB |
25.1 |
A |
2.6 |
AA |
1.2 |
AAA |
0.2 |
| Footnote |
Description |
Footnote† |
Credit ratings are by S&P Global Ratings. A credit rating is an assessment provided by a nationally recognized statistical rating organization (NRSRO) of the creditworthiness of an issuer with respect to debt obligations except for those debt obligations that are only privately rated. Ratings are measured on a scale that generally ranges from AAA (highest) to D (lowest). The credit ratings shown relate to the creditworthiness of the issuers of the underlying securities in the Fund, and not to the Fund or its shares. Credit ratings are subject to change. |
Footnote^ |
Not Rated category represents only those securities not rated by S&P Global Ratings. Such securities may be rated by other NRSROs not shown here. | |
| Credit Quality Explanation [Text Block] |
|
Credit ratings are by S&P Global Ratings. A credit rating is an assessment provided by a nationally recognized statistical rating organization (NRSRO) of the creditworthiness of an issuer with respect to debt obligations except for those debt obligations that are only privately rated. Ratings are measured on a scale that generally ranges from AAA (highest) to D (lowest). The credit ratings shown relate to the creditworthiness of the issuers of the underlying securities in the Fund, and not to the Fund or its shares. Credit ratings are subject to change.
|
| Material Fund Change [Text Block] |
|
There were no material fund changes during the period. |
| C000082999 |
|
|
| Shareholder Report [Line Items] |
|
|
| Fund Name |
|
Loomis Sayles Strategic Income Fund
|
| Class Name |
|
Admin Class
|
| Trading Symbol |
|
NEZAX
|
| Annual or Semi-Annual Statement [Text Block] |
|
This semi-annual shareholder report contains important information about Loomis Sayles Strategic Income Fund for the period of January 1, 2025 to June 30, 2025.
|
| Shareholder Report Annual or Semi-Annual |
|
Semi-annual Shareholder Report
|
| Additional Information [Text Block] |
|
You can find additional information (including tax information) about the Fund at im.natixis.com/funddocuments. You can also request the information by contacting us at (800) 225-5478 or by contacting your financial intermediary directly.
|
| Additional Information Phone Number |
|
(800) 225-5478
|
| Additional Information Website |
|
<span style="box-sizing: border-box; color: rgb(0, 0, 0); display: inline; flex-wrap: nowrap; font-size: 12px; font-weight: 400; grid-area: auto; line-height: 18px; margin: 0px; overflow: visible; text-align: left; text-align-last: auto; white-space-collapse: preserve-breaks;">im.natixis.com/funddocuments</span>
|
| Expenses [Text Block] |
|
What were the fund costs for the last six months? (based on a hypothetical $10,000 investment)
Class Name |
Costs of a $10,000 investment |
Costs paid as a percentage of a $10,000 investmentFootnote Reference† |
Admin Class |
$60 |
1.17% |
| Footnote |
Description |
Footnote† |
Annualized for periods less than one year (if applicable). | |
| Expenses Paid, Amount |
|
$ 60
|
| Expense Ratio, Percent |
|
1.17%
|
| AssetsNet |
|
$ 2,613,697,240
|
| Holdings Count | Holding |
|
567
|
| Advisory Fees Paid, Amount |
|
$ 6,611,554
|
| InvestmentCompanyPortfolioTurnover |
|
59.00%
|
| Additional Fund Statistics [Text Block] |
|
- Total Net Assets$2,613,697,240
- # of Portfolio Holdings (including overnight repurchase agreements and derivatives)567
- Portfolio Turnover Rate59%
- Total Advisory Fees Paid (after waiver/reimbursement, if applicable)$6,611,554
|
| Holdings [Text Block] |
|
Value |
Value |
Other investments less than 3% of net assetsFootnote Reference* |
48.6% |
Short-Term Investments |
4.8% |
Independent Energy |
3.0% |
Pharmaceuticals |
3.0% |
ABS Other |
4.3% |
Sovereigns |
6.2% |
Technology |
6.3% |
Cable Satellite |
6.9% |
Treasuries |
16.9% |
| Footnote |
Description |
Footnote* |
Net of other assets less liabilities (including open written options, forward foreign currency contracts, and futures contracts) | Credit QualityFootnote Reference†
Value |
Value |
Cash & equivalents |
3.5 |
US Treasury |
11.1 |
Not ratedFootnote Reference^ |
21.9 |
CCC |
3.6 |
B |
12.1 |
BB |
18.7 |
BBB |
25.1 |
A |
2.6 |
AA |
1.2 |
AAA |
0.2 |
| Footnote |
Description |
Footnote† |
Credit ratings are by S&P Global Ratings. A credit rating is an assessment provided by a nationally recognized statistical rating organization (NRSRO) of the creditworthiness of an issuer with respect to debt obligations except for those debt obligations that are only privately rated. Ratings are measured on a scale that generally ranges from AAA (highest) to D (lowest). The credit ratings shown relate to the creditworthiness of the issuers of the underlying securities in the Fund, and not to the Fund or its shares. Credit ratings are subject to change. |
Footnote^ |
Not Rated category represents only those securities not rated by S&P Global Ratings. Such securities may be rated by other NRSROs not shown here. | |
| Credit Quality Explanation [Text Block] |
|
Credit ratings are by S&P Global Ratings. A credit rating is an assessment provided by a nationally recognized statistical rating organization (NRSRO) of the creditworthiness of an issuer with respect to debt obligations except for those debt obligations that are only privately rated. Ratings are measured on a scale that generally ranges from AAA (highest) to D (lowest). The credit ratings shown relate to the creditworthiness of the issuers of the underlying securities in the Fund, and not to the Fund or its shares. Credit ratings are subject to change.
|
| Material Fund Change [Text Block] |
|
There were no material fund changes during the period. |