Shareholder Report
Jun. 30, 2025
USD ($)
Holding
Shareholder Report |
6 Months Ended |
|---|---|
|
Jun. 30, 2025
USD ($)
Holding
| |
| Shareholder Report [Line Items] | |
| Document Type | N-CSRS |
| Amendment Flag | false |
| Registrant Name | Natixis Funds Trust II |
| Entity Central Index Key | 0000052136 |
| Entity Investment Company Type | N-1A |
| Document Period End Date | Jun. 30, 2025 |
| C000094853 | |
| Shareholder Report [Line Items] | |
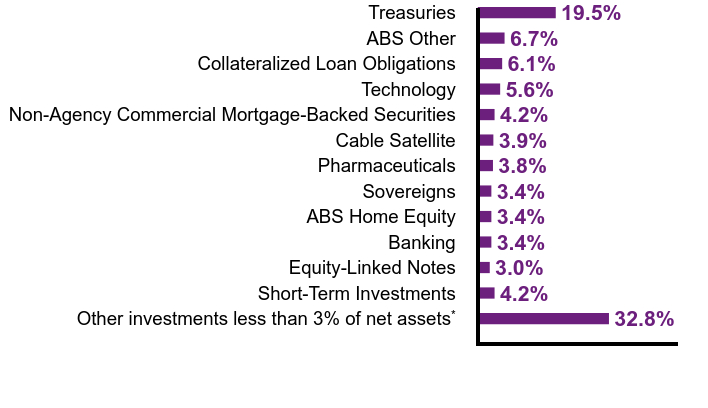
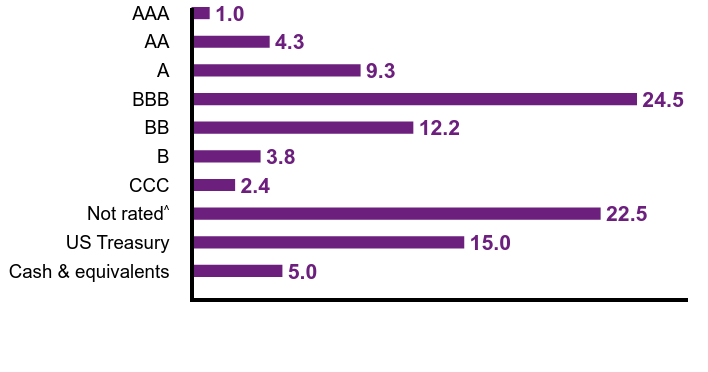
| Fund Name | Loomis Sayles Strategic Alpha Fund |
| Class Name | Class A |
| Trading Symbol | LABAX |
| Annual or Semi-Annual Statement [Text Block] | This semi-annual shareholder report contains important information about Loomis Sayles Strategic Alpha Fund for the period of January 1, 2025 to June 30, 2025. |
| Shareholder Report Annual or Semi-Annual | Semi-annual Shareholder Report |
| Additional Information [Text Block] | You can find additional information (including tax information) about the Fund at im.natixis.com/funddocuments. You can also request the information by contacting us at (800) 225-5478 or by contacting your financial intermediary directly. |
| Additional Information Phone Number | (800) 225-5478 |
| Additional Information Website | <span style="box-sizing: border-box; color: rgb(0, 0, 0); display: inline; flex-wrap: nowrap; font-size: 12px; font-weight: 400; grid-area: auto; line-height: 18px; margin: 0px; overflow: visible; text-align: left; text-align-last: auto; white-space-collapse: preserve-breaks;">im.natixis.com/funddocuments</span> |
| Expenses [Text Block] | |
| Expenses Paid, Amount | $ 50 |
| Expense Ratio, Percent | 0.98% |
| AssetsNet | $ 842,659,068 |
| Holdings Count | Holding | 773 |
| Advisory Fees Paid, Amount | $ 1,968,056 |
| InvestmentCompanyPortfolioTurnover | 31.00% |
| Additional Fund Statistics [Text Block] | |
| Holdings [Text Block] | |
| Credit Quality Explanation [Text Block] | Credit ratings are by S&P Global Ratings. A credit rating is an assessment provided by a nationally recognized statistical rating organization (NRSRO) of the creditworthiness of an issuer with respect to debt obligations except for those debt obligations that are only privately rated. Ratings are measured on a scale that generally ranges from AAA (highest) to D (lowest). The credit ratings shown relate to the creditworthiness of the issuers of the underlying securities in the Fund, and not to the Fund or its shares. Credit ratings are subject to change. |
| Material Fund Change [Text Block] | |
| C000094854 | |
| Shareholder Report [Line Items] | |
| Fund Name | Loomis Sayles Strategic Alpha Fund |
| Class Name | Class C |
| Trading Symbol | LABCX |
| Annual or Semi-Annual Statement [Text Block] | This semi-annual shareholder report contains important information about Loomis Sayles Strategic Alpha Fund for the period of January 1, 2025 to June 30, 2025. |
| Shareholder Report Annual or Semi-Annual | Semi-annual Shareholder Report |
| Additional Information [Text Block] | You can find additional information (including tax information) about the Fund at im.natixis.com/funddocuments. You can also request the information by contacting us at (800) 225-5478 or by contacting your financial intermediary directly. |
| Additional Information Phone Number | (800) 225-5478 |
| Additional Information Website | <span style="box-sizing: border-box; color: rgb(0, 0, 0); display: inline; flex-wrap: nowrap; font-size: 12px; font-weight: 400; grid-area: auto; line-height: 18px; margin: 0px; overflow: visible; text-align: left; text-align-last: auto; white-space-collapse: preserve-breaks;">im.natixis.com/funddocuments</span> |
| Expenses [Text Block] | |
| Expenses Paid, Amount | $ 87 |
| Expense Ratio, Percent | 1.73% |
| AssetsNet | $ 842,659,068 |
| Holdings Count | Holding | 773 |
| Advisory Fees Paid, Amount | $ 1,968,056 |
| InvestmentCompanyPortfolioTurnover | 31.00% |
| Additional Fund Statistics [Text Block] | |
| Holdings [Text Block] | |
| Credit Quality Explanation [Text Block] | Credit ratings are by S&P Global Ratings. A credit rating is an assessment provided by a nationally recognized statistical rating organization (NRSRO) of the creditworthiness of an issuer with respect to debt obligations except for those debt obligations that are only privately rated. Ratings are measured on a scale that generally ranges from AAA (highest) to D (lowest). The credit ratings shown relate to the creditworthiness of the issuers of the underlying securities in the Fund, and not to the Fund or its shares. Credit ratings are subject to change. |
| Material Fund Change [Text Block] | |
| C000190722 | |
| Shareholder Report [Line Items] | |
| Fund Name | Loomis Sayles Strategic Alpha Fund |
| Class Name | Class N |
| Trading Symbol | LASNX |
| Annual or Semi-Annual Statement [Text Block] | This semi-annual shareholder report contains important information about Loomis Sayles Strategic Alpha Fund for the period of January 1, 2025 to June 30, 2025. |
| Shareholder Report Annual or Semi-Annual | Semi-annual Shareholder Report |
| Additional Information [Text Block] | You can find additional information (including tax information) about the Fund at im.natixis.com/funddocuments. You can also request the information by contacting us at (800) 225-5478 or by contacting your financial intermediary directly. |
| Additional Information Phone Number | (800) 225-5478 |
| Additional Information Website | <span style="box-sizing: border-box; color: rgb(0, 0, 0); display: inline; flex-wrap: nowrap; font-size: 12px; font-weight: 400; grid-area: auto; line-height: 18px; margin: 0px; overflow: visible; text-align: left; text-align-last: auto; white-space-collapse: preserve-breaks;">im.natixis.com/funddocuments</span> |
| Expenses [Text Block] | |
| Expenses Paid, Amount | $ 34 |
| Expense Ratio, Percent | 0.68% |
| AssetsNet | $ 842,659,068 |
| Holdings Count | Holding | 773 |
| Advisory Fees Paid, Amount | $ 1,968,056 |
| InvestmentCompanyPortfolioTurnover | 31.00% |
| Additional Fund Statistics [Text Block] | |
| Holdings [Text Block] | |
| Credit Quality Explanation [Text Block] | Credit ratings are by S&P Global Ratings. A credit rating is an assessment provided by a nationally recognized statistical rating organization (NRSRO) of the creditworthiness of an issuer with respect to debt obligations except for those debt obligations that are only privately rated. Ratings are measured on a scale that generally ranges from AAA (highest) to D (lowest). The credit ratings shown relate to the creditworthiness of the issuers of the underlying securities in the Fund, and not to the Fund or its shares. Credit ratings are subject to change. |
| Material Fund Change [Text Block] | |
| C000094855 | |
| Shareholder Report [Line Items] | |
| Fund Name | Loomis Sayles Strategic Alpha Fund |
| Class Name | Class Y |
| Trading Symbol | LASYX |
| Annual or Semi-Annual Statement [Text Block] | This semi-annual shareholder report contains important information about Loomis Sayles Strategic Alpha Fund for the period of January 1, 2025 to June 30, 2025. |
| Shareholder Report Annual or Semi-Annual | Semi-annual Shareholder Report |
| Additional Information [Text Block] | You can find additional information (including tax information) about the Fund at im.natixis.com/funddocuments. You can also request the information by contacting us at (800) 225-5478 or by contacting your financial intermediary directly. |
| Additional Information Phone Number | (800) 225-5478 |
| Additional Information Website | <span style="box-sizing: border-box; color: rgb(0, 0, 0); display: inline; flex-wrap: nowrap; font-size: 12px; font-weight: 400; grid-area: auto; line-height: 18px; margin: 0px; overflow: visible; text-align: left; text-align-last: auto; white-space-collapse: preserve-breaks;">im.natixis.com/funddocuments</span> |
| Expenses [Text Block] | |
| Expenses Paid, Amount | $ 37 |
| Expense Ratio, Percent | 0.73% |
| AssetsNet | $ 842,659,068 |
| Holdings Count | Holding | 773 |
| Advisory Fees Paid, Amount | $ 1,968,056 |
| InvestmentCompanyPortfolioTurnover | 31.00% |
| Additional Fund Statistics [Text Block] | |
| Holdings [Text Block] | |
| Credit Quality Explanation [Text Block] | Credit ratings are by S&P Global Ratings. A credit rating is an assessment provided by a nationally recognized statistical rating organization (NRSRO) of the creditworthiness of an issuer with respect to debt obligations except for those debt obligations that are only privately rated. Ratings are measured on a scale that generally ranges from AAA (highest) to D (lowest). The credit ratings shown relate to the creditworthiness of the issuers of the underlying securities in the Fund, and not to the Fund or its shares. Credit ratings are subject to change. |
| Material Fund Change [Text Block] | |
| C000021802 | |
| Shareholder Report [Line Items] | |
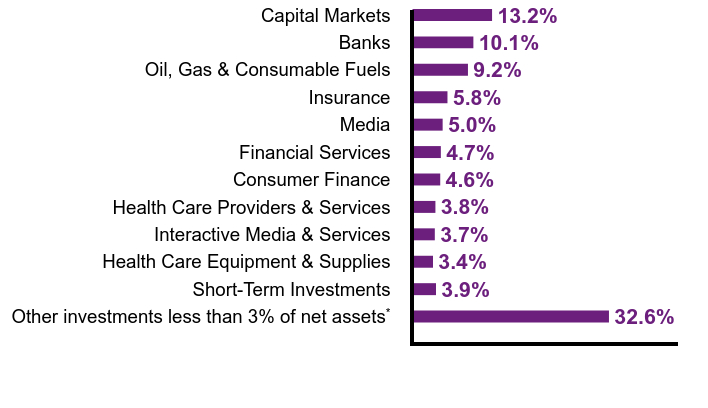
| Fund Name | Natixis Oakmark Fund |
| Class Name | Class A |
| Trading Symbol | NEFOX |
| Annual or Semi-Annual Statement [Text Block] | This semi-annual shareholder report contains important information about Natixis Oakmark Fund for the period of January 1, 2025 to June 30, 2025. |
| Shareholder Report Annual or Semi-Annual | Semi-annual Shareholder Report |
| Additional Information [Text Block] | You can find additional information (including tax information) about the Fund at im.natixis.com/funddocuments. You can also request the information by contacting us at (800) 225-5478 or by contacting your financial intermediary directly. |
| Additional Information Phone Number | (800) 225-5478 |
| Additional Information Website | <span style="box-sizing: border-box; color: rgb(0, 0, 0); display: inline; flex-wrap: nowrap; font-size: 12px; font-weight: 400; grid-area: auto; line-height: 18px; margin: 0px; overflow: visible; text-align: left; text-align-last: auto; white-space-collapse: preserve-breaks;">im.natixis.com/funddocuments</span> |
| Expenses [Text Block] | |
| Expenses Paid, Amount | $ 53 |
| Expense Ratio, Percent | 1.03% |
| AssetsNet | $ 1,089,855,797 |
| Holdings Count | Holding | 56 |
| Advisory Fees Paid, Amount | $ 3,093,015 |
| InvestmentCompanyPortfolioTurnover | 28.00% |
| Additional Fund Statistics [Text Block] | |
| Holdings [Text Block] | |
| Largest Holdings [Text Block] | |
| Material Fund Change [Text Block] | |
| C000021804 | |
| Shareholder Report [Line Items] | |
| Fund Name | Natixis Oakmark Fund |
| Class Name | Class C |
| Trading Symbol | NECOX |
| Annual or Semi-Annual Statement [Text Block] | This semi-annual shareholder report contains important information about Natixis Oakmark Fund for the period of January 1, 2025 to June 30, 2025. |
| Shareholder Report Annual or Semi-Annual | Semi-annual Shareholder Report |
| Additional Information [Text Block] | You can find additional information (including tax information) about the Fund at im.natixis.com/funddocuments. You can also request the information by contacting us at (800) 225-5478 or by contacting your financial intermediary directly. |
| Additional Information Phone Number | (800) 225-5478 |
| Additional Information Website | <span style="box-sizing: border-box; color: rgb(0, 0, 0); display: inline; flex-wrap: nowrap; font-size: 12px; font-weight: 400; grid-area: auto; line-height: 18px; margin: 0px; overflow: visible; text-align: left; text-align-last: auto; white-space-collapse: preserve-breaks;">im.natixis.com/funddocuments</span> |
| Expenses [Text Block] | |
| Expenses Paid, Amount | $ 91 |
| Expense Ratio, Percent | 1.78% |
| AssetsNet | $ 1,089,855,797 |
| Holdings Count | Holding | 56 |
| Advisory Fees Paid, Amount | $ 3,093,015 |
| InvestmentCompanyPortfolioTurnover | 28.00% |
| Additional Fund Statistics [Text Block] | |
| Holdings [Text Block] | |
| Largest Holdings [Text Block] | |
| Material Fund Change [Text Block] | |
| C000190720 | |
| Shareholder Report [Line Items] | |
| Fund Name | Natixis Oakmark Fund |
| Class Name | Class N |
| Trading Symbol | NOANX |
| Annual or Semi-Annual Statement [Text Block] | This semi-annual shareholder report contains important information about Natixis Oakmark Fund for the period of January 1, 2025 to June 30, 2025. |
| Shareholder Report Annual or Semi-Annual | Semi-annual Shareholder Report |
| Additional Information [Text Block] | You can find additional information (including tax information) about the Fund at im.natixis.com/funddocuments. You can also request the information by contacting us at (800) 225-5478 or by contacting your financial intermediary directly. |
| Additional Information Phone Number | (800) 225-5478 |
| Additional Information Website | <span style="box-sizing: border-box; color: rgb(0, 0, 0); display: inline; flex-wrap: nowrap; font-size: 12px; font-weight: 400; grid-area: auto; line-height: 18px; margin: 0px; overflow: visible; text-align: left; text-align-last: auto; white-space-collapse: preserve-breaks;">im.natixis.com/funddocuments</span> |
| Expenses [Text Block] | |
| Expenses Paid, Amount | $ 37 |
| Expense Ratio, Percent | 0.73% |
| AssetsNet | $ 1,089,855,797 |
| Holdings Count | Holding | 56 |
| Advisory Fees Paid, Amount | $ 3,093,015 |
| InvestmentCompanyPortfolioTurnover | 28.00% |
| Additional Fund Statistics [Text Block] | |
| Holdings [Text Block] | |
| Largest Holdings [Text Block] | |
| Material Fund Change [Text Block] | |
| C000021805 | |
| Shareholder Report [Line Items] | |
| Fund Name | Natixis Oakmark Fund |
| Class Name | Class Y |
| Trading Symbol | NEOYX |
| Annual or Semi-Annual Statement [Text Block] | This semi-annual shareholder report contains important information about Natixis Oakmark Fund for the period of January 1, 2025 to June 30, 2025. |
| Shareholder Report Annual or Semi-Annual | Semi-annual Shareholder Report |
| Additional Information [Text Block] | You can find additional information (including tax information) about the Fund at im.natixis.com/funddocuments. You can also request the information by contacting us at (800) 225-5478 or by contacting your financial intermediary directly. |
| Additional Information Phone Number | (800) 225-5478 |
| Additional Information Website | <span style="box-sizing: border-box; color: rgb(0, 0, 0); display: inline; flex-wrap: nowrap; font-size: 12px; font-weight: 400; grid-area: auto; line-height: 18px; margin: 0px; overflow: visible; text-align: left; text-align-last: auto; white-space-collapse: preserve-breaks;">im.natixis.com/funddocuments</span> |
| Expenses [Text Block] | |
| Expenses Paid, Amount | $ 40 |
| Expense Ratio, Percent | 0.78% |
| AssetsNet | $ 1,089,855,797 |
| Holdings Count | Holding | 56 |
| Advisory Fees Paid, Amount | $ 3,093,015 |
| InvestmentCompanyPortfolioTurnover | 28.00% |
| Additional Fund Statistics [Text Block] | |
| Holdings [Text Block] | |
| Largest Holdings [Text Block] | |
| Material Fund Change [Text Block] | |
| C000069913 | |
| Shareholder Report [Line Items] | |
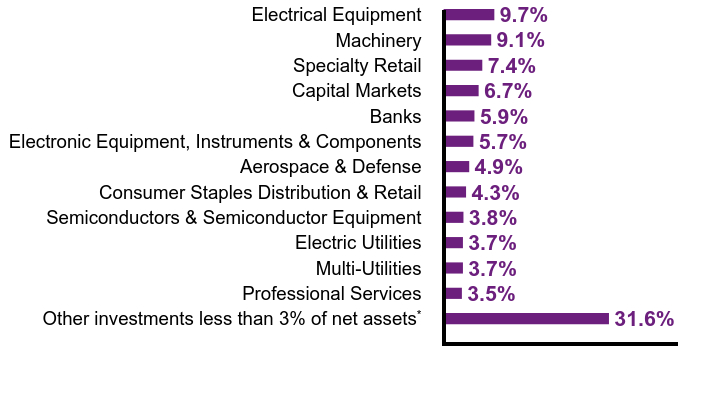
| Fund Name | Vaughan Nelson Mid Cap Fund |
| Class Name | Class A |
| Trading Symbol | VNVAX |
| Annual or Semi-Annual Statement [Text Block] | This semi-annual shareholder report contains important information about Vaughan Nelson Mid Cap Fund for the period of January 1, 2025 to June 30, 2025. |
| Shareholder Report Annual or Semi-Annual | Semi-annual Shareholder Report |
| Additional Information [Text Block] | You can find additional information (including tax information) about the Fund at im.natixis.com/funddocuments. You can also request the information by contacting us at (800) 225-5478 or by contacting your financial intermediary directly. |
| Additional Information Phone Number | (800) 225-5478 |
| Additional Information Website | <span style="box-sizing: border-box; color: rgb(0, 0, 0); display: inline; flex-wrap: nowrap; font-size: 12px; font-weight: 400; grid-area: auto; line-height: 18px; margin: 0px; overflow: visible; text-align: left; text-align-last: auto; white-space-collapse: preserve-breaks;">im.natixis.com/funddocuments</span> |
| Expenses [Text Block] | |
| Expenses Paid, Amount | $ 58 |
| Expense Ratio, Percent | 1.15% |
| AssetsNet | $ 214,172,659 |
| Holdings Count | Holding | 60 |
| Advisory Fees Paid, Amount | $ 721,743 |
| InvestmentCompanyPortfolioTurnover | 96.00% |
| Additional Fund Statistics [Text Block] | |
| Holdings [Text Block] | |
| Largest Holdings [Text Block] | |
| Material Fund Change [Text Block] | |
| C000069914 | |
| Shareholder Report [Line Items] | |
| Fund Name | Vaughan Nelson Mid Cap Fund |
| Class Name | Class C |
| Trading Symbol | VNVCX |
| Annual or Semi-Annual Statement [Text Block] | This semi-annual shareholder report contains important information about Vaughan Nelson Mid Cap Fund for the period of January 1, 2025 to June 30, 2025. |
| Shareholder Report Annual or Semi-Annual | Semi-annual Shareholder Report |
| Additional Information [Text Block] | You can find additional information (including tax information) about the Fund at im.natixis.com/funddocuments. You can also request the information by contacting us at (800) 225-5478 or by contacting your financial intermediary directly. |
| Additional Information Phone Number | (800) 225-5478 |
| Additional Information Website | <span style="box-sizing: border-box; color: rgb(0, 0, 0); display: inline; flex-wrap: nowrap; font-size: 12px; font-weight: 400; grid-area: auto; line-height: 18px; margin: 0px; overflow: visible; text-align: left; text-align-last: auto; white-space-collapse: preserve-breaks;">im.natixis.com/funddocuments</span> |
| Expenses [Text Block] | |
| Expenses Paid, Amount | $ 96 |
| Expense Ratio, Percent | 1.90% |
| AssetsNet | $ 214,172,659 |
| Holdings Count | Holding | 60 |
| Advisory Fees Paid, Amount | $ 721,743 |
| InvestmentCompanyPortfolioTurnover | 96.00% |
| Additional Fund Statistics [Text Block] | |
| Holdings [Text Block] | |
| Largest Holdings [Text Block] | |
| Material Fund Change [Text Block] | |
| C000128764 | |
| Shareholder Report [Line Items] | |
| Fund Name | Vaughan Nelson Mid Cap Fund |
| Class Name | Class N |
| Trading Symbol | VNVNX |
| Annual or Semi-Annual Statement [Text Block] | This semi-annual shareholder report contains important information about Vaughan Nelson Mid Cap Fund for the period of January 1, 2025 to June 30, 2025. |
| Shareholder Report Annual or Semi-Annual | Semi-annual Shareholder Report |
| Additional Information [Text Block] | You can find additional information (including tax information) about the Fund at im.natixis.com/funddocuments. You can also request the information by contacting us at (800) 225-5478 or by contacting your financial intermediary directly. |
| Additional Information Phone Number | (800) 225-5478 |
| Additional Information Website | <span style="box-sizing: border-box; color: rgb(0, 0, 0); display: inline; flex-wrap: nowrap; font-size: 12px; font-weight: 400; grid-area: auto; line-height: 18px; margin: 0px; overflow: visible; text-align: left; text-align-last: auto; white-space-collapse: preserve-breaks;">im.natixis.com/funddocuments</span> |
| Expenses [Text Block] | |
| Expenses Paid, Amount | $ 43 |
| Expense Ratio, Percent | 0.85% |
| AssetsNet | $ 214,172,659 |
| Holdings Count | Holding | 60 |
| Advisory Fees Paid, Amount | $ 721,743 |
| InvestmentCompanyPortfolioTurnover | 96.00% |
| Additional Fund Statistics [Text Block] | |
| Holdings [Text Block] | |
| Largest Holdings [Text Block] | |
| Material Fund Change [Text Block] | |
| C000069915 | |
| Shareholder Report [Line Items] | |
| Fund Name | Vaughan Nelson Mid Cap Fund |
| Class Name | Class Y |
| Trading Symbol | VNVYX |
| Annual or Semi-Annual Statement [Text Block] | This semi-annual shareholder report contains important information about Vaughan Nelson Mid Cap Fund for the period of January 1, 2025 to June 30, 2025. |
| Shareholder Report Annual or Semi-Annual | Semi-annual Shareholder Report |
| Additional Information [Text Block] | You can find additional information (including tax information) about the Fund at im.natixis.com/funddocuments. You can also request the information by contacting us at (800) 225-5478 or by contacting your financial intermediary directly. |
| Additional Information Phone Number | (800) 225-5478 |
| Additional Information Website | <span style="box-sizing: border-box; color: rgb(0, 0, 0); display: inline; flex-wrap: nowrap; font-size: 12px; font-weight: 400; grid-area: auto; line-height: 18px; margin: 0px; overflow: visible; text-align: left; text-align-last: auto; white-space-collapse: preserve-breaks;">im.natixis.com/funddocuments</span> |
| Expenses [Text Block] | |
| Expenses Paid, Amount | $ 45 |
| Expense Ratio, Percent | 0.90% |
| AssetsNet | $ 214,172,659 |
| Holdings Count | Holding | 60 |
| Advisory Fees Paid, Amount | $ 721,743 |
| InvestmentCompanyPortfolioTurnover | 96.00% |
| Additional Fund Statistics [Text Block] | |
| Holdings [Text Block] | |
| Largest Holdings [Text Block] | |
| Material Fund Change [Text Block] |