Shareholder Report
|
12 Months Ended |
|
Jun. 30, 2025
USD ($)
Holding
|
|---|
| Shareholder Report [Line Items] |
|
| Document Type |
N-CSR
|
| Amendment Flag |
false
|
| Registrant Name |
BLACKROCK MULTI STATE MUNICIPAL SERIES TRUST
|
| Entity Central Index Key |
0000774013
|
| Entity Investment Company Type |
N-1A
|
| Document Period End Date |
Jun. 30, 2025
|
| C000011316 [Member] |
|
| Shareholder Report [Line Items] |
|
| Fund Name |
BlackRock New York Municipal Opportunities Fund
|
| Class Name |
Institutional Shares
|
| Trading Symbol |
MANKX
|
| Annual or Semi-Annual Statement [Text Block] |
This annual shareholder report contains important information about BlackRock New York Municipal Opportunities Fund (the “Fund”) for the period of July 1, 2024 to June 30, 2025.
|
| Shareholder Report Annual or Semi-Annual |
annual shareholder report
|
| Additional Information [Text Block] |
You can find additional information about the Fund at blackrock.com/fundreports. You can also request this information by contacting us at (800) 441‑7762.
|
| Additional Information Phone Number |
(800) 441‑7762
|
| Additional Information Website |
blackrock.com/fundreports
|
| Expenses [Text Block] |
What were the Fund costs for the last year ? (based on a hypothetical $10,000 investment)
| Class name |
Costs of a $10,000
investment |
Costs paid as a percentage of a
$10,000 investment |
| Institutional Shares |
$69 |
0.69% |
|
| Expenses Paid, Amount |
$ 69
|
| Expense Ratio, Percent |
0.69%
|
| Factors Affecting Performance [Text Block] |
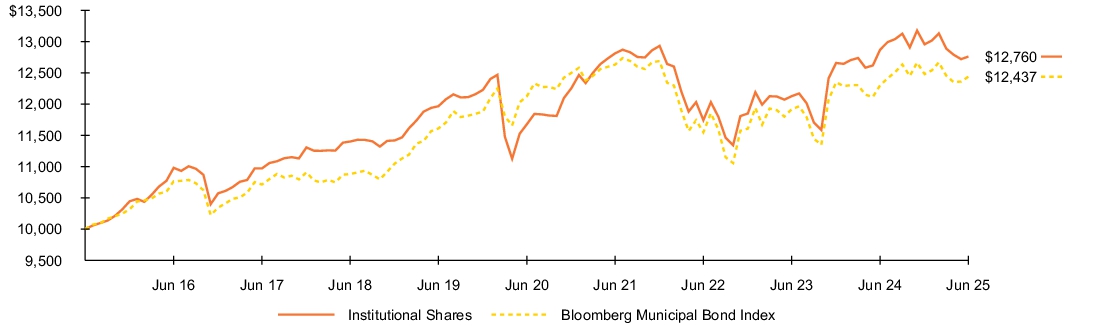
How did the Fund perform last year ? -
For the reporting period ended June 30, 2025, the Fund’s Institutional Shares returned (0.86)%. -
For the same period, the Fund’s benchmark, the Bloomberg Municipal Bond Index, returned 1.11% and the Customized Reference Benchmark, returned 0.87%. What contributed to performance? Holdings in bonds with maturities of 15 years and shorter contributed to absolute performance. Cash holdings also helped results, as did positions in the housing sector and certain high-yield bonds. Income further contributed, offsetting the effect of falling prices. What detracted from performance? Holdings in maturities of 18 years and longer detracted from performance. Specific high-yield positions and the Fund’s allocation to the tobacco sector detracted, as well. The views expressed reflect the opinions of BlackRock as of the date of this report and are subject to change based on changes in market, economic or other conditions. These views are not intended to be a forecast of future events and are no guarantee of future results.
|
| Performance Past Does Not Indicate Future [Text] |
Past performance is not an indication of future results.
|
| Line Graph [Table Text Block] |
Fund performance Cumulative performance: July 1, 2015 through June 30, 2025 Initial investment of $10,000 See “Average annual total returns” for additional information on fund performance.
|
| Average Annual Return [Table Text Block] |
| Average annual total returns |
|
|
|
|
|
|
|
1 Year |
|
5 Years |
|
10 Years |
|
| Institutional Shares |
(0.86 |
)% |
1.79 |
% |
2.47 |
% |
| Bloomberg Municipal Bond Index |
1.11 |
|
0.51 |
|
2.20 |
|
| Customized Reference Benchmark |
0.87 |
|
0.76 |
|
N/A |
|
|
| No Deduction of Taxes [Text Block] |
Performance results do not reflect the deduction of taxes that a shareholder would pay on fund distributions or on the redemption or sale of fund shares.
|
| Updated Performance Information Location [Text Block] |
Visit blackrock.com for more recent performance information.
|
| Net Assets |
$ 1,090,811,748
|
| Holdings Count | Holding |
324
|
| Advisory Fees Paid, Amount |
$ 4,780,714
|
| Investment Company Portfolio Turnover |
26.00%
|
| Additional Fund Statistics [Text Block] |
| Key Fund statistics |
|
| Net Assets |
$1,090,811,748 |
| Number of Portfolio Holdings |
324 |
| Net Investment Advisory Fees |
$4,780,714 |
| Portfolio Turnover Rate |
26% |
|
| Holdings [Text Block] |
What did the Fund invest in? (as of June 30, 2025)
| Sector allocation |
| Sector(a) |
Percent of Total
Investments(b) |
|
| Transportation |
28.9 |
% |
| County/City/Special District/School District |
17.9 |
% |
| Utilities |
16.6 |
% |
| State |
14.0 |
% |
| Education |
9.4 |
% |
| Housing |
5.3 |
% |
| Tobacco |
2.6 |
% |
| Corporate |
2.4 |
% |
| Health |
1.9 |
% |
| Commercial Services & Supplies |
1.0 |
% |
| Credit quality allocation |
| Credit Rating(c) |
Percent of Total
Investments(b) |
|
| AAA/Aaa |
11.8 |
% |
| AA/Aa |
58.0 |
% |
| A |
11.3 |
% |
| BBB/Baa |
6.1 |
% |
| BB/Ba |
0.6 |
% |
| B |
0.9 |
% |
| N/R |
11.3 |
% |
| (a) |
For purposes of this report, sector sub-classifications may differ from those utilized by the Fund for compliance purposes. |
| (b) |
Excludes short-term securities. |
| (c) |
For purposes of this report, credit quality ratings shown above reflect the highest rating assigned by either S&P Global Ratings or Moody’s Investors Service, Inc. if ratings differ. These rating agencies are independent, nationally recognized statistical rating organizations and are widely used. Investment grade ratings are credit ratings of BBB/Baa or higher. Below investment grade ratings are credit ratings of BB/Ba or lower. Investments designated N/R are not rated by either rating agency. Unrated investments do not necessarily indicate low credit quality. Credit quality ratings are subject to change. |
|
| Credit Quality Explanation [Text Block] |
For purposes of this report, credit quality ratings shown above reflect the highest rating assigned by either S&P Global Ratings or Moody’s Investors Service, Inc. if ratings differ. These rating agencies are independent, nationally recognized statistical rating organizations and are widely used. Investment grade ratings are credit ratings of BBB/Baa or higher. Below investment grade ratings are credit ratings of BB/Ba or lower. Investments designated N/R are not rated by either rating agency. Unrated investments do not necessarily indicate low credit quality. Credit quality ratings are subject to change.
|
| Credit Ratings Selection [Text Block] |
For purposes of this report, credit quality ratings shown above reflect the highest rating assigned by either S&P Global Ratings or Moody’s Investors Service, Inc.
|
| C000038358 [Member] |
|
| Shareholder Report [Line Items] |
|
| Fund Name |
BlackRock New York Municipal Opportunities Fund
|
| Class Name |
Investor A Shares
|
| Trading Symbol |
MENKX
|
| Annual or Semi-Annual Statement [Text Block] |
This annual shareholder report contains important information about BlackRock New York Municipal Opportunities Fund (the “Fund”) for the period of July 1, 2024 to June 30, 2025.
|
| Shareholder Report Annual or Semi-Annual |
annual shareholder report
|
| Additional Information [Text Block] |
You can find additional information about the Fund at blackrock.com/fundreports. You can also request this information by contacting us at (800) 441‑7762.
|
| Additional Information Phone Number |
(800) 441‑7762
|
| Additional Information Website |
blackrock.com/fundreports
|
| Expenses [Text Block] |
What were the Fund costs for the last year ? (based on a hypothetical $10,000 investment)
| Class name |
Costs of a $10,000
investment |
Costs paid as a percentage of a
$10,000 investment |
| Investor A Shares |
$93 |
0.94% |
|
| Expenses Paid, Amount |
$ 93
|
| Expense Ratio, Percent |
0.94%
|
| Factors Affecting Performance [Text Block] |
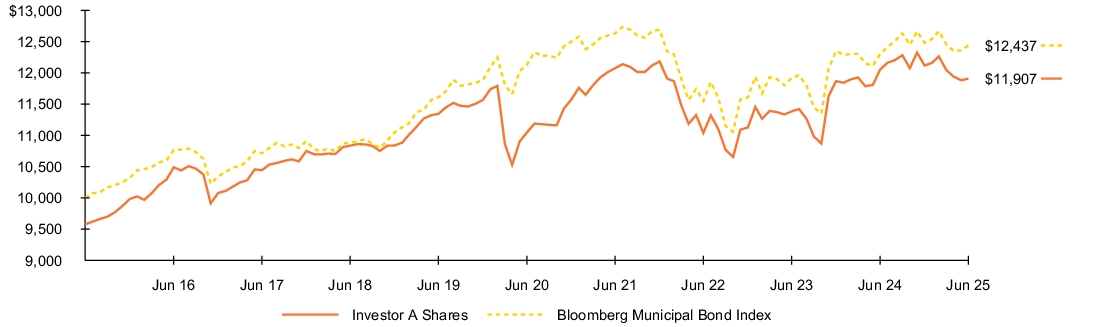
How did the Fund perform last year ? -
For the reporting period ended June 30, 2025, the Fund’s Investor A Shares returned (1.20)%. -
For the same period, the Fund’s benchmark, the Bloomberg Municipal Bond Index, returned 1.11% and the Customized Reference Benchmark, returned 0.87%. What contributed to performance? Holdings in bonds with maturities of 15 years and shorter contributed to absolute performance. Cash holdings also helped results, as did positions in the housing sector and certain high-yield bonds. Income further contributed, offsetting the effect of falling prices. What detracted from performance? Holdings in maturities of 18 years and longer detracted from performance. Specific high-yield positions and the Fund’s allocation to the tobacco sector detracted, as well. The views expressed reflect the opinions of BlackRock as of the date of this report and are subject to change based on changes in market, economic or other conditions. These views are not intended to be a forecast of future events and are no guarantee of future results.
|
| Performance Past Does Not Indicate Future [Text] |
Past performance is not an indication of future results.
|
| Line Graph [Table Text Block] |
Fund performance Cumulative performance: July 1, 2015 through June 30, 2025 Initial investment of $10,000 See “Average annual total returns” for additional information on fund performance.
|
| Average Annual Return [Table Text Block] |
| Average annual total returns |
|
|
|
|
|
|
|
1 Year |
|
5 Years |
|
10 Years |
|
| Investor A Shares |
(1.20 |
)% |
1.52 |
% |
2.20 |
% |
| Investor A Shares (with sales charge) |
(5.40 |
) |
0.64 |
|
1.76 |
|
| Bloomberg Municipal Bond Index |
1.11 |
|
0.51 |
|
2.20 |
|
| Customized Reference Benchmark |
0.87 |
|
0.76 |
|
N/A |
|
|
| No Deduction of Taxes [Text Block] |
Performance results do not reflect the deduction of taxes that a shareholder would pay on fund distributions or on the redemption or sale of fund shares.
|
| Updated Performance Information Location [Text Block] |
Visit blackrock.com for more recent performance information.
|
| Net Assets |
$ 1,090,811,748
|
| Holdings Count | Holding |
324
|
| Advisory Fees Paid, Amount |
$ 4,780,714
|
| Investment Company Portfolio Turnover |
26.00%
|
| Additional Fund Statistics [Text Block] |
| Key Fund statistics |
|
| Net Assets |
$1,090,811,748 |
| Number of Portfolio Holdings |
324 |
| Net Investment Advisory Fees |
$4,780,714 |
| Portfolio Turnover Rate |
26% |
|
| Holdings [Text Block] |
What did the Fund invest in? (as of June 30, 2025)
| Sector allocation |
| Sector(a) |
Percent of Total
Investments(b) |
|
| Transportation |
28.9 |
% |
| County/City/Special District/School District |
17.9 |
% |
| Utilities |
16.6 |
% |
| State |
14.0 |
% |
| Education |
9.4 |
% |
| Housing |
5.3 |
% |
| Tobacco |
2.6 |
% |
| Corporate |
2.4 |
% |
| Health |
1.9 |
% |
| Commercial Services & Supplies |
1.0 |
% |
| Credit quality allocation |
| Credit Rating(c) |
Percent of Total
Investments(b) |
|
| AAA/Aaa |
11.8 |
% |
| AA/Aa |
58.0 |
% |
| A |
11.3 |
% |
| BBB/Baa |
6.1 |
% |
| BB/Ba |
0.6 |
% |
| B |
0.9 |
% |
| N/R |
11.3 |
% |
| (a) |
For purposes of this report, sector sub-classifications may differ from those utilized by the Fund for compliance purposes. |
| (b) |
Excludes short-term securities. |
| (c) |
For purposes of this report, credit quality ratings shown above reflect the highest rating assigned by either S&P Global Ratings or Moody’s Investors Service, Inc. if ratings differ. These rating agencies are independent, nationally recognized statistical rating organizations and are widely used. Investment grade ratings are credit ratings of BBB/Baa or higher. Below investment grade ratings are credit ratings of BB/Ba or lower. Investments designated N/R are not rated by either rating agency. Unrated investments do not necessarily indicate low credit quality. Credit quality ratings are subject to change. |
|
| Credit Quality Explanation [Text Block] |
For purposes of this report, credit quality ratings shown above reflect the highest rating assigned by either S&P Global Ratings or Moody’s Investors Service, Inc. if ratings differ. These rating agencies are independent, nationally recognized statistical rating organizations and are widely used. Investment grade ratings are credit ratings of BBB/Baa or higher. Below investment grade ratings are credit ratings of BB/Ba or lower. Investments designated N/R are not rated by either rating agency. Unrated investments do not necessarily indicate low credit quality. Credit quality ratings are subject to change.
|
| Credit Ratings Selection [Text Block] |
For purposes of this report, credit quality ratings shown above reflect the highest rating assigned by either S&P Global Ratings or Moody’s Investors Service, Inc.
|
| C000011313 [Member] |
|
| Shareholder Report [Line Items] |
|
| Fund Name |
BlackRock New York Municipal Opportunities Fund
|
| Class Name |
Investor A1 Shares
|
| Trading Symbol |
MDNKX
|
| Annual or Semi-Annual Statement [Text Block] |
This annual shareholder report contains important information about BlackRock New York Municipal Opportunities Fund (the “Fund”) for the period of July 1, 2024 to June 30, 2025.
|
| Shareholder Report Annual or Semi-Annual |
annual shareholder report
|
| Additional Information [Text Block] |
You can find additional information about the Fund at blackrock.com/fundreports. You can also request this information by contacting us at (800) 441‑7762.
|
| Additional Information Phone Number |
(800) 441‑7762
|
| Additional Information Website |
blackrock.com/fundreports
|
| Expenses [Text Block] |
What were the Fund costs for the last year ? (based on a hypothetical $10,000 investment)
| Class name |
Costs of a $10,000
investment |
Costs paid as a percentage of a
$10,000 investment |
| Investor A1 Shares |
$79 |
0.79% |
|
| Expenses Paid, Amount |
$ 79
|
| Expense Ratio, Percent |
0.79%
|
| Factors Affecting Performance [Text Block] |
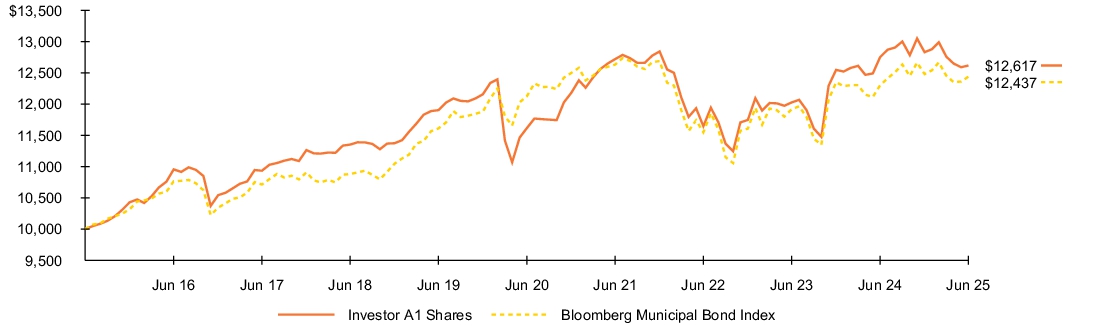
How did the Fund perform last year ? -
For the reporting period ended June 30, 2025, the Fund’s Investor A1 Shares returned (1.05)%. -
For the same period, the Fund’s benchmark, the Bloomberg Municipal Bond Index, returned 1.11% and the Customized Reference Benchmark, returned 0.87%. What contributed to performance? Holdings in bonds with maturities of 15 years and shorter contributed to absolute performance. Cash holdings also helped results, as did positions in the housing sector and certain high-yield bonds. Income further contributed, offsetting the effect of falling prices. What detracted from performance? Holdings in maturities of 18 years and longer detracted from performance. Specific high-yield positions and the Fund’s allocation to the tobacco sector detracted, as well. The views expressed reflect the opinions of BlackRock as of the date of this report and are subject to change based on changes in market, economic or other conditions. These views are not intended to be a forecast of future events and are no guarantee of future results.
|
| Performance Past Does Not Indicate Future [Text] |
Past performance is not an indication of future results.
|
| Line Graph [Table Text Block] |
Fund performance Cumulative performance: July 1, 2015 through June 30, 2025 Initial investment of $10,000 See “Average annual total returns” for additional information on fund performance.
|
| Average Annual Return [Table Text Block] |
| Average annual total returns |
|
|
|
|
|
|
|
1 Year |
|
5 Years |
|
10 Years |
|
| Investor A1 Shares |
(1.05 |
)% |
1.67 |
% |
2.35 |
% |
| Bloomberg Municipal Bond Index |
1.11 |
|
0.51 |
|
2.20 |
|
| Customized Reference Benchmark |
0.87 |
|
0.76 |
|
N/A |
|
|
| No Deduction of Taxes [Text Block] |
Performance results do not reflect the deduction of taxes that a shareholder would pay on fund distributions or on the redemption or sale of fund shares.
|
| Updated Performance Information Location [Text Block] |
Visit blackrock.com for more recent performance information.
|
| Net Assets |
$ 1,090,811,748
|
| Holdings Count | Holding |
324
|
| Advisory Fees Paid, Amount |
$ 4,780,714
|
| Investment Company Portfolio Turnover |
26.00%
|
| Additional Fund Statistics [Text Block] |
| Key Fund statistics |
|
| Net Assets |
$1,090,811,748 |
| Number of Portfolio Holdings |
324 |
| Net Investment Advisory Fees |
$4,780,714 |
| Portfolio Turnover Rate |
26% |
|
| Holdings [Text Block] |
What did the Fund invest in? (as of June 30, 2025)
| Sector allocation |
| Sector(a) |
Percent of Total
Investments(b) |
|
| Transportation |
28.9 |
% |
| County/City/Special District/School District |
17.9 |
% |
| Utilities |
16.6 |
% |
| State |
14.0 |
% |
| Education |
9.4 |
% |
| Housing |
5.3 |
% |
| Tobacco |
2.6 |
% |
| Corporate |
2.4 |
% |
| Health |
1.9 |
% |
| Commercial Services & Supplies |
1.0 |
% |
| Credit quality allocation |
| Credit Rating(c) |
Percent of Total
Investments(b) |
|
| AAA/Aaa |
11.8 |
% |
| AA/Aa |
58.0 |
% |
| A |
11.3 |
% |
| BBB/Baa |
6.1 |
% |
| BB/Ba |
0.6 |
% |
| B |
0.9 |
% |
| N/R |
11.3 |
% |
| (a) |
For purposes of this report, sector sub-classifications may differ from those utilized by the Fund for compliance purposes. |
| (b) |
Excludes short-term securities. |
| (c) |
For purposes of this report, credit quality ratings shown above reflect the highest rating assigned by either S&P Global Ratings or Moody’s Investors Service, Inc. if ratings differ. These rating agencies are independent, nationally recognized statistical rating organizations and are widely used. Investment grade ratings are credit ratings of BBB/Baa or higher. Below investment grade ratings are credit ratings of BB/Ba or lower. Investments designated N/R are not rated by either rating agency. Unrated investments do not necessarily indicate low credit quality. Credit quality ratings are subject to change. |
|
| Credit Quality Explanation [Text Block] |
For purposes of this report, credit quality ratings shown above reflect the highest rating assigned by either S&P Global Ratings or Moody’s Investors Service, Inc. if ratings differ. These rating agencies are independent, nationally recognized statistical rating organizations and are widely used. Investment grade ratings are credit ratings of BBB/Baa or higher. Below investment grade ratings are credit ratings of BB/Ba or lower. Investments designated N/R are not rated by either rating agency. Unrated investments do not necessarily indicate low credit quality. Credit quality ratings are subject to change.
|
| Credit Ratings Selection [Text Block] |
For purposes of this report, credit quality ratings shown above reflect the highest rating assigned by either S&P Global Ratings or Moody’s Investors Service, Inc.
|
| C000038359 [Member] |
|
| Shareholder Report [Line Items] |
|
| Fund Name |
BlackRock New York Municipal Opportunities Fund
|
| Class Name |
Investor C Shares
|
| Trading Symbol |
MFNKX
|
| Annual or Semi-Annual Statement [Text Block] |
This annual shareholder report contains important information about BlackRock New York Municipal Opportunities Fund (the “Fund”) for the period of July 1, 2024 to June 30, 2025.
|
| Shareholder Report Annual or Semi-Annual |
annual shareholder report
|
| Additional Information [Text Block] |
You can find additional information about the Fund at blackrock.com/fundreports. You can also request this information by contacting us at (800) 441‑7762.
|
| Additional Information Phone Number |
(800) 441‑7762
|
| Additional Information Website |
blackrock.com/fundreports
|
| Expenses [Text Block] |
What were the Fund costs for the last year ? (based on a hypothetical $10,000 investment)
| Class name |
Costs of a $10,000
investment |
Costs paid as a percentage of a
$10,000 investment |
| Investor C Shares |
$167 |
1.69% |
|
| Expenses Paid, Amount |
$ 167
|
| Expense Ratio, Percent |
1.69%
|
| Factors Affecting Performance [Text Block] |
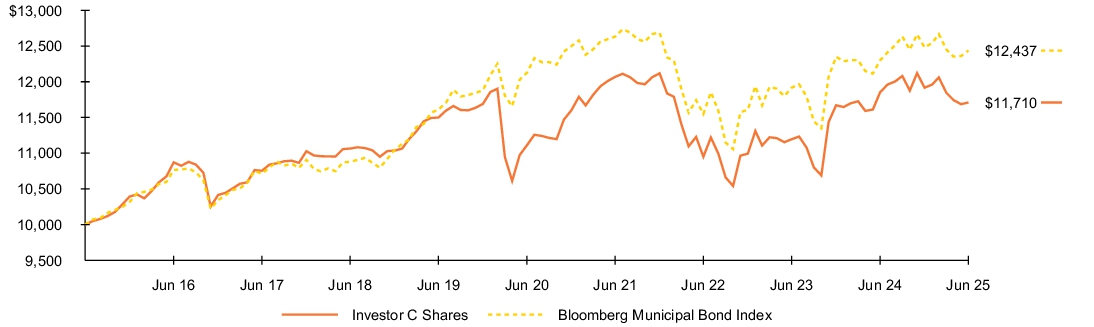
How did the Fund perform last year ? -
For the reporting period ended June 30, 2025, the Fund’s Investor C Shares returned (1.84)%. -
For the same period, the Fund’s benchmark, the Bloomberg Municipal Bond Index, returned 1.11% and the Customized Reference Benchmark, returned 0.87%. What contributed to performance? Holdings in bonds with maturities of 15 years and shorter contributed to absolute performance. Cash holdings also helped results, as did positions in the housing sector and certain high-yield bonds. Income further contributed, offsetting the effect of falling prices. What detracted from performance? Holdings in maturities of 18 years and longer detracted from performance. Specific high-yield positions and the Fund’s allocation to the tobacco sector detracted, as well. The views expressed reflect the opinions of BlackRock as of the date of this report and are subject to change based on changes in market, economic or other conditions. These views are not intended to be a forecast of future events and are no guarantee of future results.
|
| Performance Past Does Not Indicate Future [Text] |
Past performance is not an indication of future results.
|
| Line Graph [Table Text Block] |
Fund performance Cumulative performance: July 1, 2015 through June 30, 2025 Initial investment of $10,000 See “Average annual total returns” for additional information on fund performance.
|
| Average Annual Return [Table Text Block] |
| Average annual total returns |
|
|
|
|
|
|
|
1 Year |
|
5 Years |
|
10 Years |
|
| Investor C Shares |
(1.84 |
)% |
0.77 |
% |
1.59 |
% |
| Investor C Shares (with sales charge) |
(2.80 |
) |
0.77 |
|
1.59 |
|
| Bloomberg Municipal Bond Index |
1.11 |
|
0.51 |
|
2.20 |
|
| Customized Reference Benchmark |
0.87 |
|
0.76 |
|
N/A |
|
|
| No Deduction of Taxes [Text Block] |
Performance results do not reflect the deduction of taxes that a shareholder would pay on fund distributions or on the redemption or sale of fund shares.
|
| Updated Performance Information Location [Text Block] |
Visit blackrock.com for more recent performance information.
|
| Net Assets |
$ 1,090,811,748
|
| Holdings Count | Holding |
324
|
| Advisory Fees Paid, Amount |
$ 4,780,714
|
| Investment Company Portfolio Turnover |
26.00%
|
| Additional Fund Statistics [Text Block] |
| Key Fund statistics |
|
| Net Assets |
$1,090,811,748 |
| Number of Portfolio Holdings |
324 |
| Net Investment Advisory Fees |
$4,780,714 |
| Portfolio Turnover Rate |
26% |
|
| Holdings [Text Block] |
What did the Fund invest in? (as of June 30, 2025)
| Sector allocation |
| Sector(a) |
Percent of Total
Investments(b) |
|
| Transportation |
28.9 |
% |
| County/City/Special District/School District |
17.9 |
% |
| Utilities |
16.6 |
% |
| State |
14.0 |
% |
| Education |
9.4 |
% |
| Housing |
5.3 |
% |
| Tobacco |
2.6 |
% |
| Corporate |
2.4 |
% |
| Health |
1.9 |
% |
| Commercial Services & Supplies |
1.0 |
% |
| Credit quality allocation |
| Credit Rating(c) |
Percent of Total
Investments(b) |
|
| AAA/Aaa |
11.8 |
% |
| AA/Aa |
58.0 |
% |
| A |
11.3 |
% |
| BBB/Baa |
6.1 |
% |
| BB/Ba |
0.6 |
% |
| B |
0.9 |
% |
| N/R |
11.3 |
% |
| (a) |
For purposes of this report, sector sub-classifications may differ from those utilized by the Fund for compliance purposes. |
| (b) |
Excludes short-term securities. |
| (c) |
For purposes of this report, credit quality ratings shown above reflect the highest rating assigned by either S&P Global Ratings or Moody’s Investors Service, Inc. if ratings differ. These rating agencies are independent, nationally recognized statistical rating organizations and are widely used. Investment grade ratings are credit ratings of BBB/Baa or higher. Below investment grade ratings are credit ratings of BB/Ba or lower. Investments designated N/R are not rated by either rating agency. Unrated investments do not necessarily indicate low credit quality. Credit quality ratings are subject to change. |
|
| Credit Quality Explanation [Text Block] |
For purposes of this report, credit quality ratings shown above reflect the highest rating assigned by either S&P Global Ratings or Moody’s Investors Service, Inc. if ratings differ. These rating agencies are independent, nationally recognized statistical rating organizations and are widely used. Investment grade ratings are credit ratings of BBB/Baa or higher. Below investment grade ratings are credit ratings of BB/Ba or lower. Investments designated N/R are not rated by either rating agency. Unrated investments do not necessarily indicate low credit quality. Credit quality ratings are subject to change.
|
| Credit Ratings Selection [Text Block] |
For purposes of this report, credit quality ratings shown above reflect the highest rating assigned by either S&P Global Ratings or Moody’s Investors Service, Inc.
|
| C000199771 [Member] |
|
| Shareholder Report [Line Items] |
|
| Fund Name |
BlackRock New York Municipal Opportunities Fund
|
| Class Name |
Class K Shares
|
| Trading Symbol |
MKNKX
|
| Annual or Semi-Annual Statement [Text Block] |
This annual shareholder report contains important information about BlackRock New York Municipal Opportunities Fund (the “Fund”) for the period of July 1, 2024 to June 30, 2025.
|
| Shareholder Report Annual or Semi-Annual |
annual shareholder report
|
| Additional Information [Text Block] |
You can find additional information about the Fund at blackrock.com/fundreports. You can also request this information by contacting us at (800) 441‑7762.
|
| Additional Information Phone Number |
(800) 441‑7762
|
| Additional Information Website |
blackrock.com/fundreports
|
| Expenses [Text Block] |
What were the Fund costs for the last year ? (based on a hypothetical $10,000 investment)
| Class name |
Costs of a $10,000
investment |
Costs paid as a percentage of a
$10,000 investment |
| Class K Shares |
$64 |
0.64% |
|
| Expenses Paid, Amount |
$ 64
|
| Expense Ratio, Percent |
0.64%
|
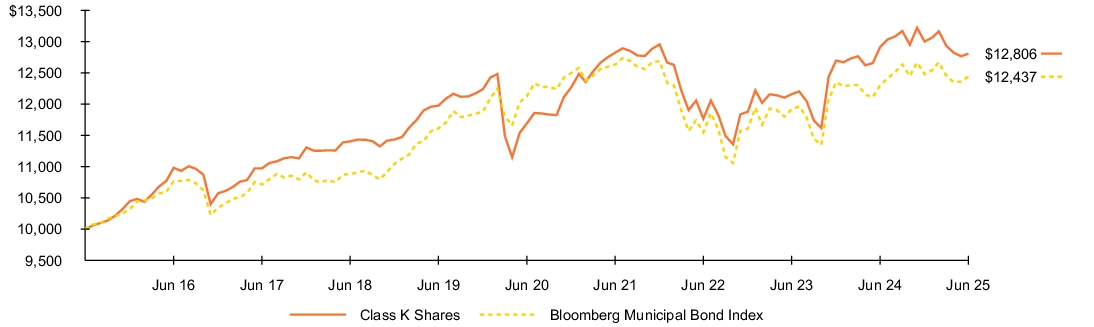
| Factors Affecting Performance [Text Block] |
How did the Fund perform last year ? -
For the reporting period ended June 30, 2025, the Fund’s Class K Shares returned (0.81)%. -
For the same period, the Fund’s benchmark, the Bloomberg Municipal Bond Index, returned 1.11% and the Customized Reference Benchmark, returned 0.87%. What contributed to performance? Holdings in bonds with maturities of 15 years and shorter contributed to absolute performance. Cash holdings also helped results, as did positions in the housing sector and certain high-yield bonds. Income further contributed, offsetting the effect of falling prices. What detracted from performance? Holdings in maturities of 18 years and longer detracted from performance. Specific high-yield positions and the Fund’s allocation to the tobacco sector detracted, as well. The views expressed reflect the opinions of BlackRock as of the date of this report and are subject to change based on changes in market, economic or other conditions. These views are not intended to be a forecast of future events and are no guarantee of future results.
|
| Performance Past Does Not Indicate Future [Text] |
Past performance is not an indication of future results.
|
| Line Graph [Table Text Block] |
Fund performance Cumulative performance: July 1, 2015 through June 30, 2025 Initial investment of $10,000 See “Average annual total returns” for additional information on fund performance.
|
| Average Annual Return [Table Text Block] |
| Average annual total returns |
|
|
|
|
|
|
|
1 Year |
|
5 Years |
|
10 Years |
|
| Class K Shares |
(0.81 |
)% |
1.84 |
% |
2.50 |
% |
| Bloomberg Municipal Bond Index |
1.11 |
|
0.51 |
|
2.20 |
|
| Customized Reference Benchmark |
0.87 |
|
0.76 |
|
N/A |
|
|
| Performance Inception Date |
Jan. 25, 2018
|
| No Deduction of Taxes [Text Block] |
Performance results do not reflect the deduction of taxes that a shareholder would pay on fund distributions or on the redemption or sale of fund shares.
|
| Updated Performance Information Location [Text Block] |
Visit blackrock.com for more recent performance information.
|
| Net Assets |
$ 1,090,811,748
|
| Holdings Count | Holding |
324
|
| Advisory Fees Paid, Amount |
$ 4,780,714
|
| Investment Company Portfolio Turnover |
26.00%
|
| Additional Fund Statistics [Text Block] |
| Key Fund statistics |
|
| Net Assets |
$1,090,811,748 |
| Number of Portfolio Holdings |
324 |
| Net Investment Advisory Fees |
$4,780,714 |
| Portfolio Turnover Rate |
26% |
|
| Holdings [Text Block] |
What did the Fund invest in? (as of June 30, 2025)
| Sector allocation |
| Sector(a) |
Percent of Total
Investments(b) |
|
| Transportation |
28.9 |
% |
| County/City/Special District/School District |
17.9 |
% |
| Utilities |
16.6 |
% |
| State |
14.0 |
% |
| Education |
9.4 |
% |
| Housing |
5.3 |
% |
| Tobacco |
2.6 |
% |
| Corporate |
2.4 |
% |
| Health |
1.9 |
% |
| Commercial Services & Supplies |
1.0 |
% |
| Credit quality allocation |
| Credit Rating(c) |
Percent of Total
Investments(b) |
|
| AAA/Aaa |
11.8 |
% |
| AA/Aa |
58.0 |
% |
| A |
11.3 |
% |
| BBB/Baa |
6.1 |
% |
| BB/Ba |
0.6 |
% |
| B |
0.9 |
% |
| N/R |
11.3 |
% |
| (a) |
For purposes of this report, sector sub-classifications may differ from those utilized by the Fund for compliance purposes. |
| (b) |
Excludes short-term securities. |
| (c) |
For purposes of this report, credit quality ratings shown above reflect the highest rating assigned by either S&P Global Ratings or Moody’s Investors Service, Inc. if ratings differ. These rating agencies are independent, nationally recognized statistical rating organizations and are widely used. Investment grade ratings are credit ratings of BBB/Baa or higher. Below investment grade ratings are credit ratings of BB/Ba or lower. Investments designated N/R are not rated by either rating agency. Unrated investments do not necessarily indicate low credit quality. Credit quality ratings are subject to change. |
|
| Credit Quality Explanation [Text Block] |
For purposes of this report, credit quality ratings shown above reflect the highest rating assigned by either S&P Global Ratings or Moody’s Investors Service, Inc. if ratings differ. These rating agencies are independent, nationally recognized statistical rating organizations and are widely used. Investment grade ratings are credit ratings of BBB/Baa or higher. Below investment grade ratings are credit ratings of BB/Ba or lower. Investments designated N/R are not rated by either rating agency. Unrated investments do not necessarily indicate low credit quality. Credit quality ratings are subject to change.
|
| Credit Ratings Selection [Text Block] |
For purposes of this report, credit quality ratings shown above reflect the highest rating assigned by either S&P Global Ratings or Moody’s Investors Service, Inc.
|