What were the Value Fund costs for the year? (based on a hypothetical $10,000 investment)
| Costs of a $10,000 investment | Costs paid as a percentage of a $10,000 investment | |
| Institutional Class shares | $190 | 1.80% |
How did the Value Fund perform last year?
The Value Fund returned 11.05% for the fiscal year ended June 30, 2025. The Value Fund’s benchmark, the S&P 500® Total Return Index (“S&P 500”), returned 15.16% during the same period. Despite substantial allocations to high-performing tech stocks, IMSCX underperformed the S&P 500 due to factors such as lower weighting in the very top index drivers (e.g., Facebook exposure is substantial but less than the combined concentration in the S&P 500’s largest weights) and broader diversification across financials and other sectors, which may have lagged. Additionally, the Fund’s overall portfolio—while growth-oriented—was less concentrated in just a handful of mega-cap winners compared to the S&P 500, and positions outside the technology sector (such as Wells Fargo, US Bancorp, and Dutch Bros) may not have matched the outsized gains of the index’s top performers, leading to relative underperformance.
What factors influenced performance during the past year?
| ● | The Fund benefitted from its technology exposure, with companies like NVIDIA, Microsoft, Apple, and Broadcom driving gains on accelerating demand for artificial intelligence and cloud computing. |
| ● | Additional strength came from Alphabet and Meta in communication services as well as Amazon and Costco. |
| ● | These winners were partly offset by weakness in financials, where banks and brokers faced pressure from narrowing margins, and by selective underperformance in consumer names such as Starbucks and Dutch Bros. |
| ● | Performance was shaped by a shifting macro backdrop. At the start of the year, expectations for Federal Reserve rate cuts supported higher valuations, while later in the year, the U.S. election and the introduction of new trade tariffs created volatility, particularly for multinational companies. The Treasury curve’s twist—with short rates declining and longer maturities rising—further challenged financials but reinforced investor appetite for large cap technology. More broadly, the year was defined by the continued build out of AI infrastructure, which provided strong tailwinds to our technology positions. |
How has the Value Fund performed during the past 10 years?
| Cumulative Performance of a Hypothetical $10,000 Investment as-of June 30, 2025 |
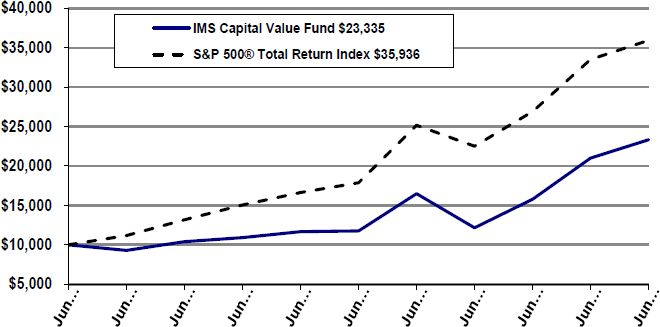
| Average Annual Total Returns | ||||
| 1 Year | 5 Years | 10 Years | ||
| Institutional Class shares | 11.05% | 14.69% | 8.84% | |
| S&P 500® Total Return Index | 15.16% | 16.63% | 13.63% | |
What are some Value Fund statistics?
| Fund Statistics | |||
| Total Net Assets | $51,858,181 | Investment Advisory Fees Paid | $615,702 |
| Number of Portfolio Holdings | 30 | Portfolio Turnover Rate | 70.05% |
What did the Value Fund invest in?
| Sector Allocation (as a % of Portfolio) | |||
| Information Technology | 30.60% | Health Care | 4.53% |
| Communication Services | 20.40% | Utilities |
3.60% |
| Consumer Discretionary | 16.50% | Energy | 1.75% |
| Financials | 16.27% | Consumer Staples | 1.34% |
| Industrials | 4.60% | Cash & Cash Equivalents | 0.41% |
| Top Ten Holdings (as a % of Net Assets) | |||
| Meta Platforms, Inc. – Class A | 11.67% | Alphabet, Inc. – Class C | 5.47% |
| Wells Fargo & Co. | 6.64% | Broadcom, Inc. | 5.42% |
| Amazon.com, Inc. | 6.16% | Dutch Bros., Inc. – Class A | 5.29% |
| NVIDIA Corp. | 6.09% | U.S. Bancorp | 5.05% |
| Microsoft Corp. | 6.04% | Apple, Inc.. | 3.96% |
How has the Value Fund changed?
The Fund did not have any material changes that occurred during the reporting period.
What were the Income Fund costs for the year? (based on a hypothetical $10,000 investment)
| Costs of a $10,000 investment | Costs paid as a percentage of a $10,000 investment | |
| Institutional Class shares | $208 | 2.02% |
How did the Income Fund perform last year?
For the fiscal year ended June 30, 2025, the Income Fund generated a total return of 6.06% with dividends reinvested. This compares with a 6.08% return for the Fund’s benchmark, the Bloomberg Barclay’s U.S. Aggregate Bond Index.
What factors influenced performance during the past year?
| ● | Long-maturity bonds underperformed expectations, as anticipated declines in long-term interest rates did not materialize. |
| ● | Shorter-maturity, credit-based bonds delivered mixed results. While several positions generated solid gains, others remained relatively unchanged, resulting in a neutral overall impact. |
| ● | Structured bonds linked to yield curve steepness resumed coupon payments after a prolonged period of suspension. This contributed positively to returns, with three of the five holdings producing significant gains, while the other two were more modest. |
How has the Income Fund performed during the past 10 years?
| Cumulative Performance of a Hypothetical $10,000 Investment as-of June 30, 2025 |
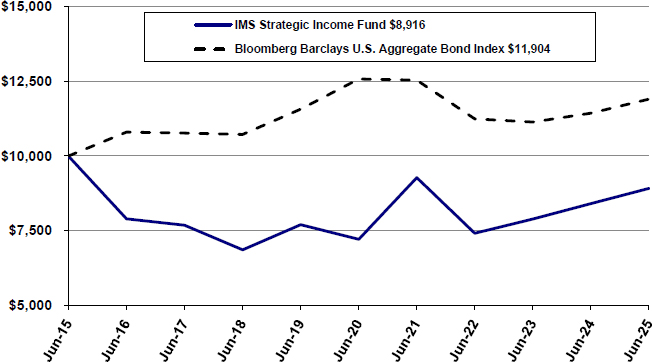
| Average Annual Total Returns | ||||
| 1 Year | 5 Years | 10 Years | ||
| Institutional Class shares | 6.06% | 4.32% | (1.14)% | |
| Bloomberg Barclays U.S. Aggregate Bond Index | 6.08% | (0.73)% | 1.76% | |
What are some Income Fund statistics?
| Fund Statistics | |||
| Total Net Assets | $11,987,612 | Investment Advisory Fees Paid | $31,738 |
| Number of Portfolio Holdings | 26 | Portfolio Turnover Rate | 266.79% |
What did the Income Fund invest in?
| Sector Allocation (as a % of Portfolio) | |||
| Corporate Bonds | 50.36% | Common Stock | 14.93% |
| Structured Notes | 18.82% | Cash & Cash Equivalents | 0.31% |
| Government Bonds | 15.58% | ||
| Top Ten Holdings (as a % of Net Assets) | |||
| U.S. Treasury Bond (Government Bond) | 15.34% | Bank of Montreal (Structured Note) | 4.82% |
| Royal Caribbean Cruises Ltd. (Corporate Bond) | 5.69% | Societe Generale SA (Structured Note) | 4.59% |
| Service Properties Trust (Corporate Bond) | 5.60% | Paramount Global (Corporate Bond) | 4.51% |
| Staples, Inc. (Corporate Bond) | 5.56% | Ford Motor Co. (Corporate Bond) | 4.49% |
| Navient Corp. (Corporate Bond) | 5.18% | Citigroup Global Markets Holdings, Inc. (Structured Note) |
|
How has the Income Fund changed?
The Fund did not have any material changes that occurred during the reporting period.