Shareholder Report
Jun. 30, 2025
USD ($)
Holding


Shareholder Report |
6 Months Ended |
|---|---|
|
Jun. 30, 2025
USD ($)
Holding
| |
| Shareholder Report [Line Items] | |
| Document Type | N-CSRS |
| Amendment Flag | false |
| Registrant Name | GAMCO GLOBAL SERIES FUNDS, INC |
| Entity Central Index Key | 0000909504 |
| Entity Investment Company Type | N-1A |
| Document Period End Date | Jun. 30, 2025 |
| C000002867 | |
| Shareholder Report [Line Items] | |
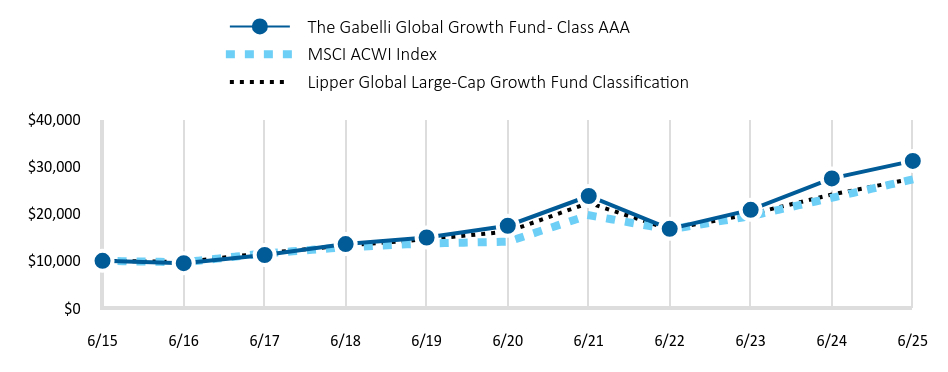
| Fund Name | The Gabelli Global Growth Fund |
| Class Name | Class AAA |
| Trading Symbol | GICPX |
| Annual or Semi-Annual Statement [Text Block] | This semi-annual shareholder report contains important information about The Gabelli Global Growth Fund (the Fund) for the period of January 1, 2025 to June 30, 2025. |
| Shareholder Report Annual or Semi-Annual | semi-annual shareholder report |
| Additional Information [Text Block] | You may find additional information about the Fund at www.gabelli.com/funds/open_ends. You may also request information by contacting us at 800-GABELLI (800-422-3554). |
| Additional Information Phone Number | 800-GABELLI (800-422-3554) |
| Additional Information Website | <span style="box-sizing: border-box; color: rgb(0, 0, 0); display: inline; flex-wrap: nowrap; font-size: 12px; font-weight: 400; grid-area: auto; line-height: 18px; margin: 0px; overflow: visible; text-align: justify; text-align-last: left; white-space-collapse: preserve-breaks;">www.gabelli.com/funds/open_ends</span> |
| Expenses [Text Block] | |
| Expenses Paid, Amount | $ 47 |
| Expense Ratio, Percent | 0.90% |
| Factors Affecting Performance [Text Block] | |
| Performance Past Does Not Indicate Future [Text] | Past performance does not guarantee future results. |
| Line Graph [Table Text Block] | |
| Average Annual Return [Table Text Block] | |
| No Deduction of Taxes [Text Block] | The table and graph presented above do not reflect the deduction of taxes a shareholder would pay on fund distributions or the redemption of fund shares. |
| AssetsNet | $ 198,019,997 |
| Holdings Count | Holding | 60 |
| Advisory Fees Paid, Amount | $ 485,570 |
| InvestmentCompanyPortfolioTurnover | 8.00% |
| Additional Fund Statistics [Text Block] | |
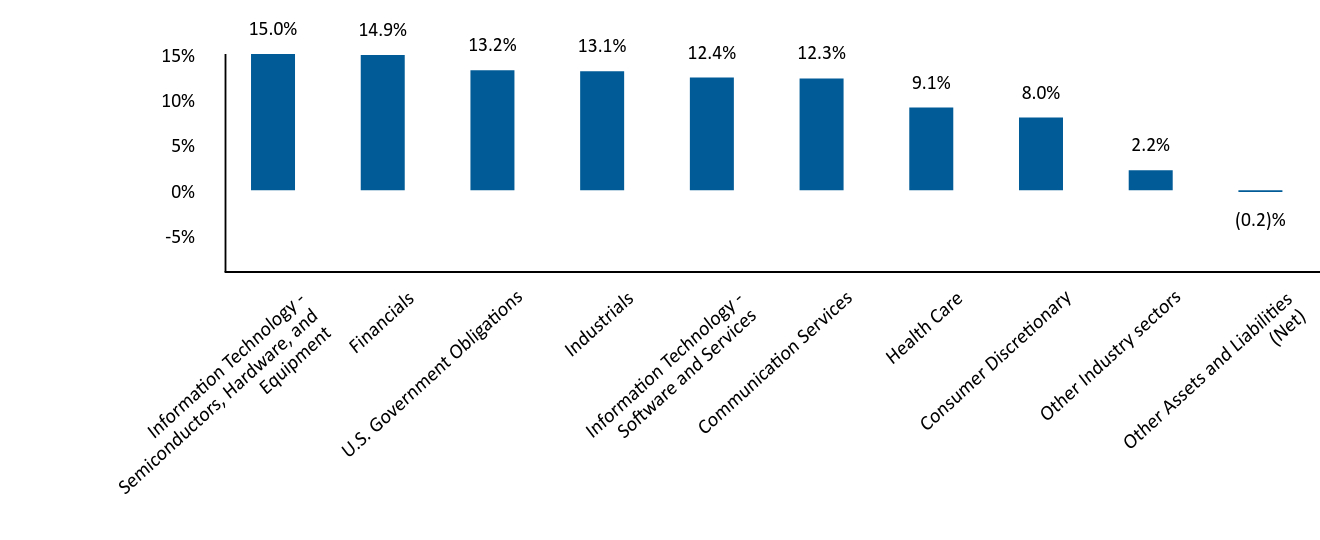
| Holdings [Text Block] | |
| Largest Holdings [Text Block] | |
| Material Fund Change [Text Block] | |
| Updated Prospectus Phone Number | 800-GABELLI (800-422-3554) |
| Updated Prospectus Email Address | <span style="box-sizing: border-box; color: rgb(0, 0, 0); display: inline; flex-wrap: nowrap; font-size: 12px; font-weight: 400; grid-area: auto; line-height: 18px; margin: 0px; overflow: visible; text-align: justify; text-align-last: left; white-space-collapse: preserve-breaks;">info@gabelli.com</span> |
| Updated Prospectus Web Address | <span style="box-sizing: border-box; color: rgb(0, 0, 0); display: inline; flex-wrap: nowrap; font-size: 12px; font-weight: 400; grid-area: auto; line-height: 18px; margin: 0px; overflow: visible; text-align: justify; text-align-last: left; white-space-collapse: preserve-breaks;">www.gabelli.com/funds/open_ends</span> |
| C000002869 | |
| Shareholder Report [Line Items] | |
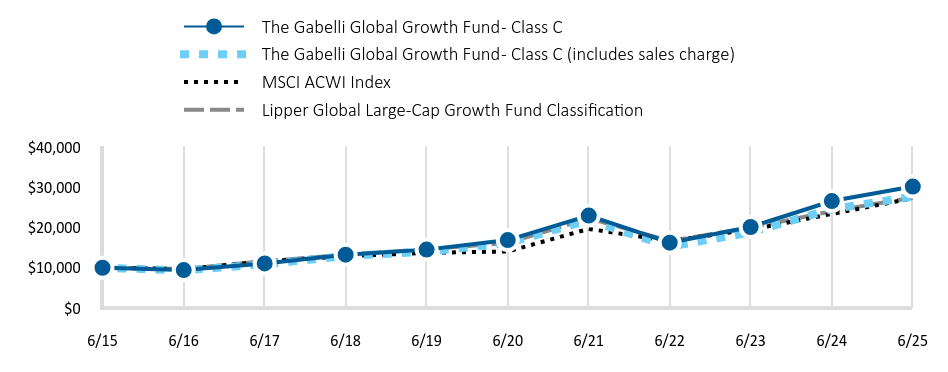
| Fund Name | The Gabelli Global Growth Fund |
| Class Name | Class C |
| Trading Symbol | GGGCX |
| Annual or Semi-Annual Statement [Text Block] | This semi-annual shareholder report contains important information about The Gabelli Global Growth Fund (the Fund) for the period of January 1, 2025 to June 30, 2025. |
| Shareholder Report Annual or Semi-Annual | semi-annual shareholder report |
| Additional Information [Text Block] | You may find additional information about the Fund at www.gabelli.com/funds/open_ends. You may also request information by contacting us at 800-GABELLI (800-422-3554). |
| Additional Information Phone Number | 800-GABELLI (800-422-3554) |
| Additional Information Website | <span style="box-sizing: border-box; color: rgb(0, 0, 0); display: inline; flex-wrap: nowrap; font-size: 12px; font-weight: 400; grid-area: auto; line-height: 18px; margin: 0px; overflow: visible; text-align: justify; text-align-last: left; white-space-collapse: preserve-breaks;">www.gabelli.com/funds/open_ends</span> |
| Expenses [Text Block] | |
| Expenses Paid, Amount | $ 47 |
| Expense Ratio, Percent | 0.90% |
| Factors Affecting Performance [Text Block] | |
| Performance Past Does Not Indicate Future [Text] | Past performance does not guarantee future results. |
| Line Graph [Table Text Block] | |
| Average Annual Return [Table Text Block] | |
| No Deduction of Taxes [Text Block] | The table and graph presented above do not reflect the deduction of taxes a shareholder would pay on fund distributions or the redemption of fund shares. |
| AssetsNet | $ 198,019,997 |
| Holdings Count | Holding | 60 |
| Advisory Fees Paid, Amount | $ 485,570 |
| InvestmentCompanyPortfolioTurnover | 8.00% |
| Additional Fund Statistics [Text Block] | |
| Holdings [Text Block] | |
| Largest Holdings [Text Block] | |
| Material Fund Change [Text Block] | |
| Updated Prospectus Phone Number | 800-GABELLI (800-422-3554) |
| Updated Prospectus Email Address | <span style="box-sizing: border-box; color: rgb(0, 0, 0); display: inline; flex-wrap: nowrap; font-size: 12px; font-weight: 400; grid-area: auto; line-height: 18px; margin: 0px; overflow: visible; text-align: justify; text-align-last: left; white-space-collapse: preserve-breaks;">info@gabelli.com</span> |
| Updated Prospectus Web Address | <span style="box-sizing: border-box; color: rgb(0, 0, 0); display: inline; flex-wrap: nowrap; font-size: 12px; font-weight: 400; grid-area: auto; line-height: 18px; margin: 0px; overflow: visible; text-align: justify; text-align-last: left; white-space-collapse: preserve-breaks;">www.gabelli.com/funds/open_ends</span> |
| C000034309 | |
| Shareholder Report [Line Items] | |
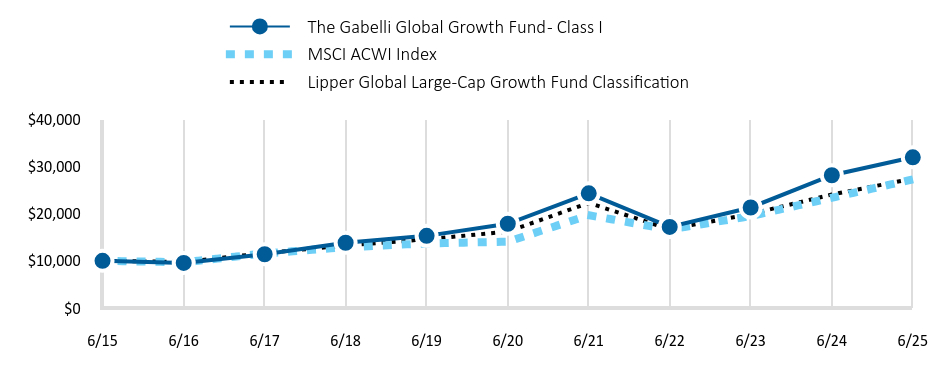
| Fund Name | The Gabelli Global Growth Fund |
| Class Name | Class I |
| Trading Symbol | GGGIX |
| Annual or Semi-Annual Statement [Text Block] | This semi-annual shareholder report contains important information about The Gabelli Global Growth Fund (the Fund) for the period of January 1, 2025 to June 30, 2025. |
| Shareholder Report Annual or Semi-Annual | semi-annual shareholder report |
| Additional Information [Text Block] | You may find additional information about the Fund at www.gabelli.com/funds/open_ends. You may also request information by contacting us at 800-GABELLI (800-422-3554). |
| Additional Information Phone Number | 800-GABELLI (800-422-3554) |
| Additional Information Website | <span style="box-sizing: border-box; color: rgb(0, 0, 0); display: inline; flex-wrap: nowrap; font-size: 12px; font-weight: 400; grid-area: auto; line-height: 18px; margin: 0px; overflow: visible; text-align: justify; text-align-last: left; white-space-collapse: preserve-breaks;">www.gabelli.com/funds/open_ends</span> |
| Expenses [Text Block] | |
| Expenses Paid, Amount | $ 47 |
| Expense Ratio, Percent | 0.90% |
| Factors Affecting Performance [Text Block] | |
| Performance Past Does Not Indicate Future [Text] | Past performance does not guarantee future results. |
| Line Graph [Table Text Block] | |
| Average Annual Return [Table Text Block] | |
| No Deduction of Taxes [Text Block] | The table and graph presented above do not reflect the deduction of taxes a shareholder would pay on fund distributions or the redemption of fund shares. |
| AssetsNet | $ 198,019,997 |
| Holdings Count | Holding | 60 |
| Advisory Fees Paid, Amount | $ 485,570 |
| InvestmentCompanyPortfolioTurnover | 8.00% |
| Additional Fund Statistics [Text Block] | |
| Holdings [Text Block] | |
| Largest Holdings [Text Block] | |
| Material Fund Change [Text Block] | |
| Updated Prospectus Phone Number | 800-GABELLI (800-422-3554) |
| Updated Prospectus Email Address | <span style="box-sizing: border-box; color: rgb(0, 0, 0); display: inline; flex-wrap: nowrap; font-size: 12px; font-weight: 400; grid-area: auto; line-height: 18px; margin: 0px; overflow: visible; text-align: justify; text-align-last: left; white-space-collapse: preserve-breaks;">info@gabelli.com</span> |
| Updated Prospectus Web Address | <span style="box-sizing: border-box; color: rgb(0, 0, 0); display: inline; flex-wrap: nowrap; font-size: 12px; font-weight: 400; grid-area: auto; line-height: 18px; margin: 0px; overflow: visible; text-align: justify; text-align-last: left; white-space-collapse: preserve-breaks;">www.gabelli.com/funds/open_ends</span> |
| C000002866 | |
| Shareholder Report [Line Items] | |
| Fund Name | The Gabelli Global Growth Fund |
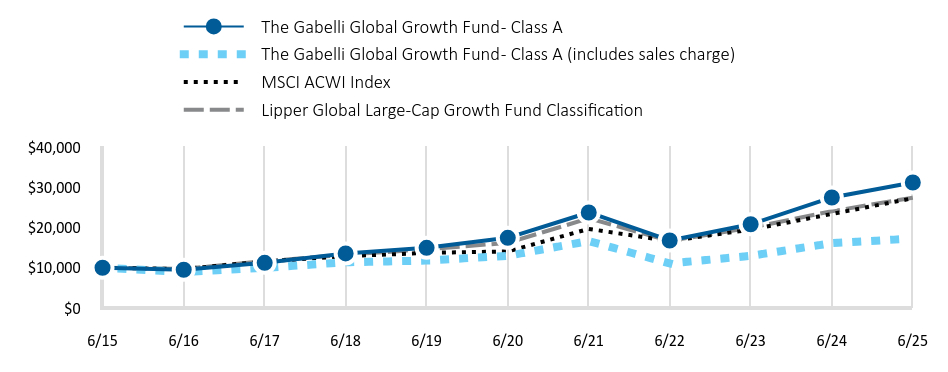
| Class Name | Class A |
| Trading Symbol | GGGAX |
| Annual or Semi-Annual Statement [Text Block] | This semi-annual shareholder report contains important information about The Gabelli Global Growth Fund (the Fund) for the period of January 1, 2025 to June 30, 2025. |
| Shareholder Report Annual or Semi-Annual | semi-annual shareholder report |
| Additional Information [Text Block] | You may find additional information about the Fund at www.gabelli.com/funds/open_ends. You may also request information by contacting us at 800-GABELLI (800-422-3554). |
| Additional Information Phone Number | 800-GABELLI (800-422-3554) |
| Additional Information Website | <span style="box-sizing: border-box; color: rgb(0, 0, 0); display: inline; flex-wrap: nowrap; font-size: 12px; font-weight: 400; grid-area: auto; line-height: 18px; margin: 0px; overflow: visible; text-align: justify; text-align-last: left; white-space-collapse: preserve-breaks;">www.gabelli.com/funds/open_ends</span> |
| Expenses [Text Block] | |
| Expenses Paid, Amount | $ 47 |
| Expense Ratio, Percent | 0.90% |
| Factors Affecting Performance [Text Block] | |
| Performance Past Does Not Indicate Future [Text] | Past performance does not guarantee future results. |
| Line Graph [Table Text Block] | |
| Average Annual Return [Table Text Block] | |
| No Deduction of Taxes [Text Block] | The table and graph presented above do not reflect the deduction of taxes a shareholder would pay on fund distributions or the redemption of fund shares. |
| AssetsNet | $ 198,019,997 |
| Holdings Count | Holding | 60 |
| Advisory Fees Paid, Amount | $ 485,570 |
| InvestmentCompanyPortfolioTurnover | 8.00% |
| Additional Fund Statistics [Text Block] | |
| Holdings [Text Block] | |
| Largest Holdings [Text Block] | |
| Material Fund Change [Text Block] | |
| Updated Prospectus Phone Number | 800-GABELLI (800-422-3554) |
| Updated Prospectus Email Address | <span style="box-sizing: border-box; color: rgb(0, 0, 0); display: inline; flex-wrap: nowrap; font-size: 12px; font-weight: 400; grid-area: auto; line-height: 18px; margin: 0px; overflow: visible; text-align: justify; text-align-last: left; white-space-collapse: preserve-breaks;">info@gabelli.com</span> |
| Updated Prospectus Web Address | <span style="box-sizing: border-box; color: rgb(0, 0, 0); display: inline; flex-wrap: nowrap; font-size: 12px; font-weight: 400; grid-area: auto; line-height: 18px; margin: 0px; overflow: visible; text-align: justify; text-align-last: left; white-space-collapse: preserve-breaks;">www.gabelli.com/funds/open_ends</span> |
| C000002875 | |
| Shareholder Report [Line Items] | |
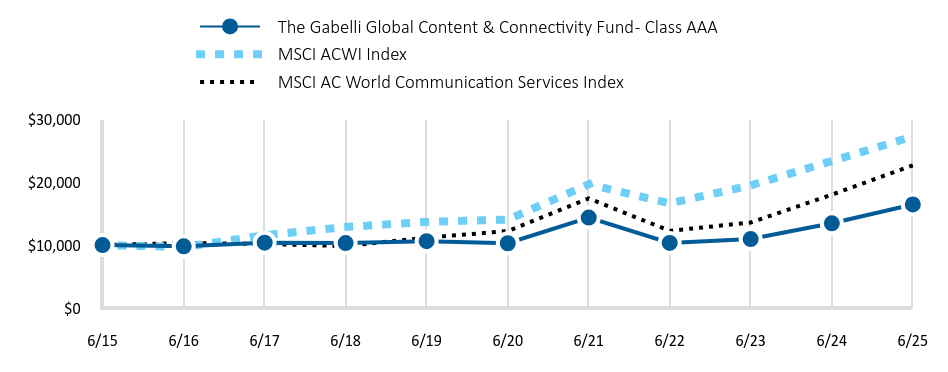
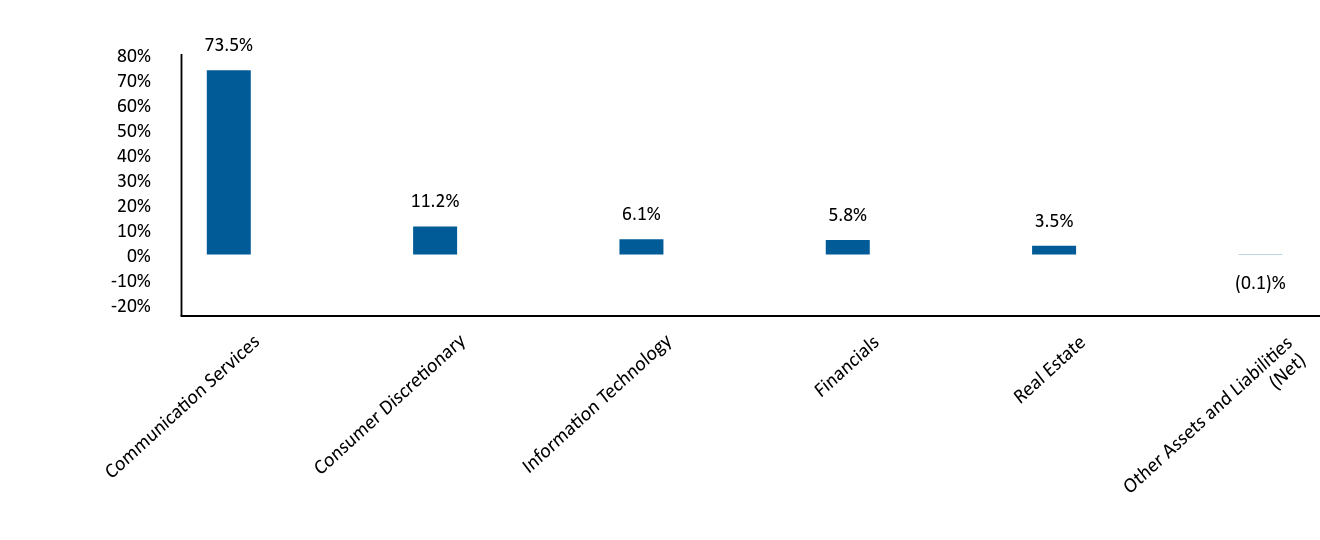
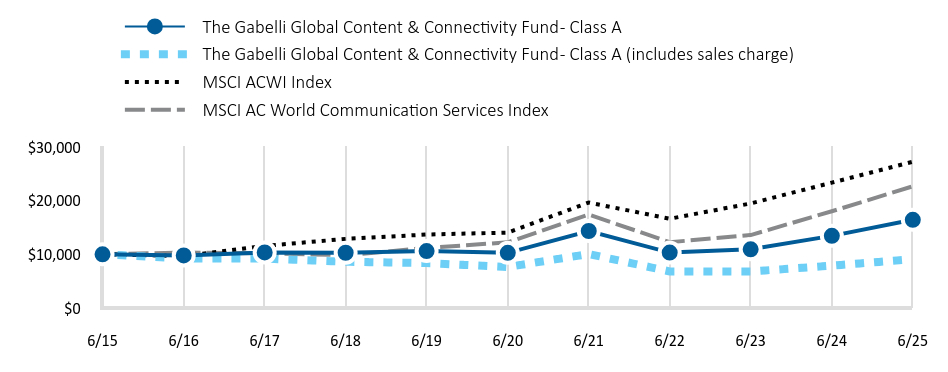
| Fund Name | The Gabelli Global Content & Connectivity Fund |
| Class Name | Class AAA |
| Trading Symbol | GABTX |
| Annual or Semi-Annual Statement [Text Block] | This semi-annual shareholder report contains important information about The Gabelli Global Content & Connectivity Fund (the Fund) for the period of January 1, 2025 to June 30, 2025. |
| Shareholder Report Annual or Semi-Annual | semi-annual shareholder report |
| Additional Information [Text Block] | You may find additional information about the Fund at www.gabelli.com/funds/open_ends. You may also request information by contacting us at 800-GABELLI (800-422-3554). |
| Additional Information Phone Number | 800-GABELLI (800-422-3554) |
| Additional Information Website | <span style="box-sizing: border-box; color: rgb(0, 0, 0); display: inline; flex-wrap: nowrap; font-size: 12px; font-weight: 400; grid-area: auto; line-height: 18px; margin: 0px; overflow: visible; text-align: justify; text-align-last: left; white-space-collapse: preserve-breaks;">www.gabelli.com/funds/open_ends</span> |
| Expenses [Text Block] | |
| Expenses Paid, Amount | $ 48 |
| Expense Ratio, Percent | 0.90% |
| Factors Affecting Performance [Text Block] | |
| Performance Past Does Not Indicate Future [Text] | Past performance does not guarantee future results. |
| Line Graph [Table Text Block] | |
| Average Annual Return [Table Text Block] | |
| No Deduction of Taxes [Text Block] | The table and graph presented above do not reflect the deduction of taxes a shareholder would pay on fund distributions or the redemption of fund shares. |
| AssetsNet | $ 71,194,066 |
| Holdings Count | Holding | 47 |
| Advisory Fees Paid, Amount | $ 77,956 |
| InvestmentCompanyPortfolioTurnover | 3.00% |
| Additional Fund Statistics [Text Block] | |
| Holdings [Text Block] | |
| Largest Holdings [Text Block] | |
| Material Fund Change [Text Block] | |
| Updated Prospectus Phone Number | 800-GABELLI (800-422-3554) |
| Updated Prospectus Email Address | <span style="box-sizing: border-box; color: rgb(0, 0, 0); display: inline; flex-wrap: nowrap; font-size: 12px; font-weight: 400; grid-area: auto; line-height: 18px; margin: 0px; overflow: visible; text-align: justify; text-align-last: left; white-space-collapse: preserve-breaks;">info@gabelli.com</span> |
| Updated Prospectus Web Address | <span style="box-sizing: border-box; color: rgb(0, 0, 0); display: inline; flex-wrap: nowrap; font-size: 12px; font-weight: 400; grid-area: auto; line-height: 18px; margin: 0px; overflow: visible; text-align: justify; text-align-last: left; white-space-collapse: preserve-breaks;">www.gabelli.com/funds/open_ends</span> |
| C000002877 | |
| Shareholder Report [Line Items] | |
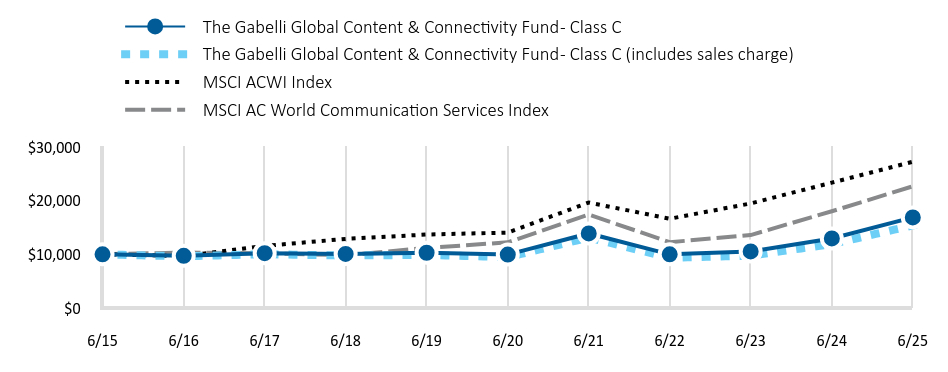
| Fund Name | The Gabelli Global Content & Connectivity Fund |
| Class Name | Class C |
| Trading Symbol | GTCCX |
| Annual or Semi-Annual Statement [Text Block] | This semi-annual shareholder report contains important information about The Gabelli Global Content & Connectivity Fund (the Fund) for the period of January 1, 2025 to June 30, 2025. |
| Shareholder Report Annual or Semi-Annual | semi-annual shareholder report |
| Additional Information [Text Block] | You may find additional information about the Fund at www.gabelli.com/funds/open_ends. You may also request information by contacting us at 800-GABELLI (800-422-3554). |
| Additional Information Phone Number | 800-GABELLI (800-422-3554) |
| Additional Information Website | <span style="box-sizing: border-box; color: rgb(0, 0, 0); display: inline; flex-wrap: nowrap; font-size: 12px; font-weight: 400; grid-area: auto; line-height: 18px; margin: 0px; overflow: visible; text-align: justify; text-align-last: left; white-space-collapse: preserve-breaks;">www.gabelli.com/funds/open_ends</span> |
| Expenses [Text Block] | |
| Expenses Paid, Amount | $ 49 |
| Expense Ratio, Percent | 0.90% |
| Factors Affecting Performance [Text Block] | |
| Performance Past Does Not Indicate Future [Text] | Past performance does not guarantee future results. |
| Line Graph [Table Text Block] | |
| Average Annual Return [Table Text Block] | |
| No Deduction of Taxes [Text Block] | The table and graph presented above do not reflect the deduction of taxes a shareholder would pay on fund distributions or the redemption of fund shares. |
| AssetsNet | $ 71,194,066 |
| Holdings Count | Holding | 47 |
| Advisory Fees Paid, Amount | $ 77,956 |
| InvestmentCompanyPortfolioTurnover | 3.00% |
| Additional Fund Statistics [Text Block] | |
| Holdings [Text Block] | |
| Largest Holdings [Text Block] | |
| Material Fund Change [Text Block] | |
| Updated Prospectus Phone Number | 800-GABELLI (800-422-3554) |
| Updated Prospectus Email Address | <span style="box-sizing: border-box; color: rgb(0, 0, 0); display: inline; flex-wrap: nowrap; font-size: 12px; font-weight: 400; grid-area: auto; line-height: 18px; margin: 0px; overflow: visible; text-align: justify; text-align-last: left; white-space-collapse: preserve-breaks;">info@gabelli.com</span> |
| Updated Prospectus Web Address | <span style="box-sizing: border-box; color: rgb(0, 0, 0); display: inline; flex-wrap: nowrap; font-size: 12px; font-weight: 400; grid-area: auto; line-height: 18px; margin: 0px; overflow: visible; text-align: justify; text-align-last: left; white-space-collapse: preserve-breaks;">www.gabelli.com/funds/open_ends</span> |
| C000034311 | |
| Shareholder Report [Line Items] | |
| Fund Name | The Gabelli Global Content & Connectivity Fund |
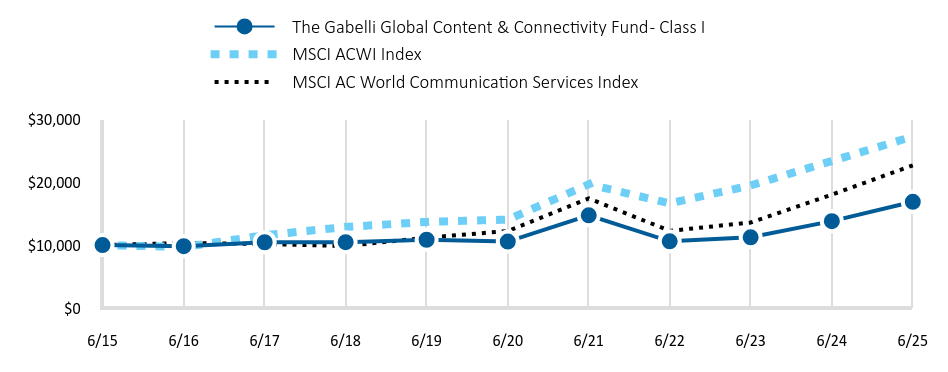
| Class Name | Class I |
| Trading Symbol | GTTIX |
| Annual or Semi-Annual Statement [Text Block] | This semi-annual shareholder report contains important information about The Gabelli Global Content & Connectivity Fund (the Fund) for the period of January 1, 2025 to June 30, 2025. |
| Shareholder Report Annual or Semi-Annual | semi-annual shareholder report |
| Additional Information [Text Block] | You may find additional information about the Fund at www.gabelli.com/funds/open_ends. You may also request information by contacting us at 800-GABELLI (800-422-3554). |
| Additional Information Phone Number | 800-GABELLI (800-422-3554) |
| Additional Information Website | <span style="box-sizing: border-box; color: rgb(0, 0, 0); display: inline; flex-wrap: nowrap; font-size: 12px; font-weight: 400; grid-area: auto; line-height: 18px; margin: 0px; overflow: visible; text-align: justify; text-align-last: left; white-space-collapse: preserve-breaks;">www.gabelli.com/funds/open_ends</span> |
| Expenses [Text Block] | |
| Expenses Paid, Amount | $ 48 |
| Expense Ratio, Percent | 0.90% |
| Factors Affecting Performance [Text Block] | |
| Performance Past Does Not Indicate Future [Text] | Past performance does not guarantee future results. |
| Line Graph [Table Text Block] | |
| Average Annual Return [Table Text Block] | |
| No Deduction of Taxes [Text Block] | The table and graph presented above do not reflect the deduction of taxes a shareholder would pay on fund distributions or the redemption of fund shares. |
| AssetsNet | $ 71,194,066 |
| Holdings Count | Holding | 47 |
| Advisory Fees Paid, Amount | $ 77,956 |
| InvestmentCompanyPortfolioTurnover | 3.00% |
| Additional Fund Statistics [Text Block] | |
| Holdings [Text Block] | |
| Largest Holdings [Text Block] | |
| Material Fund Change [Text Block] | |
| Updated Prospectus Phone Number | 800-GABELLI (800-422-3554) |
| Updated Prospectus Email Address | <span style="box-sizing: border-box; color: rgb(0, 0, 0); display: inline; flex-wrap: nowrap; font-size: 12px; font-weight: 400; grid-area: auto; line-height: 18px; margin: 0px; overflow: visible; text-align: justify; text-align-last: left; white-space-collapse: preserve-breaks;">info@gabelli.com</span> |
| Updated Prospectus Web Address | <span style="box-sizing: border-box; color: rgb(0, 0, 0); display: inline; flex-wrap: nowrap; font-size: 12px; font-weight: 400; grid-area: auto; line-height: 18px; margin: 0px; overflow: visible; text-align: justify; text-align-last: left; white-space-collapse: preserve-breaks;">www.gabelli.com/funds/open_ends</span> |
| C000002874 | |
| Shareholder Report [Line Items] | |
| Fund Name | The Gabelli Global Content & Connectivity Fund |
| Class Name | Class A |
| Trading Symbol | GTCAX |
| Annual or Semi-Annual Statement [Text Block] | This semi-annual shareholder report contains important information about The Gabelli Global Content & Connectivity Fund (the Fund) for the period of January 1, 2025 to June 30, 2025. |
| Shareholder Report Annual or Semi-Annual | semi-annual shareholder report |
| Additional Information [Text Block] | You may find additional information about the Fund at www.gabelli.com/funds/open_ends. You may also request information by contacting us at 800-GABELLI (800-422-3554). |
| Additional Information Phone Number | 800-GABELLI (800-422-3554) |
| Additional Information Website | <span style="box-sizing: border-box; color: rgb(0, 0, 0); display: inline; flex-wrap: nowrap; font-size: 12px; font-weight: 400; grid-area: auto; line-height: 18px; margin: 0px; overflow: visible; text-align: justify; text-align-last: left; white-space-collapse: preserve-breaks;">www.gabelli.com/funds/open_ends</span> |
| Expenses [Text Block] | |
| Expenses Paid, Amount | $ 48 |
| Expense Ratio, Percent | 0.90% |
| Factors Affecting Performance [Text Block] | |
| Performance Past Does Not Indicate Future [Text] | Past performance does not guarantee future results. |
| Line Graph [Table Text Block] | |
| Average Annual Return [Table Text Block] | |
| No Deduction of Taxes [Text Block] | The table and graph presented above do not reflect the deduction of taxes a shareholder would pay on fund distributions or the redemption of fund shares. |
| AssetsNet | $ 71,194,066 |
| Holdings Count | Holding | 47 |
| Advisory Fees Paid, Amount | $ 77,956 |
| InvestmentCompanyPortfolioTurnover | 3.00% |
| Additional Fund Statistics [Text Block] | |
| Holdings [Text Block] | |
| Largest Holdings [Text Block] | |
| Material Fund Change [Text Block] | |
| Updated Prospectus Phone Number | 800-GABELLI (800-422-3554) |
| Updated Prospectus Email Address | <span style="box-sizing: border-box; color: rgb(0, 0, 0); display: inline; flex-wrap: nowrap; font-size: 12px; font-weight: 400; grid-area: auto; line-height: 18px; margin: 0px; overflow: visible; text-align: justify; text-align-last: left; white-space-collapse: preserve-breaks;">info@gabelli.com</span> |
| Updated Prospectus Web Address | <span style="box-sizing: border-box; color: rgb(0, 0, 0); display: inline; flex-wrap: nowrap; font-size: 12px; font-weight: 400; grid-area: auto; line-height: 18px; margin: 0px; overflow: visible; text-align: justify; text-align-last: left; white-space-collapse: preserve-breaks;">www.gabelli.com/funds/open_ends</span> |
| C000204772 | |
| Shareholder Report [Line Items] | |
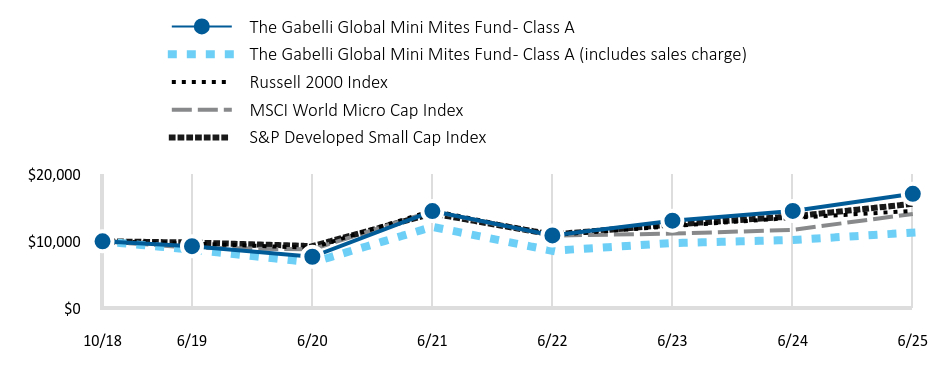
| Fund Name | The Gabelli Global Mini Mites Fund |
| Class Name | Class A |
| Trading Symbol | GMNAX |
| Annual or Semi-Annual Statement [Text Block] | This semi-annual shareholder report contains important information about The Gabelli Global Mini Mites Fund (the Fund) for the period of January 1, 2025 to June 30, 2025. |
| Shareholder Report Annual or Semi-Annual | semi-annual shareholder report |
| Additional Information [Text Block] | You may find additional information about the Fund at www.gabelli.com/funds/open_ends. You may also request information by contacting us at 800-GABELLI (800-422-3554). |
| Additional Information Phone Number | 800-GABELLI (800-422-3554) |
| Additional Information Website | <span style="box-sizing: border-box; color: rgb(0, 0, 0); display: inline; flex-wrap: nowrap; font-size: 12px; font-weight: 400; grid-area: auto; line-height: 18px; margin: 0px; overflow: visible; text-align: justify; text-align-last: left; white-space-collapse: preserve-breaks;">www.gabelli.com/funds/open_ends</span> |
| Expenses [Text Block] | |
| Expenses Paid, Amount | $ 45 |
| Expense Ratio, Percent | 0.90% |
| Factors Affecting Performance [Text Block] | |
| Performance Past Does Not Indicate Future [Text] | Past performance does not guarantee future results. |
| Line Graph [Table Text Block] | |
| Average Annual Return [Table Text Block] | |
| No Deduction of Taxes [Text Block] | The table and graph presented above do not reflect the deduction of taxes a shareholder would pay on fund distributions or the redemption of fund shares. |
| AssetsNet | $ 15,479,390 |
| Holdings Count | Holding | 154 |
| Advisory Fees Paid, Amount | $ (18,279) |
| InvestmentCompanyPortfolioTurnover | 13.00% |
| Additional Fund Statistics [Text Block] | |
| Holdings [Text Block] | |
| Largest Holdings [Text Block] | |
| Material Fund Change [Text Block] | |
| Updated Prospectus Phone Number | 800-GABELLI (800-422-3554) |
| Updated Prospectus Email Address | <span style="box-sizing: border-box; color: rgb(0, 0, 0); display: inline; flex-wrap: nowrap; font-size: 12px; font-weight: 400; grid-area: auto; line-height: 18px; margin: 0px; overflow: visible; text-align: justify; text-align-last: left; white-space-collapse: preserve-breaks;">info@gabelli.com</span> |
| Updated Prospectus Web Address | <span style="box-sizing: border-box; color: rgb(0, 0, 0); display: inline; flex-wrap: nowrap; font-size: 12px; font-weight: 400; grid-area: auto; line-height: 18px; margin: 0px; overflow: visible; text-align: justify; text-align-last: left; white-space-collapse: preserve-breaks;">www.gabelli.com/funds/open_ends</span> |
| C000204774 | |
| Shareholder Report [Line Items] | |
| Fund Name | The Gabelli Global Mini Mites Fund |
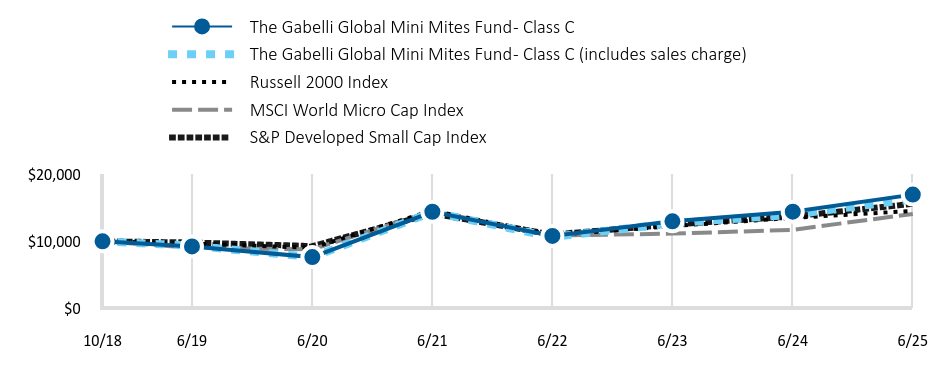
| Class Name | Class C |
| Trading Symbol | GMNCX |
| Annual or Semi-Annual Statement [Text Block] | This semi-annual shareholder report contains important information about The Gabelli Global Mini Mites Fund (the Fund) for the period of January 1, 2025 to June 30, 2025. |
| Shareholder Report Annual or Semi-Annual | semi-annual shareholder report |
| Additional Information [Text Block] | You may find additional information about the Fund at www.gabelli.com/funds/open_ends. You may also request information by contacting us at 800-GABELLI (800-422-3554). |
| Additional Information Phone Number | 800-GABELLI (800-422-3554) |
| Additional Information Website | <span style="box-sizing: border-box; color: rgb(0, 0, 0); display: inline; flex-wrap: nowrap; font-size: 12px; font-weight: 400; grid-area: auto; line-height: 18px; margin: 0px; overflow: visible; text-align: justify; text-align-last: left; white-space-collapse: preserve-breaks;">www.gabelli.com/funds/open_ends</span> |
| Expenses [Text Block] | |
| Expenses Paid, Amount | $ 45 |
| Expense Ratio, Percent | 0.90% |
| Factors Affecting Performance [Text Block] | |
| Performance Past Does Not Indicate Future [Text] | Past performance does not guarantee future results. |
| Line Graph [Table Text Block] | |
| Average Annual Return [Table Text Block] | |
| No Deduction of Taxes [Text Block] | The table and graph presented above do not reflect the deduction of taxes a shareholder would pay on fund distributions or the redemption of fund shares. |
| AssetsNet | $ 15,479,390 |
| Holdings Count | Holding | 154 |
| Advisory Fees Paid, Amount | $ (18,279) |
| InvestmentCompanyPortfolioTurnover | 13.00% |
| Additional Fund Statistics [Text Block] | |
| Holdings [Text Block] | |
| Largest Holdings [Text Block] | |
| Material Fund Change [Text Block] | |
| Updated Prospectus Phone Number | 800-GABELLI (800-422-3554) |
| Updated Prospectus Email Address | <span style="box-sizing: border-box; color: rgb(0, 0, 0); display: inline; flex-wrap: nowrap; font-size: 12px; font-weight: 400; grid-area: auto; line-height: 18px; margin: 0px; overflow: visible; text-align: justify; text-align-last: left; white-space-collapse: preserve-breaks;">info@gabelli.com</span> |
| Updated Prospectus Web Address | <span style="box-sizing: border-box; color: rgb(0, 0, 0); display: inline; flex-wrap: nowrap; font-size: 12px; font-weight: 400; grid-area: auto; line-height: 18px; margin: 0px; overflow: visible; text-align: justify; text-align-last: left; white-space-collapse: preserve-breaks;">www.gabelli.com/funds/open_ends</span> |
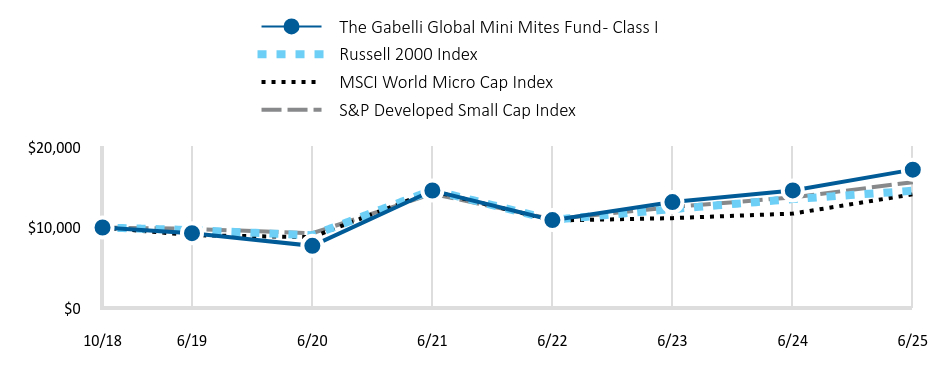
| C000204771 | |
| Shareholder Report [Line Items] | |
| Fund Name | The Gabelli Global Mini Mites Fund |
| Class Name | Class I |
| Trading Symbol | GGMMX |
| Annual or Semi-Annual Statement [Text Block] | This semi-annual shareholder report contains important information about The Gabelli Global Mini Mites Fund (the Fund) for the period of January 1, 2025 to June 30, 2025. |
| Shareholder Report Annual or Semi-Annual | semi-annual shareholder report |
| Additional Information [Text Block] | You may find additional information about the Fund at www.gabelli.com/funds/open_ends. You may also request information by contacting us at 800-GABELLI (800-422-3554). |
| Additional Information Phone Number | 800-GABELLI (800-422-3554) |
| Additional Information Website | <span style="box-sizing: border-box; color: rgb(0, 0, 0); display: inline; flex-wrap: nowrap; font-size: 12px; font-weight: 400; grid-area: auto; line-height: 18px; margin: 0px; overflow: visible; text-align: justify; text-align-last: left; white-space-collapse: preserve-breaks;">www.gabelli.com/funds/open_ends</span> |
| Expenses [Text Block] | |
| Expenses Paid, Amount | $ 45 |
| Expense Ratio, Percent | 0.90% |
| Factors Affecting Performance [Text Block] | |
| Performance Past Does Not Indicate Future [Text] | Past performance does not guarantee future results. |
| Line Graph [Table Text Block] | |
| Average Annual Return [Table Text Block] | |
| No Deduction of Taxes [Text Block] | The table and graph presented above do not reflect the deduction of taxes a shareholder would pay on fund distributions or the redemption of fund shares. |
| AssetsNet | $ 15,479,390 |
| Holdings Count | Holding | 154 |
| Advisory Fees Paid, Amount | $ (18,279) |
| InvestmentCompanyPortfolioTurnover | 13.00% |
| Additional Fund Statistics [Text Block] | |
| Holdings [Text Block] | |
| Largest Holdings [Text Block] | |
| Material Fund Change [Text Block] | |
| Updated Prospectus Phone Number | 800-GABELLI (800-422-3554) |
| Updated Prospectus Email Address | <span style="box-sizing: border-box; color: rgb(0, 0, 0); display: inline; flex-wrap: nowrap; font-size: 12px; font-weight: 400; grid-area: auto; line-height: 18px; margin: 0px; overflow: visible; text-align: justify; text-align-last: left; white-space-collapse: preserve-breaks;">info@gabelli.com</span> |
| Updated Prospectus Web Address | <span style="box-sizing: border-box; color: rgb(0, 0, 0); display: inline; flex-wrap: nowrap; font-size: 12px; font-weight: 400; grid-area: auto; line-height: 18px; margin: 0px; overflow: visible; text-align: justify; text-align-last: left; white-space-collapse: preserve-breaks;">www.gabelli.com/funds/open_ends</span> |
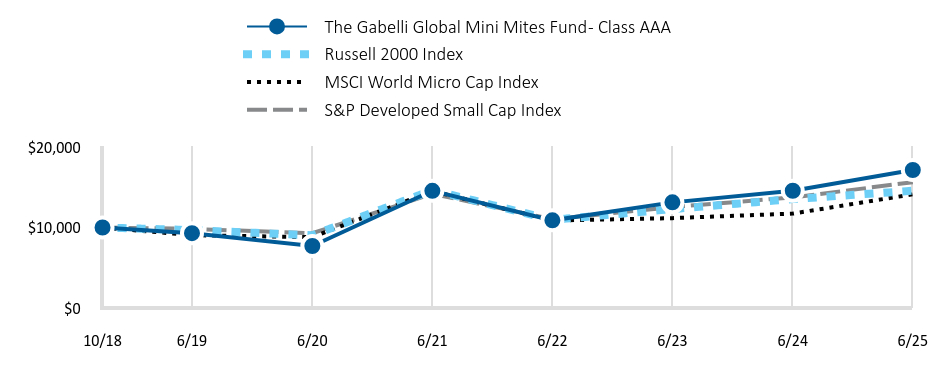
| C000204773 | |
| Shareholder Report [Line Items] | |
| Fund Name | The Gabelli Global Mini Mites Fund |
| Class Name | Class AAA |
| Trading Symbol | GAMNX |
| Annual or Semi-Annual Statement [Text Block] | This semi-annual shareholder report contains important information about The Gabelli Global Mini Mites Fund (the Fund) for the period of January 1, 2025 to June 30, 2025. |
| Shareholder Report Annual or Semi-Annual | semi-annual shareholder report |
| Additional Information [Text Block] | You may find additional information about the Fund at www.gabelli.com/funds/open_ends. You may also request information by contacting us at 800-GABELLI (800-422-3554). |
| Additional Information Phone Number | 800-GABELLI (800-422-3554) |
| Additional Information Website | <span style="box-sizing: border-box; color: rgb(0, 0, 0); display: inline; flex-wrap: nowrap; font-size: 12px; font-weight: 400; grid-area: auto; line-height: 18px; margin: 0px; overflow: visible; text-align: justify; text-align-last: left; white-space-collapse: preserve-breaks;">www.gabelli.com/funds/open_ends</span> |
| Expenses [Text Block] | |
| Expenses Paid, Amount | $ 45 |
| Expense Ratio, Percent | 0.90% |
| Factors Affecting Performance [Text Block] | |
| Performance Past Does Not Indicate Future [Text] | Past performance does not guarantee future results. |
| Line Graph [Table Text Block] | |
| Average Annual Return [Table Text Block] | |
| No Deduction of Taxes [Text Block] | The table and graph presented above do not reflect the deduction of taxes a shareholder would pay on fund distributions or the redemption of fund shares. |
| AssetsNet | $ 15,479,390 |
| Holdings Count | Holding | 154 |
| Advisory Fees Paid, Amount | $ (18,279) |
| InvestmentCompanyPortfolioTurnover | 13.00% |
| Additional Fund Statistics [Text Block] | |
| Holdings [Text Block] | |
| Largest Holdings [Text Block] | |
| Material Fund Change [Text Block] | |
| Updated Prospectus Phone Number | 800-GABELLI (800-422-3554) |
| Updated Prospectus Email Address | <span style="box-sizing: border-box; color: rgb(0, 0, 0); display: inline; flex-wrap: nowrap; font-size: 12px; font-weight: 400; grid-area: auto; line-height: 18px; margin: 0px; overflow: visible; text-align: justify; text-align-last: left; white-space-collapse: preserve-breaks;">info@gabelli.com</span> |
| Updated Prospectus Web Address | <span style="box-sizing: border-box; color: rgb(0, 0, 0); display: inline; flex-wrap: nowrap; font-size: 12px; font-weight: 400; grid-area: auto; line-height: 18px; margin: 0px; overflow: visible; text-align: justify; text-align-last: left; white-space-collapse: preserve-breaks;">www.gabelli.com/funds/open_ends</span> |
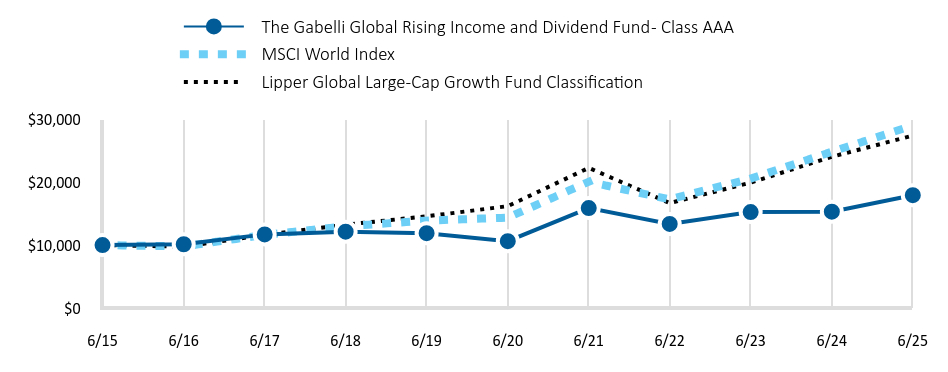
| C000002865 | |
| Shareholder Report [Line Items] | |
| Fund Name | The Gabelli Global Rising Income and Dividend Fund |
| Class Name | Class AAA |
| Trading Symbol | GAGCX |
| Annual or Semi-Annual Statement [Text Block] | This semi-annual shareholder report contains important information about The Gabelli Global Rising Income and Dividend Fund (the Fund) for the period of January 1, 2025 to June 30, 2025. |
| Shareholder Report Annual or Semi-Annual | semi-annual shareholder report |
| Additional Information [Text Block] | You may find additional information about the Fund at www.gabelli.com/funds/open_ends. You may also request information by contacting us at 800-GABELLI (800-422-3554). |
| Additional Information Phone Number | 800-GABELLI (800-422-3554) |
| Additional Information Website | <span style="box-sizing: border-box; color: rgb(0, 0, 0); display: inline; flex-wrap: nowrap; font-size: 12px; font-weight: 400; grid-area: auto; line-height: 18px; margin: 0px; overflow: visible; text-align: justify; text-align-last: left; white-space-collapse: preserve-breaks;">www.gabelli.com/funds/open_ends</span> |
| Expenses [Text Block] | |
| Expenses Paid, Amount | $ 48 |
| Expense Ratio, Percent | 0.90% |
| Factors Affecting Performance [Text Block] | |
| Performance Past Does Not Indicate Future [Text] | Past performance does not guarantee future results. |
| Line Graph [Table Text Block] | |
| Average Annual Return [Table Text Block] | |
| No Deduction of Taxes [Text Block] | The table and graph presented above do not reflect the deduction of taxes a shareholder would pay on fund distributions or the redemption of fund shares. |
| AssetsNet | $ 64,385,465 |
| Holdings Count | Holding | 177 |
| Advisory Fees Paid, Amount | $ 144,088 |
| InvestmentCompanyPortfolioTurnover | 1.00% |
| Additional Fund Statistics [Text Block] | |
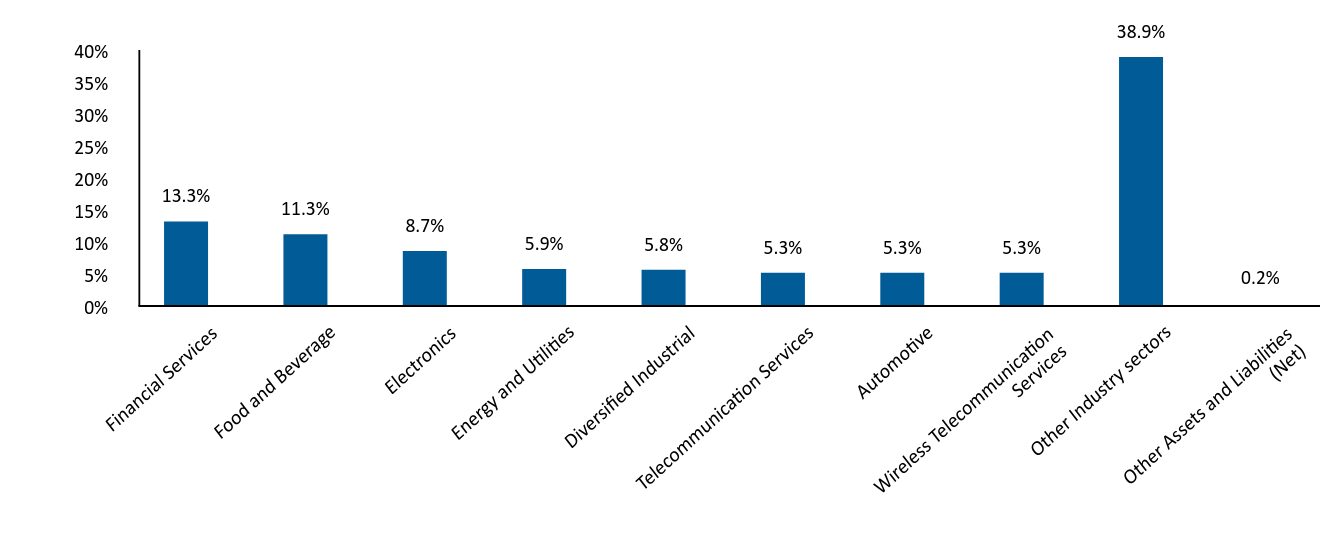
| Holdings [Text Block] | |
| Largest Holdings [Text Block] | |
| Material Fund Change [Text Block] | |
| Updated Prospectus Phone Number | 800-GABELLI (800-422-3554) |
| Updated Prospectus Email Address | <span style="box-sizing: border-box; color: rgb(0, 0, 0); display: inline; flex-wrap: nowrap; font-size: 12px; font-weight: 400; grid-area: auto; line-height: 18px; margin: 0px; overflow: visible; text-align: justify; text-align-last: left; white-space-collapse: preserve-breaks;">info@gabelli.com</span> |
| Updated Prospectus Web Address | <span style="box-sizing: border-box; color: rgb(0, 0, 0); display: inline; flex-wrap: nowrap; font-size: 12px; font-weight: 400; grid-area: auto; line-height: 18px; margin: 0px; overflow: visible; text-align: justify; text-align-last: left; white-space-collapse: preserve-breaks;">www.gabelli.com/funds/open_ends</span> |
| C000002864 | |
| Shareholder Report [Line Items] | |
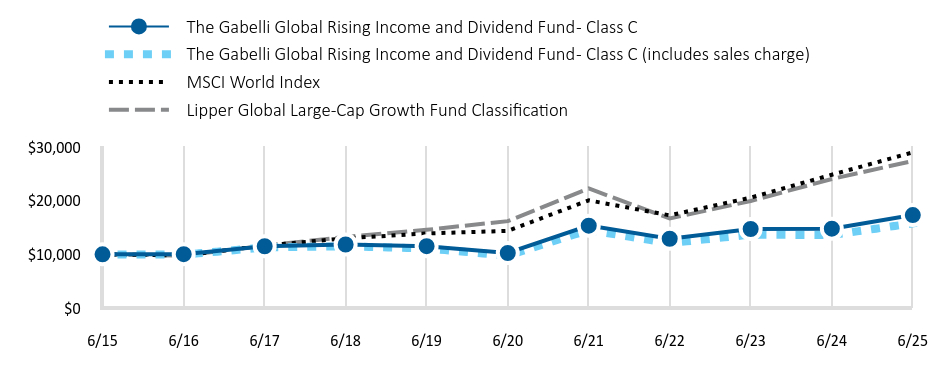
| Fund Name | The Gabelli Global Rising Income and Dividend Fund |
| Class Name | Class C |
| Trading Symbol | GACCX |
| Annual or Semi-Annual Statement [Text Block] | This semi-annual shareholder report contains important information about The Gabelli Global Rising Income and Dividend Fund (the Fund) for the period of January 1, 2025 to June 30, 2025. |
| Shareholder Report Annual or Semi-Annual | semi-annual shareholder report |
| Additional Information [Text Block] | You may find additional information about the Fund at www.gabelli.com/funds/open_ends. You may also request information by contacting us at 800-GABELLI (800-422-3554). |
| Additional Information Phone Number | 800-GABELLI (800-422-3554) |
| Additional Information Website | <span style="box-sizing: border-box; color: rgb(0, 0, 0); display: inline; flex-wrap: nowrap; font-size: 12px; font-weight: 400; grid-area: auto; line-height: 18px; margin: 0px; overflow: visible; text-align: justify; text-align-last: left; white-space-collapse: preserve-breaks;">www.gabelli.com/funds/open_ends</span> |
| Expenses [Text Block] | |
| Expenses Paid, Amount | $ 48 |
| Expense Ratio, Percent | 0.90% |
| Factors Affecting Performance [Text Block] | |
| Performance Past Does Not Indicate Future [Text] | Past performance does not guarantee future results. |
| Line Graph [Table Text Block] | |
| Average Annual Return [Table Text Block] | |
| No Deduction of Taxes [Text Block] | The table and graph presented above do not reflect the deduction of taxes a shareholder would pay on fund distributions or the redemption of fund shares. |
| AssetsNet | $ 64,385,465 |
| Holdings Count | Holding | 177 |
| Advisory Fees Paid, Amount | $ 144,088 |
| InvestmentCompanyPortfolioTurnover | 1.00% |
| Additional Fund Statistics [Text Block] | |
| Holdings [Text Block] | |
| Largest Holdings [Text Block] | |
| Material Fund Change [Text Block] | |
| Updated Prospectus Phone Number | 800-GABELLI (800-422-3554) |
| Updated Prospectus Email Address | <span style="box-sizing: border-box; color: rgb(0, 0, 0); display: inline; flex-wrap: nowrap; font-size: 12px; font-weight: 400; grid-area: auto; line-height: 18px; margin: 0px; overflow: visible; text-align: justify; text-align-last: left; white-space-collapse: preserve-breaks;">info@gabelli.com</span> |
| Updated Prospectus Web Address | <span style="box-sizing: border-box; color: rgb(0, 0, 0); display: inline; flex-wrap: nowrap; font-size: 12px; font-weight: 400; grid-area: auto; line-height: 18px; margin: 0px; overflow: visible; text-align: justify; text-align-last: left; white-space-collapse: preserve-breaks;">www.gabelli.com/funds/open_ends</span> |
| C000034308 | |
| Shareholder Report [Line Items] | |
| Fund Name | The Gabelli Global Rising Income and Dividend Fund |
| Class Name | Class I |
| Trading Symbol | GAGIX |
| Annual or Semi-Annual Statement [Text Block] | This semi-annual shareholder report contains important information about The Gabelli Global Rising Income and Dividend Fund (the Fund) for the period of January 1, 2025 to June 30, 2025. |
| Shareholder Report Annual or Semi-Annual | semi-annual shareholder report |
| Additional Information [Text Block] | You may find additional information about the Fund at www.gabelli.com/funds/open_ends. You may also request information by contacting us at 800-GABELLI (800-422-3554). |
| Additional Information Phone Number | 800-GABELLI (800-422-3554) |
| Additional Information Website | <span style="box-sizing: border-box; color: rgb(0, 0, 0); display: inline; flex-wrap: nowrap; font-size: 12px; font-weight: 400; grid-area: auto; line-height: 18px; margin: 0px; overflow: visible; text-align: justify; text-align-last: left; white-space-collapse: preserve-breaks;">www.gabelli.com/funds/open_ends</span> |
| Expenses [Text Block] | |
| Expenses Paid, Amount | $ 48 |
| Expense Ratio, Percent | 0.90% |
| Factors Affecting Performance [Text Block] | |
| Performance Past Does Not Indicate Future [Text] | Past performance does not guarantee future results. |
| Line Graph [Table Text Block] | |
| Average Annual Return [Table Text Block] | |
| No Deduction of Taxes [Text Block] | The table and graph presented above do not reflect the deduction of taxes a shareholder would pay on fund distributions or the redemption of fund shares. |
| AssetsNet | $ 64,385,465 |
| Holdings Count | Holding | 177 |
| Advisory Fees Paid, Amount | $ 144,088 |
| InvestmentCompanyPortfolioTurnover | 1.00% |
| Additional Fund Statistics [Text Block] | |
| Holdings [Text Block] | |
| Largest Holdings [Text Block] | |
| Material Fund Change [Text Block] | |
| Updated Prospectus Phone Number | 800-GABELLI (800-422-3554) |
| Updated Prospectus Email Address | <span style="box-sizing: border-box; color: rgb(0, 0, 0); display: inline; flex-wrap: nowrap; font-size: 12px; font-weight: 400; grid-area: auto; line-height: 18px; margin: 0px; overflow: visible; text-align: justify; text-align-last: left; white-space-collapse: preserve-breaks;">info@gabelli.com</span> |
| Updated Prospectus Web Address | <span style="box-sizing: border-box; color: rgb(0, 0, 0); display: inline; flex-wrap: nowrap; font-size: 12px; font-weight: 400; grid-area: auto; line-height: 18px; margin: 0px; overflow: visible; text-align: justify; text-align-last: left; white-space-collapse: preserve-breaks;">www.gabelli.com/funds/open_ends</span> |
| C000002862 | |
| Shareholder Report [Line Items] | |
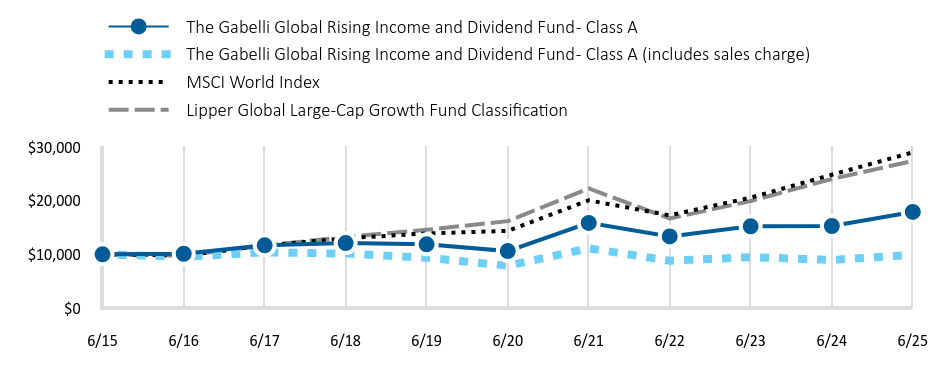
| Fund Name | The Gabelli Global Rising Income and Dividend Fund |
| Class Name | Class A |
| Trading Symbol | GAGAX |
| Annual or Semi-Annual Statement [Text Block] | This semi-annual shareholder report contains important information about The Gabelli Global Rising Income and Dividend Fund (the Fund) for the period of January 1, 2025 to June 30, 2025. |
| Shareholder Report Annual or Semi-Annual | semi-annual shareholder report |
| Additional Information [Text Block] | You may find additional information about the Fund at www.gabelli.com/funds/open_ends. You may also request information by contacting us at 800-GABELLI (800-422-3554). |
| Additional Information Phone Number | 800-GABELLI (800-422-3554) |
| Additional Information Website | <span style="box-sizing: border-box; color: rgb(0, 0, 0); display: inline; flex-wrap: nowrap; font-size: 12px; font-weight: 400; grid-area: auto; line-height: 18px; margin: 0px; overflow: visible; text-align: justify; text-align-last: left; white-space-collapse: preserve-breaks;">www.gabelli.com/funds/open_ends</span> |
| Expenses [Text Block] | |
| Expenses Paid, Amount | $ 48 |
| Expense Ratio, Percent | 0.90% |
| Factors Affecting Performance [Text Block] | |
| Performance Past Does Not Indicate Future [Text] | Past performance does not guarantee future results. |
| Line Graph [Table Text Block] | |
| Average Annual Return [Table Text Block] | |
| No Deduction of Taxes [Text Block] | The table and graph presented above do not reflect the deduction of taxes a shareholder would pay on fund distributions or the redemption of fund shares. |
| AssetsNet | $ 64,385,465 |
| Holdings Count | Holding | 177 |
| Advisory Fees Paid, Amount | $ 144,088 |
| InvestmentCompanyPortfolioTurnover | 1.00% |
| Additional Fund Statistics [Text Block] | |
| Holdings [Text Block] | |
| Largest Holdings [Text Block] | |
| Material Fund Change [Text Block] | |
| Updated Prospectus Phone Number | 800-GABELLI (800-422-3554) |
| Updated Prospectus Email Address | <span style="box-sizing: border-box; color: rgb(0, 0, 0); display: inline; flex-wrap: nowrap; font-size: 12px; font-weight: 400; grid-area: auto; line-height: 18px; margin: 0px; overflow: visible; text-align: justify; text-align-last: left; white-space-collapse: preserve-breaks;">info@gabelli.com</span> |
| Updated Prospectus Web Address | <span style="box-sizing: border-box; color: rgb(0, 0, 0); display: inline; flex-wrap: nowrap; font-size: 12px; font-weight: 400; grid-area: auto; line-height: 18px; margin: 0px; overflow: visible; text-align: justify; text-align-last: left; white-space-collapse: preserve-breaks;">www.gabelli.com/funds/open_ends</span> |
| C000002873 | |
| Shareholder Report [Line Items] | |
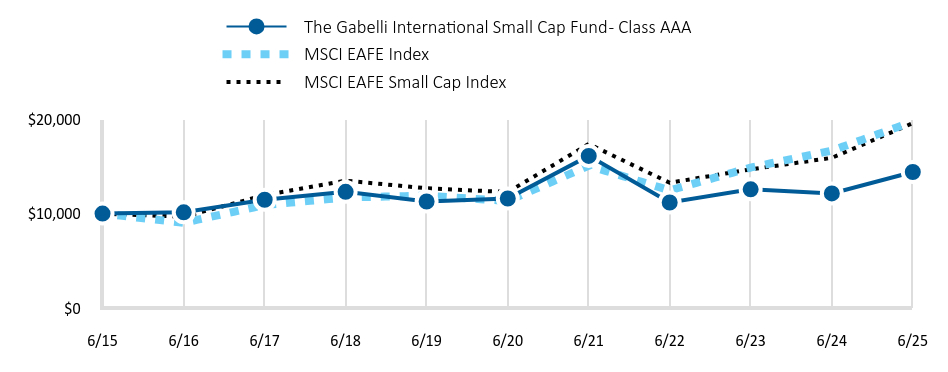
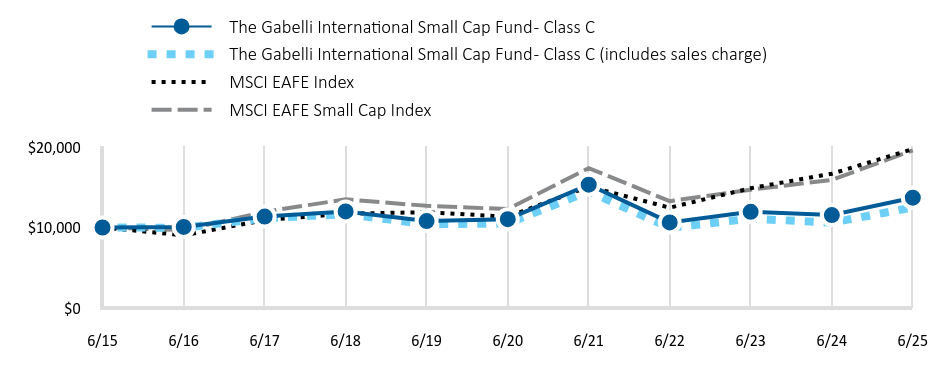
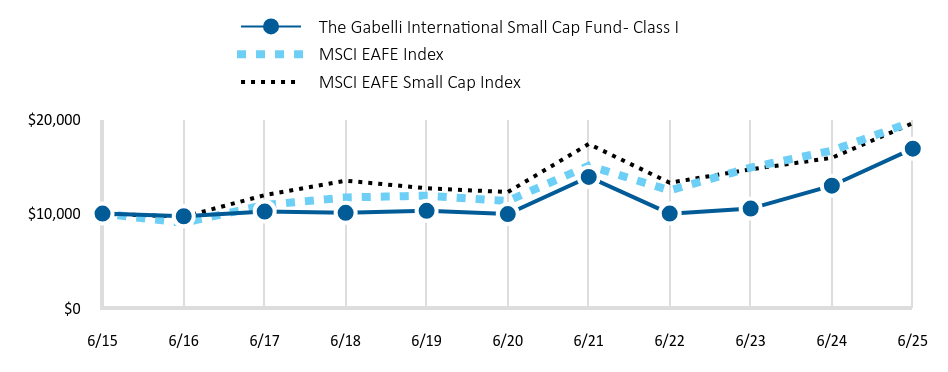
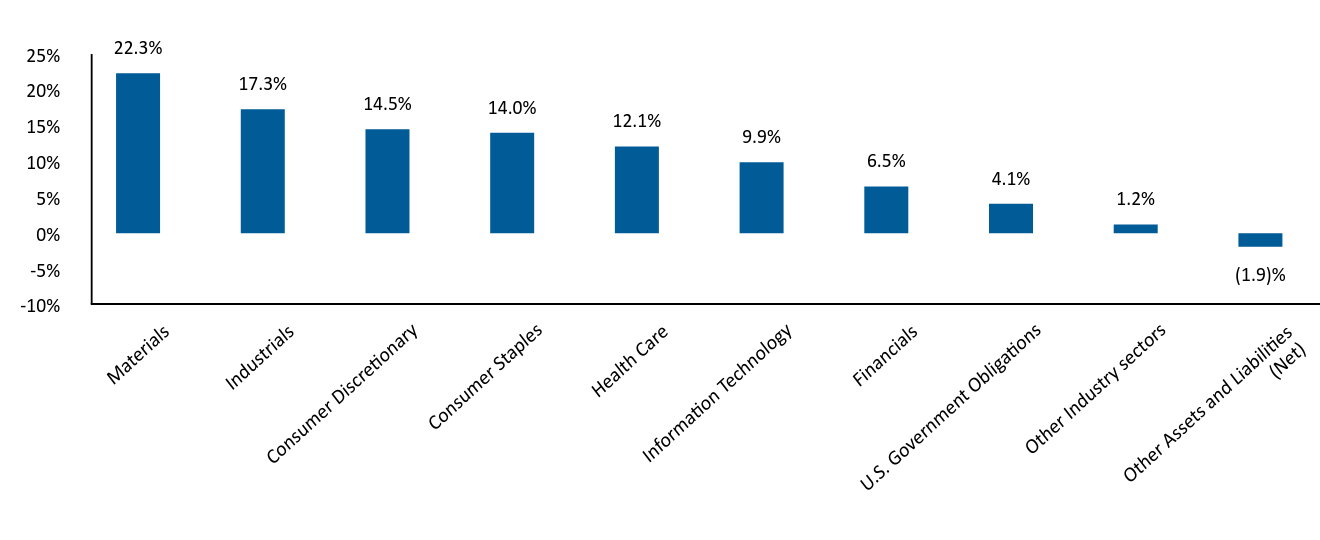
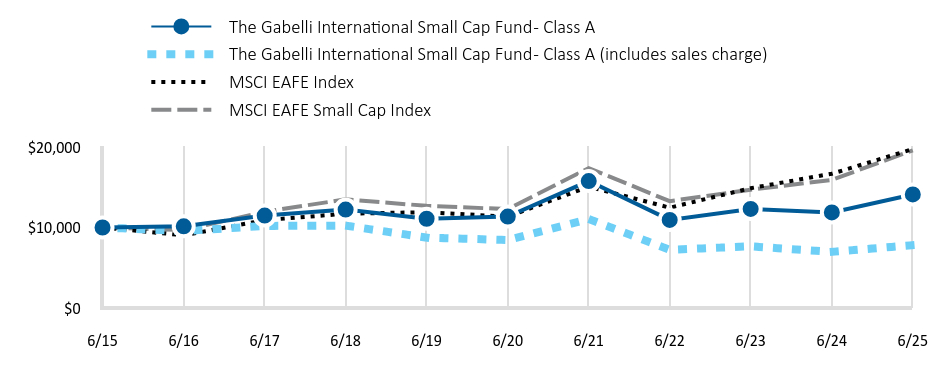
| Fund Name | The Gabelli International Small Cap Fund |
| Class Name | Class AAA |
| Trading Symbol | GABOX |
| Annual or Semi-Annual Statement [Text Block] | This semi-annual shareholder report contains important information about The Gabelli International Small Cap Fund (the Fund) for the period of January 1, 2025 to June 30, 2025. |
| Shareholder Report Annual or Semi-Annual | semi-annual shareholder report |
| Additional Information [Text Block] | You may find additional information about the Fund at www.gabelli.com/funds/open_ends. You may also request information by contacting us at 800-GABELLI (800-422-3554). |
| Additional Information Phone Number | 800-GABELLI (800-422-3554) |
| Additional Information Website | <span style="box-sizing: border-box; color: rgb(0, 0, 0); display: inline; flex-wrap: nowrap; font-size: 12px; font-weight: 400; grid-area: auto; line-height: 18px; margin: 0px; overflow: visible; text-align: justify; text-align-last: left; white-space-collapse: preserve-breaks;">www.gabelli.com/funds/open_ends</span> |
| Expenses [Text Block] | |
| Expenses Paid, Amount | $ 51 |
| Expense Ratio, Percent | 0.92% |
| Factors Affecting Performance [Text Block] | |
| Performance Past Does Not Indicate Future [Text] | Past performance does not guarantee future results. |
| Line Graph [Table Text Block] | |
| Average Annual Return [Table Text Block] | |
| No Deduction of Taxes [Text Block] | The table and graph presented above do not reflect the deduction of taxes a shareholder would pay on fund distributions or the redemption of fund shares. |
| AssetsNet | $ 5,981,268 |
| Holdings Count | Holding | 50 |
| Advisory Fees Paid, Amount | $ (67,146) |
| InvestmentCompanyPortfolioTurnover | 7.00% |
| Additional Fund Statistics [Text Block] | |
| Holdings [Text Block] | |
| Largest Holdings [Text Block] | |
| Material Fund Change [Text Block] | |
| Updated Prospectus Phone Number | 800-GABELLI (800-422-3554) |
| Updated Prospectus Email Address | <span style="box-sizing: border-box; color: rgb(0, 0, 0); display: inline; flex-wrap: nowrap; font-size: 12px; font-weight: 400; grid-area: auto; line-height: 18px; margin: 0px; overflow: visible; text-align: justify; text-align-last: left; white-space-collapse: preserve-breaks;">info@gabelli.com</span> |
| Updated Prospectus Web Address | <span style="box-sizing: border-box; color: rgb(0, 0, 0); display: inline; flex-wrap: nowrap; font-size: 12px; font-weight: 400; grid-area: auto; line-height: 18px; margin: 0px; overflow: visible; text-align: justify; text-align-last: left; white-space-collapse: preserve-breaks;">www.gabelli.com/funds/open_ends</span> |
| C000002871 | |
| Shareholder Report [Line Items] | |
| Fund Name | The Gabelli International Small Cap Fund |
| Class Name | Class C |
| Trading Symbol | GGLCX |
| Annual or Semi-Annual Statement [Text Block] | This semi-annual shareholder report contains important information about The Gabelli International Small Cap Fund (the Fund) for the period of January 1, 2025 to June 30, 2025. |
| Shareholder Report Annual or Semi-Annual | semi-annual shareholder report |
| Additional Information [Text Block] | You may find additional information about the Fund at www.gabelli.com/funds/open_ends. You may also request information by contacting us at 800-GABELLI (800-422-3554). |
| Additional Information Phone Number | 800-GABELLI (800-422-3554) |
| Additional Information Website | <span style="box-sizing: border-box; color: rgb(0, 0, 0); display: inline; flex-wrap: nowrap; font-size: 12px; font-weight: 400; grid-area: auto; line-height: 18px; margin: 0px; overflow: visible; text-align: justify; text-align-last: left; white-space-collapse: preserve-breaks;">www.gabelli.com/funds/open_ends</span> |
| Expenses [Text Block] | |
| Expenses Paid, Amount | $ 51 |
| Expense Ratio, Percent | 0.92% |
| Factors Affecting Performance [Text Block] | |
| Performance Past Does Not Indicate Future [Text] | Past performance does not guarantee future results. |
| Line Graph [Table Text Block] | |
| Average Annual Return [Table Text Block] | |
| No Deduction of Taxes [Text Block] | The table and graph presented above do not reflect the deduction of taxes a shareholder would pay on fund distributions or the redemption of fund shares. |
| AssetsNet | $ 5,981,268 |
| Holdings Count | Holding | 50 |
| Advisory Fees Paid, Amount | $ (67,146) |
| InvestmentCompanyPortfolioTurnover | 7.00% |
| Additional Fund Statistics [Text Block] | |
| Holdings [Text Block] | |
| Largest Holdings [Text Block] | |
| Material Fund Change [Text Block] | |
| Updated Prospectus Phone Number | 800-GABELLI (800-422-3554) |
| Updated Prospectus Email Address | <span style="box-sizing: border-box; color: rgb(0, 0, 0); display: inline; flex-wrap: nowrap; font-size: 12px; font-weight: 400; grid-area: auto; line-height: 18px; margin: 0px; overflow: visible; text-align: justify; text-align-last: left; white-space-collapse: preserve-breaks;">info@gabelli.com</span> |
| Updated Prospectus Web Address | <span style="box-sizing: border-box; color: rgb(0, 0, 0); display: inline; flex-wrap: nowrap; font-size: 12px; font-weight: 400; grid-area: auto; line-height: 18px; margin: 0px; overflow: visible; text-align: justify; text-align-last: left; white-space-collapse: preserve-breaks;">www.gabelli.com/funds/open_ends</span> |
| C000034310 | |
| Shareholder Report [Line Items] | |
| Fund Name | The Gabelli International Small Cap Fund |
| Class Name | Class I |
| Trading Symbol | GLOIX |
| Annual or Semi-Annual Statement [Text Block] | This semi-annual shareholder report contains important information about The Gabelli International Small Cap Fund (the Fund) for the period of January 1, 2025 to June 30, 2025. |
| Shareholder Report Annual or Semi-Annual | semi-annual shareholder report |
| Additional Information [Text Block] | You may find additional information about the Fund at www.gabelli.com/funds/open_ends. You may also request information by contacting us at 800-GABELLI (800-422-3554). |
| Additional Information Phone Number | 800-GABELLI (800-422-3554) |
| Additional Information Website | <span style="box-sizing: border-box; color: rgb(0, 0, 0); display: inline; flex-wrap: nowrap; font-size: 12px; font-weight: 400; grid-area: auto; line-height: 18px; margin: 0px; overflow: visible; text-align: justify; text-align-last: left; white-space-collapse: preserve-breaks;">www.gabelli.com/funds/open_ends</span> |
| Expenses [Text Block] | |
| Expenses Paid, Amount | $ 51 |
| Expense Ratio, Percent | 0.92% |
| Factors Affecting Performance [Text Block] | |
| Performance Past Does Not Indicate Future [Text] | Past performance does not guarantee future results. |
| Line Graph [Table Text Block] | |
| Average Annual Return [Table Text Block] | |
| No Deduction of Taxes [Text Block] | The table and graph presented above do not reflect the deduction of taxes a shareholder would pay on fund distributions or the redemption of fund shares. |
| AssetsNet | $ 5,981,268 |
| Holdings Count | Holding | 50 |
| Advisory Fees Paid, Amount | $ (67,146) |
| InvestmentCompanyPortfolioTurnover | 7.00% |
| Additional Fund Statistics [Text Block] | |
| Holdings [Text Block] | |
| Largest Holdings [Text Block] | |
| Material Fund Change [Text Block] | |
| Updated Prospectus Phone Number | 800-GABELLI (800-422-3554) |
| Updated Prospectus Email Address | <span style="box-sizing: border-box; color: rgb(0, 0, 0); display: inline; flex-wrap: nowrap; font-size: 12px; font-weight: 400; grid-area: auto; line-height: 18px; margin: 0px; overflow: visible; text-align: justify; text-align-last: left; white-space-collapse: preserve-breaks;">info@gabelli.com</span> |
| Updated Prospectus Web Address | <span style="box-sizing: border-box; color: rgb(0, 0, 0); display: inline; flex-wrap: nowrap; font-size: 12px; font-weight: 400; grid-area: auto; line-height: 18px; margin: 0px; overflow: visible; text-align: justify; text-align-last: left; white-space-collapse: preserve-breaks;">www.gabelli.com/funds/open_ends</span> |
| C000002872 | |
| Shareholder Report [Line Items] | |
| Fund Name | The Gabelli International Small Cap Fund |
| Class Name | Class A |
| Trading Symbol | GOCAX |
| Annual or Semi-Annual Statement [Text Block] | This semi-annual shareholder report contains important information about The Gabelli International Small Cap Fund (the Fund) for the period of January 1, 2025 to June 30, 2025. |
| Shareholder Report Annual or Semi-Annual | semi-annual shareholder report |
| Additional Information [Text Block] | You may find additional information about the Fund at www.gabelli.com/funds/open_ends. You may also request information by contacting us at 800-GABELLI (800-422-3554). |
| Additional Information Phone Number | 800-GABELLI (800-422-3554) |
| Additional Information Website | <span style="box-sizing: border-box; color: rgb(0, 0, 0); display: inline; flex-wrap: nowrap; font-size: 12px; font-weight: 400; grid-area: auto; line-height: 18px; margin: 0px; overflow: visible; text-align: justify; text-align-last: left; white-space-collapse: preserve-breaks;">www.gabelli.com/funds/open_ends</span> |
| Expenses [Text Block] | |
| Expenses Paid, Amount | $ 51 |
| Expense Ratio, Percent | 0.92% |
| Factors Affecting Performance [Text Block] | |
| Performance Past Does Not Indicate Future [Text] | Past performance does not guarantee future results. |
| Line Graph [Table Text Block] | |
| Average Annual Return [Table Text Block] | |
| No Deduction of Taxes [Text Block] | The table and graph presented above do not reflect the deduction of taxes a shareholder would pay on fund distributions or the redemption of fund shares. |
| AssetsNet | $ 5,981,268 |
| Holdings Count | Holding | 50 |
| Advisory Fees Paid, Amount | $ (67,146) |
| InvestmentCompanyPortfolioTurnover | 7.00% |
| Additional Fund Statistics [Text Block] | |
| Holdings [Text Block] | |
| Largest Holdings [Text Block] | |
| Material Fund Change [Text Block] | |
| Updated Prospectus Phone Number | 800-GABELLI (800-422-3554) |
| Updated Prospectus Email Address | <span style="box-sizing: border-box; color: rgb(0, 0, 0); display: inline; flex-wrap: nowrap; font-size: 12px; font-weight: 400; grid-area: auto; line-height: 18px; margin: 0px; overflow: visible; text-align: justify; text-align-last: left; white-space-collapse: preserve-breaks;">info@gabelli.com</span> |
| Updated Prospectus Web Address | <span style="box-sizing: border-box; color: rgb(0, 0, 0); display: inline; flex-wrap: nowrap; font-size: 12px; font-weight: 400; grid-area: auto; line-height: 18px; margin: 0px; overflow: visible; text-align: justify; text-align-last: left; white-space-collapse: preserve-breaks;">www.gabelli.com/funds/open_ends</span> |
