Shareholder Report
|
12 Months Ended |
|
Jun. 30, 2025
USD ($)
Holding
|
Jun. 30, 2024 |
| Shareholder Report [Line Items] |
|
|
| Document Type |
N-CSR
|
|
| Amendment Flag |
false
|
|
| Registrant Name |
AMERICAN BEACON FUNDS
|
|
| Entity Central Index Key |
0000809593
|
|
| Entity Investment Company Type |
N-1A
|
|
| Document Period End Date |
Jun. 30, 2025
|
|
| C000210490 |
|
|
| Shareholder Report [Line Items] |
|
|
| Fund Name |
ARK Transformational Innovation Fund
|
|
| Class Name |
A
|
|
| Trading Symbol |
ADNAX
|
|
| Annual or Semi-Annual Statement [Text Block] |
This annual shareholder report contains important information about American Beacon ARK Transformational Innovation Fund for the period of July 1, 2024 to June 30, 2025.
|
|
| Shareholder Report Annual or Semi-Annual |
Annual Shareholder Report
|
|
| Additional Information [Text Block] |
You can find additional information about the Fund at www.americanbeaconfunds.com/literature. You can also request this information by contacting us at 800-658-5811.
|
|
| Additional Information Phone Number |
800-658-5811
|
|
| Additional Information Website |
<span style="box-sizing: border-box; color: rgb(0, 0, 0); display: inline; flex-wrap: nowrap; font-size: 13.3333px; font-weight: 400; grid-area: auto; line-height: 16px; margin: 0px; overflow: visible; text-align: left; text-align-last: auto; white-space-collapse: preserve-breaks;">www.americanbeaconfunds.com/literature</span>
|
|
| Expenses [Text Block] |
What were the Fund costs for the last year?(based on a hypothetical $10,000 investment)
Class Name |
Costs of a $10,000 investment |
Costs paid as a percentage of a $10,000 investment |
Class A |
$182 |
1.40% | |
|
| Expenses Paid, Amount |
$ 182
|
|
| Expense Ratio, Percent |
1.40%
|
|
| Factors Affecting Performance [Text Block] |
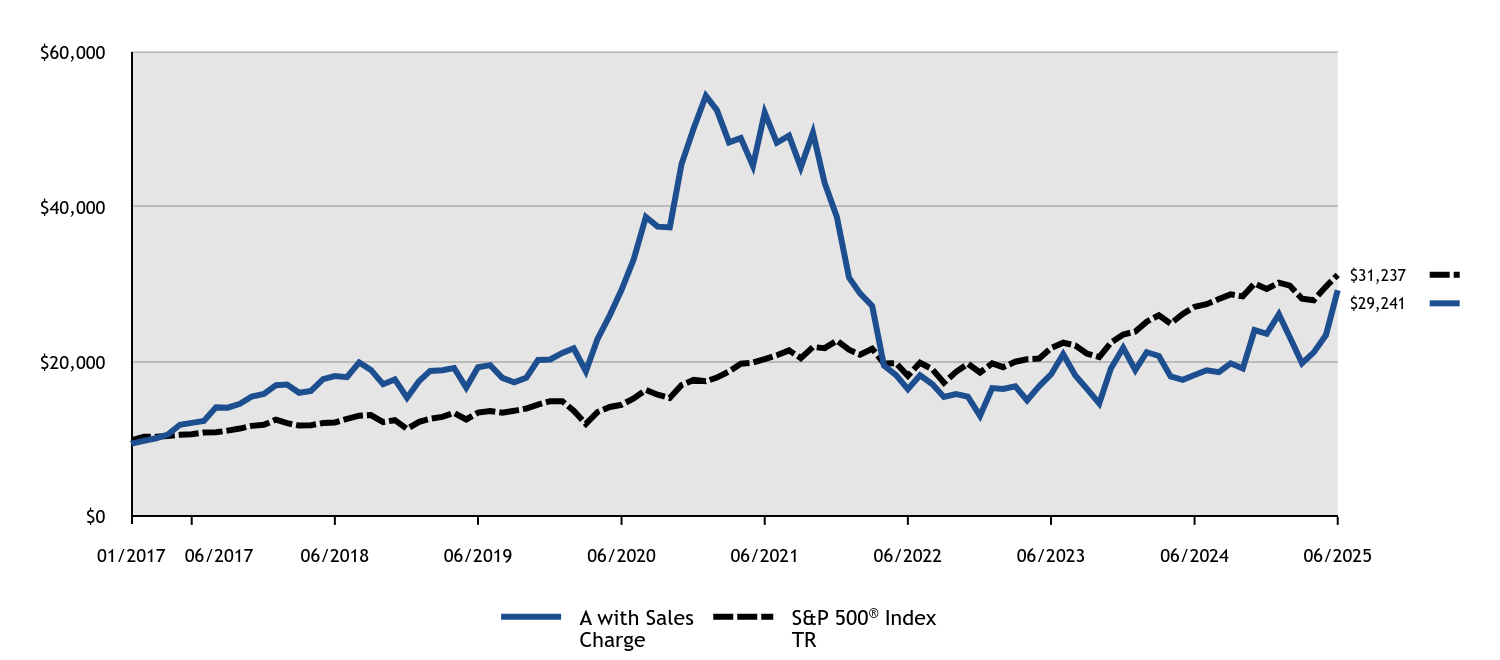
How did the Fund perform and what affected its performance? The A Class of the Fund returned 50.52% (with sales charges) and 59.74% (without sales charges) for the twelve months ended June 30, 2025, compared to the S&P 500 Index return of 15.16%. • The headwinds that once pressured disruptive technologies lessened due to broader market participation, favorable policy shifts around crypto, Artificial Intelligence, and healthcare, coupled with expectations for potential fiscal catalysts like tax cuts. • The Fund’s investments in software and capital markets companies materially helped performance for the period. Conversely, its investments in biotechnology and semiconductors and semiconductor equipment companies detracted from performance. |
|
| Performance Past Does Not Indicate Future [Text] |
Performance shown is historical and is not indicative of future returns.
|
|
| Line Graph [Table Text Block] |
|
A with Sales Charge |
S&P 500® Index TR |
01/2017 |
$9,425 |
$10,000 |
01/2017 |
$9,500 |
$9,932 |
02/2017 |
$9,802 |
$10,326 |
03/2017 |
$10,141 |
$10,338 |
04/2017 |
$10,622 |
$10,444 |
05/2017 |
$11,894 |
$10,591 |
06/2017 |
$12,130 |
$10,657 |
07/2017 |
$12,385 |
$10,876 |
08/2017 |
$14,138 |
$10,910 |
09/2017 |
$14,090 |
$11,135 |
10/2017 |
$14,590 |
$11,395 |
11/2017 |
$15,533 |
$11,744 |
12/2017 |
$15,861 |
$11,875 |
01/2018 |
$17,003 |
$12,554 |
02/2018 |
$17,081 |
$12,092 |
03/2018 |
$16,017 |
$11,784 |
04/2018 |
$16,251 |
$11,830 |
05/2018 |
$17,775 |
$12,115 |
06/2018 |
$18,165 |
$12,189 |
07/2018 |
$18,029 |
$12,643 |
08/2018 |
$19,943 |
$13,055 |
09/2018 |
$18,966 |
$13,129 |
10/2018 |
$17,120 |
$12,232 |
11/2018 |
$17,745 |
$12,481 |
12/2018 |
$15,388 |
$11,354 |
01/2019 |
$17,538 |
$12,264 |
02/2019 |
$18,839 |
$12,658 |
03/2019 |
$18,933 |
$12,904 |
04/2019 |
$19,216 |
$13,426 |
05/2019 |
$16,688 |
$12,573 |
06/2019 |
$19,321 |
$13,459 |
07/2019 |
$19,583 |
$13,652 |
08/2019 |
$17,937 |
$13,436 |
09/2019 |
$17,370 |
$13,687 |
10/2019 |
$17,947 |
$13,984 |
11/2019 |
$20,244 |
$14,492 |
12/2019 |
$20,312 |
$14,929 |
01/2020 |
$21,157 |
$14,923 |
02/2020 |
$21,752 |
$13,695 |
03/2020 |
$18,795 |
$12,003 |
04/2020 |
$22,987 |
$13,542 |
05/2020 |
$26,010 |
$14,187 |
06/2020 |
$29,303 |
$14,469 |
07/2020 |
$33,246 |
$15,285 |
08/2020 |
$38,706 |
$16,384 |
09/2020 |
$37,460 |
$15,761 |
10/2020 |
$37,363 |
$15,342 |
11/2020 |
$45,552 |
$17,021 |
12/2020 |
$50,167 |
$17,676 |
01/2021 |
$54,351 |
$17,497 |
02/2021 |
$52,504 |
$17,980 |
03/2021 |
$48,341 |
$18,767 |
04/2021 |
$48,885 |
$19,769 |
05/2021 |
$45,298 |
$19,907 |
06/2021 |
$52,167 |
$20,371 |
07/2021 |
$48,287 |
$20,855 |
08/2021 |
$49,211 |
$21,490 |
09/2021 |
$45,113 |
$20,490 |
10/2021 |
$49,591 |
$21,926 |
11/2021 |
$43,081 |
$21,774 |
12/2021 |
$38,699 |
$22,750 |
01/2022 |
$30,883 |
$21,572 |
02/2022 |
$28,850 |
$20,926 |
03/2022 |
$27,230 |
$21,703 |
04/2022 |
$19,527 |
$19,811 |
05/2022 |
$18,291 |
$19,847 |
06/2022 |
$16,486 |
$18,209 |
07/2022 |
$18,277 |
$19,888 |
08/2022 |
$17,140 |
$19,077 |
09/2022 |
$15,477 |
$17,320 |
10/2022 |
$15,846 |
$18,722 |
11/2022 |
$15,520 |
$19,768 |
12/2022 |
$13,024 |
$18,629 |
01/2023 |
$16,622 |
$19,800 |
02/2023 |
$16,498 |
$19,317 |
03/2023 |
$16,856 |
$20,026 |
04/2023 |
$15,049 |
$20,339 |
05/2023 |
$16,872 |
$20,427 |
06/2023 |
$18,383 |
$21,777 |
07/2023 |
$21,000 |
$22,476 |
08/2023 |
$18,258 |
$22,118 |
09/2023 |
$16,513 |
$21,064 |
10/2023 |
$14,644 |
$20,621 |
11/2023 |
$19,193 |
$22,504 |
12/2023 |
$21,826 |
$23,527 |
01/2024 |
$18,944 |
$23,922 |
02/2024 |
$21,249 |
$25,199 |
03/2024 |
$20,766 |
$26,010 |
04/2024 |
$18,118 |
$24,948 |
05/2024 |
$17,682 |
$26,185 |
06/2024 |
$18,305 |
$27,124 |
07/2024 |
$18,928 |
$27,454 |
08/2024 |
$18,679 |
$28,120 |
09/2024 |
$19,816 |
$28,721 |
10/2024 |
$19,146 |
$28,461 |
11/2024 |
$24,116 |
$30,131 |
12/2024 |
$23,633 |
$29,413 |
01/2025 |
$26,141 |
$30,232 |
02/2025 |
$23,181 |
$29,838 |
03/2025 |
$19,832 |
$28,156 |
04/2025 |
$21,234 |
$27,965 |
05/2025 |
$23,462 |
$29,726 |
06/2025 |
$29,241 |
$31,237 |
|
|
| Average Annual Return [Table Text Block] |
HEADER |
1 Year |
5 Years |
Since Inception (1/27/17) |
Class A without Sales ChargeFootnote Reference1 |
59.74% |
(0.04)% |
14.39% |
Class A with Maximum Sales Charge - 5.75%Footnote Reference1 |
50.52% |
(1.22)% |
13.59% |
S&P 500® Index TR |
15.16% |
16.64% |
14.48% | |
|
| Performance Inception Date |
Jan. 27, 2017
|
|
| No Deduction of Taxes [Text Block] |
The graph and table do not reflect the deduction of taxes that a shareholder would pay on fund distributions or redemption of fund shares.
|
|
| AssetsNet |
$ 203,610,644
|
|
| Holdings Count | Holding |
42
|
|
| Advisory Fees Paid, Amount |
$ 1,502,796
|
|
| InvestmentCompanyPortfolioTurnover |
46.00%
|
|
| Additional Fund Statistics [Text Block] |
Total Net Assets |
$203,610,644 |
# of Portfolio Holdings |
42 |
Portfolio Turnover Rate |
46% |
Total Management Fees Paid |
$1,502,796 | |
|
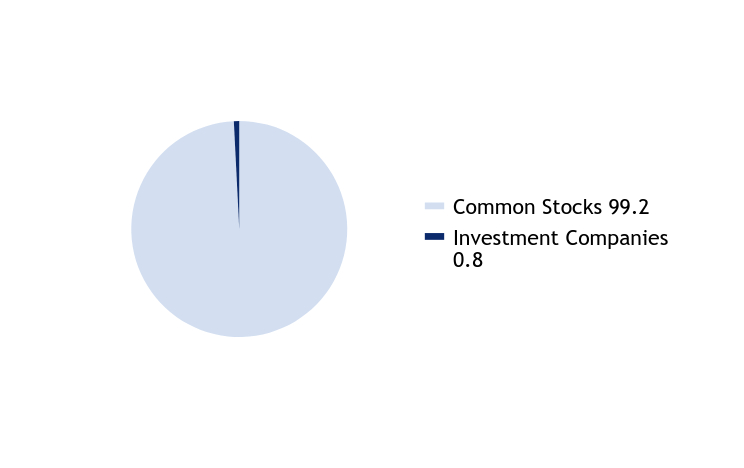
| Holdings [Text Block] |
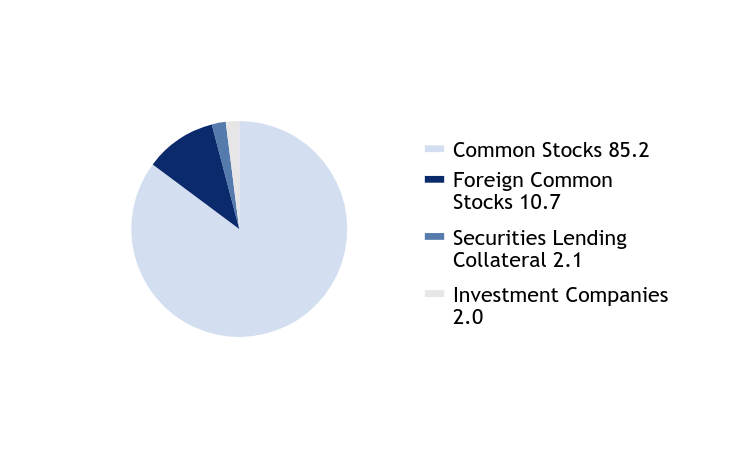
Asset Allocation - % Investments
Value |
Value |
Common Stocks |
85.2 |
Foreign Common Stocks |
10.7 |
Securities Lending Collateral |
2.1 |
Investment Companies |
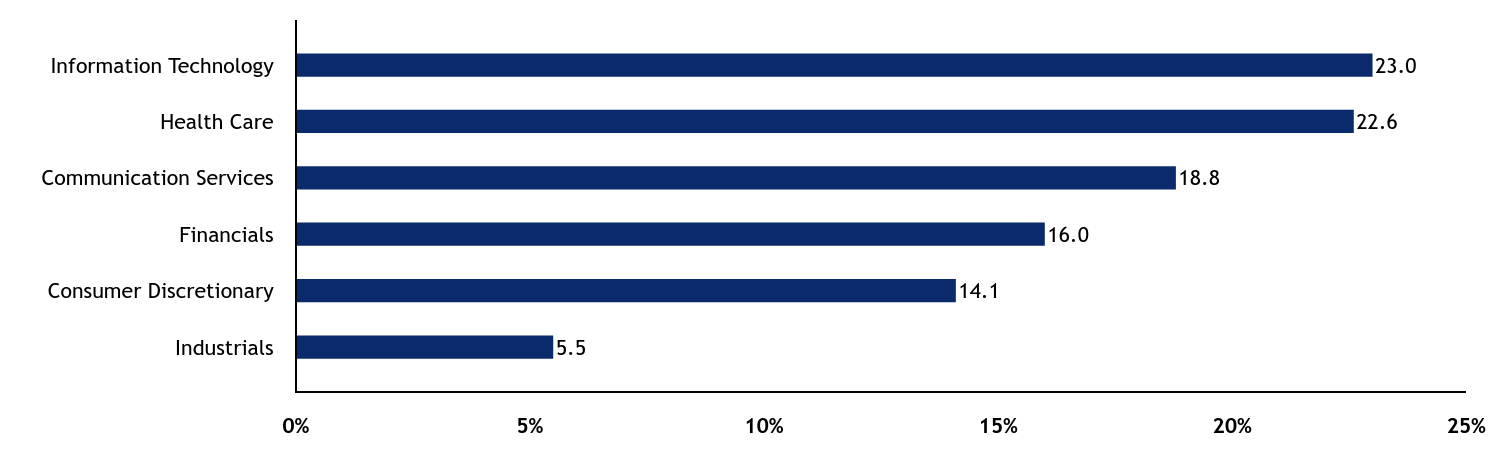
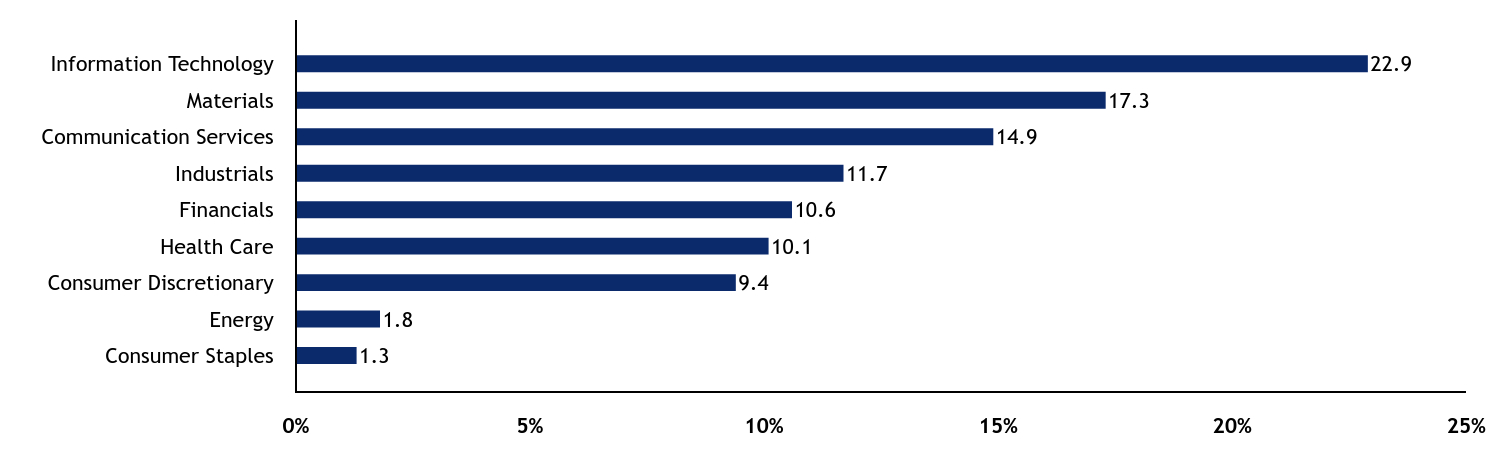
2.0 | Sector Allocation - % Equities
Value |
Value |
Industrials |
5.5 |
Consumer Discretionary |
14.1 |
Financials |
16.0 |
Communication Services |
18.8 |
Health Care |
22.6 |
Information Technology |
23.0 | |
|
| Largest Holdings [Text Block] |
Top Ten Holdings - % Net Assets
Tesla, Inc. |
9.5 |
Coinbase Global, Inc., Class A |
8.0 |
Roku, Inc. |
7.4 |
ROBLOX Corp., Class A |
6.4 |
Robinhood Markets, Inc., Class A |
5.5 |
CRISPR Therapeutics AG |
5.1 |
Shopify, Inc., Class A |
4.8 |
Tempus AI, Inc. |
4.7 |
Circle Internet Group, Inc. |
4.5 |
Palantir Technologies, Inc., Class A |
4.1 | Excludes cash equivalents. |
|
| Material Fund Change [Text Block] |
|
|
| C000210491 |
|
|
| Shareholder Report [Line Items] |
|
|
| Fund Name |
ARK Transformational Innovation Fund
|
|
| Class Name |
C
|
|
| Trading Symbol |
ADNCX
|
|
| Annual or Semi-Annual Statement [Text Block] |
This annual shareholder report contains important information about American Beacon ARK Transformational Innovation Fund for the period of July 1, 2024 to June 30, 2025.
|
|
| Shareholder Report Annual or Semi-Annual |
Annual Shareholder Report
|
|
| Additional Information [Text Block] |
You can find additional information about the Fund at www.americanbeaconfunds.com/literature. You can also request this information by contacting us at 800-658-5811.
|
|
| Additional Information Phone Number |
800-658-5811
|
|
| Additional Information Website |
<span style="box-sizing: border-box; color: rgb(0, 0, 0); display: inline; flex-wrap: nowrap; font-size: 13.3333px; font-weight: 400; grid-area: auto; line-height: 16px; margin: 0px; overflow: visible; text-align: left; text-align-last: auto; white-space-collapse: preserve-breaks;">www.americanbeaconfunds.com/literature</span>
|
|
| Expenses [Text Block] |
What were the Fund costs for the last year?(based on a hypothetical $10,000 investment)
Class Name |
Costs of a $10,000 investment |
Costs paid as a percentage of a $10,000 investment |
Class C |
$279 |
2.16% | |
|
| Expenses Paid, Amount |
$ 279
|
|
| Expense Ratio, Percent |
2.16%
|
|
| Factors Affecting Performance [Text Block] |
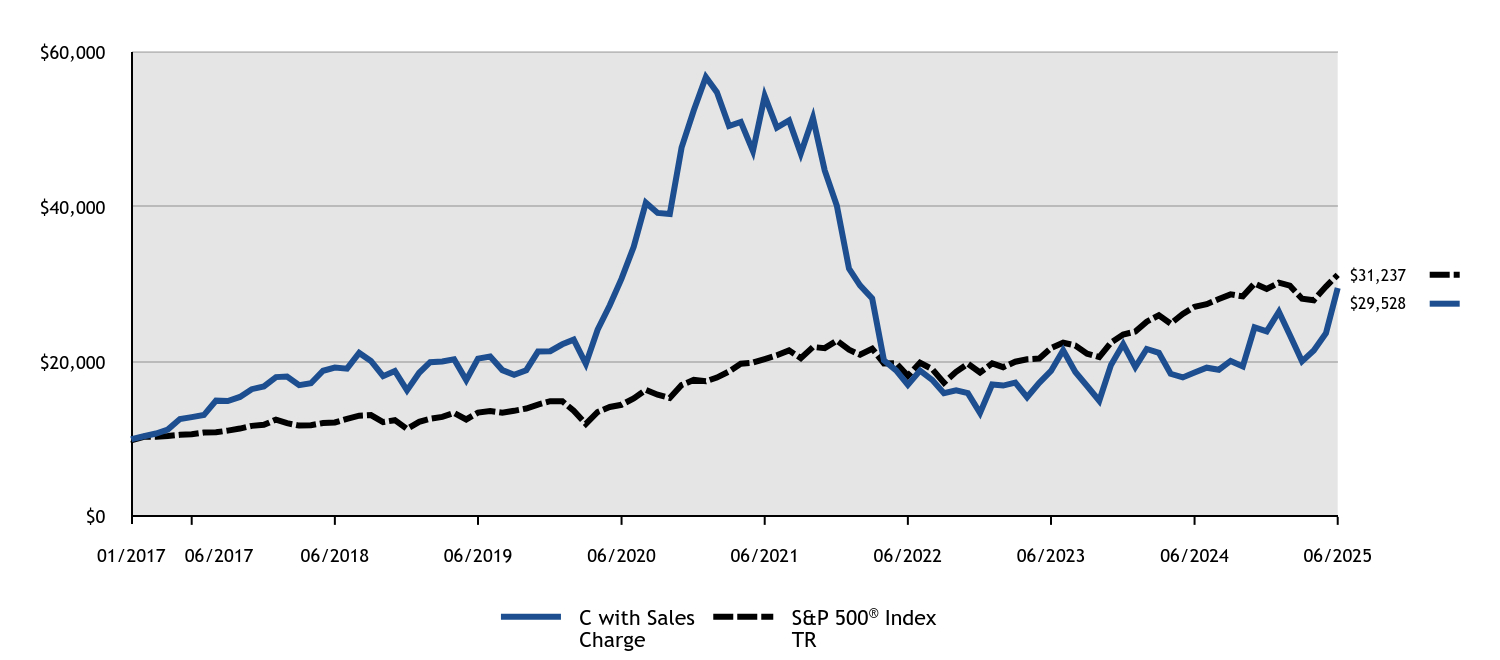
How did the Fund perform and what affected its performance? The C Class of the Fund returned 57.53% (with sales charges) and 58.53% (without sales charges) for the twelve months ended June 30, 2025, compared to the S&P 500 Index return of 15.16%. • The headwinds that once pressured disruptive technologies lessened due to broader market participation, favorable policy shifts around crypto, Artificial Intelligence, and healthcare, coupled with expectations for potential fiscal catalysts like tax cuts. • The Fund’s investments in software and capital markets companies materially helped performance for the period. Conversely, its investments in biotechnology and semiconductors and semiconductor equipment companies detracted from performance. |
|
| Performance Past Does Not Indicate Future [Text] |
Performance shown is historical and is not indicative of future returns.
|
|
| Line Graph [Table Text Block] |
|
C with Sales Charge |
S&P 500® Index TR |
01/2017 |
$10,000 |
$10,000 |
01/2017 |
$10,080 |
$9,932 |
02/2017 |
$10,400 |
$10,326 |
03/2017 |
$10,760 |
$10,338 |
04/2017 |
$11,270 |
$10,444 |
05/2017 |
$12,620 |
$10,591 |
06/2017 |
$12,870 |
$10,657 |
07/2017 |
$13,140 |
$10,876 |
08/2017 |
$15,000 |
$10,910 |
09/2017 |
$14,950 |
$11,135 |
10/2017 |
$15,480 |
$11,395 |
11/2017 |
$16,480 |
$11,744 |
12/2017 |
$16,828 |
$11,875 |
01/2018 |
$18,040 |
$12,554 |
02/2018 |
$18,123 |
$12,092 |
03/2018 |
$16,994 |
$11,784 |
04/2018 |
$17,243 |
$11,830 |
05/2018 |
$18,859 |
$12,115 |
06/2018 |
$19,274 |
$12,189 |
07/2018 |
$19,128 |
$12,643 |
08/2018 |
$21,159 |
$13,055 |
09/2018 |
$20,123 |
$13,129 |
10/2018 |
$18,165 |
$12,232 |
11/2018 |
$18,828 |
$12,481 |
12/2018 |
$16,327 |
$11,354 |
01/2019 |
$18,597 |
$12,264 |
02/2019 |
$19,966 |
$12,658 |
03/2019 |
$20,055 |
$12,904 |
04/2019 |
$20,333 |
$13,426 |
05/2019 |
$17,651 |
$12,573 |
06/2019 |
$20,422 |
$13,459 |
07/2019 |
$20,689 |
$13,652 |
08/2019 |
$18,942 |
$13,436 |
09/2019 |
$18,330 |
$13,687 |
10/2019 |
$18,931 |
$13,984 |
11/2019 |
$21,335 |
$14,492 |
12/2019 |
$21,387 |
$14,929 |
01/2020 |
$22,271 |
$14,923 |
02/2020 |
$22,879 |
$13,695 |
03/2020 |
$19,745 |
$12,003 |
04/2020 |
$24,153 |
$13,542 |
05/2020 |
$27,310 |
$14,187 |
06/2020 |
$30,743 |
$14,469 |
07/2020 |
$34,852 |
$15,285 |
08/2020 |
$40,558 |
$16,384 |
09/2020 |
$39,226 |
$15,761 |
10/2020 |
$39,100 |
$15,342 |
11/2020 |
$47,652 |
$17,021 |
12/2020 |
$52,439 |
$17,676 |
01/2021 |
$56,769 |
$17,497 |
02/2021 |
$54,823 |
$17,980 |
03/2021 |
$50,446 |
$18,767 |
04/2021 |
$50,976 |
$19,769 |
05/2021 |
$47,210 |
$19,907 |
06/2021 |
$54,316 |
$20,371 |
07/2021 |
$50,250 |
$20,855 |
08/2021 |
$51,172 |
$21,490 |
09/2021 |
$46,899 |
$20,490 |
10/2021 |
$51,506 |
$21,926 |
11/2021 |
$44,722 |
$21,774 |
12/2021 |
$40,139 |
$22,750 |
01/2022 |
$32,030 |
$21,572 |
02/2022 |
$29,887 |
$20,926 |
03/2022 |
$28,193 |
$21,703 |
04/2022 |
$20,204 |
$19,811 |
05/2022 |
$18,915 |
$19,847 |
06/2022 |
$17,042 |
$18,209 |
07/2022 |
$18,870 |
$19,888 |
08/2022 |
$17,686 |
$19,077 |
09/2022 |
$15,963 |
$17,320 |
10/2022 |
$16,337 |
$18,722 |
11/2022 |
$15,978 |
$19,768 |
12/2022 |
$13,405 |
$18,629 |
01/2023 |
$17,094 |
$19,800 |
02/2023 |
$16,946 |
$19,317 |
03/2023 |
$17,325 |
$20,026 |
04/2023 |
$15,447 |
$20,339 |
05/2023 |
$17,308 |
$20,427 |
06/2023 |
$18,840 |
$21,777 |
07/2023 |
$21,507 |
$22,476 |
08/2023 |
$18,691 |
$22,118 |
09/2023 |
$16,896 |
$21,064 |
10/2023 |
$14,986 |
$20,621 |
11/2023 |
$19,614 |
$22,504 |
12/2023 |
$22,298 |
$23,527 |
01/2024 |
$19,334 |
$23,922 |
02/2024 |
$21,672 |
$25,199 |
03/2024 |
$21,178 |
$26,010 |
04/2024 |
$18,461 |
$24,948 |
05/2024 |
$18,000 |
$26,185 |
06/2024 |
$18,626 |
$27,124 |
07/2024 |
$19,251 |
$27,454 |
08/2024 |
$18,988 |
$28,120 |
09/2024 |
$20,124 |
$28,721 |
10/2024 |
$19,416 |
$28,461 |
11/2024 |
$24,455 |
$30,131 |
12/2024 |
$23,945 |
$29,413 |
01/2025 |
$26,481 |
$30,232 |
02/2025 |
$23,467 |
$29,838 |
03/2025 |
$20,075 |
$28,156 |
04/2025 |
$21,475 |
$27,965 |
05/2025 |
$23,714 |
$29,726 |
06/2025 |
$29,528 |
$31,237 |
|
|
| Average Annual Return [Table Text Block] |
HEADER |
1 Year |
5 Years |
Since Inception (1/27/17) |
Class C without Deferred Sales ChargeFootnote Reference1 |
58.53% |
(0.80)% |
13.72% |
Class C with Maximum Deferred Sales Charge -1.00%Footnote Reference1 |
57.53% |
(0.80)% |
13.72% |
S&P 500® Index TR |
15.16% |
16.64% |
14.48% | |
|
| Performance Inception Date |
Jan. 27, 2017
|
|
| No Deduction of Taxes [Text Block] |
The graph and table do not reflect the deduction of taxes that a shareholder would pay on fund distributions or redemption of fund shares.
|
|
| AssetsNet |
$ 203,610,644
|
|
| Holdings Count | Holding |
42
|
|
| Advisory Fees Paid, Amount |
$ 1,502,796
|
|
| InvestmentCompanyPortfolioTurnover |
46.00%
|
|
| Additional Fund Statistics [Text Block] |
Total Net Assets |
$203,610,644 |
# of Portfolio Holdings |
42 |
Portfolio Turnover Rate |
46% |
Total Management Fees Paid |
$1,502,796 | |
|
| Holdings [Text Block] |
Asset Allocation - % Investments
Value |
Value |
Common Stocks |
85.2 |
Foreign Common Stocks |
10.7 |
Securities Lending Collateral |
2.1 |
Investment Companies |
2.0 | Sector Allocation - % Equities
Value |
Value |
Industrials |
5.5 |
Consumer Discretionary |
14.1 |
Financials |
16.0 |
Communication Services |
18.8 |
Health Care |
22.6 |
Information Technology |
23.0 | |
|
| Largest Holdings [Text Block] |
Top Ten Holdings - % Net Assets
Tesla, Inc. |
9.5 |
Coinbase Global, Inc., Class A |
8.0 |
Roku, Inc. |
7.4 |
ROBLOX Corp., Class A |
6.4 |
Robinhood Markets, Inc., Class A |
5.5 |
CRISPR Therapeutics AG |
5.1 |
Shopify, Inc., Class A |
4.8 |
Tempus AI, Inc. |
4.7 |
Circle Internet Group, Inc. |
4.5 |
Palantir Technologies, Inc., Class A |
4.1 | Excludes cash equivalents. |
|
| Material Fund Change [Text Block] |
|
|
| C000176824 |
|
|
| Shareholder Report [Line Items] |
|
|
| Fund Name |
ARK Transformational Innovation Fund
|
|
| Class Name |
R5
|
|
| Trading Symbol |
ADNIX
|
|
| Annual or Semi-Annual Statement [Text Block] |
This annual shareholder report contains important information about American Beacon ARK Transformational Innovation Fund for the period of July 1, 2024 to June 30, 2025.
|
|
| Shareholder Report Annual or Semi-Annual |
Annual Shareholder Report
|
|
| Additional Information [Text Block] |
You can find additional information about the Fund at www.americanbeaconfunds.com/literature. You can also request this information by contacting us at 800-658-5811.
|
|
| Additional Information Phone Number |
800-658-5811
|
|
| Additional Information Website |
<span style="box-sizing: border-box; color: rgb(0, 0, 0); display: inline; flex-wrap: nowrap; font-size: 13.3333px; font-weight: 400; grid-area: auto; line-height: 16px; margin: 0px; overflow: visible; text-align: left; text-align-last: auto; white-space-collapse: preserve-breaks;">www.americanbeaconfunds.com/literature</span>
|
|
| Expenses [Text Block] |
What were the Fund costs for the last year?(based on a hypothetical $10,000 investment)
Class Name |
Costs of a $10,000 investment |
Costs paid as a percentage of a $10,000 investment |
R5 |
$137 |
1.05% | |
|
| Expenses Paid, Amount |
$ 137
|
|
| Expense Ratio, Percent |
1.05%
|
|
| Factors Affecting Performance [Text Block] |
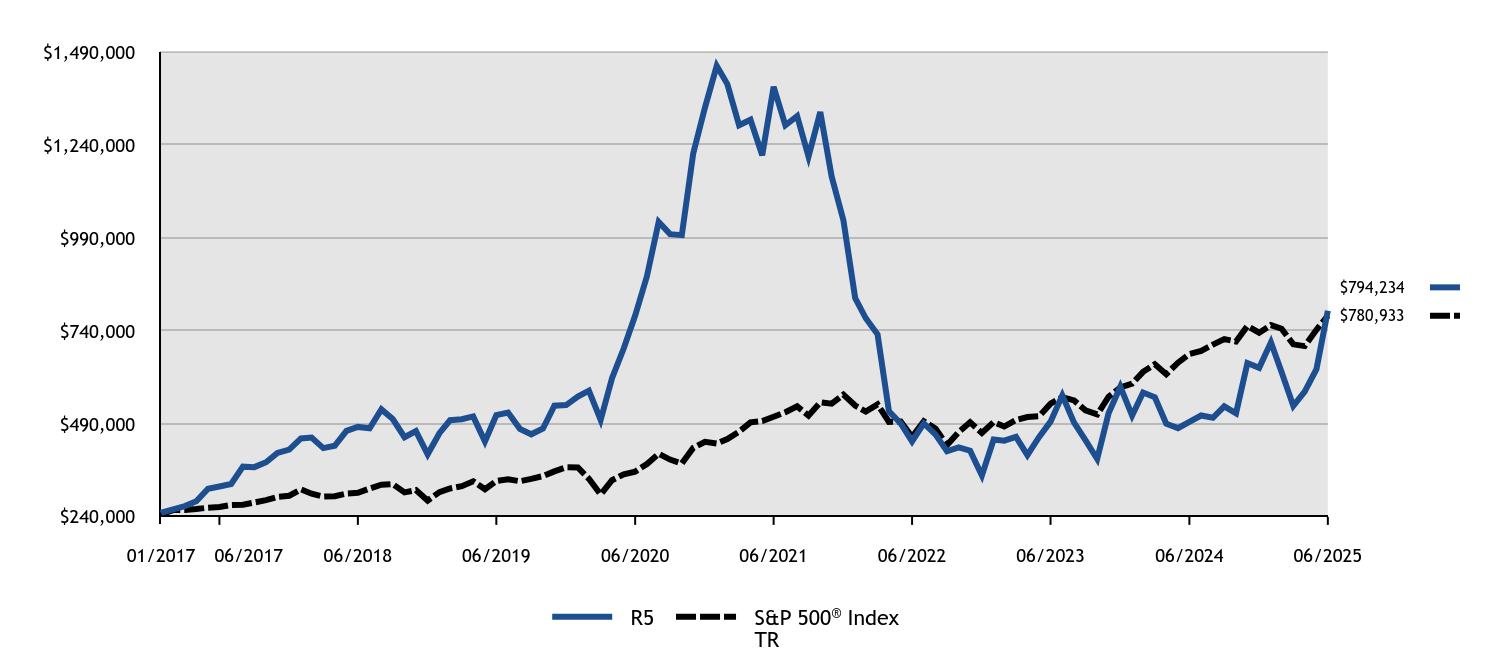
How did the Fund perform and what affected its performance? The R5 Class of the Fund returned 60.22% for the twelve months ended June 30, 2025, compared to the S&P 500 Index return of 15.16%. • The headwinds that once pressured disruptive technologies lessened due to broader market participation, favorable policy shifts around crypto, Artificial Intelligence, and healthcare, coupled with expectations for potential fiscal catalysts like tax cuts. • The Fund’s investments in software and capital markets companies materially helped performance for the period. Conversely, its investments in biotechnology and semiconductors and semiconductor equipment companies detracted from performance. |
|
| Performance Past Does Not Indicate Future [Text] |
Performance shown is historical and is not indicative of future returns.
|
|
| Line Graph [Table Text Block] |
|
R5 |
S&P 500® Index TR |
01/2017 |
$250,000 |
$250,000 |
01/2017 |
$252,000 |
$248,289 |
02/2017 |
$260,000 |
$258,148 |
03/2017 |
$269,000 |
$258,449 |
04/2017 |
$281,750 |
$261,103 |
05/2017 |
$315,500 |
$264,778 |
06/2017 |
$321,750 |
$266,431 |
07/2017 |
$328,500 |
$271,909 |
08/2017 |
$375,000 |
$272,742 |
09/2017 |
$373,750 |
$278,368 |
10/2017 |
$387,000 |
$284,863 |
11/2017 |
$412,000 |
$293,600 |
12/2017 |
$420,702 |
$296,864 |
01/2018 |
$451,011 |
$313,861 |
02/2018 |
$453,084 |
$302,293 |
03/2018 |
$424,847 |
$294,611 |
04/2018 |
$431,064 |
$295,741 |
05/2018 |
$471,476 |
$302,863 |
06/2018 |
$481,838 |
$304,727 |
07/2018 |
$478,212 |
$316,068 |
08/2018 |
$528,986 |
$326,367 |
09/2018 |
$503,081 |
$328,224 |
10/2018 |
$454,120 |
$305,790 |
11/2018 |
$470,699 |
$312,022 |
12/2018 |
$408,171 |
$283,849 |
01/2019 |
$465,061 |
$306,595 |
02/2019 |
$499,857 |
$316,440 |
03/2019 |
$502,619 |
$322,589 |
04/2019 |
$510,075 |
$335,650 |
05/2019 |
$442,967 |
$314,320 |
06/2019 |
$513,389 |
$336,472 |
07/2019 |
$520,570 |
$341,308 |
08/2019 |
$476,659 |
$335,902 |
09/2019 |
$462,023 |
$342,187 |
10/2019 |
$477,488 |
$349,598 |
11/2019 |
$538,796 |
$362,288 |
12/2019 |
$540,571 |
$373,223 |
01/2020 |
$563,380 |
$373,076 |
02/2020 |
$579,346 |
$342,365 |
03/2020 |
$500,655 |
$300,079 |
04/2020 |
$612,704 |
$338,547 |
05/2020 |
$693,390 |
$354,671 |
06/2020 |
$781,490 |
$361,725 |
07/2020 |
$886,696 |
$382,120 |
08/2020 |
$1,032,958 |
$409,588 |
09/2020 |
$1,000,170 |
$394,025 |
10/2020 |
$997,604 |
$383,546 |
11/2020 |
$1,216,854 |
$425,530 |
12/2020 |
$1,340,451 |
$441,891 |
01/2021 |
$1,452,728 |
$437,430 |
02/2021 |
$1,403,750 |
$449,492 |
03/2021 |
$1,292,905 |
$469,178 |
04/2021 |
$1,307,799 |
$494,217 |
05/2021 |
$1,212,421 |
$497,669 |
06/2021 |
$1,396,303 |
$509,287 |
07/2021 |
$1,292,905 |
$521,385 |
08/2021 |
$1,317,823 |
$537,238 |
09/2021 |
$1,208,697 |
$512,251 |
10/2021 |
$1,328,707 |
$548,141 |
11/2021 |
$1,154,850 |
$544,343 |
12/2021 |
$1,037,513 |
$568,738 |
01/2022 |
$828,361 |
$539,307 |
02/2022 |
$774,011 |
$523,160 |
03/2022 |
$730,907 |
$542,585 |
04/2022 |
$524,004 |
$495,270 |
05/2022 |
$491,394 |
$496,179 |
06/2022 |
$443,042 |
$455,222 |
07/2022 |
$491,394 |
$497,196 |
08/2022 |
$461,033 |
$476,919 |
09/2022 |
$416,429 |
$432,996 |
10/2022 |
$426,924 |
$468,052 |
11/2022 |
$417,929 |
$494,208 |
12/2022 |
$351,398 |
$465,735 |
01/2023 |
$448,166 |
$494,999 |
02/2023 |
$444,886 |
$482,921 |
03/2023 |
$455,137 |
$500,651 |
04/2023 |
$405,933 |
$508,466 |
05/2023 |
$455,137 |
$510,676 |
06/2023 |
$496,140 |
$544,419 |
07/2023 |
$566,666 |
$561,908 |
08/2023 |
$493,270 |
$552,962 |
09/2023 |
$446,116 |
$526,598 |
10/2023 |
$395,682 |
$515,525 |
11/2023 |
$518,692 |
$562,606 |
12/2023 |
$590,038 |
$588,165 |
01/2024 |
$512,541 |
$598,049 |
02/2024 |
$574,456 |
$629,982 |
03/2024 |
$561,745 |
$650,251 |
04/2024 |
$490,400 |
$623,692 |
05/2024 |
$478,509 |
$654,618 |
06/2024 |
$495,730 |
$678,107 |
07/2024 |
$512,541 |
$686,361 |
08/2024 |
$506,391 |
$703,010 |
09/2024 |
$537,143 |
$718,024 |
10/2024 |
$518,692 |
$711,513 |
11/2024 |
$653,593 |
$753,279 |
12/2024 |
$640,882 |
$735,322 |
01/2025 |
$709,357 |
$755,799 |
02/2025 |
$629,401 |
$745,938 |
03/2025 |
$538,373 |
$703,908 |
04/2025 |
$576,506 |
$699,135 |
05/2025 |
$637,191 |
$743,142 |
06/2025 |
$794,234 |
$780,933 |
|
|
| Average Annual Return [Table Text Block] |
HEADER |
1 Year |
5 Years |
Since Inception (1/27/17) |
Class R5Footnote Reference1 |
60.22% |
0.32% |
14.71% |
S&P 500® Index TR |
15.16% |
16.64% |
14.48% | |
|
| Performance Inception Date |
Jan. 27, 2017
|
|
| No Deduction of Taxes [Text Block] |
The graph and table do not reflect the deduction of taxes that a shareholder would pay on fund distributions or redemption of fund shares.
|
|
| AssetsNet |
$ 203,610,644
|
|
| Holdings Count | Holding |
42
|
|
| Advisory Fees Paid, Amount |
$ 1,502,796
|
|
| InvestmentCompanyPortfolioTurnover |
46.00%
|
|
| Additional Fund Statistics [Text Block] |
Total Net Assets |
$203,610,644 |
# of Portfolio Holdings |
42 |
Portfolio Turnover Rate |
46% |
Total Management Fees Paid |
$1,502,796 | |
|
| Holdings [Text Block] |
Asset Allocation - % Investments
Value |
Value |
Common Stocks |
85.2 |
Foreign Common Stocks |
10.7 |
Securities Lending Collateral |
2.1 |
Investment Companies |
2.0 | Sector Allocation - % Equities
Value |
Value |
Industrials |
5.5 |
Consumer Discretionary |
14.1 |
Financials |
16.0 |
Communication Services |
18.8 |
Health Care |
22.6 |
Information Technology |
23.0 | |
|
| Largest Holdings [Text Block] |
Top Ten Holdings - % Net Assets
Tesla, Inc. |
9.5 |
Coinbase Global, Inc., Class A |
8.0 |
Roku, Inc. |
7.4 |
ROBLOX Corp., Class A |
6.4 |
Robinhood Markets, Inc., Class A |
5.5 |
CRISPR Therapeutics AG |
5.1 |
Shopify, Inc., Class A |
4.8 |
Tempus AI, Inc. |
4.7 |
Circle Internet Group, Inc. |
4.5 |
Palantir Technologies, Inc., Class A |
4.1 | Excludes cash equivalents. |
|
| Material Fund Change [Text Block] |
|
|
| C000176826 |
|
|
| Shareholder Report [Line Items] |
|
|
| Fund Name |
ARK Transformational Innovation Fund
|
|
| Class Name |
Y
|
|
| Trading Symbol |
ADNYX
|
|
| Annual or Semi-Annual Statement [Text Block] |
This annual shareholder report contains important information about American Beacon ARK Transformational Innovation Fund for the period of July 1, 2024 to June 30, 2025.
|
|
| Shareholder Report Annual or Semi-Annual |
Annual Shareholder Report
|
|
| Additional Information [Text Block] |
You can find additional information about the Fund at www.americanbeaconfunds.com/literature. You can also request this information by contacting us at 800-658-5811.
|
|
| Additional Information Phone Number |
800-658-5811
|
|
| Additional Information Website |
<span style="box-sizing: border-box; color: rgb(0, 0, 0); display: inline; flex-wrap: nowrap; font-size: 13.3333px; font-weight: 400; grid-area: auto; line-height: 16px; margin: 0px; overflow: visible; text-align: left; text-align-last: auto; white-space-collapse: preserve-breaks;">www.americanbeaconfunds.com/literature</span>
|
|
| Expenses [Text Block] |
What were the Fund costs for the last year?(based on a hypothetical $10,000 investment)
Class Name |
Costs of a $10,000 investment |
Costs paid as a percentage of a $10,000 investment |
Y |
$148 |
1.14% | |
|
| Expenses Paid, Amount |
$ 148
|
|
| Expense Ratio, Percent |
1.14%
|
|
| Factors Affecting Performance [Text Block] |
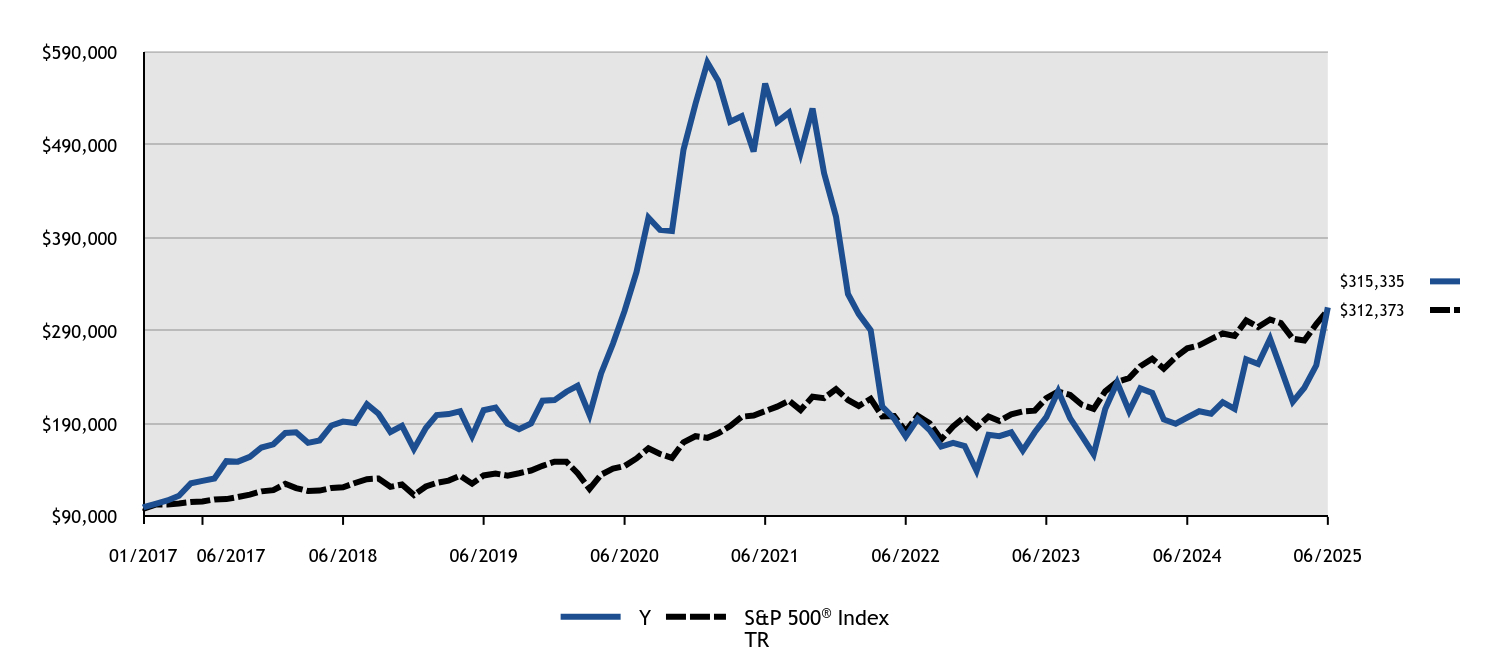
How did the Fund perform and what affected its performance? The Y Class of the Fund returned 60.17% for the twelve months ended June 30, 2025, compared to the S&P 500 Index return of 15.16%. • The headwinds that once pressured disruptive technologies lessened due to broader market participation, favorable policy shifts around crypto, Artificial Intelligence, and healthcare, coupled with expectations for potential fiscal catalysts like tax cuts. • The Fund’s investments in software and capital markets companies materially helped performance for the period. Conversely, its investments in biotechnology and semiconductors and semiconductor equipment companies detracted from performance. |
|
| Performance Past Does Not Indicate Future [Text] |
Performance shown is historical and is not indicative of future returns.
|
|
| Line Graph [Table Text Block] |
#ERROR:A result could not be returned because the conditional could not be evaluated to a True/False value (#ERROR:Invalid Formula (#!=""), 'Multiple values from an iterator cannot be used in a formula unless they are aggregrated.') |
Y |
S&P 500® Index TR |
01/2017 |
$100,000 |
$100,000 |
01/2017 |
$100,800 |
$99,316 |
02/2017 |
$104,000 |
$103,259 |
03/2017 |
$107,600 |
$103,380 |
04/2017 |
$112,700 |
$104,441 |
05/2017 |
$126,200 |
$105,911 |
06/2017 |
$128,700 |
$106,572 |
07/2017 |
$131,300 |
$108,764 |
08/2017 |
$149,900 |
$109,097 |
09/2017 |
$149,400 |
$111,347 |
10/2017 |
$154,600 |
$113,945 |
11/2017 |
$164,600 |
$117,440 |
12/2017 |
$168,081 |
$118,746 |
01/2018 |
$180,205 |
$125,544 |
02/2018 |
$181,034 |
$120,917 |
03/2018 |
$169,635 |
$117,844 |
04/2018 |
$172,226 |
$118,297 |
05/2018 |
$188,288 |
$121,145 |
06/2018 |
$192,433 |
$121,891 |
07/2018 |
$190,982 |
$126,427 |
08/2018 |
$211,189 |
$130,547 |
09/2018 |
$200,930 |
$131,290 |
10/2018 |
$181,345 |
$122,316 |
11/2018 |
$187,977 |
$124,809 |
12/2018 |
$162,965 |
$113,540 |
01/2019 |
$185,614 |
$122,638 |
02/2019 |
$199,535 |
$126,576 |
03/2019 |
$200,530 |
$129,035 |
04/2019 |
$203,513 |
$134,260 |
05/2019 |
$176,775 |
$125,728 |
06/2019 |
$204,728 |
$134,589 |
07/2019 |
$207,601 |
$136,523 |
08/2019 |
$190,254 |
$134,361 |
09/2019 |
$184,288 |
$136,875 |
10/2019 |
$190,475 |
$139,839 |
11/2019 |
$214,893 |
$144,915 |
12/2019 |
$215,602 |
$149,289 |
01/2020 |
$224,614 |
$149,231 |
02/2020 |
$231,002 |
$136,946 |
03/2020 |
$199,632 |
$120,031 |
04/2020 |
$244,235 |
$135,419 |
05/2020 |
$276,404 |
$141,868 |
06/2020 |
$311,539 |
$144,690 |
07/2020 |
$353,519 |
$152,848 |
08/2020 |
$411,697 |
$163,835 |
09/2020 |
$398,579 |
$157,610 |
10/2020 |
$397,552 |
$153,418 |
11/2020 |
$484,934 |
$170,212 |
12/2020 |
$534,140 |
$176,757 |
01/2021 |
$578,823 |
$174,972 |
02/2021 |
$559,231 |
$179,797 |
03/2021 |
$515,006 |
$187,671 |
04/2021 |
$520,964 |
$197,687 |
05/2021 |
$482,925 |
$199,068 |
06/2021 |
$556,023 |
$203,715 |
07/2021 |
$514,777 |
$208,554 |
08/2021 |
$524,745 |
$214,895 |
09/2021 |
$481,207 |
$204,901 |
10/2021 |
$529,098 |
$219,256 |
11/2021 |
$459,667 |
$217,737 |
12/2021 |
$412,982 |
$227,495 |
01/2022 |
$329,786 |
$215,723 |
02/2022 |
$308,050 |
$209,264 |
03/2022 |
$290,812 |
$217,034 |
04/2022 |
$208,665 |
$198,108 |
05/2022 |
$195,623 |
$198,472 |
06/2022 |
$176,286 |
$182,089 |
07/2022 |
$195,473 |
$198,878 |
08/2022 |
$183,331 |
$190,768 |
09/2022 |
$165,643 |
$173,198 |
10/2022 |
$169,690 |
$187,221 |
11/2022 |
$166,242 |
$197,683 |
12/2022 |
$139,620 |
$186,294 |
01/2023 |
$178,340 |
$197,999 |
02/2023 |
$176,863 |
$193,168 |
03/2023 |
$180,965 |
$200,260 |
04/2023 |
$161,441 |
$203,386 |
05/2023 |
$180,965 |
$204,270 |
06/2023 |
$197,207 |
$217,767 |
07/2023 |
$225,263 |
$224,763 |
08/2023 |
$195,895 |
$221,185 |
09/2023 |
$177,191 |
$210,639 |
10/2023 |
$157,339 |
$206,210 |
11/2023 |
$206,067 |
$225,042 |
12/2023 |
$234,450 |
$235,266 |
01/2024 |
$203,606 |
$239,220 |
02/2024 |
$228,216 |
$251,993 |
03/2024 |
$223,294 |
$260,101 |
04/2024 |
$194,746 |
$249,477 |
05/2024 |
$190,153 |
$261,847 |
06/2024 |
$196,879 |
$271,243 |
07/2024 |
$203,606 |
$274,544 |
08/2024 |
$200,981 |
$281,204 |
09/2024 |
$213,286 |
$287,210 |
10/2024 |
$206,067 |
$284,605 |
11/2024 |
$259,552 |
$301,312 |
12/2024 |
$254,466 |
$294,129 |
01/2025 |
$281,537 |
$302,320 |
02/2025 |
$249,708 |
$298,375 |
03/2025 |
$213,778 |
$281,563 |
04/2025 |
$228,872 |
$279,654 |
05/2025 |
$252,990 |
$297,257 |
06/2025 |
$315,335 |
$312,373 |
|
|
| Average Annual Return [Table Text Block] |
HEADER |
1 Year |
5 Years |
Since Inception (1/27/17) |
Class YFootnote Reference1 |
60.17% |
0.24% |
14.61% |
S&P 500® Index TR |
15.16% |
16.64% |
14.48% | |
|
| Performance Inception Date |
Jan. 27, 2017
|
|
| No Deduction of Taxes [Text Block] |
The graph and table do not reflect the deduction of taxes that a shareholder would pay on fund distributions or redemption of fund shares.
|
|
| AssetsNet |
$ 203,610,644
|
|
| Holdings Count | Holding |
42
|
|
| Advisory Fees Paid, Amount |
$ 1,502,796
|
|
| InvestmentCompanyPortfolioTurnover |
46.00%
|
|
| Additional Fund Statistics [Text Block] |
Total Net Assets |
$203,610,644 |
# of Portfolio Holdings |
42 |
Portfolio Turnover Rate |
46% |
Total Management Fees Paid |
$1,502,796 | |
|
| Holdings [Text Block] |
Asset Allocation - % Investments
Value |
Value |
Common Stocks |
85.2 |
Foreign Common Stocks |
10.7 |
Securities Lending Collateral |
2.1 |
Investment Companies |
2.0 | Sector Allocation - % Equities
Value |
Value |
Industrials |
5.5 |
Consumer Discretionary |
14.1 |
Financials |
16.0 |
Communication Services |
18.8 |
Health Care |
22.6 |
Information Technology |
23.0 | |
|
| Largest Holdings [Text Block] |
Top Ten Holdings - % Net Assets
Tesla, Inc. |
9.5 |
Coinbase Global, Inc., Class A |
8.0 |
Roku, Inc. |
7.4 |
ROBLOX Corp., Class A |
6.4 |
Robinhood Markets, Inc., Class A |
5.5 |
CRISPR Therapeutics AG |
5.1 |
Shopify, Inc., Class A |
4.8 |
Tempus AI, Inc. |
4.7 |
Circle Internet Group, Inc. |
4.5 |
Palantir Technologies, Inc., Class A |
4.1 | Excludes cash equivalents. |
|
| Material Fund Change [Text Block] |
|
|
| C000176825 |
|
|
| Shareholder Report [Line Items] |
|
|
| Fund Name |
ARK Transformational Innovation Fund
|
|
| Class Name |
Investor
|
|
| Trading Symbol |
ADNPX
|
|
| Annual or Semi-Annual Statement [Text Block] |
This annual shareholder report contains important information about American Beacon ARK Transformational Innovation Fund for the period of July 1, 2024 to June 30, 2025.
|
|
| Shareholder Report Annual or Semi-Annual |
Annual Shareholder Report
|
|
| Additional Information [Text Block] |
You can find additional information about the Fund at www.americanbeaconfunds.com/literature. You can also request this information by contacting us at 800-658-5811.
|
|
| Additional Information Phone Number |
800-658-5811
|
|
| Additional Information Website |
<span style="box-sizing: border-box; color: rgb(0, 0, 0); display: inline; flex-wrap: nowrap; font-size: 13.3333px; font-weight: 400; grid-area: auto; line-height: 16px; margin: 0px; overflow: visible; text-align: left; text-align-last: auto; white-space-collapse: preserve-breaks;">www.americanbeaconfunds.com/literature</span>
|
|
| Expenses [Text Block] |
What were the Fund costs for the last year?(based on a hypothetical $10,000 investment)
Class Name |
Costs of a $10,000 investment |
Costs paid as a percentage of a $10,000 investment |
Investor |
$179 |
1.38% | |
|
| Expenses Paid, Amount |
$ 179
|
|
| Expense Ratio, Percent |
1.38%
|
|
| Factors Affecting Performance [Text Block] |
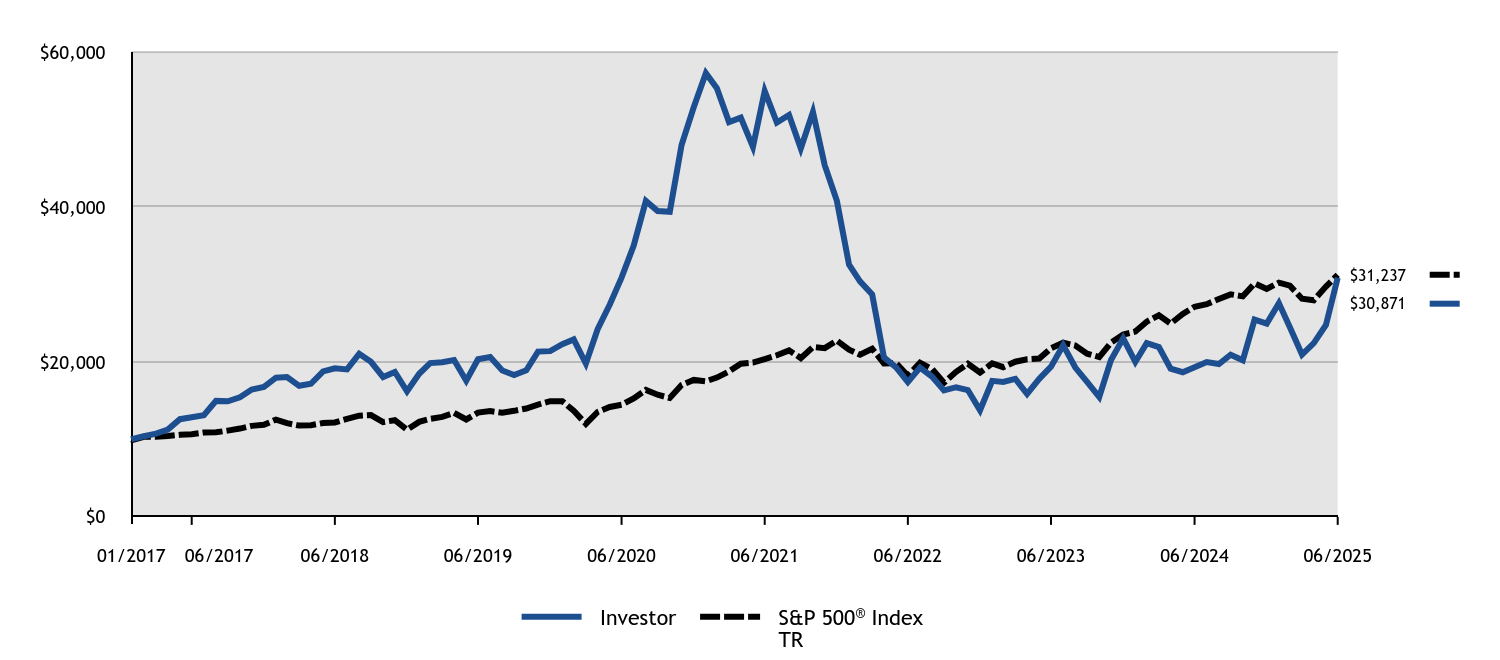
How did the Fund perform and what affected its performance? The Investor Class of the Fund returned 59.76% for the twelve months ended June 30, 2025, compared to the S&P 500 Index return of 15.16%. • The headwinds that once pressured disruptive technologies lessened due to broader market participation, favorable policy shifts around crypto, Artificial Intelligence, and healthcare, coupled with expectations for potential fiscal catalysts like tax cuts. • The Fund’s investments in software and capital markets companies materially helped performance for the period. Conversely, its investments in biotechnology and semiconductors and semiconductor equipment companies detracted from performance. |
|
| Performance Past Does Not Indicate Future [Text] |
Performance shown is historical and is not indicative of future returns.
|
|
| Line Graph [Table Text Block] |
|
Investor |
S&P 500® Index TR |
01/2017 |
$10,000 |
$10,000 |
01/2017 |
$10,080 |
$9,932 |
02/2017 |
$10,400 |
$10,326 |
03/2017 |
$10,750 |
$10,338 |
04/2017 |
$11,260 |
$10,444 |
05/2017 |
$12,610 |
$10,591 |
06/2017 |
$12,850 |
$10,657 |
07/2017 |
$13,120 |
$10,876 |
08/2017 |
$14,970 |
$10,910 |
09/2017 |
$14,920 |
$11,135 |
10/2017 |
$15,430 |
$11,395 |
11/2017 |
$16,430 |
$11,744 |
12/2017 |
$16,768 |
$11,875 |
01/2018 |
$17,970 |
$12,554 |
02/2018 |
$18,053 |
$12,092 |
03/2018 |
$16,913 |
$11,784 |
04/2018 |
$17,172 |
$11,830 |
05/2018 |
$18,768 |
$12,115 |
06/2018 |
$19,182 |
$12,189 |
07/2018 |
$19,037 |
$12,643 |
08/2018 |
$21,037 |
$13,055 |
09/2018 |
$20,011 |
$13,129 |
10/2018 |
$18,053 |
$12,232 |
11/2018 |
$18,706 |
$12,481 |
12/2018 |
$16,214 |
$11,257 |
01/2019 |
$18,469 |
$12,264 |
02/2019 |
$19,850 |
$12,658 |
03/2019 |
$19,950 |
$12,904 |
04/2019 |
$20,237 |
$13,426 |
05/2019 |
$17,573 |
$12,573 |
06/2019 |
$20,348 |
$13,459 |
07/2019 |
$20,635 |
$13,652 |
08/2019 |
$18,889 |
$13,436 |
09/2019 |
$18,303 |
$13,687 |
10/2019 |
$18,911 |
$13,984 |
11/2019 |
$21,331 |
$14,492 |
12/2019 |
$21,391 |
$14,929 |
01/2020 |
$22,293 |
$14,923 |
02/2020 |
$22,909 |
$13,695 |
03/2020 |
$19,793 |
$12,003 |
04/2020 |
$24,222 |
$13,542 |
05/2020 |
$27,407 |
$14,187 |
06/2020 |
$30,877 |
$14,469 |
07/2020 |
$35,020 |
$15,285 |
08/2020 |
$40,785 |
$16,384 |
09/2020 |
$39,472 |
$15,761 |
10/2020 |
$39,369 |
$15,342 |
11/2020 |
$47,999 |
$17,021 |
12/2020 |
$52,873 |
$17,676 |
01/2021 |
$57,272 |
$17,497 |
02/2021 |
$55,336 |
$17,980 |
03/2021 |
$50,948 |
$18,767 |
04/2021 |
$51,521 |
$19,769 |
05/2021 |
$47,751 |
$19,907 |
06/2021 |
$54,969 |
$20,371 |
07/2021 |
$50,891 |
$20,855 |
08/2021 |
$51,864 |
$21,490 |
09/2021 |
$47,545 |
$20,490 |
10/2021 |
$52,265 |
$21,926 |
11/2021 |
$45,403 |
$21,774 |
12/2021 |
$40,786 |
$22,750 |
01/2022 |
$32,554 |
$21,572 |
02/2022 |
$30,399 |
$20,926 |
03/2022 |
$28,708 |
$21,703 |
04/2022 |
$20,580 |
$19,811 |
05/2022 |
$19,293 |
$19,847 |
06/2022 |
$17,392 |
$18,209 |
07/2022 |
$19,263 |
$19,888 |
08/2022 |
$18,081 |
$19,077 |
09/2022 |
$16,329 |
$17,320 |
10/2022 |
$16,734 |
$18,722 |
11/2022 |
$16,374 |
$19,768 |
12/2022 |
$13,762 |
$18,629 |
01/2023 |
$17,552 |
$19,800 |
02/2023 |
$17,420 |
$19,317 |
03/2023 |
$17,814 |
$20,026 |
04/2023 |
$15,878 |
$20,339 |
05/2023 |
$17,814 |
$20,427 |
06/2023 |
$19,389 |
$21,777 |
07/2023 |
$22,161 |
$22,476 |
08/2023 |
$19,274 |
$22,118 |
09/2023 |
$17,420 |
$21,064 |
10/2023 |
$15,468 |
$20,621 |
11/2023 |
$20,258 |
$22,504 |
12/2023 |
$23,047 |
$23,527 |
01/2024 |
$19,996 |
$23,922 |
02/2024 |
$22,423 |
$25,199 |
03/2024 |
$21,915 |
$26,010 |
04/2024 |
$19,126 |
$24,948 |
05/2024 |
$18,667 |
$26,185 |
06/2024 |
$19,323 |
$27,124 |
07/2024 |
$19,979 |
$27,454 |
08/2024 |
$19,733 |
$28,120 |
09/2024 |
$20,931 |
$28,721 |
10/2024 |
$20,209 |
$28,461 |
11/2024 |
$25,458 |
$30,131 |
12/2024 |
$24,949 |
$29,413 |
01/2025 |
$27,590 |
$30,232 |
02/2025 |
$24,474 |
$29,838 |
03/2025 |
$20,947 |
$28,156 |
04/2025 |
$22,423 |
$27,965 |
05/2025 |
$24,769 |
$29,726 |
06/2025 |
$30,871 |
$31,237 |
|
|
| Average Annual Return [Table Text Block] |
HEADER |
1 Year |
5 Years |
Since Inception (1/27/17) |
Investor ClassFootnote Reference1 |
59.76% |
0.00% |
14.32% |
S&P 500® Index TR |
15.16% |
16.64% |
14.48% | |
|
| Performance Inception Date |
Jan. 27, 2017
|
|
| No Deduction of Taxes [Text Block] |
The graph and table do not reflect the deduction of taxes that a shareholder would pay on fund distributions or redemption of fund shares.
|
|
| AssetsNet |
$ 203,610,644
|
|
| Holdings Count | Holding |
42
|
|
| Advisory Fees Paid, Amount |
$ 1,502,796
|
|
| InvestmentCompanyPortfolioTurnover |
46.00%
|
|
| Additional Fund Statistics [Text Block] |
Total Net Assets |
$203,610,644 |
# of Portfolio Holdings |
42 |
Portfolio Turnover Rate |
46% |
Total Management Fees Paid |
$1,502,796 | |
|
| Holdings [Text Block] |
Asset Allocation - % Investments
Value |
Value |
Common Stocks |
85.2 |
Foreign Common Stocks |
10.7 |
Securities Lending Collateral |
2.1 |
Investment Companies |
2.0 | Sector Allocation - % Equities
Value |
Value |
Industrials |
5.5 |
Consumer Discretionary |
14.1 |
Financials |
16.0 |
Communication Services |
18.8 |
Health Care |
22.6 |
Information Technology |
23.0 | |
|
| Largest Holdings [Text Block] |
Top Ten Holdings - % Net Assets
Tesla, Inc. |
9.5 |
Coinbase Global, Inc., Class A |
8.0 |
Roku, Inc. |
7.4 |
ROBLOX Corp., Class A |
6.4 |
Robinhood Markets, Inc., Class A |
5.5 |
CRISPR Therapeutics AG |
5.1 |
Shopify, Inc., Class A |
4.8 |
Tempus AI, Inc. |
4.7 |
Circle Internet Group, Inc. |
4.5 |
Palantir Technologies, Inc., Class A |
4.1 | Excludes cash equivalents. |
|
| Material Fund Change [Text Block] |
|
|
| C000224371 |
|
|
| Shareholder Report [Line Items] |
|
|
| Fund Name |
ARK Transformational Innovation Fund
|
|
| Class Name |
R6
|
|
| Trading Symbol |
ADNRX
|
|
| Annual or Semi-Annual Statement [Text Block] |
This annual shareholder report contains important information about American Beacon ARK Transformational Innovation Fund for the period of July 1, 2024 to June 30, 2025.
|
|
| Shareholder Report Annual or Semi-Annual |
Annual Shareholder Report
|
|
| Additional Information [Text Block] |
You can find additional information about the Fund at www.americanbeaconfunds.com/literature. You can also request this information by contacting us at 800-658-5811.
|
|
| Additional Information Phone Number |
800-658-5811
|
|
| Additional Information Website |
<span style="box-sizing: border-box; color: rgb(0, 0, 0); display: inline; flex-wrap: nowrap; font-size: 13.3333px; font-weight: 400; grid-area: auto; line-height: 16px; margin: 0px; overflow: visible; text-align: left; text-align-last: auto; white-space-collapse: preserve-breaks;">www.americanbeaconfunds.com/literature</span>
|
|
| Expenses [Text Block] |
What were the Fund costs for the last year?(based on a hypothetical $10,000 investment)
Class Name |
Costs of a $10,000 investment |
Costs paid as a percentage of a $10,000 investment |
R6 |
$137 |
1.05% | |
|
| Expenses Paid, Amount |
$ 137
|
|
| Expense Ratio, Percent |
1.05%
|
|
| Factors Affecting Performance [Text Block] |
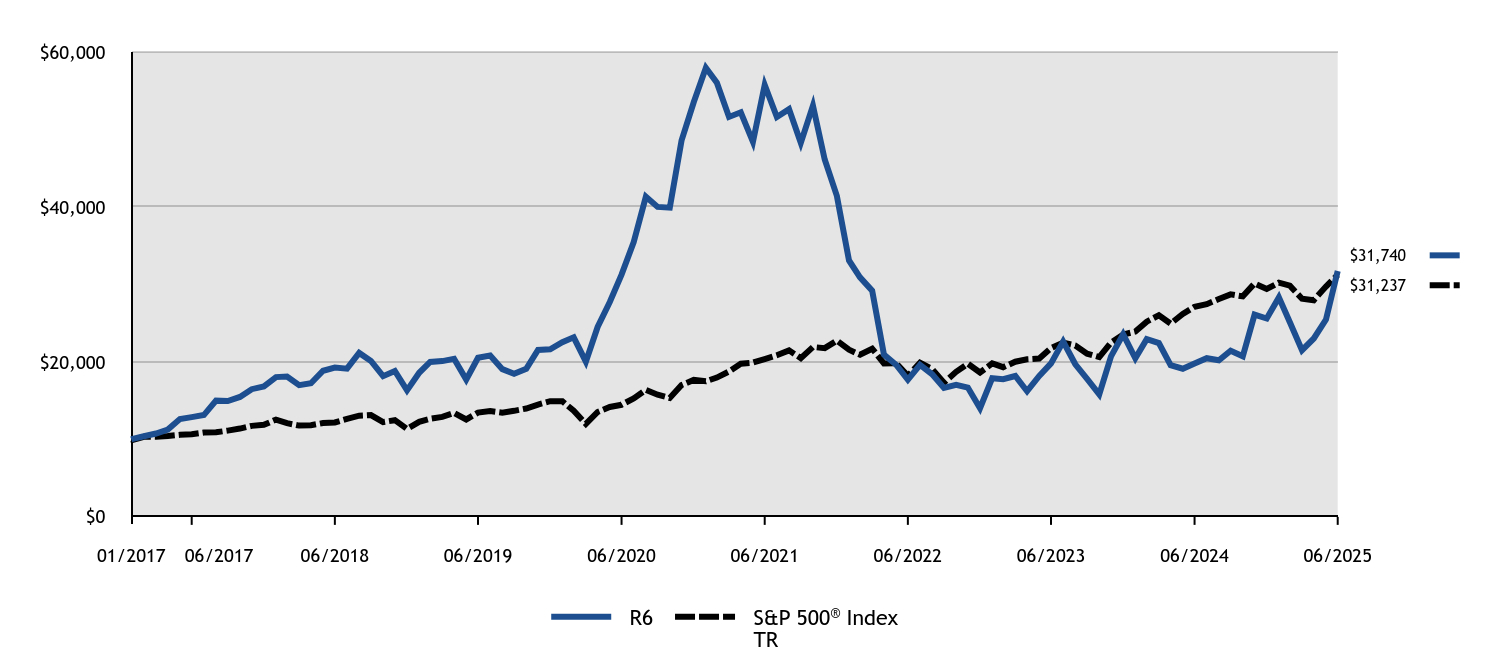
How did the Fund perform and what affected its performance? The R6 Class of the Fund returned 60.23% for the twelve months ended June 30, 2025, compared to the S&P 500 Index return of 15.16%. • The headwinds that once pressured disruptive technologies lessened due to broader market participation, favorable policy shifts around crypto, Artificial Intelligence, and healthcare, coupled with expectations for potential fiscal catalysts like tax cuts. • The Fund’s investments in software and capital markets companies materially helped performance for the period. Conversely, its investments in biotechnology and semiconductors and semiconductor equipment companies detracted from performance. |
|
| Performance Past Does Not Indicate Future [Text] |
Performance shown is historical and is not indicative of future returns.
|
|
| Line Graph [Table Text Block] |
|
R6 |
S&P 500® Index TR |
01/2017 |
$10,000 |
$10,000 |
01/2017 |
$10,080 |
$9,932 |
02/2017 |
$10,400 |
$10,326 |
03/2017 |
$10,760 |
$10,338 |
04/2017 |
$11,270 |
$10,444 |
05/2017 |
$12,620 |
$10,591 |
06/2017 |
$12,870 |
$10,657 |
07/2017 |
$13,140 |
$10,876 |
08/2017 |
$15,000 |
$10,910 |
09/2017 |
$14,950 |
$11,135 |
10/2017 |
$15,480 |
$11,395 |
11/2017 |
$16,480 |
$11,744 |
12/2017 |
$16,828 |
$11,875 |
01/2018 |
$18,040 |
$12,554 |
02/2018 |
$18,123 |
$12,092 |
03/2018 |
$16,994 |
$11,784 |
04/2018 |
$17,243 |
$11,830 |
05/2018 |
$18,859 |
$12,115 |
06/2018 |
$19,274 |
$12,189 |
07/2018 |
$19,128 |
$12,643 |
08/2018 |
$21,159 |
$13,055 |
09/2018 |
$20,123 |
$13,129 |
10/2018 |
$18,165 |
$12,232 |
11/2018 |
$18,828 |
$12,481 |
12/2018 |
$16,327 |
$11,354 |
01/2019 |
$18,602 |
$12,264 |
02/2019 |
$19,994 |
$12,658 |
03/2019 |
$20,105 |
$12,904 |
04/2019 |
$20,403 |
$13,426 |
05/2019 |
$17,719 |
$12,573 |
06/2019 |
$20,536 |
$13,459 |
07/2019 |
$20,823 |
$13,652 |
08/2019 |
$19,066 |
$13,436 |
09/2019 |
$18,481 |
$13,687 |
10/2019 |
$19,100 |
$13,984 |
11/2019 |
$21,552 |
$14,492 |
12/2019 |
$21,623 |
$14,929 |
01/2020 |
$22,535 |
$14,923 |
02/2020 |
$23,174 |
$13,695 |
03/2020 |
$20,026 |
$12,003 |
04/2020 |
$24,508 |
$13,542 |
05/2020 |
$27,736 |
$14,187 |
06/2020 |
$31,260 |
$14,469 |
07/2020 |
$35,468 |
$15,285 |
08/2020 |
$41,318 |
$16,384 |
09/2020 |
$40,007 |
$15,761 |
10/2020 |
$39,904 |
$15,342 |
11/2020 |
$48,583 |
$17,021 |
12/2020 |
$53,508 |
$17,676 |
01/2021 |
$57,965 |
$17,497 |
02/2021 |
$56,040 |
$17,980 |
03/2021 |
$51,618 |
$18,767 |
04/2021 |
$52,214 |
$19,769 |
05/2021 |
$48,411 |
$19,907 |
06/2021 |
$55,754 |
$20,371 |
07/2021 |
$51,618 |
$20,855 |
08/2021 |
$52,626 |
$21,490 |
09/2021 |
$48,273 |
$20,490 |
10/2021 |
$53,073 |
$21,926 |
11/2021 |
$46,120 |
$21,774 |
12/2021 |
$41,428 |
$22,750 |
01/2022 |
$33,089 |
$21,572 |
02/2022 |
$30,914 |
$20,926 |
03/2022 |
$29,189 |
$21,703 |
04/2022 |
$20,939 |
$19,811 |
05/2022 |
$19,634 |
$19,847 |
06/2022 |
$17,699 |
$18,209 |
07/2022 |
$19,619 |
$19,888 |
08/2022 |
$18,404 |
$19,077 |
09/2022 |
$16,634 |
$17,320 |
10/2022 |
$17,039 |
$18,722 |
11/2022 |
$16,694 |
$19,768 |
12/2022 |
$14,032 |
$18,629 |
01/2023 |
$17,905 |
$19,800 |
02/2023 |
$17,774 |
$19,317 |
03/2023 |
$18,184 |
$20,026 |
04/2023 |
$16,215 |
$20,339 |
05/2023 |
$18,184 |
$20,427 |
06/2023 |
$19,809 |
$21,777 |
07/2023 |
$22,632 |
$22,476 |
08/2023 |
$19,694 |
$22,118 |
09/2023 |
$17,807 |
$21,064 |
10/2023 |
$15,804 |
$20,621 |
11/2023 |
$20,711 |
$22,504 |
12/2023 |
$23,567 |
$23,527 |
01/2024 |
$20,465 |
$23,922 |
02/2024 |
$22,943 |
$25,199 |
03/2024 |
$22,435 |
$26,010 |
04/2024 |
$19,579 |
$24,948 |
05/2024 |
$19,120 |
$26,185 |
06/2024 |
$19,809 |
$27,124 |
07/2024 |
$20,482 |
$27,454 |
08/2024 |
$20,219 |
$28,120 |
09/2024 |
$21,450 |
$28,721 |
10/2024 |
$20,728 |
$28,461 |
11/2024 |
$26,111 |
$30,131 |
12/2024 |
$25,602 |
$29,413 |
01/2025 |
$28,326 |
$30,232 |
02/2025 |
$25,126 |
$29,838 |
03/2025 |
$21,516 |
$28,156 |
04/2025 |
$23,025 |
$27,965 |
05/2025 |
$25,454 |
$29,726 |
06/2025 |
$31,740 |
$31,237 |
|
|
| Average Annual Return [Table Text Block] |
HEADER |
1 Year |
5 Years |
Since Inception (1/27/17) |
R6 ClassFootnote Reference1 |
60.23% |
0.31% |
14.70% |
S&P 500® Index TR |
15.16% |
16.64% |
14.48% | |
|
| Performance Inception Date |
Jan. 27, 2017
|
|
| No Deduction of Taxes [Text Block] |
The graph and table do not reflect the deduction of taxes that a shareholder would pay on fund distributions or redemption of fund shares.
|
|
| AssetsNet |
$ 203,610,644
|
|
| Holdings Count | Holding |
42
|
|
| Advisory Fees Paid, Amount |
$ 1,502,796
|
|
| InvestmentCompanyPortfolioTurnover |
46.00%
|
|
| Additional Fund Statistics [Text Block] |
Total Net Assets |
$203,610,644 |
# of Portfolio Holdings |
42 |
Portfolio Turnover Rate |
46% |
Total Management Fees Paid |
$1,502,796 | |
|
| Holdings [Text Block] |
Asset Allocation - % Investments
Value |
Value |
Common Stocks |
85.2 |
Foreign Common Stocks |
10.7 |
Securities Lending Collateral |
2.1 |
Investment Companies |
2.0 | Sector Allocation - % Equities
Value |
Value |
Industrials |
5.5 |
Consumer Discretionary |
14.1 |
Financials |
16.0 |
Communication Services |
18.8 |
Health Care |
22.6 |
Information Technology |
23.0 | |
|
| Largest Holdings [Text Block] |
Top Ten Holdings - % Net Assets
Tesla, Inc. |
9.5 |
Coinbase Global, Inc., Class A |
8.0 |
Roku, Inc. |
7.4 |
ROBLOX Corp., Class A |
6.4 |
Robinhood Markets, Inc., Class A |
5.5 |
CRISPR Therapeutics AG |
5.1 |
Shopify, Inc., Class A |
4.8 |
Tempus AI, Inc. |
4.7 |
Circle Internet Group, Inc. |
4.5 |
Palantir Technologies, Inc., Class A |
4.1 | Excludes cash equivalents. |
|
| Material Fund Change [Text Block] |
|
|
| C000205755 |
|
|
| Shareholder Report [Line Items] |
|
|
| Fund Name |
TwentyFour Strategic Income Fund
|
|
| Class Name |
A
|
|
| Trading Symbol |
TFSAX
|
|
| Annual or Semi-Annual Statement [Text Block] |
This annual shareholder report contains important information about American Beacon TwentyFour Strategic Income Fund for the period of July 1, 2024 to June 30, 2025.
|
|
| Shareholder Report Annual or Semi-Annual |
Annual Shareholder Report
|
|
| Additional Information [Text Block] |
You can find additional information about the Fund at www.americanbeaconfunds.com/literature. You can also request this information by contacting us at 800-658-5811.
|
|
| Material Fund Change Notice [Text Block] |
This report describes material changes to the Fund that occurred during the reporting period.
|
|
| Additional Information Phone Number |
800-658-5811
|
|
| Additional Information Website |
<span style="box-sizing: border-box; color: rgb(0, 0, 0); display: inline; flex-wrap: nowrap; font-size: 13.3333px; font-weight: 400; grid-area: auto; line-height: 16px; margin: 0px; overflow: visible; text-align: left; text-align-last: auto; white-space-collapse: preserve-breaks;">www.americanbeaconfunds.com/literature</span>
|
|
| Expenses [Text Block] |
What were the Fund costs for the last year?(based on a hypothetical $10,000 investment)
Class Name |
Costs of a $10,000 investment |
Costs paid as a percentage of a $10,000 investment |
Class A |
$104 |
1.00% | |
|
| Expenses Paid, Amount |
$ 104
|
|
| Expense Ratio, Percent |
1.00%
|
|
| Factors Affecting Performance [Text Block] |
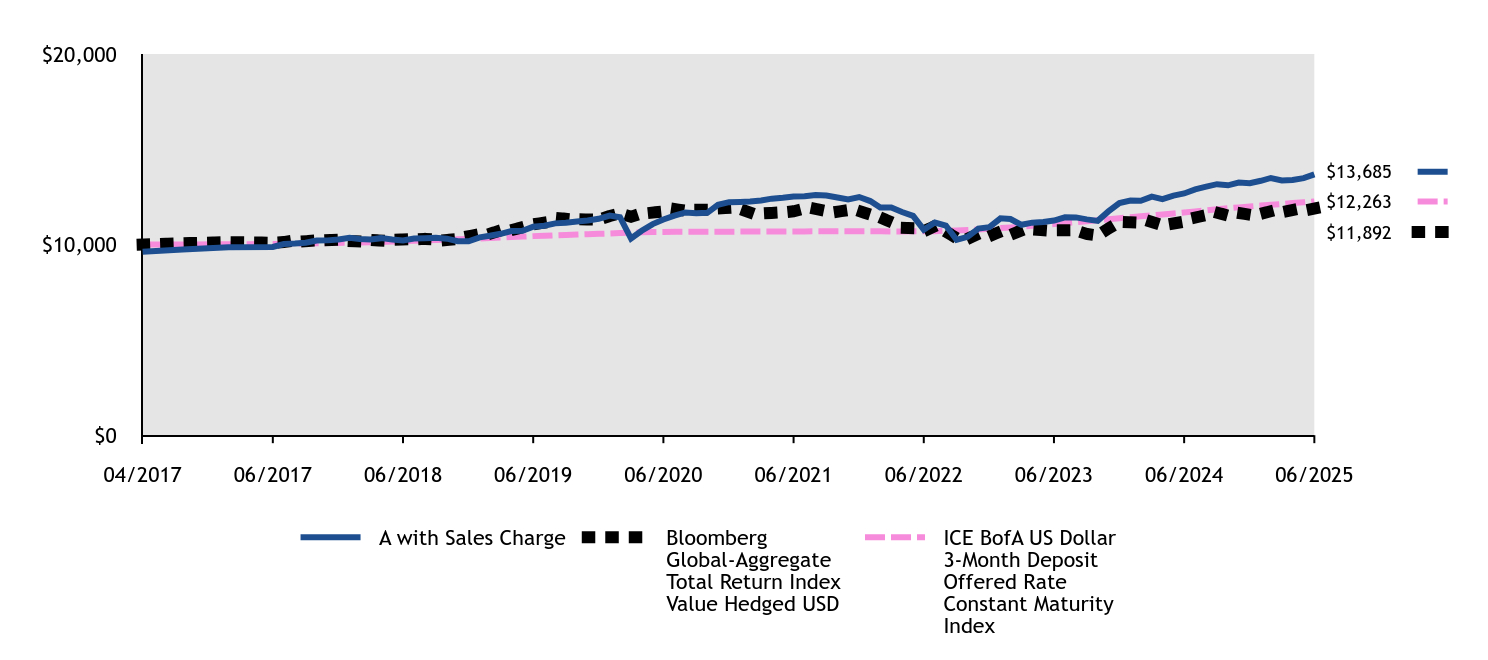
How did the Fund perform and what affected its performance? The A Class of the Fund returned 3.82% (with sales charges) and 7.90% (without sales charges) for the twelve months ended June 30, 2025, compared to the Bloomberg Global-Aggregate Total Return Index Value Hedged USD return of 6.15%. • The Fund’s lower-duration investments benefited during the period as interest rates rose at the longer end of the yield curve. • The Fund held a variety of exposures across credit sectors that the sub-advisor deemed to offer attractive yield, and most sectors contributed positively to total returns given strong credit markets. • Additional Tier-1 bonds issued by European banks generated the largest contribution to the Fund’s return, followed by European Collateralized Loan Obligations, which generated the next highest contribution to return. |
|
| Performance Past Does Not Indicate Future [Text] |
Performance shown is historical and is not indicative of future returns.
|
|
| Line Graph [Table Text Block] |
|
A with Sales Charge |
Bloomberg Global-Aggregate Total Return Index Value Hedged USD |
ICE BofA US Dollar 3-Month Deposit Offered Rate Constant Maturity Index |
04/2017 |
$9,625 |
$10,000 |
$10,000 |
04/2017 |
$9,740 |
$10,068 |
$10,008 |
05/2017 |
$9,866 |
$10,127 |
$10,017 |
06/2017 |
$9,873 |
$10,098 |
$10,026 |
07/2017 |
$10,030 |
$10,131 |
$10,037 |
08/2017 |
$10,056 |
$10,224 |
$10,048 |
09/2017 |
$10,100 |
$10,177 |
$10,058 |
10/2017 |
$10,216 |
$10,219 |
$10,069 |
11/2017 |
$10,221 |
$10,235 |
$10,079 |
12/2017 |
$10,269 |
$10,258 |
$10,087 |
01/2018 |
$10,358 |
$10,185 |
$10,100 |
02/2018 |
$10,296 |
$10,162 |
$10,109 |
03/2018 |
$10,272 |
$10,246 |
$10,120 |
04/2018 |
$10,338 |
$10,208 |
$10,139 |
05/2018 |
$10,266 |
$10,246 |
$10,160 |
06/2018 |
$10,217 |
$10,265 |
$10,179 |
07/2018 |
$10,320 |
$10,268 |
$10,199 |
08/2018 |
$10,335 |
$10,300 |
$10,220 |
09/2018 |
$10,361 |
$10,260 |
$10,239 |
10/2018 |
$10,312 |
$10,240 |
$10,256 |
11/2018 |
$10,181 |
$10,290 |
$10,274 |
12/2018 |
$10,171 |
$10,439 |
$10,296 |
01/2019 |
$10,382 |
$10,550 |
$10,323 |
02/2019 |
$10,461 |
$10,562 |
$10,347 |
03/2019 |
$10,565 |
$10,751 |
$10,371 |
04/2019 |
$10,710 |
$10,758 |
$10,394 |
05/2019 |
$10,721 |
$10,913 |
$10,418 |
06/2019 |
$10,938 |
$11,066 |
$10,444 |
07/2019 |
$10,992 |
$11,153 |
$10,465 |
08/2019 |
$11,113 |
$11,406 |
$10,488 |
09/2019 |
$11,143 |
$11,353 |
$10,508 |
10/2019 |
$11,208 |
$11,333 |
$10,531 |
11/2019 |
$11,262 |
$11,320 |
$10,547 |
12/2019 |
$11,351 |
$11,297 |
$10,564 |
01/2020 |
$11,526 |
$11,501 |
$10,585 |
02/2020 |
$11,435 |
$11,641 |
$10,607 |
03/2020 |
$10,318 |
$11,460 |
$10,617 |
04/2020 |
$10,724 |
$11,646 |
$10,651 |
05/2020 |
$11,075 |
$11,679 |
$10,660 |
06/2020 |
$11,314 |
$11,737 |
$10,664 |
07/2020 |
$11,519 |
$11,865 |
$10,668 |
08/2020 |
$11,687 |
$11,779 |
$10,671 |
09/2020 |
$11,639 |
$11,822 |
$10,673 |
10/2020 |
$11,669 |
$11,823 |
$10,675 |
11/2020 |
$12,089 |
$11,891 |
$10,677 |
12/2020 |
$12,225 |
$11,927 |
$10,679 |
01/2021 |
$12,237 |
$11,863 |
$10,681 |
02/2021 |
$12,259 |
$11,679 |
$10,684 |
03/2021 |
$12,310 |
$11,633 |
$10,685 |
04/2021 |
$12,411 |
$11,663 |
$10,687 |
05/2021 |
$12,457 |
$11,689 |
$10,690 |
06/2021 |
$12,528 |
$11,746 |
$10,691 |
07/2021 |
$12,532 |
$11,892 |
$10,693 |
08/2021 |
$12,606 |
$11,868 |
$10,694 |
09/2021 |
$12,572 |
$11,756 |
$10,694 |
10/2021 |
$12,467 |
$11,725 |
$10,696 |
11/2021 |
$12,364 |
$11,809 |
$10,696 |
12/2021 |
$12,495 |
$11,761 |
$10,697 |
01/2022 |
$12,284 |
$11,576 |
$10,697 |
02/2022 |
$11,947 |
$11,422 |
$10,695 |
03/2022 |
$11,947 |
$11,176 |
$10,691 |
04/2022 |
$11,712 |
$10,876 |
$10,690 |
05/2022 |
$11,505 |
$10,861 |
$10,697 |
06/2022 |
$10,782 |
$10,696 |
$10,696 |
07/2022 |
$11,157 |
$10,968 |
$10,705 |
08/2022 |
$10,998 |
$10,682 |
$10,726 |
09/2022 |
$10,249 |
$10,339 |
$10,739 |
10/2022 |
$10,409 |
$10,304 |
$10,765 |
11/2022 |
$10,837 |
$10,566 |
$10,790 |
12/2022 |
$10,916 |
$10,442 |
$10,826 |
01/2023 |
$11,377 |
$10,682 |
$10,868 |
02/2023 |
$11,343 |
$10,512 |
$10,902 |
03/2023 |
$11,038 |
$10,745 |
$10,947 |
04/2023 |
$11,151 |
$10,800 |
$10,984 |
05/2023 |
$11,189 |
$10,758 |
$11,030 |
06/2023 |
$11,260 |
$10,751 |
$11,079 |
07/2023 |
$11,430 |
$10,755 |
$11,126 |
08/2023 |
$11,427 |
$10,741 |
$11,176 |
09/2023 |
$11,324 |
$10,556 |
$11,224 |
10/2023 |
$11,245 |
$10,481 |
$11,277 |
11/2023 |
$11,740 |
$10,841 |
$11,328 |
12/2023 |
$12,180 |
$11,188 |
$11,381 |
01/2024 |
$12,313 |
$11,166 |
$11,434 |
02/2024 |
$12,300 |
$11,089 |
$11,481 |
03/2024 |
$12,516 |
$11,189 |
$11,534 |
04/2024 |
$12,389 |
$11,009 |
$11,584 |
05/2024 |
$12,572 |
$11,107 |
$11,636 |
06/2024 |
$12,683 |
$11,203 |
$11,688 |
07/2024 |
$12,896 |
$11,419 |
$11,742 |
08/2024 |
$13,037 |
$11,544 |
$11,799 |
09/2024 |
$13,170 |
$11,678 |
$11,859 |
10/2024 |
$13,111 |
$11,520 |
$11,907 |
11/2024 |
$13,256 |
$11,657 |
$11,953 |
12/2024 |
$13,224 |
$11,568 |
$12,004 |
01/2025 |
$13,348 |
$11,613 |
$12,048 |
02/2025 |
$13,495 |
$11,752 |
$12,087 |
03/2025 |
$13,368 |
$11,703 |
$12,133 |
04/2025 |
$13,385 |
$11,819 |
$12,176 |
05/2025 |
$13,486 |
$11,780 |
$12,218 |
06/2025 |
$13,685 |
$11,892 |
$12,263 |
|
|
| Average Annual Return [Table Text Block] |
HEADER |
1 Year |
5 Years |
Since Inception (4/3/17) |
Class A without Sales ChargeFootnote Reference1 |
7.90% |
3.88% |
4.36% |
Class A with Maximum Sales Charge - 3.75%Footnote Reference1 |
3.82% |
3.08% |
3.88% |
Bloomberg Global-Aggregate Total Return Index Value Hedged USD |
6.15% |
0.26% |
2.12% |
ICE BofA US Dollar 3-Month Deposit Offered Rate Constant Maturity Index |
4.92% |
2.83% |
2.51% | |
|
| Performance Inception Date |
Apr. 03, 2017
|
|
| No Deduction of Taxes [Text Block] |
The graph and table do not reflect the deduction of taxes that a shareholder would pay on fund distributions or redemption of fund shares.
|
|
| Performance Table Market Index Changed [Text Block] |
The Bloomberg Global-Aggregate Total Return Index Value Hedged USD has replaced the ICE BofA US Dollar 3-Month Deposit Offered Rate Constant Maturity Index as broad-based securities market index to comply with a new regulatory requirement.
|
|
| Material Change Date |
|
Jun. 30, 2024
|
| AssetsNet |
$ 481,131,572
|
|
| Holdings Count | Holding |
298
|
|
| Advisory Fees Paid, Amount |
$ 1,993,331
|
|
| InvestmentCompanyPortfolioTurnover |
74.00%
|
|
| Additional Fund Statistics [Text Block] |
Total Net Assets |
$481,131,572 |
# of Portfolio Holdings |
298 |
Portfolio Turnover Rate |
74% |
Total Management Fees Paid |
$1,993,331 | |
|
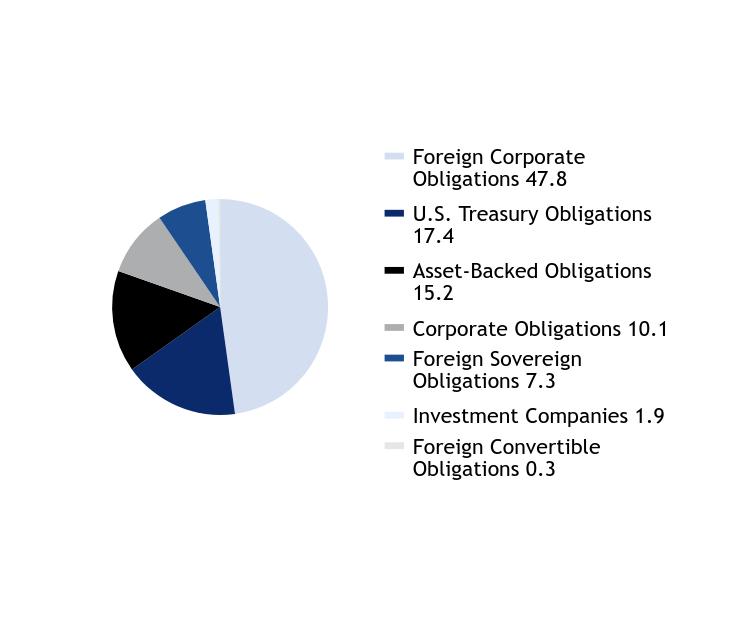
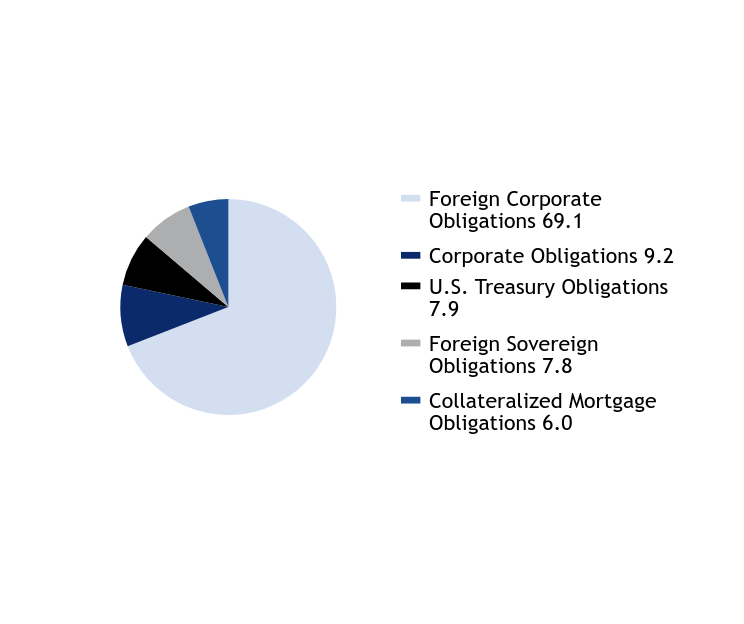
| Holdings [Text Block] |
Asset Allocation - % Investments
Value |
Value |
Foreign Corporate Obligations |
47.8 |
U.S. Treasury Obligations |
17.4 |
Asset-Backed Obligations |
15.2 |
Corporate Obligations |
10.1 |
Foreign Sovereign Obligations |
7.3 |
Investment Companies |
1.9 |
Foreign Convertible Obligations |
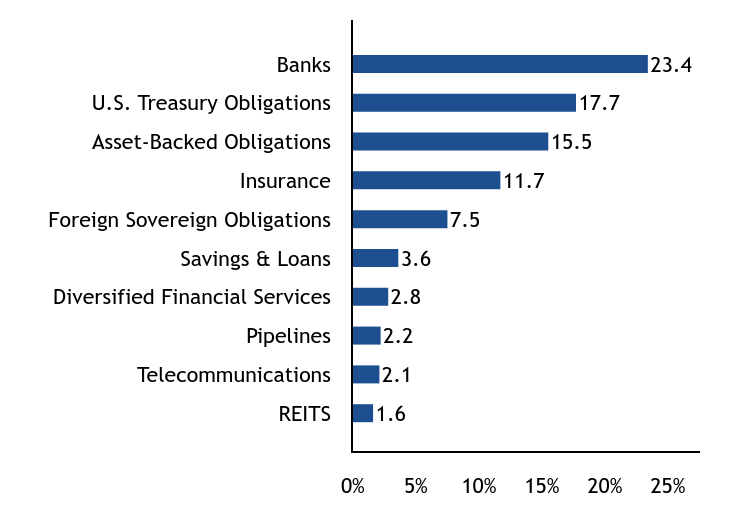
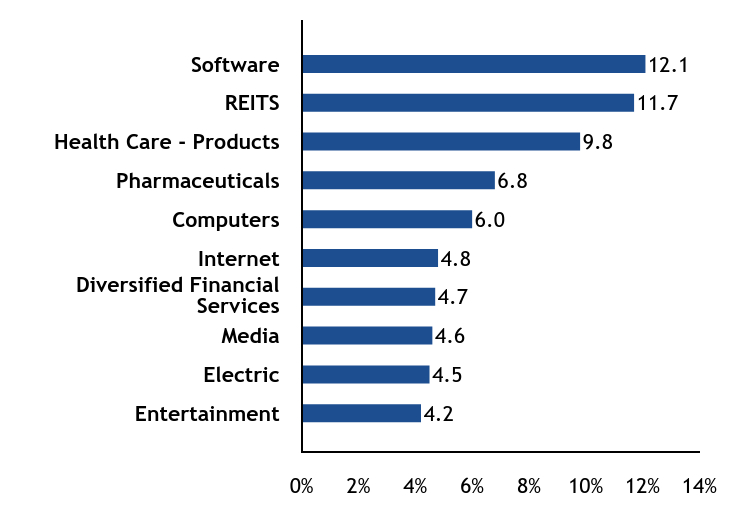
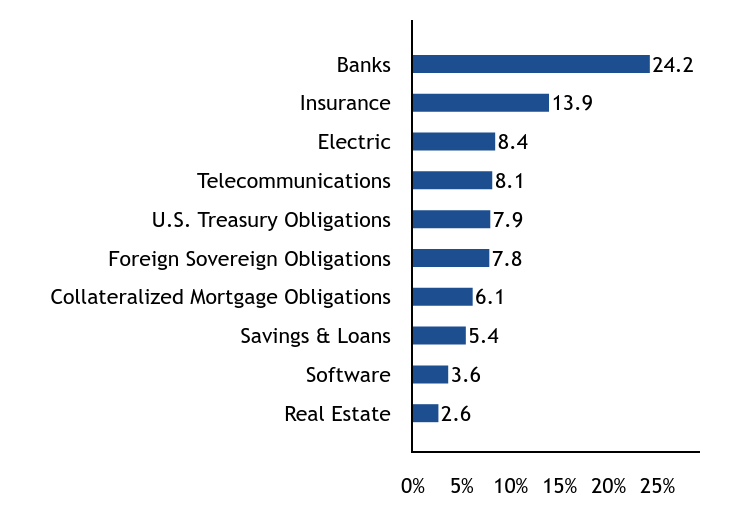
0.3 | Top Ten Industry Allocations - % Investments
Value |
Value |
REITS |
1.6 |
Telecommunications |
2.1 |
Pipelines |
2.2 |
Diversified Financial Services |
2.8 |
Savings & Loans |
3.6 |
Foreign Sovereign Obligations |
7.5 |
Insurance |
11.7 |
Asset-Backed Obligations |
15.5 |
U.S. Treasury Obligations |
17.7 |
Banks |
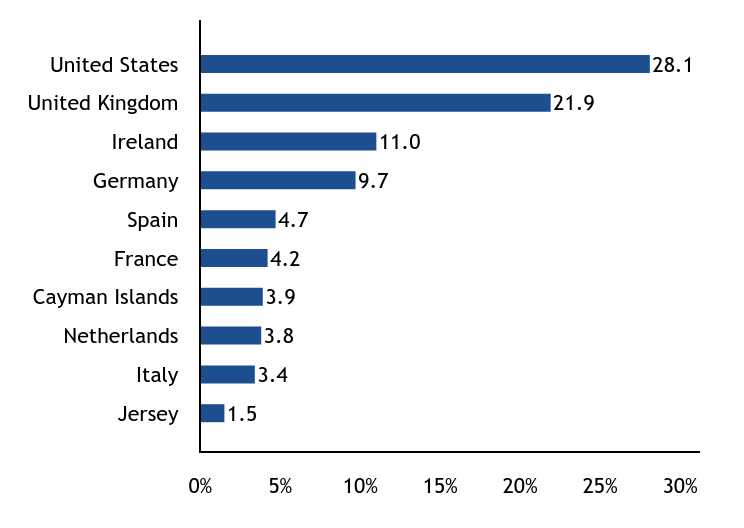
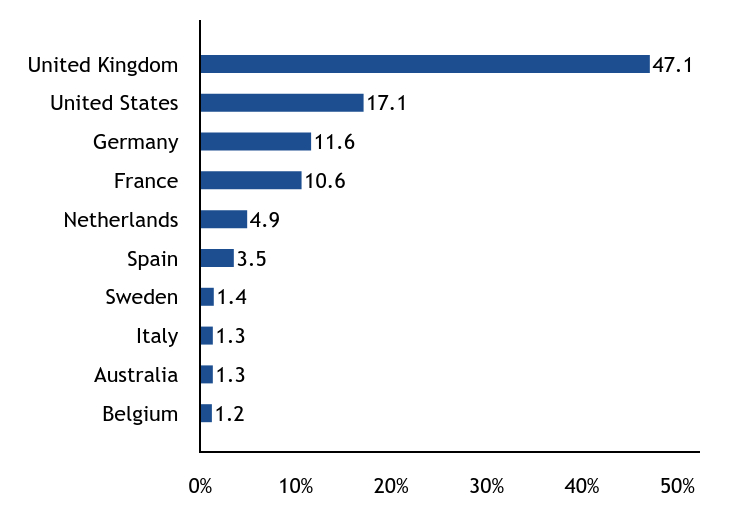
23.4 | Top Ten Country Exposure - % Investments
Value |
Value |
Jersey |
1.5 |
Italy |
3.4 |
Netherlands |
3.8 |
Cayman Islands |
3.9 |
France |
4.2 |
Spain |
4.7 |
Germany |
9.7 |
Ireland |
11.0 |
United Kingdom |
21.9 |
United States |
28.1 | Exludes currency forwards |
|
| Largest Holdings [Text Block] |
Top Ten Holdings - % Net Assets
Bundesrepublik Deutschland Bundesanleihe, 2.600%, Due 8/15/2034 |
5.0 |
U.S. Treasury Notes, 4.625%, Due 2/15/2035 |
4.7 |
U.S. Treasury Bonds, 4.500%, Due 11/15/2054 |
3.3 |
U.S. Treasury Notes, 4.250%, Due 11/15/2034 |
2.7 |
U.S. Treasury Bonds, 4.625%, Due 2/15/2055 |
2.5 |
U.S. Treasury Bills, 4.351%, Due 9/4/2025 |
2.4 |
Bundesrepublik Deutschland Bundesanleihe, 2.500%, Due 2/15/2035 |
2.3 |
U.S. Treasury Bills, 4.305%, Due 8/26/2025 |
1.9 |
Rothesay Life PLC, 5.000%, Due 10/13/2031 |
1.3 |
Nationwide Building Society, 7.500%, Due 12/20/2030 |
1.2 | Excludes cash equivalents and derivatives. |
|
| Material Fund Change [Text Block] |
This is a summary of certain changes to the Fund since June 30, 2024. For more complete information, you may review the Fund's next prospectus, which we expect to be available by November 1, 2025 at www.americanbeaconfunds.com/literature or upon request at 800-658-5811. Prior to July 1, 2024, the American Beacon TwentyFour Strategic Income Fund (the “Fund”) assessed a front-end sales load on purchases of A Class shares less than $1 million, and a contingent deferred sales charge (“CDSC”) of 0.50% on certain purchases of $1 million or more of A Class shares that are redeemed in whole or in part within 18 months of purchase. Beginning July 1, 2024, the Fund will no longer assess a front-end sales load on purchases of A Class shares of $500,000 or more but will assess a CDSC of 1.00% on certain purchases of $500,000 or more of A Class shares that are redeemed in whole or in part within 18 months of purchase. |
|
| Material Fund Change Expenses [Text Block] |
Prior to July 1, 2024, the American Beacon TwentyFour Strategic Income Fund (the “Fund”) assessed a front-end sales load on purchases of A Class shares less than $1 million, and a contingent deferred sales charge (“CDSC”) of 0.50% on certain purchases of $1 million or more of A Class shares that are redeemed in whole or in part within 18 months of purchase. Beginning July 1, 2024, the Fund will no longer assess a front-end sales load on purchases of A Class shares of $500,000 or more but will assess a CDSC of 1.00% on certain purchases of $500,000 or more of A Class shares that are redeemed in whole or in part within 18 months of purchase.
|
|
| Summary of Change Legend [Text Block] |
This is a summary of certain changes to the Fund since June 30, 2024. For more complete information, you may review the Fund's next prospectus, which we expect to be available by November 1, 2025 at www.americanbeaconfunds.com/literature or upon request at 800-658-5811.
|
This is a summary of certain changes to the Fund since June 30, 2024.
|
| C000205756 |
|
|
| Shareholder Report [Line Items] |
|
|
| Fund Name |
TwentyFour Strategic Income Fund
|
|
| Class Name |
C
|
|
| Trading Symbol |
TFGCX
|
|
| Annual or Semi-Annual Statement [Text Block] |
This annual shareholder report contains important information about American Beacon TwentyFour Strategic Income Fund for the period of July 1, 2024 to June 30, 2025.
|
|
| Shareholder Report Annual or Semi-Annual |
Annual Shareholder Report
|
|
| Additional Information [Text Block] |
You can find additional information about the Fund at www.americanbeaconfunds.com/literature. You can also request this information by contacting us at 800-658-5811.
|
|
| Additional Information Phone Number |
800-658-5811
|
|
| Additional Information Website |
<span style="box-sizing: border-box; color: rgb(0, 0, 0); display: inline; flex-wrap: nowrap; font-size: 13.3333px; font-weight: 400; grid-area: auto; line-height: 16px; margin: 0px; overflow: visible; text-align: left; text-align-last: auto; white-space-collapse: preserve-breaks;">www.americanbeaconfunds.com/literature</span>
|
|
| Expenses [Text Block] |
What were the Fund costs for the last year?(based on a hypothetical $10,000 investment)
Class Name |
Costs of a $10,000 investment |
Costs paid as a percentage of a $10,000 investment |
Class C |
$185 |
1.79% | |
|
| Expenses Paid, Amount |
$ 185
|
|
| Expense Ratio, Percent |
1.79%
|
|
| Factors Affecting Performance [Text Block] |
How did the Fund perform and what affected its performance? The C Class of the Fund returned 5.99% (with sales charges) and 6.99% (without sales charges) for the twelve months ended June 30, 2025, compared to the Bloomberg Global-Aggregate Total Return Index Value Hedged USD return of 6.15%. • The Fund’s lower-duration investments benefited during the period as interest rates rose at the longer end of the yield curve. • The Fund held a variety of exposures across credit sectors that the sub-advisor deemed to offer attractive yield, and most sectors contributed positively to total returns given strong credit markets. • Additional Tier-1 bonds issued by European banks generated the largest contribution to the Fund’s return, followed by European Collateralized Loan Obligations, which generated the next highest contribution to return. |
|
| Performance Past Does Not Indicate Future [Text] |
Performance shown is historical and is not indicative of future returns.
|
|
| Line Graph [Table Text Block] |
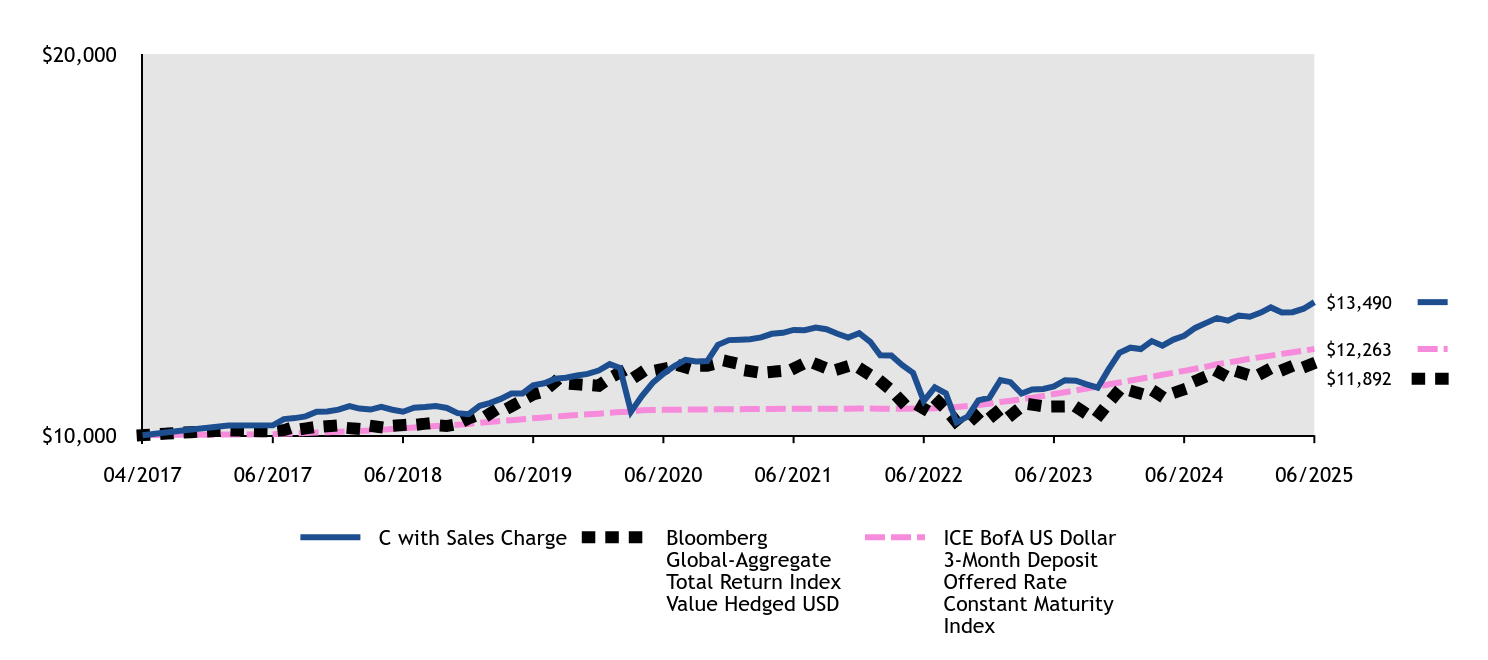
|
C with Sales Charge |
Bloomberg Global-Aggregate Total Return Index Value Hedged USD |
ICE BofA US Dollar 3-Month Deposit Offered Rate Constant Maturity Index |
04/2017 |
$10,000 |
$10,000 |
$10,000 |
04/2017 |
$10,120 |
$10,068 |
$10,008 |
05/2017 |
$10,251 |
$10,127 |
$10,017 |
06/2017 |
$10,258 |
$10,098 |
$10,026 |
07/2017 |
$10,421 |
$10,131 |
$10,037 |
08/2017 |
$10,448 |
$10,224 |
$10,048 |
09/2017 |
$10,494 |
$10,177 |
$10,058 |
10/2017 |
$10,615 |
$10,219 |
$10,069 |
11/2017 |
$10,620 |
$10,235 |
$10,079 |
12/2017 |
$10,669 |
$10,258 |
$10,087 |
01/2018 |
$10,762 |
$10,185 |
$10,100 |
02/2018 |
$10,697 |
$10,162 |
$10,109 |
03/2018 |
$10,672 |
$10,246 |
$10,120 |
04/2018 |
$10,741 |
$10,208 |
$10,139 |
05/2018 |
$10,667 |
$10,246 |
$10,160 |
06/2018 |
$10,616 |
$10,265 |
$10,179 |
07/2018 |
$10,722 |
$10,268 |
$10,199 |
08/2018 |
$10,739 |
$10,300 |
$10,220 |
09/2018 |
$10,765 |
$10,260 |
$10,239 |
10/2018 |
$10,714 |
$10,240 |
$10,256 |
11/2018 |
$10,578 |
$10,290 |
$10,274 |
12/2018 |
$10,551 |
$10,439 |
$10,296 |
01/2019 |
$10,770 |
$10,550 |
$10,323 |
02/2019 |
$10,843 |
$10,562 |
$10,347 |
03/2019 |
$10,951 |
$10,751 |
$10,371 |
04/2019 |
$11,094 |
$10,758 |
$10,394 |
05/2019 |
$11,093 |
$10,913 |
$10,418 |
06/2019 |
$11,306 |
$11,066 |
$10,444 |
07/2019 |
$11,362 |
$11,153 |
$10,465 |
08/2019 |
$11,481 |
$11,406 |
$10,488 |
09/2019 |
$11,505 |
$11,353 |
$10,508 |
10/2019 |
$11,567 |
$11,333 |
$10,531 |
11/2019 |
$11,609 |
$11,320 |
$10,547 |
12/2019 |
$11,695 |
$11,297 |
$10,564 |
01/2020 |
$11,865 |
$11,501 |
$10,585 |
02/2020 |
$11,764 |
$11,641 |
$10,607 |
03/2020 |
$10,617 |
$11,460 |
$10,617 |
04/2020 |
$11,018 |
$11,646 |
$10,651 |
05/2020 |
$11,374 |
$11,679 |
$10,660 |
06/2020 |
$11,614 |
$11,737 |
$10,664 |
07/2020 |
$11,813 |
$11,865 |
$10,668 |
08/2020 |
$11,978 |
$11,779 |
$10,671 |
09/2020 |
$11,934 |
$11,822 |
$10,673 |
10/2020 |
$11,945 |
$11,823 |
$10,675 |
11/2020 |
$12,370 |
$11,891 |
$10,677 |
12/2020 |
$12,494 |
$11,927 |
$10,679 |
01/2021 |
$12,505 |
$11,863 |
$10,681 |
02/2021 |
$12,519 |
$11,679 |
$10,684 |
03/2021 |
$12,564 |
$11,633 |
$10,685 |
04/2021 |
$12,659 |
$11,663 |
$10,687 |
05/2021 |
$12,685 |
$11,689 |
$10,690 |
06/2021 |
$12,760 |
$11,746 |
$10,691 |
07/2021 |
$12,755 |
$11,892 |
$10,693 |
08/2021 |
$12,822 |
$11,868 |
$10,694 |
09/2021 |
$12,778 |
$11,756 |
$10,694 |
10/2021 |
$12,661 |
$11,725 |
$10,696 |
11/2021 |
$12,560 |
$11,809 |
$10,696 |
12/2021 |
$12,676 |
$11,761 |
$10,697 |
01/2022 |
$12,449 |
$11,576 |
$10,697 |
02/2022 |
$12,098 |
$11,422 |
$10,695 |
03/2022 |
$12,091 |
$11,176 |
$10,691 |
04/2022 |
$11,843 |
$10,876 |
$10,690 |
05/2022 |
$11,636 |
$10,861 |
$10,697 |
06/2022 |
$10,895 |
$10,696 |
$10,696 |
07/2022 |
$11,255 |
$10,968 |
$10,705 |
08/2022 |
$11,100 |
$10,682 |
$10,726 |
09/2022 |
$10,334 |
$10,339 |
$10,739 |
10/2022 |
$10,488 |
$10,304 |
$10,765 |
11/2022 |
$10,914 |
$10,566 |
$10,790 |
12/2022 |
$10,981 |
$10,442 |
$10,826 |
01/2023 |
$11,447 |
$10,682 |
$10,868 |
02/2023 |
$11,391 |
$10,512 |
$10,902 |
03/2023 |
$11,091 |
$10,745 |
$10,947 |
04/2023 |
$11,198 |
$10,800 |
$10,984 |
05/2023 |
$11,214 |
$10,758 |
$11,030 |
06/2023 |
$11,278 |
$10,751 |
$11,079 |
07/2023 |
$11,441 |
$10,755 |
$11,126 |
08/2023 |
$11,429 |
$10,741 |
$11,176 |
09/2023 |
$11,333 |
$10,556 |
$11,224 |
10/2023 |
$11,246 |
$10,481 |
$11,277 |
11/2023 |
$11,720 |
$10,841 |
$11,328 |
12/2023 |
$12,162 |
$11,188 |
$11,381 |
01/2024 |
$12,295 |
$11,166 |
$11,434 |
02/2024 |
$12,259 |
$11,089 |
$11,481 |
03/2024 |
$12,468 |
$11,189 |
$11,534 |
04/2024 |
$12,348 |
$11,009 |
$11,584 |
05/2024 |
$12,507 |
$11,107 |
$11,636 |
06/2024 |
$12,609 |
$11,203 |
$11,688 |
07/2024 |
$12,814 |
$11,419 |
$11,742 |
08/2024 |
$12,946 |
$11,544 |
$11,799 |
09/2024 |
$13,071 |
$11,678 |
$11,859 |
10/2024 |
$13,004 |
$11,520 |
$11,907 |
11/2024 |
$13,140 |
$11,657 |
$11,953 |
12/2024 |
$13,107 |
$11,568 |
$12,004 |
01/2025 |
$13,215 |
$11,613 |
$12,048 |
02/2025 |
$13,352 |
$11,752 |
$12,087 |
03/2025 |
$13,217 |
$11,703 |
$12,133 |
04/2025 |
$13,226 |
$11,819 |
$12,176 |
05/2025 |
$13,318 |
$11,780 |
$12,218 |
06/2025 |
$13,490 |
$11,892 |
$12,263 |
|
|
| Average Annual Return [Table Text Block] |
HEADER |
1 Year |
5 Years |
Since Inception (4/3/17) |
Class C without Deferred Sales ChargeFootnote Reference1 |
6.99% |
3.04% |
3.70% |
Class C with Maximum Deferred Sales Charge -1.00%Footnote Reference1 |
5.99% |
3.04% |
3.70% |
Bloomberg Global-Aggregate Total Return Index Value Hedged USD |
6.15% |
0.26% |
2.12% |
ICE BofA US Dollar 3-Month Deposit Offered Rate Constant Maturity Index |
4.92% |
2.83% |
2.51% | |
|
| Performance Inception Date |
Apr. 03, 2017
|
|
| No Deduction of Taxes [Text Block] |
The graph and table do not reflect the deduction of taxes that a shareholder would pay on fund distributions or redemption of fund shares.
|
|
| Performance Table Market Index Changed [Text Block] |
The Bloomberg Global-Aggregate Total Return Index Value Hedged USD has replaced the ICE BofA US Dollar 3-Month Deposit Offered Rate Constant Maturity Index as broad-based securities market index to comply with a new regulatory requirement.
|
|
| AssetsNet |
$ 481,131,572
|
|
| Holdings Count | Holding |
298
|
|
| Advisory Fees Paid, Amount |
$ 1,993,331
|
|
| InvestmentCompanyPortfolioTurnover |
74.00%
|
|
| Additional Fund Statistics [Text Block] |
Total Net Assets |
$481,131,572 |
# of Portfolio Holdings |
298 |
Portfolio Turnover Rate |
74% |
Total Management Fees Paid |
$1,993,331 | |
|
| Holdings [Text Block] |
Asset Allocation - % Investments
Value |
Value |
Foreign Corporate Obligations |
47.8 |
U.S. Treasury Obligations |
17.4 |
Asset-Backed Obligations |
15.2 |
Corporate Obligations |
10.1 |
Foreign Sovereign Obligations |
7.3 |
Investment Companies |
1.9 |
Foreign Convertible Obligations |
0.3 | Top Ten Industry Allocations - % Investments
Value |
Value |
REITS |
1.6 |
Telecommunications |
2.1 |
Pipelines |
2.2 |
Diversified Financial Services |
2.8 |
Savings & Loans |
3.6 |
Foreign Sovereign Obligations |
7.5 |
Insurance |
11.7 |
Asset-Backed Obligations |
15.5 |
U.S. Treasury Obligations |
17.7 |
Banks |
23.4 | Top Ten Country Exposure - % Investments
Value |
Value |
Jersey |
1.5 |
Italy |
3.4 |
Netherlands |
3.8 |
Cayman Islands |
3.9 |
France |
4.2 |
Spain |
4.7 |
Germany |
9.7 |
Ireland |
11.0 |
United Kingdom |
21.9 |
United States |
28.1 | Exludes currency forwards |
|
| Largest Holdings [Text Block] |
Top Ten Holdings - % Net Assets
Bundesrepublik Deutschland Bundesanleihe, 2.600%, Due 8/15/2034 |
5.0 |
U.S. Treasury Notes, 4.625%, Due 2/15/2035 |
4.7 |
U.S. Treasury Bonds, 4.500%, Due 11/15/2054 |
3.3 |
U.S. Treasury Notes, 4.250%, Due 11/15/2034 |
2.7 |
U.S. Treasury Bonds, 4.625%, Due 2/15/2055 |
2.5 |
U.S. Treasury Bills, 4.351%, Due 9/4/2025 |
2.4 |
Bundesrepublik Deutschland Bundesanleihe, 2.500%, Due 2/15/2035 |
2.3 |
U.S. Treasury Bills, 4.305%, Due 8/26/2025 |
1.9 |
Rothesay Life PLC, 5.000%, Due 10/13/2031 |
1.3 |
Nationwide Building Society, 7.500%, Due 12/20/2030 |
1.2 | Excludes cash equivalents and derivatives. |
|
| Material Fund Change [Text Block] |
|
|
| C000180737 |
|
|
| Shareholder Report [Line Items] |
|
|
| Fund Name |
TwentyFour Strategic Income Fund
|
|
| Class Name |
R5
|
|
| Trading Symbol |
TFGIX
|
|
| Annual or Semi-Annual Statement [Text Block] |
This annual shareholder report contains important information about American Beacon TwentyFour Strategic Income Fund for the period of July 1, 2024 to June 30, 2025.
|
|
| Shareholder Report Annual or Semi-Annual |
Annual Shareholder Report
|
|
| Additional Information [Text Block] |
You can find additional information about the Fund at www.americanbeaconfunds.com/literature. You can also request this information by contacting us at 800-658-5811.
|
|
| Additional Information Phone Number |
800-658-5811
|
|
| Additional Information Website |
<span style="box-sizing: border-box; color: rgb(0, 0, 0); display: inline; flex-wrap: nowrap; font-size: 13.3333px; font-weight: 400; grid-area: auto; line-height: 16px; margin: 0px; overflow: visible; text-align: left; text-align-last: auto; white-space-collapse: preserve-breaks;">www.americanbeaconfunds.com/literature</span>
|
|
| Expenses [Text Block] |
What were the Fund costs for the last year?(based on a hypothetical $10,000 investment)
Class Name |
Costs of a $10,000 investment |
Costs paid as a percentage of a $10,000 investment |
R5 |
$75 |
0.72% | |
|
| Expenses Paid, Amount |
$ 75
|
|
| Expense Ratio, Percent |
0.72%
|
|
| Factors Affecting Performance [Text Block] |
How did the Fund perform and what affected its performance? The R5 Class of the Fund returned 8.16% for the twelve months ended June 30, 2025, compared to the Bloomberg Global-Aggregate Total Return Index Value Hedged USD return of 6.15%. • The Fund’s lower-duration investments benefited during the period as interest rates rose at the longer end of the yield curve. • The Fund held a variety of exposures across credit sectors that the sub-advisor deemed to offer attractive yield, and most sectors contributed positively to total returns given strong credit markets. • Additional Tier-1 bonds issued by European banks generated the largest contribution to the Fund’s return, followed by European Collateralized Loan Obligations, which generated the next highest contribution to return. |
|
| Performance Past Does Not Indicate Future [Text] |
Performance shown is historical and is not indicative of future returns.
|
|
| Line Graph [Table Text Block] |
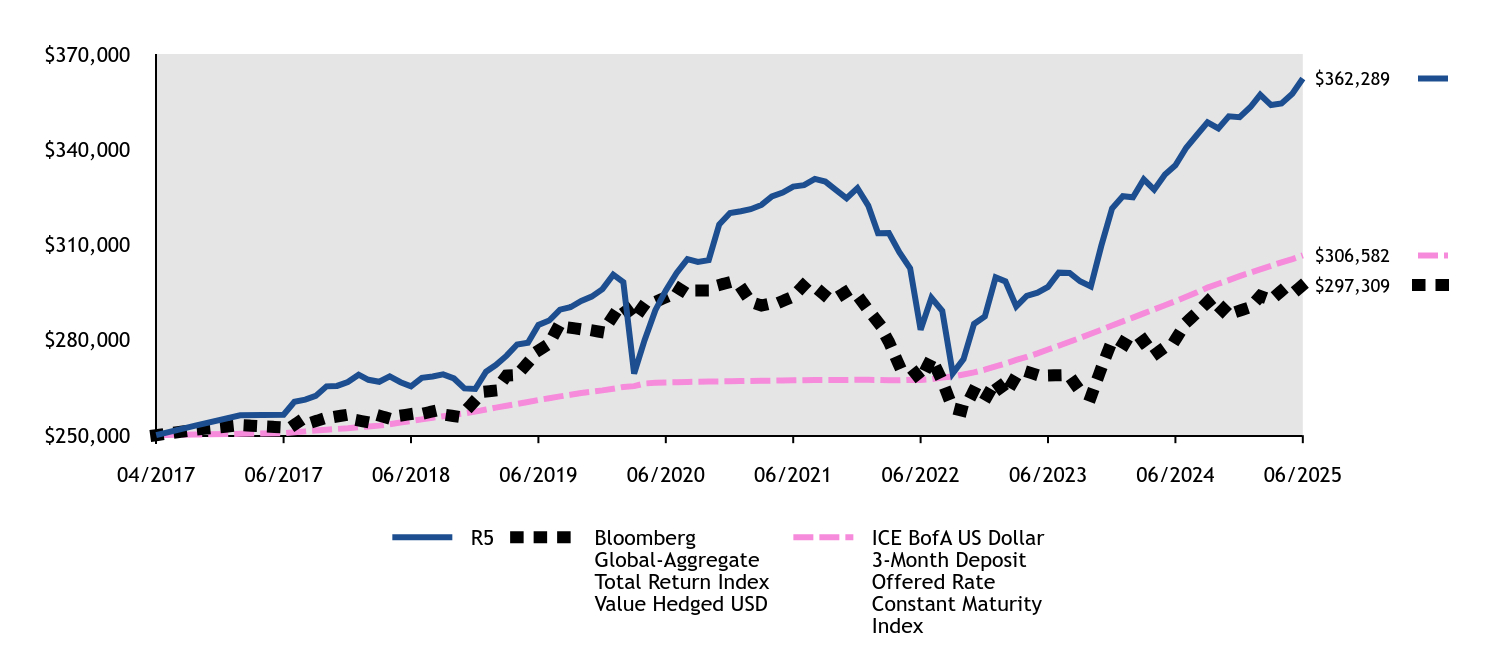
|
R5 |
Bloomberg Global-Aggregate Total Return Index Value Hedged USD |
ICE BofA US Dollar 3-Month Deposit Offered Rate Constant Maturity Index |
04/2017 |
$250,000 |
$250,000 |
$250,000 |
04/2017 |
$253,000 |
$251,695 |
$250,208 |
05/2017 |
$256,265 |
$253,165 |
$250,429 |
06/2017 |
$256,452 |
$252,456 |
$250,638 |
07/2017 |
$260,535 |
$253,286 |
$250,911 |
08/2017 |
$261,202 |
$255,594 |
$251,197 |
09/2017 |
$262,351 |
$254,414 |
$251,458 |
10/2017 |
$265,368 |
$255,487 |
$251,731 |
11/2017 |
$265,500 |
$255,883 |
$251,965 |
12/2017 |
$266,728 |
$256,455 |
$252,173 |
01/2018 |
$269,052 |
$254,624 |
$252,499 |
02/2018 |
$267,436 |
$254,050 |
$252,720 |
03/2018 |
$266,810 |
$256,157 |
$253,006 |
04/2018 |
$268,527 |
$255,204 |
$253,462 |
05/2018 |
$266,665 |
$256,157 |
$253,995 |
06/2018 |
$265,395 |
$256,634 |
$254,477 |
07/2018 |
$268,060 |
$256,704 |
$254,984 |
08/2018 |
$268,464 |
$257,493 |
$255,505 |
09/2018 |
$269,124 |
$256,509 |
$255,960 |
10/2018 |
$267,852 |
$256,007 |
$256,390 |
11/2018 |
$264,731 |
$257,260 |
$256,845 |
12/2018 |
$264,532 |
$260,976 |
$257,405 |
01/2019 |
$269,998 |
$263,740 |
$258,068 |
02/2019 |
$272,065 |
$264,057 |
$258,680 |
03/2019 |
$275,027 |
$268,786 |
$259,266 |
04/2019 |
$278,540 |
$268,946 |
$259,838 |
05/2019 |
$279,077 |
$272,817 |
$260,450 |
06/2019 |
$284,701 |
$276,642 |
$261,087 |
07/2019 |
$286,092 |
$278,819 |
$261,634 |
08/2019 |
$289,505 |
$285,142 |
$262,207 |
09/2019 |
$290,269 |
$283,821 |
$262,701 |
10/2019 |
$292,239 |
$283,331 |
$263,261 |
11/2019 |
$293,617 |
$282,998 |
$263,677 |
12/2019 |
$295,986 |
$282,418 |
$264,107 |
01/2020 |
$300,527 |
$287,514 |
$264,627 |
02/2020 |
$298,196 |
$291,033 |
$265,174 |
03/2020 |
$269,372 |
$286,504 |
$265,434 |
04/2020 |
$279,909 |
$291,142 |
$266,267 |
05/2020 |
$289,346 |
$291,967 |
$266,501 |
06/2020 |
$295,561 |
$293,424 |
$266,605 |
07/2020 |
$301,058 |
$296,631 |
$266,696 |
08/2020 |
$305,442 |
$294,482 |
$266,761 |
09/2020 |
$304,564 |
$295,557 |
$266,813 |
10/2020 |
$305,092 |
$295,579 |
$266,878 |
11/2020 |
$316,321 |
$297,265 |
$266,917 |
12/2020 |
$319,930 |
$298,179 |
$266,969 |
01/2021 |
$320,517 |
$296,579 |
$267,035 |
02/2021 |
$321,131 |
$291,966 |
$267,087 |
03/2021 |
$322,488 |
$290,816 |
$267,126 |
04/2021 |
$325,158 |
$291,576 |
$267,178 |
05/2021 |
$326,369 |
$292,227 |
$267,243 |
06/2021 |
$328,245 |
$293,652 |
$267,269 |
07/2021 |
$328,695 |
$297,302 |
$267,321 |
08/2021 |
$330,672 |
$296,706 |
$267,347 |
09/2021 |
$329,843 |
$293,905 |
$267,360 |
10/2021 |
$327,166 |
$293,136 |
$267,386 |
11/2021 |
$324,574 |
$295,227 |
$267,399 |
12/2021 |
$327,759 |
$294,030 |
$267,425 |
01/2022 |
$322,282 |
$289,410 |
$267,412 |
02/2022 |
$313,600 |
$285,561 |
$267,373 |
03/2022 |
$313,646 |
$279,405 |
$267,269 |
04/2022 |
$307,582 |
$271,896 |
$267,256 |
05/2022 |
$302,539 |
$271,521 |
$267,412 |
06/2022 |
$283,187 |
$267,401 |
$267,399 |
07/2022 |
$293,256 |
$274,212 |
$267,620 |
08/2022 |
$289,177 |
$267,053 |
$268,141 |
09/2022 |
$269,476 |
$258,480 |
$268,466 |
10/2022 |
$273,937 |
$257,596 |
$269,117 |
11/2022 |
$285,022 |
$264,160 |
$269,754 |
12/2022 |
$287,383 |
$261,042 |
$270,639 |
01/2023 |
$299,674 |
$267,055 |
$271,693 |
02/2023 |
$298,422 |
$262,795 |
$272,552 |
03/2023 |
$290,535 |
$268,622 |
$273,671 |
04/2023 |
$293,829 |
$270,006 |
$274,608 |
05/2023 |
$294,851 |
$268,942 |
$275,754 |
06/2023 |
$296,703 |
$268,782 |
$276,964 |
07/2023 |
$301,168 |
$268,869 |
$278,148 |
08/2023 |
$301,090 |
$268,531 |
$279,397 |
09/2023 |
$298,438 |
$263,900 |
$280,608 |
10/2023 |
$296,789 |
$262,027 |
$281,935 |
11/2023 |
$309,593 |
$271,036 |
$283,197 |
12/2023 |
$321,396 |
$279,698 |
$284,525 |
01/2024 |
$325,218 |
$279,149 |
$285,839 |
02/2024 |
$324,901 |
$277,234 |
$287,023 |
03/2024 |
$330,525 |
$279,734 |
$288,337 |
04/2024 |
$327,287 |
$275,230 |
$289,587 |
05/2024 |
$332,044 |
$277,665 |
$290,888 |
06/2024 |
$334,943 |
$280,075 |
$292,189 |
07/2024 |
$340,501 |
$285,485 |
$293,556 |
08/2024 |
$344,579 |
$288,612 |
$294,961 |
09/2024 |
$348,473 |
$291,961 |
$296,471 |
10/2024 |
$346,591 |
$288,010 |
$297,681 |
11/2024 |
$350,402 |
$291,432 |
$298,813 |
12/2024 |
$350,100 |
$289,195 |
$300,089 |
01/2025 |
$353,312 |
$290,316 |
$301,195 |
02/2025 |
$357,161 |
$293,811 |
$302,184 |
03/2025 |
$353,925 |
$292,585 |
$303,316 |
04/2025 |
$354,443 |
$295,466 |
$304,396 |
05/2025 |
$357,505 |
$294,489 |
$305,437 |
06/2025 |
$362,289 |
$297,309 |
$306,582 |
|
|
| Average Annual Return [Table Text Block] |
HEADER |
1 Year |
5 Years |
Since Inception (4/3/17) |
Class R5Footnote Reference1 |
8.16% |
4.16% |
4.60% |
Bloomberg Global-Aggregate Total Return Index Value Hedged USD |
6.15% |
0.26% |
2.12% |
ICE BofA US Dollar 3-Month Deposit Offered Rate Constant Maturity Index |
4.92% |
2.83% |
2.51% | |
|
| Performance Inception Date |
Apr. 03, 2017
|
|
| No Deduction of Taxes [Text Block] |
The graph and table do not reflect the deduction of taxes that a shareholder would pay on fund distributions or redemption of fund shares.
|
|
| Performance Table Market Index Changed [Text Block] |
The Bloomberg Global-Aggregate Total Return Index Value Hedged USD has replaced the ICE BofA US Dollar 3-Month Deposit Offered Rate Constant Maturity Index as broad-based securities market index to comply with a new regulatory requirement.
|
|
| AssetsNet |
$ 481,131,572
|
|
| Holdings Count | Holding |
298
|
|
| Advisory Fees Paid, Amount |
$ 1,993,331
|
|
| InvestmentCompanyPortfolioTurnover |
74.00%
|
|
| Additional Fund Statistics [Text Block] |
Total Net Assets |
$481,131,572 |
# of Portfolio Holdings |
298 |
Portfolio Turnover Rate |
74% |
Total Management Fees Paid |
$1,993,331 | |
|
| Holdings [Text Block] |
Asset Allocation - % Investments
Value |
Value |
Foreign Corporate Obligations |
47.8 |
U.S. Treasury Obligations |
17.4 |
Asset-Backed Obligations |
15.2 |
Corporate Obligations |
10.1 |
Foreign Sovereign Obligations |
7.3 |
Investment Companies |
1.9 |
Foreign Convertible Obligations |
0.3 | Top Ten Industry Allocations - % Investments
Value |
Value |
REITS |
1.6 |
Telecommunications |
2.1 |
Pipelines |
2.2 |
Diversified Financial Services |
2.8 |
Savings & Loans |
3.6 |
Foreign Sovereign Obligations |
7.5 |
Insurance |
11.7 |
Asset-Backed Obligations |
15.5 |
U.S. Treasury Obligations |
17.7 |
Banks |
23.4 | Top Ten Country Exposure - % Investments
Value |
Value |
Jersey |
1.5 |
Italy |
3.4 |
Netherlands |
3.8 |
Cayman Islands |
3.9 |
France |
4.2 |
Spain |
4.7 |
Germany |
9.7 |
Ireland |
11.0 |
United Kingdom |
21.9 |
United States |
28.1 | Exludes currency forwards |
|
| Largest Holdings [Text Block] |
Top Ten Holdings - % Net Assets
Bundesrepublik Deutschland Bundesanleihe, 2.600%, Due 8/15/2034 |
5.0 |
U.S. Treasury Notes, 4.625%, Due 2/15/2035 |
4.7 |
U.S. Treasury Bonds, 4.500%, Due 11/15/2054 |
3.3 |
U.S. Treasury Notes, 4.250%, Due 11/15/2034 |
2.7 |
U.S. Treasury Bonds, 4.625%, Due 2/15/2055 |
2.5 |
U.S. Treasury Bills, 4.351%, Due 9/4/2025 |
2.4 |
Bundesrepublik Deutschland Bundesanleihe, 2.500%, Due 2/15/2035 |
2.3 |
U.S. Treasury Bills, 4.305%, Due 8/26/2025 |
1.9 |
Rothesay Life PLC, 5.000%, Due 10/13/2031 |
1.3 |
Nationwide Building Society, 7.500%, Due 12/20/2030 |
1.2 | Excludes cash equivalents and derivatives. |
|
| Material Fund Change [Text Block] |
|
|
| C000180741 |
|
|
| Shareholder Report [Line Items] |
|
|
| Fund Name |
TwentyFour Strategic Income Fund
|
|
| Class Name |
Y
|
|
| Trading Symbol |
TFGYX
|
|
| Annual or Semi-Annual Statement [Text Block] |
This annual shareholder report contains important information about American Beacon TwentyFour Strategic Income Fund for the period of July 1, 2024 to June 30, 2025.
|
|
| Shareholder Report Annual or Semi-Annual |
Annual Shareholder Report
|
|
| Additional Information [Text Block] |
You can find additional information about the Fund at www.americanbeaconfunds.com/literature. You can also request this information by contacting us at 800-658-5811.
|
|
| Additional Information Phone Number |
800-658-5811
|
|
| Additional Information Website |
<span style="box-sizing: border-box; color: rgb(0, 0, 0); display: inline; flex-wrap: nowrap; font-size: 13.3333px; font-weight: 400; grid-area: auto; line-height: 16px; margin: 0px; overflow: visible; text-align: left; text-align-last: auto; white-space-collapse: preserve-breaks;">www.americanbeaconfunds.com/literature</span>
|
|
| Expenses [Text Block] |
What were the Fund costs for the last year?(based on a hypothetical $10,000 investment)
Class Name |
Costs of a $10,000 investment |
Costs paid as a percentage of a $10,000 investment |
Y |
$83 |
0.80% | |
|
| Expenses Paid, Amount |
$ 83
|
|
| Expense Ratio, Percent |
0.80%
|
|
| Factors Affecting Performance [Text Block] |
How did the Fund perform and what affected its performance? The Y Class of the Fund returned 8.09% for the twelve months ended June 30, 2025, compared to the Bloomberg Global-Aggregate Total Return Index Value Hedged USD return of 6.15%. • The Fund’s lower-duration investments benefited during the period as interest rates rose at the longer end of the yield curve. • The Fund held a variety of exposures across credit sectors that the sub-advisor deemed to offer attractive yield, and most sectors contributed positively to total returns given strong credit markets. • Additional Tier-1 bonds issued by European banks generated the largest contribution to the Fund’s return, followed by European Collateralized Loan Obligations, which generated the next highest contribution to return. |
|
| Performance Past Does Not Indicate Future [Text] |
Performance shown is historical and is not indicative of future returns.
|
|
| Line Graph [Table Text Block] |
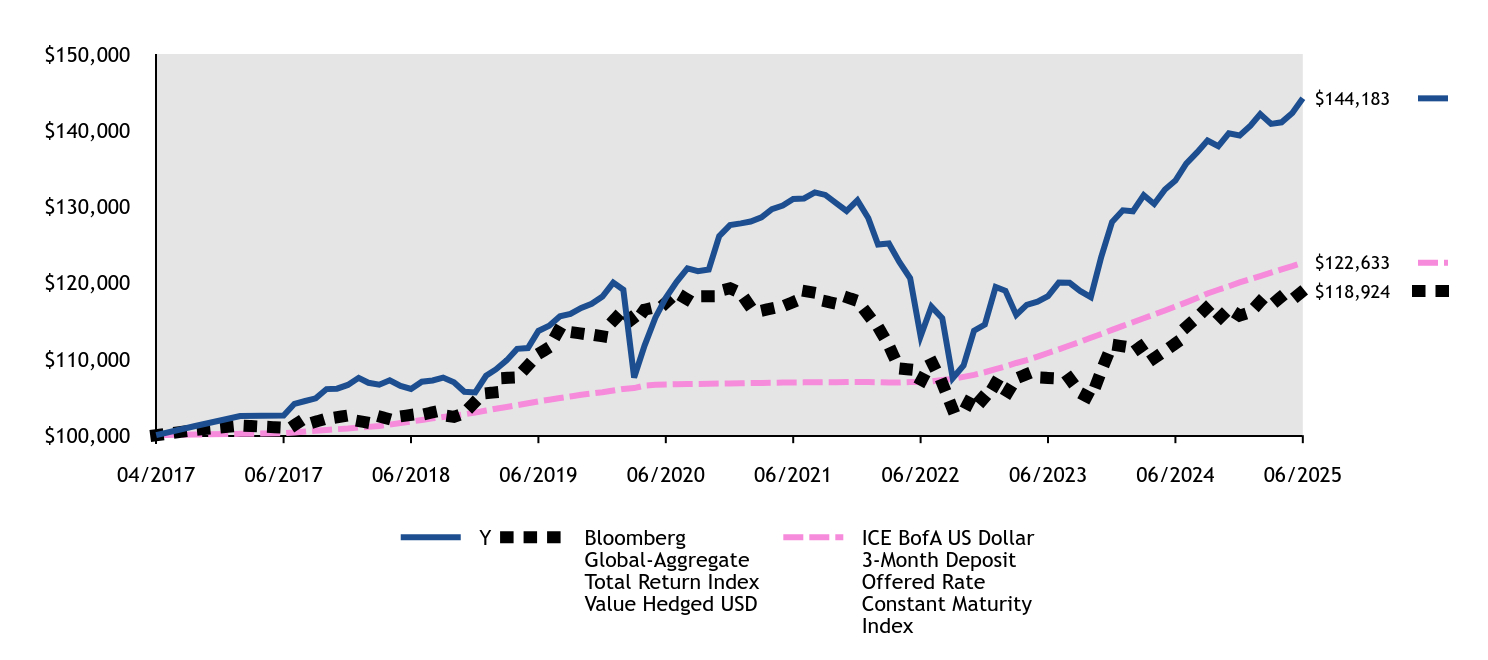
#ERROR:A result could not be returned because the conditional could not be evaluated to a True/False value (#ERROR:Invalid Formula (#!=""), 'Multiple values from an iterator cannot be used in a formula unless they are aggregrated.') |
Y |
Bloomberg Global-Aggregate Total Return Index Value Hedged USD |
ICE BofA US Dollar 3-Month Deposit Offered Rate Constant Maturity Index |
04/2017 |
$100,000 |
$100,000 |
$100,000 |
04/2017 |
$101,200 |
$100,678 |
$100,083 |
05/2017 |
$102,506 |
$101,266 |
$100,172 |
06/2017 |
$102,581 |
$100,982 |
$100,255 |
07/2017 |
$104,113 |
$101,314 |
$100,364 |
08/2017 |
$104,482 |
$102,238 |
$100,479 |
09/2017 |
$104,839 |
$101,766 |
$100,583 |
10/2017 |
$106,046 |
$102,195 |
$100,692 |
11/2017 |
$106,099 |
$102,353 |
$100,786 |
12/2017 |
$106,590 |
$102,582 |
$100,869 |
01/2018 |
$107,520 |
$101,850 |
$100,999 |
02/2018 |
$106,874 |
$101,620 |
$101,088 |
03/2018 |
$106,624 |
$102,463 |
$101,202 |
04/2018 |
$107,206 |
$102,081 |
$101,385 |
05/2018 |
$106,461 |
$102,463 |
$101,598 |
06/2018 |
$106,058 |
$102,654 |
$101,791 |
07/2018 |
$107,019 |
$102,682 |
$101,994 |
08/2018 |
$107,180 |
$102,997 |
$102,202 |
09/2018 |
$107,550 |
$102,603 |
$102,384 |
10/2018 |
$106,935 |
$102,403 |
$102,556 |
11/2018 |
$105,687 |
$102,904 |
$102,738 |
12/2018 |
$105,607 |
$104,390 |
$102,962 |
01/2019 |
$107,794 |
$105,496 |
$103,227 |
02/2019 |
$108,621 |
$105,623 |
$103,472 |
03/2019 |
$109,805 |
$107,515 |
$103,706 |
04/2019 |
$111,321 |
$107,579 |
$103,935 |
05/2019 |
$111,425 |
$109,127 |
$104,180 |
06/2019 |
$113,675 |
$110,657 |
$104,435 |
07/2019 |
$114,342 |
$111,528 |
$104,654 |
08/2019 |
$115,596 |
$114,057 |
$104,883 |
09/2019 |
$115,902 |
$113,528 |
$105,080 |
10/2019 |
$116,690 |
$113,332 |
$105,304 |
11/2019 |
$117,241 |
$113,199 |
$105,471 |
12/2019 |
$118,189 |
$112,967 |
$105,643 |
01/2020 |
$120,006 |
$115,006 |
$105,851 |
02/2020 |
$119,074 |
$116,413 |
$106,069 |
03/2020 |
$107,542 |
$114,602 |
$106,174 |
04/2020 |
$111,757 |
$116,457 |
$106,507 |
05/2020 |
$115,415 |
$116,787 |
$106,600 |
06/2020 |
$118,017 |
$117,370 |
$106,642 |
07/2020 |
$120,114 |
$118,653 |
$106,678 |
08/2020 |
$121,868 |
$117,793 |
$106,704 |
09/2020 |
$121,517 |
$118,223 |
$106,725 |
10/2020 |
$121,728 |
$118,231 |
$106,751 |
11/2020 |
$126,104 |
$118,906 |
$106,767 |
12/2020 |
$127,548 |
$119,272 |
$106,788 |
01/2021 |
$127,783 |
$118,632 |
$106,814 |
02/2021 |
$128,029 |
$116,786 |
$106,835 |
03/2021 |
$128,572 |
$116,326 |
$106,850 |
04/2021 |
$129,640 |
$116,630 |
$106,871 |
05/2021 |
$130,124 |
$116,891 |
$106,897 |
06/2021 |
$130,994 |
$117,461 |
$106,907 |
07/2021 |
$131,055 |
$118,921 |
$106,928 |
08/2021 |
$131,846 |
$118,682 |
$106,939 |
09/2021 |
$131,514 |
$117,562 |
$106,944 |
10/2021 |
$130,443 |
$117,255 |
$106,954 |
11/2021 |
$129,405 |
$118,091 |
$106,960 |
12/2021 |
$130,800 |
$117,612 |
$106,970 |
01/2022 |
$128,486 |
$115,764 |
$106,965 |
02/2022 |
$125,011 |
$114,224 |
$106,949 |
03/2022 |
$125,152 |
$111,762 |
$106,907 |
04/2022 |
$122,726 |
$108,758 |
$106,902 |
05/2022 |
$120,584 |
$108,609 |
$106,965 |
06/2022 |
$112,963 |
$106,960 |
$106,960 |
07/2022 |
$116,869 |
$109,685 |
$107,048 |
08/2022 |
$115,361 |
$106,821 |
$107,256 |
09/2022 |
$107,476 |
$103,392 |
$107,386 |
10/2022 |
$109,136 |
$103,038 |
$107,647 |
11/2022 |
$113,699 |
$105,664 |
$107,902 |
12/2022 |
$114,517 |
$104,417 |
$108,256 |
01/2023 |
$119,439 |
$106,822 |
$108,677 |
02/2023 |
$118,938 |
$105,118 |
$109,021 |
03/2023 |
$115,779 |
$107,449 |
$109,469 |
04/2023 |
$117,099 |
$108,002 |
$109,843 |
05/2023 |
$117,508 |
$107,577 |
$110,301 |
06/2023 |
$118,250 |
$107,513 |
$110,785 |
07/2023 |
$120,018 |
$107,548 |
$111,259 |
08/2023 |
$119,987 |
$107,412 |
$111,759 |
09/2023 |
$118,924 |
$105,560 |
$112,243 |
10/2023 |
$118,113 |
$104,811 |
$112,774 |
11/2023 |
$123,393 |
$108,414 |
$113,279 |
12/2023 |
$127,967 |
$111,879 |
$113,810 |
01/2024 |
$129,498 |
$111,660 |
$114,336 |
02/2024 |
$129,371 |
$110,894 |
$114,809 |
03/2024 |
$131,470 |
$111,894 |
$115,335 |
04/2024 |
$130,327 |
$110,092 |
$115,835 |
05/2024 |
$132,233 |
$111,066 |
$116,355 |
06/2024 |
$133,394 |
$112,030 |
$116,876 |
07/2024 |
$135,620 |
$114,194 |
$117,422 |
08/2024 |
$137,097 |
$115,445 |
$117,984 |
09/2024 |
$138,656 |
$116,785 |
$118,588 |
10/2024 |
$137,902 |
$115,204 |
$119,072 |
11/2024 |
$139,588 |
$116,573 |
$119,525 |
12/2024 |
$139,303 |
$115,678 |
$120,035 |
01/2025 |
$140,590 |
$116,126 |
$120,478 |
02/2025 |
$142,132 |
$117,524 |
$120,873 |
03/2025 |
$140,834 |
$117,034 |
$121,326 |
04/2025 |
$141,040 |
$118,186 |
$121,758 |
05/2025 |
$142,267 |
$117,796 |
$122,175 |
06/2025 |
$144,183 |
$118,924 |
$122,633 |
|
|
| Average Annual Return [Table Text Block] |
HEADER |
1 Year |
5 Years |
Since Inception (4/3/17) |
Class YFootnote Reference1 |
8.09% |
4.09% |
4.54% |
Bloomberg Global-Aggregate Total Return Index Value Hedged USD |
6.15% |
0.26% |
2.12% |
ICE BofA US Dollar 3-Month Deposit Offered Rate Constant Maturity Index |
4.92% |
2.83% |
2.51% | |
|
| Performance Inception Date |
Apr. 03, 2017
|
|
| No Deduction of Taxes [Text Block] |
The graph and table do not reflect the deduction of taxes that a shareholder would pay on fund distributions or redemption of fund shares.
|
|
| Performance Table Market Index Changed [Text Block] |
The Bloomberg Global-Aggregate Total Return Index Value Hedged USD has replaced the ICE BofA US Dollar 3-Month Deposit Offered Rate Constant Maturity Index as broad-based securities market index to comply with a new regulatory requirement.
|
|
| AssetsNet |
$ 481,131,572
|
|
| Holdings Count | Holding |
298
|
|
| Advisory Fees Paid, Amount |
$ 1,993,331
|
|
| InvestmentCompanyPortfolioTurnover |
74.00%
|
|
| Additional Fund Statistics [Text Block] |
Total Net Assets |
$481,131,572 |
# of Portfolio Holdings |
298 |
Portfolio Turnover Rate |
74% |
Total Management Fees Paid |
$1,993,331 | |
|
| Holdings [Text Block] |
Asset Allocation - % Investments
Value |
Value |
Foreign Corporate Obligations |
47.8 |
U.S. Treasury Obligations |
17.4 |
Asset-Backed Obligations |
15.2 |
Corporate Obligations |
10.1 |
Foreign Sovereign Obligations |
7.3 |
Investment Companies |
1.9 |
Foreign Convertible Obligations |
0.3 | Top Ten Industry Allocations - % Investments
Value |
Value |
REITS |
1.6 |
Telecommunications |
2.1 |
Pipelines |
2.2 |
Diversified Financial Services |
2.8 |
Savings & Loans |
3.6 |
Foreign Sovereign Obligations |
7.5 |
Insurance |
11.7 |
Asset-Backed Obligations |
15.5 |
U.S. Treasury Obligations |
17.7 |
Banks |
23.4 | Top Ten Country Exposure - % Investments
Value |
Value |
Jersey |
1.5 |
Italy |
3.4 |
Netherlands |
3.8 |
Cayman Islands |
3.9 |
France |
4.2 |
Spain |
4.7 |
Germany |
9.7 |
Ireland |
11.0 |
United Kingdom |
21.9 |
United States |
28.1 | Exludes currency forwards |
|
| Largest Holdings [Text Block] |
Top Ten Holdings - % Net Assets
Bundesrepublik Deutschland Bundesanleihe, 2.600%, Due 8/15/2034 |
5.0 |
U.S. Treasury Notes, 4.625%, Due 2/15/2035 |
4.7 |
U.S. Treasury Bonds, 4.500%, Due 11/15/2054 |
3.3 |
U.S. Treasury Notes, 4.250%, Due 11/15/2034 |
2.7 |
U.S. Treasury Bonds, 4.625%, Due 2/15/2055 |
2.5 |
U.S. Treasury Bills, 4.351%, Due 9/4/2025 |
2.4 |
Bundesrepublik Deutschland Bundesanleihe, 2.500%, Due 2/15/2035 |
2.3 |
U.S. Treasury Bills, 4.305%, Due 8/26/2025 |
1.9 |
Rothesay Life PLC, 5.000%, Due 10/13/2031 |
1.3 |
Nationwide Building Society, 7.500%, Due 12/20/2030 |
1.2 | Excludes cash equivalents and derivatives. |
|
| Material Fund Change [Text Block] |
|
|
| C000180738 |
|
|
| Shareholder Report [Line Items] |
|
|
| Fund Name |
TwentyFour Strategic Income Fund
|
|
| Class Name |
Investor
|
|
| Trading Symbol |
TFGPX
|
|
| Annual or Semi-Annual Statement [Text Block] |
This annual shareholder report contains important information about American Beacon TwentyFour Strategic Income Fund for the period of July 1, 2024 to June 30, 2025.
|
|
| Shareholder Report Annual or Semi-Annual |
Annual Shareholder Report
|
|
| Additional Information [Text Block] |
You can find additional information about the Fund at www.americanbeaconfunds.com/literature. You can also request this information by contacting us at 800-658-5811.
|
|
| Additional Information Phone Number |
800-658-5811
|
|
| Additional Information Website |
<span style="box-sizing: border-box; color: rgb(0, 0, 0); display: inline; flex-wrap: nowrap; font-size: 13.3333px; font-weight: 400; grid-area: auto; line-height: 16px; margin: 0px; overflow: visible; text-align: left; text-align-last: auto; white-space-collapse: preserve-breaks;">www.americanbeaconfunds.com/literature</span>
|
|
| Expenses [Text Block] |
What were the Fund costs for the last year?(based on a hypothetical $10,000 investment)
Class Name |
Costs of a $10,000 investment |
Costs paid as a percentage of a $10,000 investment |
Investor |
$113 |
1.09% | |
|
| Expenses Paid, Amount |
$ 113
|
|
| Expense Ratio, Percent |
1.09%
|
|
| Factors Affecting Performance [Text Block] |
How did the Fund perform and what affected its performance? The Investor Class of the Fund returned 7.72% for the twelve months ended June 30, 2025, compared to the Bloomberg Global-Aggregate Total Return Index Value Hedged USD return of 6.15%. • The Fund’s lower-duration investments benefited during the period as interest rates rose at the longer end of the yield curve. • The Fund held a variety of exposures across credit sectors that the sub-advisor deemed to offer attractive yield, and most sectors contributed positively to total returns given strong credit markets. • Additional Tier-1 bonds issued by European banks generated the largest contribution to the Fund’s return, followed by European Collateralized Loan Obligations, which generated the next highest contribution to return. |
|
| Performance Past Does Not Indicate Future [Text] |
Performance shown is historical and is not indicative of future returns.
|
|
| Line Graph [Table Text Block] |
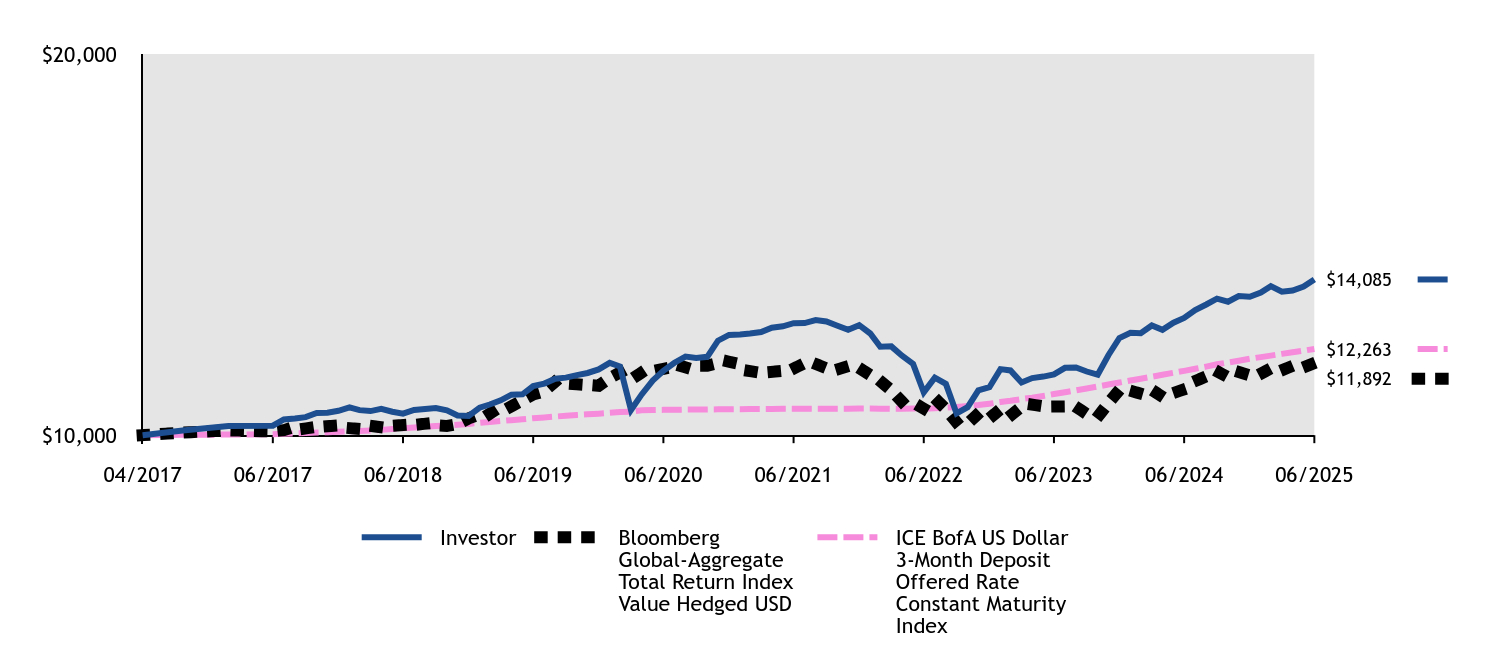
|
Investor |
Bloomberg Global-Aggregate Total Return Index Value Hedged USD |
ICE BofA US Dollar 3-Month Deposit Offered Rate Constant Maturity Index |
04/2017 |
$10,000 |
$10,000 |
$10,000 |
04/2017 |
$10,120 |
$10,068 |
$10,008 |
05/2017 |
$10,241 |
$10,127 |
$10,017 |
06/2017 |
$10,248 |
$10,098 |
$10,026 |
07/2017 |
$10,411 |
$10,131 |
$10,037 |
08/2017 |
$10,438 |
$10,224 |
$10,048 |
09/2017 |
$10,474 |
$10,177 |
$10,058 |
10/2017 |
$10,584 |
$10,219 |
$10,069 |
11/2017 |
$10,589 |
$10,235 |
$10,079 |
12/2017 |
$10,639 |
$10,258 |
$10,087 |
01/2018 |
$10,732 |
$10,185 |
$10,100 |
02/2018 |
$10,657 |
$10,162 |
$10,109 |
03/2018 |
$10,632 |
$10,246 |
$10,120 |
04/2018 |
$10,690 |
$10,208 |
$10,139 |
05/2018 |
$10,615 |
$10,246 |
$10,160 |
06/2018 |
$10,564 |
$10,265 |
$10,179 |
07/2018 |
$10,660 |
$10,268 |
$10,199 |
08/2018 |
$10,687 |
$10,300 |
$10,220 |
09/2018 |
$10,714 |
$10,260 |
$10,239 |
10/2018 |
$10,652 |
$10,240 |
$10,256 |
11/2018 |
$10,516 |
$10,290 |
$10,274 |
12/2018 |
$10,505 |
$10,439 |
$10,296 |
01/2019 |
$10,723 |
$10,550 |
$10,323 |
02/2019 |
$10,805 |
$10,562 |
$10,347 |
03/2019 |
$10,913 |
$10,751 |
$10,371 |
04/2019 |
$11,063 |
$10,758 |
$10,394 |
05/2019 |
$11,073 |
$10,913 |
$10,418 |
06/2019 |
$11,287 |
$11,066 |
$10,444 |
07/2019 |
$11,354 |
$11,153 |
$10,465 |
08/2019 |
$11,479 |
$11,406 |
$10,488 |
09/2019 |
$11,509 |
$11,353 |
$10,508 |
10/2019 |
$11,577 |
$11,333 |
$10,531 |
11/2019 |
$11,632 |
$11,320 |
$10,547 |
12/2019 |
$11,726 |
$11,297 |
$10,564 |
01/2020 |
$11,896 |
$11,501 |
$10,585 |
02/2020 |
$11,802 |
$11,641 |
$10,607 |
03/2020 |
$10,660 |
$11,460 |
$10,617 |
04/2020 |
$11,069 |
$11,646 |
$10,651 |
05/2020 |
$11,432 |
$11,679 |
$10,660 |
06/2020 |
$11,691 |
$11,737 |
$10,664 |
07/2020 |
$11,901 |
$11,865 |
$10,668 |
08/2020 |
$12,063 |
$11,779 |
$10,671 |
09/2020 |
$12,026 |
$11,822 |
$10,673 |
10/2020 |
$12,056 |
$11,823 |
$10,675 |
11/2020 |
$12,479 |
$11,891 |
$10,677 |
12/2020 |
$12,631 |
$11,927 |
$10,679 |
01/2021 |
$12,642 |
$11,863 |
$10,681 |
02/2021 |
$12,665 |
$11,679 |
$10,684 |
03/2021 |
$12,705 |
$11,633 |
$10,685 |
04/2021 |
$12,821 |
$11,663 |
$10,687 |
05/2021 |
$12,855 |
$11,689 |
$10,690 |
06/2021 |
$12,939 |
$11,746 |
$10,691 |
07/2021 |
$12,942 |
$11,892 |
$10,693 |
08/2021 |
$13,018 |
$11,868 |
$10,694 |
09/2021 |
$12,982 |
$11,756 |
$10,694 |
10/2021 |
$12,871 |
$11,725 |
$10,696 |
11/2021 |
$12,765 |
$11,809 |
$10,696 |
12/2021 |
$12,886 |
$11,761 |
$10,697 |
01/2022 |
$12,668 |
$11,576 |
$10,697 |
02/2022 |
$12,319 |
$11,422 |
$10,695 |
03/2022 |
$12,330 |
$11,176 |
$10,691 |
04/2022 |
$12,086 |
$10,876 |
$10,690 |
05/2022 |
$11,871 |
$10,861 |
$10,697 |
06/2022 |
$11,123 |
$10,696 |
$10,696 |
07/2022 |
$11,510 |
$10,968 |
$10,705 |
08/2022 |
$11,346 |
$10,682 |
$10,726 |
09/2022 |
$10,570 |
$10,339 |
$10,739 |
10/2022 |
$10,735 |
$10,304 |
$10,765 |
11/2022 |
$11,176 |
$10,566 |
$10,790 |
12/2022 |
$11,257 |
$10,442 |
$10,826 |
01/2023 |
$11,733 |
$10,682 |
$10,868 |
02/2023 |
$11,698 |
$10,512 |
$10,902 |
03/2023 |
$11,382 |
$10,745 |
$10,947 |
04/2023 |
$11,498 |
$10,800 |
$10,984 |
05/2023 |
$11,537 |
$10,758 |
$11,030 |
06/2023 |
$11,594 |
$10,751 |
$11,079 |
07/2023 |
$11,767 |
$10,755 |
$11,126 |
08/2023 |
$11,778 |
$10,741 |
$11,176 |
09/2023 |
$11,670 |
$10,556 |
$11,224 |
10/2023 |
$11,588 |
$10,481 |
$11,277 |
11/2023 |
$12,098 |
$10,841 |
$11,328 |
12/2023 |
$12,550 |
$11,188 |
$11,381 |
01/2024 |
$12,688 |
$11,166 |
$11,434 |
02/2024 |
$12,673 |
$11,089 |
$11,481 |
03/2024 |
$12,879 |
$11,189 |
$11,534 |
04/2024 |
$12,763 |
$11,009 |
$11,584 |
05/2024 |
$12,950 |
$11,107 |
$11,636 |
06/2024 |
$13,075 |
$11,203 |
$11,688 |
07/2024 |
$13,285 |
$11,419 |
$11,742 |
08/2024 |
$13,428 |
$11,544 |
$11,799 |
09/2024 |
$13,580 |
$11,678 |
$11,859 |
10/2024 |
$13,502 |
$11,520 |
$11,907 |
11/2024 |
$13,651 |
$11,657 |
$11,953 |
12/2024 |
$13,632 |
$11,568 |
$12,004 |
01/2025 |
$13,744 |
$11,613 |
$12,048 |
02/2025 |
$13,910 |
$11,752 |
$12,087 |
03/2025 |
$13,762 |
$11,703 |
$12,133 |
04/2025 |
$13,795 |
$11,819 |
$12,176 |
05/2025 |
$13,898 |
$11,780 |
$12,218 |
06/2025 |
$14,085 |
$11,892 |
$12,263 |
|
|
| Average Annual Return [Table Text Block] |
HEADER |
1 Year |
5 Years |
Since Inception (4/3/17) |
Investor ClassFootnote Reference1 |
7.72% |
3.80% |
4.24% |
Bloomberg Global-Aggregate Total Return Index Value Hedged USD |
6.15% |
0.26% |
2.12% |
ICE BofA US Dollar 3-Month Deposit Offered Rate Constant Maturity Index |
4.92% |
2.83% |
2.51% | |
|
| Performance Inception Date |
Apr. 03, 2017
|
|
| No Deduction of Taxes [Text Block] |
The graph and table do not reflect the deduction of taxes that a shareholder would pay on fund distributions or redemption of fund shares.
|
|
| Performance Table Market Index Changed [Text Block] |
The Bloomberg Global-Aggregate Total Return Index Value Hedged USD has replaced the ICE BofA US Dollar 3-Month Deposit Offered Rate Constant Maturity Index as broad-based securities market index to comply with a new regulatory requirement.
|
|
| AssetsNet |
$ 481,131,572
|
|
| Holdings Count | Holding |
298
|
|
| Advisory Fees Paid, Amount |
$ 1,993,331
|
|
| InvestmentCompanyPortfolioTurnover |
74.00%
|
|
| Additional Fund Statistics [Text Block] |
Total Net Assets |
$481,131,572 |
# of Portfolio Holdings |
298 |
Portfolio Turnover Rate |
74% |
Total Management Fees Paid |
$1,993,331 | |
|
| Holdings [Text Block] |
Asset Allocation - % Investments
Value |
Value |
Foreign Corporate Obligations |
47.8 |
U.S. Treasury Obligations |
17.4 |
Asset-Backed Obligations |
15.2 |
Corporate Obligations |
10.1 |
Foreign Sovereign Obligations |
7.3 |
Investment Companies |
1.9 |
Foreign Convertible Obligations |
0.3 | Top Ten Industry Allocations - % Investments
Value |
Value |
REITS |
1.6 |
Telecommunications |
2.1 |
Pipelines |
2.2 |
Diversified Financial Services |
2.8 |
Savings & Loans |
3.6 |
Foreign Sovereign Obligations |
7.5 |
Insurance |
11.7 |
Asset-Backed Obligations |
15.5 |
U.S. Treasury Obligations |
17.7 |
Banks |
23.4 | Top Ten Country Exposure - % Investments
Value |
Value |
Jersey |
1.5 |
Italy |
3.4 |
Netherlands |
3.8 |
Cayman Islands |
3.9 |
France |
4.2 |
Spain |
4.7 |
Germany |
9.7 |
Ireland |
11.0 |
United Kingdom |
21.9 |
United States |
28.1 | Exludes currency forwards |
|
| Largest Holdings [Text Block] |
Top Ten Holdings - % Net Assets
Bundesrepublik Deutschland Bundesanleihe, 2.600%, Due 8/15/2034 |
5.0 |
U.S. Treasury Notes, 4.625%, Due 2/15/2035 |
4.7 |
U.S. Treasury Bonds, 4.500%, Due 11/15/2054 |
3.3 |
U.S. Treasury Notes, 4.250%, Due 11/15/2034 |
2.7 |
U.S. Treasury Bonds, 4.625%, Due 2/15/2055 |
2.5 |
U.S. Treasury Bills, 4.351%, Due 9/4/2025 |
2.4 |
Bundesrepublik Deutschland Bundesanleihe, 2.500%, Due 2/15/2035 |
2.3 |
U.S. Treasury Bills, 4.305%, Due 8/26/2025 |
1.9 |
Rothesay Life PLC, 5.000%, Due 10/13/2031 |
1.3 |
Nationwide Building Society, 7.500%, Due 12/20/2030 |
1.2 | Excludes cash equivalents and derivatives. |
|
| Material Fund Change [Text Block] |
|
|
| C000233648 |
|
|
| Shareholder Report [Line Items] |
|
|
| Fund Name |
Shapiro SMID Cap Equity Fund
|
|
| Class Name |
A
|
|
| Trading Symbol |
SHEAX
|
|
| Annual or Semi-Annual Statement [Text Block] |
This annual shareholder report contains important information about American Beacon Shapiro SMID Cap Equity Fund for the period of July 1, 2024 to June 30, 2025.
|
|
| Shareholder Report Annual or Semi-Annual |
Annual Shareholder Report
|
|
| Additional Information [Text Block] |
You can find additional information about the Fund at www.americanbeaconfunds.com/literature. You can also request this information by contacting us at 800-658-5811.
|
|
| Additional Information Phone Number |
800-658-5811
|
|
| Additional Information Website |
<span style="box-sizing: border-box; color: rgb(0, 0, 0); display: inline; flex-wrap: nowrap; font-size: 13.3333px; font-weight: 400; grid-area: auto; line-height: 16px; margin: 0px; overflow: visible; text-align: left; text-align-last: auto; white-space-collapse: preserve-breaks;">www.americanbeaconfunds.com/literature</span>
|
|
| Expenses [Text Block] |
What were the Fund costs for the last year?(based on a hypothetical $10,000 investment)
Class Name |
Costs of a $10,000 investment |
Costs paid as a percentage of a $10,000 investment |
Class A |
$121 |
1.25% | |
|
| Expenses Paid, Amount |
$ 121
|
|
| Expense Ratio, Percent |
1.25%
|
|
| Factors Affecting Performance [Text Block] |
How did the Fund perform and what affected its performance? The A Class of the Fund returned -12.27% (with sales charges) and -6.90% (without sales charges) for the twelve months ended June 30, 2025, compared to the S&P 500 Index return of 15.16% and the Russell 2500 Value Index return of 10.47%. • Over the period, smaller capitalization companies generally lagged the overall market, while mega-cap growth companies benefited from continued momentum within the AI theme. • Continued higher interest rates and higher tariff expectations were particularly challenging for the Fund’s holdings in undervalued and out-of-favor companies. • The sub-advisor’s stock selection in the Information Technology and Communication Services sectors materially detracted from Fund performance, while stock selection in the Consumer Discretionary sector contributed positively to performance. |
|
| Performance Past Does Not Indicate Future [Text] |
Performance shown is historical and is not indicative of future returns.
|
|
| Line Graph [Table Text Block] |
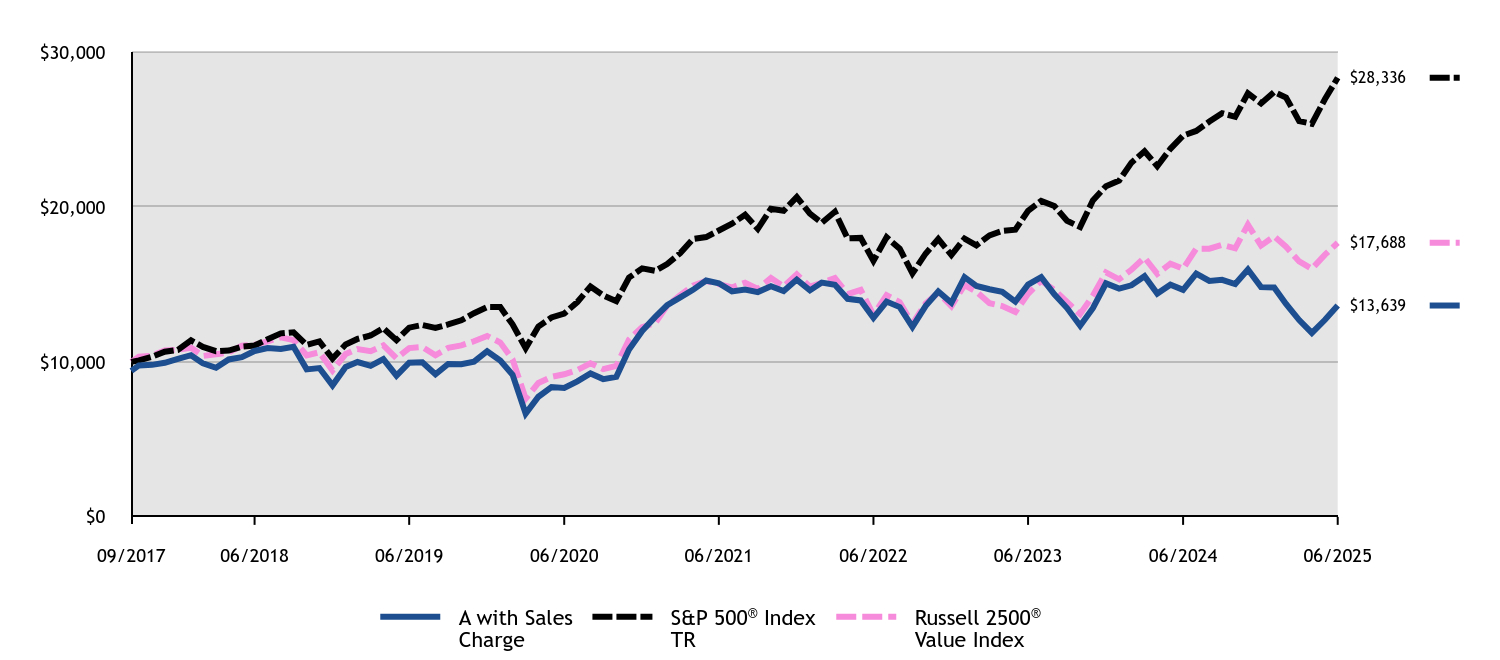
|
A with Sales Charge |
S&P 500® Index TR |
Russell 2500® Value Index |
09/2017 |
$9,425 |
$10,000 |
$10,000 |
09/2017 |
$9,774 |
$10,101 |
$10,343 |
10/2017 |
$9,811 |
$10,336 |
$10,399 |
11/2017 |
$9,943 |
$10,653 |
$10,740 |
12/2017 |
$10,198 |
$10,772 |
$10,782 |
01/2018 |
$10,434 |
$11,388 |
$10,918 |
02/2018 |
$9,906 |
$10,969 |
$10,382 |
03/2018 |
$9,623 |
$10,690 |
$10,497 |
04/2018 |
$10,160 |
$10,731 |
$10,611 |
05/2018 |
$10,302 |
$10,989 |
$11,047 |
06/2018 |
$10,707 |
$11,057 |
$11,105 |
07/2018 |
$10,895 |
$11,468 |
$11,326 |
08/2018 |
$10,839 |
$11,842 |
$11,584 |
09/2018 |
$10,980 |
$11,910 |
$11,402 |
10/2018 |
$9,519 |
$11,096 |
$10,427 |
11/2018 |
$9,604 |
$11,322 |
$10,624 |
12/2018 |
$8,487 |
$10,211 |
$9,450 |
01/2019 |
$9,673 |
$11,125 |
$10,506 |
02/2019 |
$9,993 |
$11,482 |
$10,834 |
03/2019 |
$9,745 |
$11,705 |
$10,689 |
04/2019 |
$10,178 |
$12,179 |
$11,064 |
05/2019 |
$9,116 |
$11,405 |
$10,230 |
06/2019 |
$9,951 |
$12,209 |
$10,892 |
07/2019 |
$9,972 |
$12,384 |
$10,963 |
08/2019 |
$9,199 |
$12,188 |
$10,429 |
09/2019 |
$9,869 |
$12,416 |
$10,906 |
10/2019 |
$9,848 |
$12,685 |
$11,063 |
11/2019 |
$10,013 |
$13,146 |
$11,335 |
12/2019 |
$10,691 |
$13,542 |
$11,677 |
01/2020 |
$10,084 |
$13,537 |
$11,251 |
02/2020 |
$9,178 |
$12,423 |
$10,166 |
03/2020 |
$6,660 |
$10,888 |
$7,632 |
04/2020 |
$7,753 |
$12,284 |
$8,641 |
05/2020 |
$8,383 |
$12,869 |
$9,036 |
06/2020 |
$8,316 |
$13,125 |
$9,204 |
07/2020 |
$8,747 |
$13,865 |
$9,481 |
08/2020 |
$9,255 |
$14,862 |
$9,911 |
09/2020 |
$8,891 |
$14,297 |
$9,530 |
10/2020 |
$9,034 |
$13,917 |
$9,745 |
11/2020 |
$10,801 |
$15,440 |
$11,450 |
12/2020 |
$12,001 |
$16,034 |
$12,246 |
01/2021 |
$12,907 |
$15,872 |
$12,517 |
02/2021 |
$13,656 |
$16,310 |
$13,631 |
03/2021 |
$14,160 |
$17,024 |
$14,307 |
04/2021 |
$14,652 |
$17,933 |
$14,921 |
05/2021 |
$15,256 |
$18,058 |
$15,224 |
06/2021 |
$15,077 |
$18,479 |
$15,023 |
07/2021 |
$14,551 |
$18,918 |
$14,803 |
08/2021 |
$14,674 |
$19,494 |
$15,115 |
09/2021 |
$14,507 |
$18,587 |
$14,712 |
10/2021 |
$14,887 |
$19,889 |
$15,411 |
11/2021 |
$14,574 |
$19,751 |
$14,875 |
12/2021 |
$15,313 |
$20,637 |
$15,649 |
01/2022 |
$14,616 |
$19,569 |
$14,853 |
02/2022 |
$15,123 |
$18,983 |
$15,095 |
03/2022 |
$14,984 |
$19,688 |
$15,414 |
04/2022 |
$14,071 |
$17,971 |
$14,369 |
05/2022 |
$13,969 |
$18,004 |
$14,644 |
06/2022 |
$12,841 |
$16,518 |
$13,041 |
07/2022 |
$13,893 |
$18,041 |
$14,304 |
08/2022 |
$13,538 |
$17,305 |
$13,855 |
09/2022 |
$12,258 |
$15,711 |
$12,454 |
10/2022 |
$13,602 |
$16,983 |
$13,769 |
11/2022 |
$14,540 |
$17,932 |
$14,460 |
12/2022 |
$13,812 |
$16,899 |
$13,601 |
01/2023 |
$15,469 |
$17,961 |
$14,960 |
02/2023 |
$14,899 |
$17,523 |
$14,536 |
03/2023 |
$14,692 |
$18,166 |
$13,791 |
04/2023 |
$14,524 |
$18,450 |
$13,607 |
05/2023 |
$13,890 |
$18,530 |
$13,219 |
06/2023 |
$14,990 |
$19,754 |
$14,394 |
07/2023 |
$15,469 |
$20,389 |
$15,237 |
08/2023 |
$14,356 |
$20,064 |
$14,651 |
09/2023 |
$13,475 |
$19,108 |
$13,867 |
10/2023 |
$12,336 |
$18,706 |
$13,089 |
11/2023 |
$13,462 |
$20,414 |
$14,276 |
12/2023 |
$15,070 |
$21,342 |
$15,775 |
01/2024 |
$14,734 |
$21,700 |
$15,332 |
02/2024 |
$14,944 |
$22,859 |
$15,947 |
03/2024 |
$15,532 |
$23,594 |
$16,732 |
04/2024 |
$14,413 |
$22,631 |
$15,680 |
05/2024 |
$14,986 |
$23,753 |
$16,341 |
06/2024 |
$14,651 |
$24,605 |
$16,012 |
07/2024 |
$15,700 |
$24,905 |
$17,308 |
08/2024 |
$15,224 |
$25,509 |
$17,308 |
09/2024 |
$15,294 |
$26,053 |
$17,553 |
10/2024 |
$15,028 |
$25,817 |
$17,332 |
11/2024 |
$15,966 |
$27,333 |
$18,861 |
12/2024 |
$14,825 |
$26,681 |
$17,507 |
01/2025 |
$14,810 |
$27,424 |
$18,103 |
02/2025 |
$13,742 |
$27,066 |
$17,434 |
03/2025 |
$12,703 |
$25,541 |
$16,486 |
04/2025 |
$11,868 |
$25,368 |
$16,009 |
05/2025 |
$12,717 |
$26,965 |
$16,923 |
06/2025 |
$13,639 |
$28,336 |
$17,688 |
|
|
| Average Annual Return [Table Text Block] |
HEADER |
1 Year |
5 Years |
Since Inception (9/12/17) |
Class A without Sales ChargeFootnote Reference1 |
(6.90)% |
10.40% |
4.85% |
Class A with Maximum Sales Charge - 5.75%Footnote Reference1 |
(12.27)% |
9.10% |
4.06% |
S&P 500® Index TR |
15.16% |
16.64% |
14.29% |
Russell 2500® Value Index |
10.47% |
13.96% |
7.59% | |
|
| Performance Inception Date |
Sep. 12, 2017
|
|
| No Deduction of Taxes [Text Block] |
The graph and table do not reflect the deduction of taxes that a shareholder would pay on fund distributions or redemption of fund shares.
|
|
| AssetsNet |
$ 28,918,644
|
|
| Holdings Count | Holding |
31
|
|
| Advisory Fees Paid, Amount |
$ 89,460
|
|
| InvestmentCompanyPortfolioTurnover |
67.00%
|
|
| Additional Fund Statistics [Text Block] |
Total Net Assets |
$28,918,644 |
# of Portfolio Holdings |
31 |
Portfolio Turnover Rate |
67% |
Total Management Fees Paid |
$89,460 | |
|
| Holdings [Text Block] |
Asset Allocation - % Investments
Value |
Value |
Common Stocks |
99.2 |
Investment Companies |
0.8 | Sector Allocation - % Equities
Value |
Value |
Consumer Staples |
1.3 |
Energy |
1.8 |
Consumer Discretionary |
9.4 |
Health Care |
10.1 |
Financials |
10.6 |
Industrials |
11.7 |
Communication Services |
14.9 |
Materials |
17.3 |
Information Technology |
22.9 | |
|
| Largest Holdings [Text Block] |
Top Ten Holdings - % Net Assets
Ultra Clean Holdings, Inc. |
5.3 |
Ecovyst, Inc. |
5.0 |
NCR Voyix Corp. |
5.0 |
Madison Square Garden Sports Corp. |
4.9 |
Elanco Animal Health, Inc. |
4.8 |
Penn Entertainment, Inc. |
4.7 |
Tenable Holdings, Inc. |
4.7 |
Topgolf Callaway Brands Corp. |
4.6 |
MKS, Inc. |
4.5 |
Ashland, Inc. |
4.4 | Excludes cash equivalents. |
|
| Material Fund Change [Text Block] |
|
|
| C000233647 |
|
|
| Shareholder Report [Line Items] |
|
|
| Fund Name |
Shapiro SMID Cap Equity Fund
|
|
| Class Name |
C
|
|
| Trading Symbol |
SHDCX
|
|
| Annual or Semi-Annual Statement [Text Block] |
This annual shareholder report contains important information about American Beacon Shapiro SMID Cap Equity Fund for the period of July 1, 2024 to June 30, 2025.
|
|
| Shareholder Report Annual or Semi-Annual |
Annual Shareholder Report
|
|
| Additional Information [Text Block] |
You can find additional information about the Fund at www.americanbeaconfunds.com/literature. You can also request this information by contacting us at 800-658-5811.
|
|
| Additional Information Phone Number |
800-658-5811
|
|
| Additional Information Website |
<span style="box-sizing: border-box; color: rgb(0, 0, 0); display: inline; flex-wrap: nowrap; font-size: 13.3333px; font-weight: 400; grid-area: auto; line-height: 16px; margin: 0px; overflow: visible; text-align: left; text-align-last: auto; white-space-collapse: preserve-breaks;">www.americanbeaconfunds.com/literature</span>
|
|
| Expenses [Text Block] |
What were the Fund costs for the last year?(based on a hypothetical $10,000 investment)
Class Name |
Costs of a $10,000 investment |
Costs paid as a percentage of a $10,000 investment |
Class C |
$193 |
2.01% | |
|
| Expenses Paid, Amount |
$ 193
|
|
| Expense Ratio, Percent |
2.01%
|
|
| Factors Affecting Performance [Text Block] |
How did the Fund perform and what affected its performance? The C Class of the Fund returned -8.64% (with sales charges) and -7.64% (without sales charges) for the twelve months ended June 30, 2025, compared to the S&P 500 Index return of 15.16% and the Russell 2500 Value Index return of 10.47%. • Over the period, smaller capitalization companies generally lagged the overall market, while mega-cap growth companies benefited from continued momentum within the AI theme. • Continued higher interest rates and higher tariff expectations were particularly challenging for the Fund’s holdings in undervalued and out-of-favor companies. • The sub-advisor’s stock selection in the Information Technology and Communication Services sectors materially detracted from Fund performance, while stock selection in the Consumer Discretionary sector contributed positively to performance. |
|
| Performance Past Does Not Indicate Future [Text] |
Performance shown is historical and is not indicative of future returns.
|
|
| Line Graph [Table Text Block] |
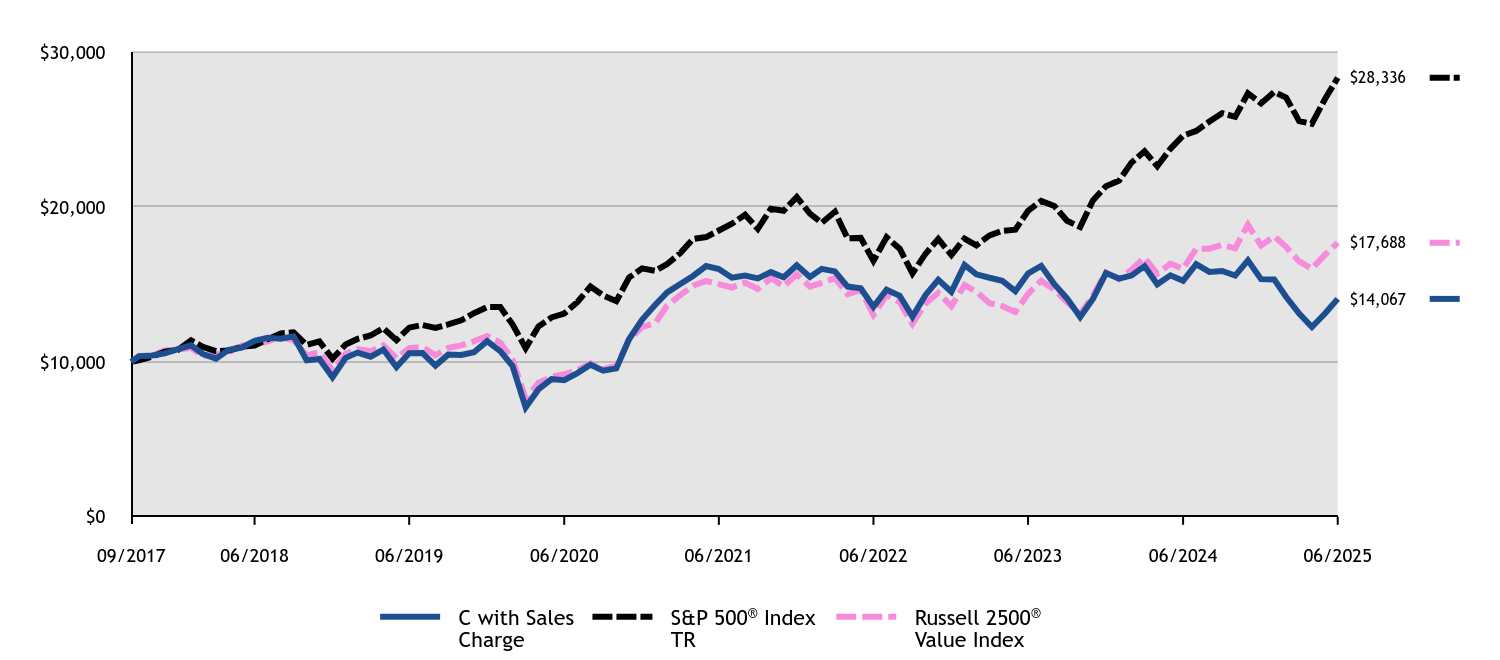
|
C with Sales Charge |
S&P 500® Index TR |
Russell 2500® Value Index |
09/2017 |
$10,000 |
$10,000 |
$10,000 |
09/2017 |
$10,370 |
$10,101 |
$10,343 |
10/2017 |
$10,410 |
$10,336 |
$10,399 |
11/2017 |
$10,550 |
$10,653 |
$10,740 |
12/2017 |
$10,820 |
$10,772 |
$10,782 |
01/2018 |
$11,070 |
$11,388 |
$10,918 |
02/2018 |
$10,510 |
$10,969 |
$10,382 |
03/2018 |
$10,210 |
$10,690 |
$10,497 |
04/2018 |
$10,780 |
$10,731 |
$10,611 |
05/2018 |
$10,930 |
$10,989 |
$11,047 |
06/2018 |
$11,360 |
$11,057 |
$11,105 |
07/2018 |
$11,560 |
$11,468 |
$11,326 |
08/2018 |
$11,500 |
$11,842 |
$11,584 |
09/2018 |
$11,650 |
$11,910 |
$11,402 |
10/2018 |
$10,100 |
$11,096 |
$10,427 |
11/2018 |
$10,190 |
$11,322 |
$10,624 |
12/2018 |
$9,005 |
$10,211 |
$9,450 |
01/2019 |
$10,263 |
$11,125 |
$10,506 |
02/2019 |
$10,602 |
$11,482 |
$10,834 |
03/2019 |
$10,340 |
$11,705 |
$10,689 |
04/2019 |
$10,799 |
$12,179 |
$11,064 |
05/2019 |
$9,672 |
$11,405 |
$10,230 |
06/2019 |
$10,558 |
$12,209 |
$10,892 |
07/2019 |
$10,580 |
$12,384 |
$10,963 |
08/2019 |
$9,760 |
$12,188 |
$10,429 |
09/2019 |
$10,471 |
$12,416 |
$10,906 |
10/2019 |
$10,449 |
$12,685 |
$11,063 |
11/2019 |
$10,624 |
$13,146 |
$11,335 |
12/2019 |
$11,343 |
$13,542 |
$11,677 |
01/2020 |
$10,699 |
$13,537 |
$11,251 |
02/2020 |
$9,738 |
$12,423 |
$10,166 |
03/2020 |
$7,066 |
$10,888 |
$7,632 |
04/2020 |
$8,226 |
$12,284 |
$8,641 |
05/2020 |
$8,894 |
$12,869 |
$9,036 |
06/2020 |
$8,824 |
$13,125 |
$9,204 |
07/2020 |
$9,281 |
$13,865 |
$9,481 |
08/2020 |
$9,820 |
$14,862 |
$9,911 |
09/2020 |
$9,433 |
$14,297 |
$9,530 |
10/2020 |
$9,585 |
$13,917 |
$9,745 |
11/2020 |
$11,460 |
$15,440 |
$11,450 |
12/2020 |
$12,733 |
$16,034 |
$12,246 |
01/2021 |
$13,694 |
$15,872 |
$12,517 |
02/2021 |
$14,490 |
$16,310 |
$13,631 |
03/2021 |
$15,024 |
$17,024 |
$14,307 |
04/2021 |
$15,546 |
$17,933 |
$14,921 |
05/2021 |
$16,187 |
$18,058 |
$15,224 |
06/2021 |
$15,997 |
$18,479 |
$15,023 |
07/2021 |
$15,439 |
$18,918 |
$14,803 |
08/2021 |
$15,569 |
$19,494 |
$15,115 |
09/2021 |
$15,391 |
$18,587 |
$14,712 |
10/2021 |
$15,795 |
$19,889 |
$15,411 |
11/2021 |
$15,463 |
$19,751 |
$14,875 |
12/2021 |
$16,232 |
$20,637 |
$15,649 |
01/2022 |
$15,479 |
$19,569 |
$14,853 |
02/2022 |
$16,004 |
$18,983 |
$15,095 |
03/2022 |
$15,842 |
$19,688 |
$15,414 |
04/2022 |
$14,861 |
$17,971 |
$14,369 |
05/2022 |
$14,753 |
$18,004 |
$14,644 |
06/2022 |
$13,556 |
$16,518 |
$13,041 |
07/2022 |
$14,659 |
$18,041 |
$14,304 |
08/2022 |
$14,269 |
$17,305 |
$13,855 |
09/2022 |
$12,924 |
$15,711 |
$12,454 |
10/2022 |
$14,323 |
$16,983 |
$13,769 |
11/2022 |
$15,304 |
$17,932 |
$14,460 |
12/2022 |
$14,525 |
$16,899 |
$13,601 |
01/2023 |
$16,254 |
$17,961 |
$14,960 |
02/2023 |
$15,650 |
$17,523 |
$14,536 |
03/2023 |
$15,431 |
$18,166 |
$13,791 |
04/2023 |
$15,239 |
$18,450 |
$13,607 |
05/2023 |
$14,567 |
$18,530 |
$13,219 |
06/2023 |
$15,705 |
$19,754 |
$14,394 |
07/2023 |
$16,199 |
$20,389 |
$15,237 |
08/2023 |
$15,019 |
$20,064 |
$14,651 |
09/2023 |
$14,100 |
$19,108 |
$13,867 |
10/2023 |
$12,893 |
$18,706 |
$13,089 |
11/2023 |
$14,059 |
$20,414 |
$14,276 |
12/2023 |
$15,735 |
$21,342 |
$15,775 |
01/2024 |
$15,379 |
$21,700 |
$15,332 |
02/2024 |
$15,572 |
$22,859 |
$15,947 |
03/2024 |
$16,180 |
$23,594 |
$16,732 |
04/2024 |
$15,008 |
$22,631 |
$15,680 |
05/2024 |
$15,587 |
$23,753 |
$16,341 |
06/2024 |
$15,231 |
$24,605 |
$16,012 |
07/2024 |
$16,313 |
$24,905 |
$17,308 |
08/2024 |
$15,809 |
$25,509 |
$17,308 |
09/2024 |
$15,868 |
$26,053 |
$17,553 |
10/2024 |
$15,572 |
$25,817 |
$17,332 |
11/2024 |
$16,551 |
$27,333 |
$18,861 |
12/2024 |
$15,341 |
$26,681 |
$17,507 |
01/2025 |
$15,325 |
$27,424 |
$18,103 |
02/2025 |
$14,207 |
$27,066 |
$17,434 |
03/2025 |
$13,120 |
$25,541 |
$16,486 |
04/2025 |
$12,251 |
$25,368 |
$16,009 |
05/2025 |
$13,120 |
$26,965 |
$16,923 |
06/2025 |
$14,067 |
$28,336 |
$17,688 |
|
|
| Average Annual Return [Table Text Block] |
HEADER |
1 Year |
5 Years |
Since Inception (9/12/17) |
Class C without Deferred Sales ChargeFootnote Reference1 |
(7.64)% |
9.78% |
4.47% |
Class C with Maximum Deferred Sales Charge -1.00%Footnote Reference1 |
(8.64)% |
9.78% |
4.47% |
S&P 500® Index TR |
15.16% |
16.64% |
14.29% |
Russell 2500® Value Index |
10.47% |
13.96% |
7.59% | |
|
| Performance Inception Date |
Sep. 12, 2017
|
|
| No Deduction of Taxes [Text Block] |
The graph and table do not reflect the deduction of taxes that a shareholder would pay on fund distributions or redemption of fund shares.
|
|
| AssetsNet |
$ 28,918,644
|
|
| Holdings Count | Holding |
31
|
|
| Advisory Fees Paid, Amount |
$ 89,460
|
|
| InvestmentCompanyPortfolioTurnover |
67.00%
|
|
| Additional Fund Statistics [Text Block] |
Total Net Assets |
$28,918,644 |
# of Portfolio Holdings |
31 |
Portfolio Turnover Rate |
67% |
Total Management Fees Paid |
$89,460 | |
|
| Holdings [Text Block] |
Asset Allocation - % Investments
Value |
Value |
Common Stocks |
99.2 |
Investment Companies |
0.8 | Sector Allocation - % Equities
Value |
Value |
Consumer Staples |
1.3 |
Energy |
1.8 |
Consumer Discretionary |
9.4 |
Health Care |
10.1 |
Financials |
10.6 |
Industrials |
11.7 |
Communication Services |
14.9 |
Materials |
17.3 |
Information Technology |
22.9 | |
|
| Largest Holdings [Text Block] |
Top Ten Holdings - % Net Assets
Ultra Clean Holdings, Inc. |
5.3 |
Ecovyst, Inc. |
5.0 |
NCR Voyix Corp. |
5.0 |
Madison Square Garden Sports Corp. |
4.9 |
Elanco Animal Health, Inc. |
4.8 |
Penn Entertainment, Inc. |
4.7 |
Tenable Holdings, Inc. |
4.7 |
Topgolf Callaway Brands Corp. |
4.6 |
MKS, Inc. |
4.5 |
Ashland, Inc. |
4.4 | Excludes cash equivalents. |
|
| Material Fund Change [Text Block] |
|
|
| C000192441 |
|
|
| Shareholder Report [Line Items] |
|
|
| Fund Name |
Shapiro SMID Cap Equity Fund
|
|
| Class Name |
R5
|
|
| Trading Symbol |
SHDIX
|
|
| Annual or Semi-Annual Statement [Text Block] |
This annual shareholder report contains important information about American Beacon Shapiro SMID Cap Equity Fund for the period of July 1, 2024 to June 30, 2025.
|
|
| Shareholder Report Annual or Semi-Annual |
Annual Shareholder Report
|
|
| Additional Information [Text Block] |
You can find additional information about the Fund at www.americanbeaconfunds.com/literature. You can also request this information by contacting us at 800-658-5811.
|
|
| Additional Information Phone Number |
800-658-5811
|
|
| Additional Information Website |
<span style="box-sizing: border-box; color: rgb(0, 0, 0); display: inline; flex-wrap: nowrap; font-size: 13.3333px; font-weight: 400; grid-area: auto; line-height: 16px; margin: 0px; overflow: visible; text-align: left; text-align-last: auto; white-space-collapse: preserve-breaks;">www.americanbeaconfunds.com/literature</span>
|
|
| Expenses [Text Block] |
What were the Fund costs for the last year?(based on a hypothetical $10,000 investment)
Class Name |
Costs of a $10,000 investment |
Costs paid as a percentage of a $10,000 investment |
R5 |
$86 |
0.89% | |
|
| Expenses Paid, Amount |
$ 86
|
|
| Expense Ratio, Percent |
0.89%
|
|
| Factors Affecting Performance [Text Block] |
How did the Fund perform and what affected its performance? The R5 Class of the Fund returned -6.59% for the twelve months ended June 30, 2025, compared to the S&P 500 Index return of 15.16% and the Russell 2500 Value Index return of 10.47%. • Over the period, smaller capitalization companies generally lagged the overall market, while mega-cap growth companies benefited from continued momentum within the AI theme. • Continued higher interest rates and higher tariff expectations were particularly challenging for the Fund’s holdings in undervalued and out-of-favor companies. • The sub-advisor’s stock selection in the Information Technology and Communication Services sectors materially detracted from Fund performance, while stock selection in the Consumer Discretionary sector contributed positively to performance. |
|
| Performance Past Does Not Indicate Future [Text] |
Performance shown is historical and is not indicative of future returns.
|
|
| Line Graph [Table Text Block] |
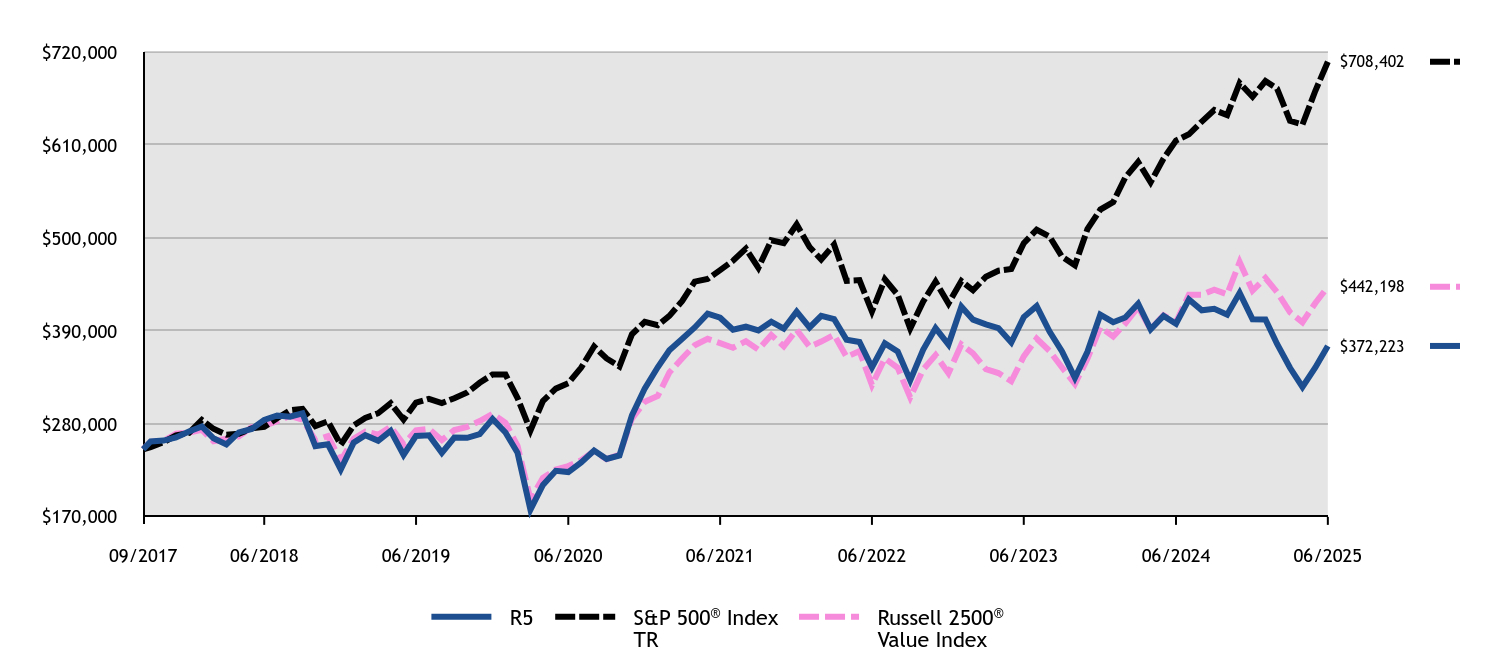
|
R5 |
S&P 500® Index TR |
Russell 2500® Value Index |
09/2017 |
$250,000 |
$250,000 |
$250,000 |
09/2017 |
$259,250 |
$252,514 |
$258,569 |
10/2017 |
$260,250 |
$258,406 |
$259,979 |
11/2017 |
$264,000 |
$266,331 |
$268,492 |
12/2017 |
$271,000 |
$269,293 |
$269,561 |
01/2018 |
$277,000 |
$284,711 |
$272,958 |
02/2018 |
$263,000 |
$274,217 |
$259,560 |
03/2018 |
$255,750 |
$267,248 |
$262,413 |
04/2018 |
$270,000 |
$268,274 |
$265,264 |
05/2018 |
$274,000 |
$274,734 |
$276,172 |
06/2018 |
$284,750 |
$276,425 |
$277,637 |
07/2018 |
$290,000 |
$286,712 |
$283,150 |
08/2018 |
$288,500 |
$296,055 |
$289,590 |
09/2018 |
$292,500 |
$297,740 |
$285,058 |
10/2018 |
$253,750 |
$277,389 |
$260,687 |
11/2018 |
$256,000 |
$283,042 |
$265,609 |
12/2018 |
$226,114 |
$255,285 |
$236,249 |
01/2019 |
$257,830 |
$278,120 |
$262,650 |
02/2019 |
$266,579 |
$287,050 |
$270,852 |
03/2019 |
$260,017 |
$292,628 |
$267,237 |
04/2019 |
$271,774 |
$304,476 |
$276,610 |
05/2019 |
$243,339 |
$285,127 |
$255,750 |
06/2019 |
$265,759 |
$305,222 |
$272,295 |
07/2019 |
$266,579 |
$309,608 |
$274,066 |
08/2019 |
$245,800 |
$304,704 |
$260,721 |
09/2019 |
$263,845 |
$310,405 |
$272,650 |
10/2019 |
$263,572 |
$317,129 |
$276,578 |
11/2019 |
$267,946 |
$328,640 |
$283,364 |
12/2019 |
$285,916 |
$338,559 |
$291,921 |
01/2020 |
$269,820 |
$338,426 |
$281,287 |
02/2020 |
$245,823 |
$310,567 |
$254,161 |
03/2020 |
$178,514 |
$272,208 |
$190,796 |
04/2020 |
$207,779 |
$307,104 |
$216,024 |
05/2020 |
$224,460 |
$321,730 |
$225,889 |
06/2020 |
$222,997 |
$328,129 |
$230,093 |
07/2020 |
$234,410 |
$346,630 |
$237,014 |
08/2020 |
$248,457 |
$371,546 |
$247,780 |
09/2020 |
$238,507 |
$357,429 |
$238,243 |
10/2020 |
$242,604 |
$347,923 |
$243,623 |
11/2020 |
$290,013 |
$386,008 |
$286,251 |
12/2020 |
$322,092 |
$400,850 |
$306,159 |
01/2021 |
$346,983 |
$396,803 |
$312,921 |
02/2021 |
$367,132 |
$407,745 |
$340,769 |
03/2021 |
$380,763 |
$425,602 |
$357,683 |
04/2021 |
$394,097 |
$448,316 |
$373,035 |
05/2021 |
$410,394 |
$451,447 |
$380,611 |
06/2021 |
$405,653 |
$461,986 |
$375,582 |
07/2021 |
$391,430 |
$472,961 |
$370,084 |
08/2021 |
$394,986 |
$487,341 |
$377,887 |
09/2021 |
$390,541 |
$464,675 |
$367,812 |
10/2021 |
$400,912 |
$497,231 |
$385,278 |
11/2021 |
$392,615 |
$493,786 |
$371,867 |
12/2021 |
$412,814 |
$515,915 |
$391,213 |
01/2022 |
$394,050 |
$489,218 |
$371,329 |
02/2022 |
$407,788 |
$474,570 |
$377,384 |
03/2022 |
$404,102 |
$492,191 |
$385,341 |
04/2022 |
$379,641 |
$449,271 |
$359,223 |
05/2022 |
$376,961 |
$450,095 |
$366,100 |
06/2022 |
$346,804 |
$412,943 |
$326,030 |
07/2022 |
$375,285 |
$451,018 |
$357,591 |
08/2022 |
$365,568 |
$432,624 |
$346,375 |
09/2022 |
$331,390 |
$392,780 |
$311,347 |
10/2022 |
$367,579 |
$424,580 |
$344,220 |
11/2022 |
$393,379 |
$448,308 |
$361,511 |
12/2022 |
$373,871 |
$422,479 |
$340,024 |
01/2023 |
$418,681 |
$449,025 |
$373,998 |
02/2023 |
$403,288 |
$438,069 |
$363,410 |
03/2023 |
$397,815 |
$454,152 |
$344,767 |
04/2023 |
$393,369 |
$461,241 |
$340,173 |
05/2023 |
$376,266 |
$463,246 |
$330,465 |
06/2023 |
$406,367 |
$493,855 |
$359,841 |
07/2023 |
$419,365 |
$509,720 |
$380,935 |
08/2023 |
$389,264 |
$501,604 |
$366,269 |
09/2023 |
$365,662 |
$477,689 |
$346,667 |
10/2023 |
$334,534 |
$467,645 |
$327,216 |
11/2023 |
$365,320 |
$510,353 |
$356,911 |
12/2023 |
$409,200 |
$533,538 |
$394,364 |
01/2024 |
$400,344 |
$542,504 |
$383,298 |
02/2024 |
$405,879 |
$571,471 |
$398,663 |
03/2024 |
$422,114 |
$589,858 |
$418,303 |
04/2024 |
$391,857 |
$565,766 |
$392,002 |
05/2024 |
$407,724 |
$593,819 |
$408,524 |
06/2024 |
$398,499 |
$615,126 |
$400,294 |
07/2024 |
$427,280 |
$622,614 |
$432,710 |
08/2024 |
$414,365 |
$637,717 |
$432,693 |
09/2024 |
$416,210 |
$651,336 |
$438,831 |
10/2024 |
$409,200 |
$645,430 |
$433,300 |
11/2024 |
$435,028 |
$683,317 |
$471,528 |
12/2024 |
$403,820 |
$667,028 |
$437,679 |
01/2025 |
$403,435 |
$685,603 |
$452,576 |
02/2025 |
$374,535 |
$676,657 |
$435,842 |
03/2025 |
$346,407 |
$638,531 |
$412,154 |
04/2025 |
$323,672 |
$634,202 |
$400,226 |
05/2025 |
$346,792 |
$674,121 |
$423,071 |
06/2025 |
$372,223 |
$708,402 |
$442,198 |
|
|
| Average Annual Return [Table Text Block] |
HEADER |
1 Year |
5 Years |
Since Inception (9/12/17) |
Class R5Footnote Reference1 |
(6.59)% |
10.79% |
5.24% |
S&P 500® Index TR |
15.16% |
16.64% |
14.29% |
Russell 2500® Value Index |
10.47% |
13.96% |
7.59% | |
|
| Performance Inception Date |
Sep. 12, 2017
|
|
| No Deduction of Taxes [Text Block] |
The graph and table do not reflect the deduction of taxes that a shareholder would pay on fund distributions or redemption of fund shares.
|
|
| AssetsNet |
$ 28,918,644
|
|
| Holdings Count | Holding |
31
|
|
| Advisory Fees Paid, Amount |
$ 89,460
|
|
| InvestmentCompanyPortfolioTurnover |
67.00%
|
|
| Additional Fund Statistics [Text Block] |
Total Net Assets |
$28,918,644 |
# of Portfolio Holdings |
31 |
Portfolio Turnover Rate |
67% |
Total Management Fees Paid |
$89,460 | |
|
| Holdings [Text Block] |
Asset Allocation - % Investments
Value |
Value |
Common Stocks |
99.2 |
Investment Companies |
0.8 | Sector Allocation - % Equities
Value |
Value |
Consumer Staples |
1.3 |
Energy |
1.8 |
Consumer Discretionary |
9.4 |
Health Care |
10.1 |
Financials |
10.6 |
Industrials |
11.7 |
Communication Services |
14.9 |
Materials |
17.3 |
Information Technology |
22.9 | |
|
| Largest Holdings [Text Block] |
Top Ten Holdings - % Net Assets
Ultra Clean Holdings, Inc. |
5.3 |
Ecovyst, Inc. |
5.0 |
NCR Voyix Corp. |
5.0 |
Madison Square Garden Sports Corp. |
4.9 |
Elanco Animal Health, Inc. |
4.8 |
Penn Entertainment, Inc. |
4.7 |
Tenable Holdings, Inc. |
4.7 |
Topgolf Callaway Brands Corp. |
4.6 |
MKS, Inc. |
4.5 |
Ashland, Inc. |
4.4 | Excludes cash equivalents. |
|
| Material Fund Change [Text Block] |
|
|
| C000192443 |
|
|
| Shareholder Report [Line Items] |
|
|
| Fund Name |
Shapiro SMID Cap Equity Fund
|
|
| Class Name |
Y
|
|
| Trading Symbol |
SHDYX
|
|
| Annual or Semi-Annual Statement [Text Block] |
This annual shareholder report contains important information about American Beacon Shapiro SMID Cap Equity Fund for the period of July 1, 2024 to June 30, 2025.
|
|
| Shareholder Report Annual or Semi-Annual |
Annual Shareholder Report
|
|
| Additional Information [Text Block] |
You can find additional information about the Fund at www.americanbeaconfunds.com/literature. You can also request this information by contacting us at 800-658-5811.
|
|
| Additional Information Phone Number |
800-658-5811
|
|
| Additional Information Website |
<span style="box-sizing: border-box; color: rgb(0, 0, 0); display: inline; flex-wrap: nowrap; font-size: 13.3333px; font-weight: 400; grid-area: auto; line-height: 16px; margin: 0px; overflow: visible; text-align: left; text-align-last: auto; white-space-collapse: preserve-breaks;">www.americanbeaconfunds.com/literature</span>
|
|
| Expenses [Text Block] |
What were the Fund costs for the last year?(based on a hypothetical $10,000 investment)
Class Name |
Costs of a $10,000 investment |
Costs paid as a percentage of a $10,000 investment |
Y |
$93 |
0.96% | |
|
| Expenses Paid, Amount |
$ 93
|
|
| Expense Ratio, Percent |
0.96%
|
|
| Factors Affecting Performance [Text Block] |
How did the Fund perform and what affected its performance? The Y Class of the Fund returned -6.74% for the twelve months ended June 30, 2025, compared to the S&P 500 Index return of 15.16% and the Russell 2500 Value Index return of 10.47%. • Over the period, smaller capitalization companies generally lagged the overall market, while mega-cap growth companies benefited from continued momentum within the AI theme. • Continued higher interest rates and higher tariff expectations were particularly challenging for the Fund’s holdings in undervalued and out-of-favor companies. • The sub-advisor’s stock selection in the Information Technology and Communication Services sectors materially detracted from Fund performance, while stock selection in the Consumer Discretionary sector contributed positively to performance. |
|
| Performance Past Does Not Indicate Future [Text] |
Performance shown is historical and is not indicative of future returns.
|
|
| Line Graph [Table Text Block] |
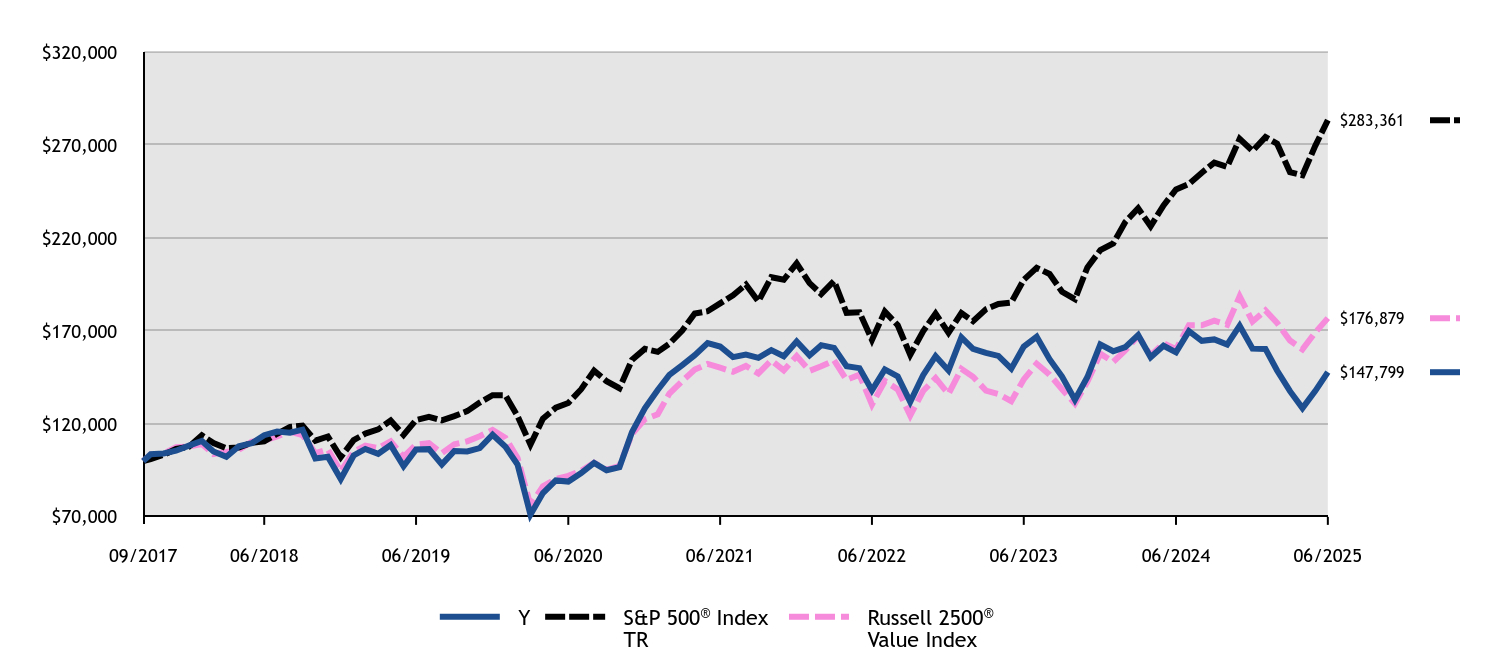
#ERROR:A result could not be returned because the conditional could not be evaluated to a True/False value (#ERROR:Invalid Formula (#!=""), 'Multiple values from an iterator cannot be used in a formula unless they are aggregrated.') |
Y |
S&P 500® Index TR |
Russell 2500® Value Index |
09/2017 |
$100,000 |
$100,000 |
$100,000 |
09/2017 |
$103,700 |
$101,006 |
$103,428 |
10/2017 |
$104,100 |
$103,362 |
$103,992 |
11/2017 |
$105,600 |
$106,533 |
$107,397 |
12/2017 |
$108,300 |
$107,717 |
$107,824 |
01/2018 |
$110,800 |
$113,884 |
$109,183 |
02/2018 |
$105,200 |
$109,687 |
$103,824 |
03/2018 |
$102,300 |
$106,899 |
$104,965 |
04/2018 |
$108,000 |
$107,310 |
$106,106 |
05/2018 |
$109,600 |
$109,894 |
$110,469 |
06/2018 |
$113,900 |
$110,570 |
$111,055 |
07/2018 |
$115,900 |
$114,685 |
$113,260 |
08/2018 |
$115,300 |
$118,422 |
$115,836 |
09/2018 |
$116,900 |
$119,096 |
$114,023 |
10/2018 |
$101,400 |
$110,956 |
$104,275 |
11/2018 |
$102,300 |
$113,217 |
$106,244 |
12/2018 |
$90,346 |
$102,114 |
$94,500 |
01/2019 |
$103,034 |
$111,248 |
$105,060 |
02/2019 |
$106,534 |
$114,820 |
$108,341 |
03/2019 |
$103,909 |
$117,051 |
$106,895 |
04/2019 |
$108,612 |
$121,790 |
$110,644 |
05/2019 |
$97,237 |
$114,051 |
$102,300 |
06/2019 |
$106,206 |
$122,089 |
$108,918 |
07/2019 |
$106,424 |
$123,843 |
$109,626 |
08/2019 |
$98,221 |
$121,882 |
$104,288 |
09/2019 |
$105,440 |
$124,162 |
$109,060 |
10/2019 |
$105,221 |
$126,851 |
$110,631 |
11/2019 |
$106,971 |
$131,456 |
$113,346 |
12/2019 |
$114,160 |
$135,424 |
$116,768 |
01/2020 |
$107,720 |
$135,371 |
$112,515 |
02/2020 |
$98,119 |
$124,227 |
$101,664 |
03/2020 |
$71,189 |
$108,883 |
$76,318 |
04/2020 |
$82,781 |
$122,841 |
$86,410 |
05/2020 |
$89,572 |
$128,692 |
$90,356 |
06/2020 |
$88,986 |
$131,251 |
$92,037 |
07/2020 |
$93,553 |
$138,652 |
$94,806 |
08/2020 |
$99,056 |
$148,619 |
$99,112 |
09/2020 |
$95,075 |
$142,972 |
$95,297 |
10/2020 |
$96,714 |
$139,169 |
$97,449 |
11/2020 |
$115,565 |
$154,403 |
$114,500 |
12/2020 |
$128,400 |
$160,340 |
$122,464 |
01/2021 |
$138,241 |
$158,721 |
$125,168 |
02/2021 |
$146,303 |
$163,098 |
$136,308 |
03/2021 |
$151,638 |
$170,241 |
$143,073 |
04/2021 |
$156,973 |
$179,326 |
$149,214 |
05/2021 |
$163,494 |
$180,579 |
$152,245 |
06/2021 |
$161,597 |
$184,794 |
$150,233 |
07/2021 |
$155,906 |
$189,184 |
$148,033 |
08/2021 |
$157,329 |
$194,937 |
$151,155 |
09/2021 |
$155,550 |
$185,870 |
$147,125 |
10/2021 |
$159,700 |
$198,892 |
$154,111 |
11/2021 |
$156,380 |
$197,514 |
$148,747 |
12/2021 |
$164,347 |
$206,366 |
$156,485 |
01/2022 |
$156,834 |
$195,687 |
$148,532 |
02/2022 |
$162,334 |
$189,828 |
$150,954 |
03/2022 |
$160,858 |
$196,876 |
$154,136 |
04/2022 |
$151,065 |
$179,708 |
$143,689 |
05/2022 |
$149,991 |
$180,038 |
$146,440 |
06/2022 |
$138,051 |
$165,177 |
$130,412 |
07/2022 |
$149,321 |
$180,407 |
$143,037 |
08/2022 |
$145,564 |
$173,050 |
$138,550 |
09/2022 |
$131,880 |
$157,112 |
$124,539 |
10/2022 |
$146,235 |
$169,832 |
$137,688 |
11/2022 |
$156,431 |
$179,323 |
$144,604 |
12/2022 |
$148,755 |
$168,991 |
$136,009 |
01/2023 |
$166,561 |
$179,610 |
$149,599 |
02/2023 |
$160,398 |
$175,228 |
$145,364 |
03/2023 |
$158,206 |
$181,661 |
$137,907 |
04/2023 |
$156,562 |
$184,496 |
$136,069 |
05/2023 |
$149,714 |
$185,298 |
$132,186 |
06/2023 |
$161,630 |
$197,542 |
$143,936 |
07/2023 |
$166,835 |
$203,888 |
$152,374 |
08/2023 |
$154,782 |
$200,642 |
$146,508 |
09/2023 |
$145,467 |
$191,076 |
$138,667 |
10/2023 |
$133,003 |
$187,058 |
$130,886 |
11/2023 |
$145,193 |
$204,141 |
$142,764 |
12/2023 |
$162,765 |
$213,415 |
$157,745 |
01/2024 |
$159,069 |
$217,002 |
$153,319 |
02/2024 |
$161,287 |
$228,589 |
$159,465 |
03/2024 |
$167,792 |
$235,943 |
$167,321 |
04/2024 |
$155,817 |
$226,306 |
$156,801 |
05/2024 |
$162,026 |
$237,528 |
$163,409 |
06/2024 |
$158,478 |
$246,051 |
$160,117 |
07/2024 |
$169,861 |
$249,046 |
$173,084 |
08/2024 |
$164,687 |
$255,087 |
$173,077 |
09/2024 |
$165,426 |
$260,535 |
$175,532 |
10/2024 |
$162,617 |
$258,172 |
$173,320 |
11/2024 |
$172,818 |
$273,327 |
$188,611 |
12/2024 |
$160,463 |
$266,811 |
$175,071 |
01/2025 |
$160,308 |
$274,241 |
$181,030 |
02/2025 |
$148,725 |
$270,663 |
$174,337 |
03/2025 |
$137,606 |
$255,413 |
$164,862 |
04/2025 |
$128,494 |
$253,681 |
$160,090 |
05/2025 |
$137,760 |
$269,648 |
$169,228 |
06/2025 |
$147,799 |
$283,361 |
$176,879 |
|
|
| Average Annual Return [Table Text Block] |
HEADER |
1 Year |
5 Years |
Since Inception (9/12/17) |
Class YFootnote Reference1 |
(6.74)% |
10.68% |
5.14% |
S&P 500® Index TR |
15.16% |
16.64% |
14.29% |
Russell 2500® Value Index |
10.47% |
13.96% |
7.59% | |
|
| Performance Inception Date |
Sep. 12, 2017
|
|
| No Deduction of Taxes [Text Block] |
The graph and table do not reflect the deduction of taxes that a shareholder would pay on fund distributions or redemption of fund shares.
|
|
| AssetsNet |
$ 28,918,644
|
|
| Holdings Count | Holding |
31
|
|
| Advisory Fees Paid, Amount |
$ 89,460
|
|
| InvestmentCompanyPortfolioTurnover |
67.00%
|
|
| Additional Fund Statistics [Text Block] |
Total Net Assets |
$28,918,644 |
# of Portfolio Holdings |
31 |
Portfolio Turnover Rate |
67% |
Total Management Fees Paid |
$89,460 | |
|
| Holdings [Text Block] |
Asset Allocation - % Investments
Value |
Value |
Common Stocks |
99.2 |
Investment Companies |
0.8 | Sector Allocation - % Equities
Value |
Value |
Consumer Staples |
1.3 |
Energy |
1.8 |
Consumer Discretionary |
9.4 |
Health Care |
10.1 |
Financials |
10.6 |
Industrials |
11.7 |
Communication Services |
14.9 |
Materials |
17.3 |
Information Technology |
22.9 | |
|
| Largest Holdings [Text Block] |
Top Ten Holdings - % Net Assets
Ultra Clean Holdings, Inc. |
5.3 |
Ecovyst, Inc. |
5.0 |
NCR Voyix Corp. |
5.0 |
Madison Square Garden Sports Corp. |
4.9 |
Elanco Animal Health, Inc. |
4.8 |
Penn Entertainment, Inc. |
4.7 |
Tenable Holdings, Inc. |
4.7 |
Topgolf Callaway Brands Corp. |
4.6 |
MKS, Inc. |
4.5 |
Ashland, Inc. |
4.4 | Excludes cash equivalents. |
|
| Material Fund Change [Text Block] |
|
|
| C000192442 |
|
|
| Shareholder Report [Line Items] |
|
|
| Fund Name |
Shapiro SMID Cap Equity Fund
|
|
| Class Name |
Investor
|
|
| Trading Symbol |
SHDPX
|
|
| Annual or Semi-Annual Statement [Text Block] |
This annual shareholder report contains important information about American Beacon Shapiro SMID Cap Equity Fund for the period of July 1, 2024 to June 30, 2025.
|
|
| Shareholder Report Annual or Semi-Annual |
Annual Shareholder Report
|
|
| Additional Information [Text Block] |
You can find additional information about the Fund at www.americanbeaconfunds.com/literature. You can also request this information by contacting us at 800-658-5811.
|
|
| Additional Information Phone Number |
800-658-5811
|
|
| Additional Information Website |
<span style="box-sizing: border-box; color: rgb(0, 0, 0); display: inline; flex-wrap: nowrap; font-size: 13.3333px; font-weight: 400; grid-area: auto; line-height: 16px; margin: 0px; overflow: visible; text-align: left; text-align-last: auto; white-space-collapse: preserve-breaks;">www.americanbeaconfunds.com/literature</span>
|
|
| Expenses [Text Block] |
What were the Fund costs for the last year?(based on a hypothetical $10,000 investment)
Class Name |
Costs of a $10,000 investment |
Costs paid as a percentage of a $10,000 investment |
Investor |
$113 |
1.17% | |
|
| Expenses Paid, Amount |
$ 113
|
|
| Expense Ratio, Percent |
1.17%
|
|
| Factors Affecting Performance [Text Block] |
How did the Fund perform and what affected its performance? The Investor Class of the Fund returned -6.89% for the twelve months ended June 30, 2025, compared to the S&P 500 Index return of 15.16% and the Russell 2500 Value Index return of 10.47%. • Over the period, smaller capitalization companies generally lagged the overall market, while mega-cap growth companies benefited from continued momentum within the AI theme. • Continued higher interest rates and higher tariff expectations were particularly challenging for the Fund’s holdings in undervalued and out-of-favor companies. • The sub-advisor’s stock selection in the Information Technology and Communication Services sectors materially detracted from Fund performance, while stock selection in the Consumer Discretionary sector contributed positively to performance. |
|
| Performance Past Does Not Indicate Future [Text] |
Performance shown is historical and is not indicative of future returns.
|
|
| Line Graph [Table Text Block] |
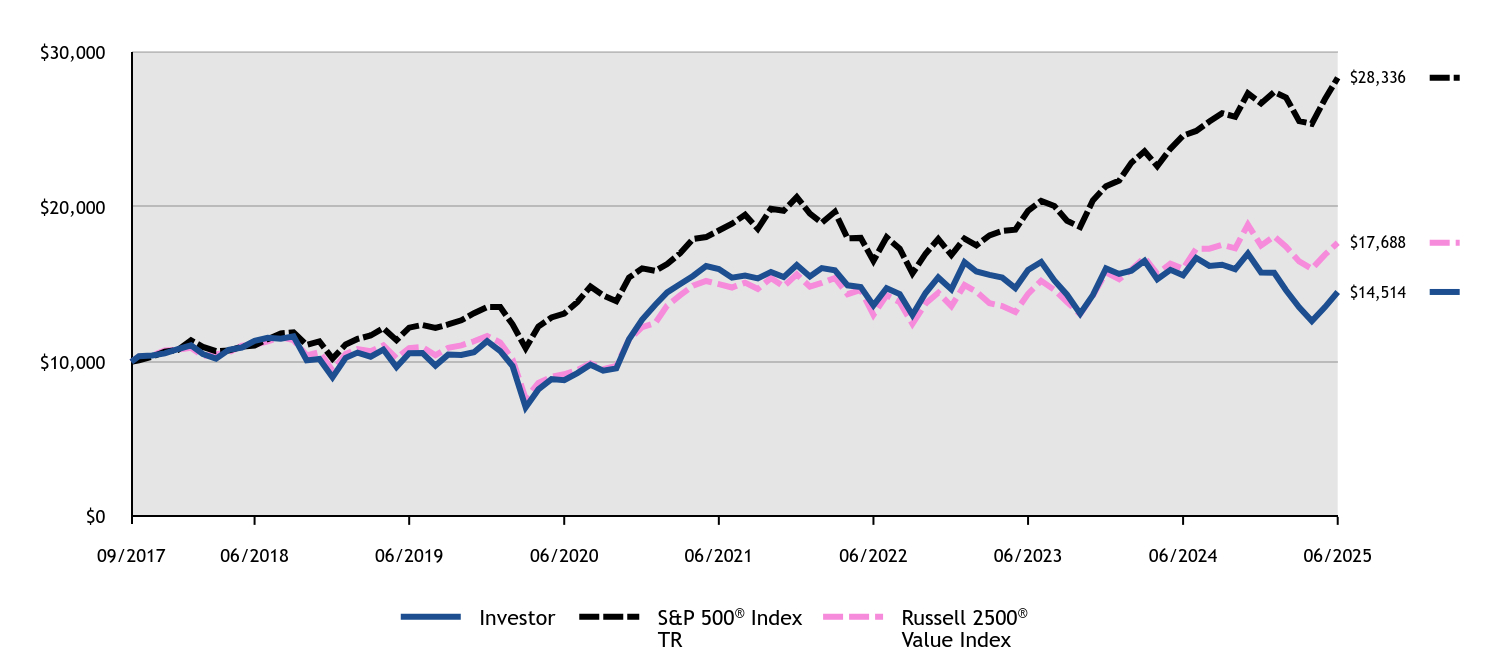
|
Investor |
S&P 500® Index TR |
Russell 2500® Value Index |
09/2017 |
$10,000 |
$10,000 |
$10,000 |
09/2017 |
$10,370 |
$10,101 |
$10,343 |
10/2017 |
$10,410 |
$10,336 |
$10,399 |
11/2017 |
$10,550 |
$10,653 |
$10,740 |
12/2017 |
$10,820 |
$10,772 |
$10,782 |
01/2018 |
$11,070 |
$11,388 |
$10,918 |
02/2018 |
$10,510 |
$10,969 |
$10,382 |
03/2018 |
$10,210 |
$10,690 |
$10,497 |
04/2018 |
$10,780 |
$10,731 |
$10,611 |
05/2018 |
$10,930 |
$10,989 |
$11,047 |
06/2018 |
$11,360 |
$11,057 |
$11,105 |
07/2018 |
$11,560 |
$11,468 |
$11,326 |
08/2018 |
$11,500 |
$11,842 |
$11,584 |
09/2018 |
$11,650 |
$11,910 |
$11,402 |
10/2018 |
$10,100 |
$11,096 |
$10,427 |
11/2018 |
$10,190 |
$11,322 |
$10,624 |
12/2018 |
$9,005 |
$10,211 |
$9,450 |
01/2019 |
$10,263 |
$11,125 |
$10,506 |
02/2019 |
$10,602 |
$11,482 |
$10,834 |
03/2019 |
$10,340 |
$11,705 |
$10,689 |
04/2019 |
$10,799 |
$12,179 |
$11,064 |
05/2019 |
$9,672 |
$11,405 |
$10,230 |
06/2019 |
$10,558 |
$12,209 |
$10,892 |
07/2019 |
$10,580 |
$12,384 |
$10,963 |
08/2019 |
$9,760 |
$12,188 |
$10,429 |
09/2019 |
$10,471 |
$12,416 |
$10,906 |
10/2019 |
$10,449 |
$12,685 |
$11,063 |
11/2019 |
$10,624 |
$13,146 |
$11,335 |
12/2019 |
$11,343 |
$13,542 |
$11,677 |
01/2020 |
$10,699 |
$13,537 |
$11,251 |
02/2020 |
$9,738 |
$12,423 |
$10,166 |
03/2020 |
$7,066 |
$10,888 |
$7,632 |
04/2020 |
$8,226 |
$12,284 |
$8,641 |
05/2020 |
$8,894 |
$12,869 |
$9,036 |
06/2020 |
$8,824 |
$13,125 |
$9,204 |
07/2020 |
$9,281 |
$13,865 |
$9,481 |
08/2020 |
$9,820 |
$14,862 |
$9,911 |
09/2020 |
$9,433 |
$14,297 |
$9,530 |
10/2020 |
$9,585 |
$13,917 |
$9,745 |
11/2020 |
$11,460 |
$15,440 |
$11,450 |
12/2020 |
$12,733 |
$16,034 |
$12,246 |
01/2021 |
$13,694 |
$15,872 |
$12,517 |
02/2021 |
$14,490 |
$16,310 |
$13,631 |
03/2021 |
$15,024 |
$17,024 |
$14,307 |
04/2021 |
$15,546 |
$17,933 |
$14,921 |
05/2021 |
$16,187 |
$18,058 |
$15,224 |
06/2021 |
$15,997 |
$18,479 |
$15,023 |
07/2021 |
$15,439 |
$18,918 |
$14,803 |
08/2021 |
$15,569 |
$19,494 |
$15,115 |
09/2021 |
$15,391 |
$18,587 |
$14,712 |
10/2021 |
$15,807 |
$19,889 |
$15,411 |
11/2021 |
$15,474 |
$19,751 |
$14,875 |
12/2021 |
$16,259 |
$20,637 |
$15,649 |
01/2022 |
$15,519 |
$19,569 |
$14,853 |
02/2022 |
$16,057 |
$18,983 |
$15,095 |
03/2022 |
$15,909 |
$19,688 |
$15,414 |
04/2022 |
$14,941 |
$17,971 |
$14,369 |
05/2022 |
$14,834 |
$18,004 |
$14,644 |
06/2022 |
$13,650 |
$16,518 |
$13,041 |
07/2022 |
$14,753 |
$18,041 |
$14,304 |
08/2022 |
$14,376 |
$17,305 |
$13,855 |
09/2022 |
$13,031 |
$15,711 |
$12,454 |
10/2022 |
$14,444 |
$16,983 |
$13,769 |
11/2022 |
$15,452 |
$17,932 |
$14,460 |
12/2022 |
$14,682 |
$16,899 |
$13,601 |
01/2023 |
$16,440 |
$17,961 |
$14,960 |
02/2023 |
$15,836 |
$17,523 |
$14,536 |
03/2023 |
$15,616 |
$18,166 |
$13,791 |
04/2023 |
$15,438 |
$18,450 |
$13,607 |
05/2023 |
$14,765 |
$18,530 |
$13,219 |
06/2023 |
$15,932 |
$19,754 |
$14,394 |
07/2023 |
$16,454 |
$20,389 |
$15,237 |
08/2023 |
$15,259 |
$20,064 |
$14,651 |
09/2023 |
$14,339 |
$19,108 |
$13,867 |
10/2023 |
$13,117 |
$18,706 |
$13,089 |
11/2023 |
$14,312 |
$20,414 |
$14,276 |
12/2023 |
$16,033 |
$21,342 |
$15,775 |
01/2024 |
$15,676 |
$21,700 |
$15,332 |
02/2024 |
$15,884 |
$22,859 |
$15,947 |
03/2024 |
$16,522 |
$23,594 |
$16,732 |
04/2024 |
$15,335 |
$22,631 |
$15,680 |
05/2024 |
$15,943 |
$23,753 |
$16,341 |
06/2024 |
$15,587 |
$24,605 |
$16,012 |
07/2024 |
$16,715 |
$24,905 |
$17,308 |
08/2024 |
$16,196 |
$25,509 |
$17,308 |
09/2024 |
$16,270 |
$26,053 |
$17,553 |
10/2024 |
$15,988 |
$25,817 |
$17,332 |
11/2024 |
$16,997 |
$27,333 |
$18,861 |
12/2024 |
$15,771 |
$26,681 |
$17,507 |
01/2025 |
$15,756 |
$27,424 |
$18,103 |
02/2025 |
$14,622 |
$27,066 |
$17,434 |
03/2025 |
$13,520 |
$25,541 |
$16,486 |
04/2025 |
$12,636 |
$25,368 |
$16,009 |
05/2025 |
$13,536 |
$26,965 |
$16,923 |
06/2025 |
$14,514 |
$28,336 |
$17,688 |
|
|
| Average Annual Return [Table Text Block] |
HEADER |
1 Year |
5 Years |
Since Inception (9/12/17) |
Investor ClassFootnote Reference1 |
(6.89)% |
10.47% |
4.89% |
S&P 500® Index TR |
15.16% |
16.64% |
14.29% |
Russell 2500® Value Index |
10.47% |
13.96% |
7.59% | |
|
| Performance Inception Date |
Sep. 12, 2017
|
|
| No Deduction of Taxes [Text Block] |
The graph and table do not reflect the deduction of taxes that a shareholder would pay on fund distributions or redemption of fund shares.
|
|
| AssetsNet |
$ 28,918,644
|
|
| Holdings Count | Holding |
31
|
|
| Advisory Fees Paid, Amount |
$ 89,460
|
|
| InvestmentCompanyPortfolioTurnover |
67.00%
|
|
| Additional Fund Statistics [Text Block] |
Total Net Assets |
$28,918,644 |
# of Portfolio Holdings |
31 |
Portfolio Turnover Rate |
67% |
Total Management Fees Paid |
$89,460 | |
|
| Holdings [Text Block] |
Asset Allocation - % Investments
Value |
Value |
Common Stocks |
99.2 |
Investment Companies |
0.8 | Sector Allocation - % Equities
Value |
Value |
Consumer Staples |
1.3 |
Energy |
1.8 |
Consumer Discretionary |
9.4 |
Health Care |
10.1 |
Financials |
10.6 |
Industrials |
11.7 |
Communication Services |
14.9 |
Materials |
17.3 |
Information Technology |
22.9 | |
|
| Largest Holdings [Text Block] |
Top Ten Holdings - % Net Assets
Ultra Clean Holdings, Inc. |
5.3 |
Ecovyst, Inc. |
5.0 |
NCR Voyix Corp. |
5.0 |
Madison Square Garden Sports Corp. |
4.9 |
Elanco Animal Health, Inc. |
4.8 |
Penn Entertainment, Inc. |
4.7 |
Tenable Holdings, Inc. |
4.7 |
Topgolf Callaway Brands Corp. |
4.6 |
MKS, Inc. |
4.5 |
Ashland, Inc. |
4.4 | Excludes cash equivalents. |
|
| Material Fund Change [Text Block] |
|
|
| C000233646 |
|
|
| Shareholder Report [Line Items] |
|
|
| Fund Name |
Shapiro SMID Cap Equity Fund
|
|
| Class Name |
R6
|
|
| Trading Symbol |
SHDRX
|
|
| Annual or Semi-Annual Statement [Text Block] |
This annual shareholder report contains important information about American Beacon Shapiro SMID Cap Equity Fund for the period of July 1, 2024 to June 30, 2025.
|
|
| Shareholder Report Annual or Semi-Annual |
Annual Shareholder Report
|
|
| Additional Information [Text Block] |
You can find additional information about the Fund at www.americanbeaconfunds.com/literature. You can also request this information by contacting us at 800-658-5811.
|
|
| Additional Information Phone Number |
800-658-5811
|
|
| Additional Information Website |
<span style="box-sizing: border-box; color: rgb(0, 0, 0); display: inline; flex-wrap: nowrap; font-size: 13.3333px; font-weight: 400; grid-area: auto; line-height: 16px; margin: 0px; overflow: visible; text-align: left; text-align-last: auto; white-space-collapse: preserve-breaks;">www.americanbeaconfunds.com/literature</span>
|
|
| Expenses [Text Block] |
What were the Fund costs for the last year?(based on a hypothetical $10,000 investment)
Class Name |
Costs of a $10,000 investment |
Costs paid as a percentage of a $10,000 investment |
R6 |
$86 |
0.89% | |
|
| Expenses Paid, Amount |
$ 86
|
|
| Expense Ratio, Percent |
0.89%
|
|
| Factors Affecting Performance [Text Block] |
How did the Fund perform and what affected its performance? The R6 Class of the Fund returned -6.59% for the twelve months ended June 30, 2025, compared to the S&P 500 Index return of 15.16% and the Russell 2500 Value Index return of 10.47%. • Over the period, smaller capitalization companies generally lagged the overall market, while mega-cap growth companies benefited from continued momentum within the AI theme. • Continued higher interest rates and higher tariff expectations were particularly challenging for the Fund’s holdings in undervalued and out-of-favor companies. • The sub-advisor’s stock selection in the Information Technology and Communication Services sectors materially detracted from Fund performance, while stock selection in the Consumer Discretionary sector contributed positively to performance. |
|
| Performance Past Does Not Indicate Future [Text] |
Performance shown is historical and is not indicative of future returns.
|
|
| Line Graph [Table Text Block] |
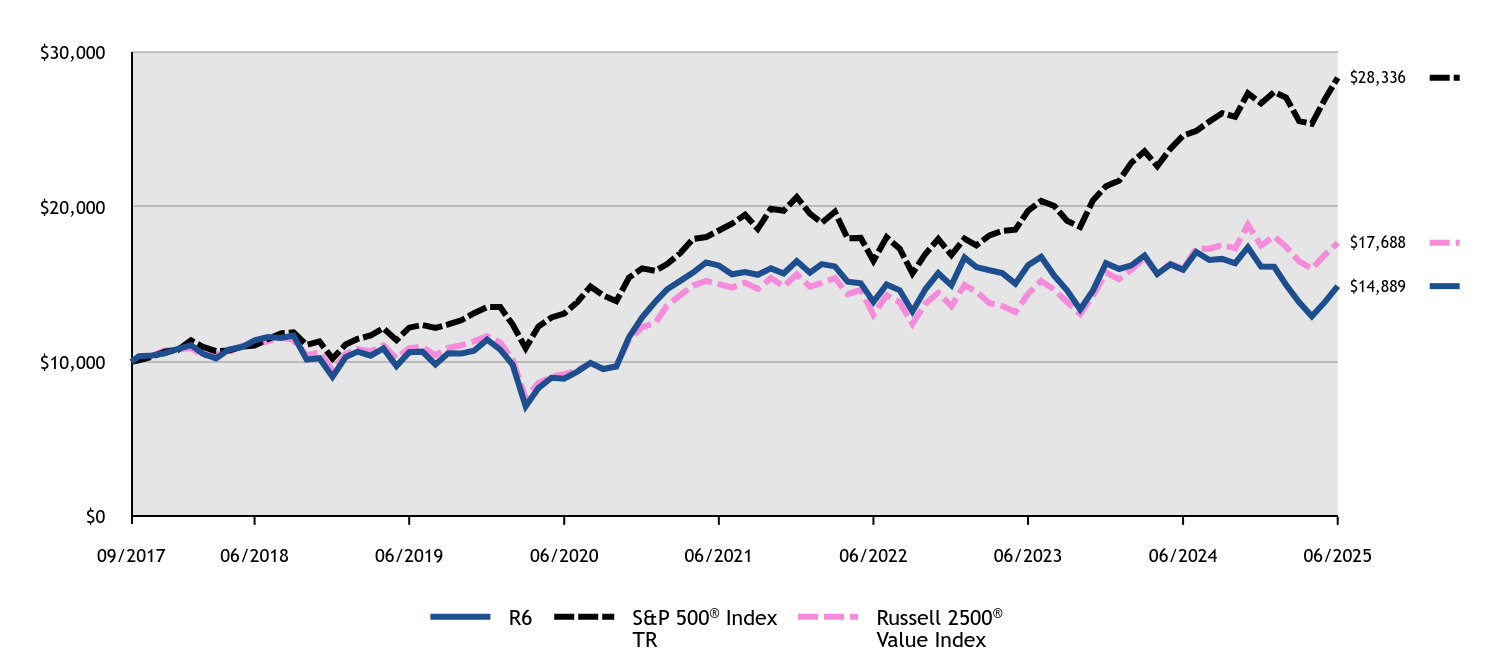
|
R6 |
S&P 500® Index TR |
Russell 2500® Value Index |
09/2017 |
$10,000 |
$10,000 |
$10,000 |
09/2017 |
$10,370 |
$10,101 |
$10,343 |
10/2017 |
$10,410 |
$10,336 |
$10,399 |
11/2017 |
$10,560 |
$10,653 |
$10,740 |
12/2017 |
$10,840 |
$10,772 |
$10,782 |
01/2018 |
$11,080 |
$11,388 |
$10,918 |
02/2018 |
$10,520 |
$10,969 |
$10,382 |
03/2018 |
$10,230 |
$10,690 |
$10,497 |
04/2018 |
$10,800 |
$10,731 |
$10,611 |
05/2018 |
$10,960 |
$10,989 |
$11,047 |
06/2018 |
$11,390 |
$11,057 |
$11,105 |
07/2018 |
$11,600 |
$11,468 |
$11,326 |
08/2018 |
$11,540 |
$11,842 |
$11,584 |
09/2018 |
$11,700 |
$11,910 |
$11,402 |
10/2018 |
$10,150 |
$11,096 |
$10,427 |
11/2018 |
$10,240 |
$11,322 |
$10,624 |
12/2018 |
$9,045 |
$10,211 |
$9,450 |
01/2019 |
$10,313 |
$11,125 |
$10,506 |
02/2019 |
$10,663 |
$11,482 |
$10,834 |
03/2019 |
$10,401 |
$11,705 |
$10,689 |
04/2019 |
$10,871 |
$12,179 |
$11,064 |
05/2019 |
$9,734 |
$11,405 |
$10,230 |
06/2019 |
$10,630 |
$12,209 |
$10,892 |
07/2019 |
$10,663 |
$12,384 |
$10,963 |
08/2019 |
$9,832 |
$12,188 |
$10,429 |
09/2019 |
$10,554 |
$12,416 |
$10,906 |
10/2019 |
$10,543 |
$12,685 |
$11,063 |
11/2019 |
$10,718 |
$13,146 |
$11,335 |
12/2019 |
$11,437 |
$13,542 |
$11,677 |
01/2020 |
$10,793 |
$13,537 |
$11,251 |
02/2020 |
$9,833 |
$12,423 |
$10,166 |
03/2020 |
$7,141 |
$10,888 |
$7,632 |
04/2020 |
$8,311 |
$12,284 |
$8,641 |
05/2020 |
$8,978 |
$12,869 |
$9,036 |
06/2020 |
$8,920 |
$13,125 |
$9,204 |
07/2020 |
$9,376 |
$13,865 |
$9,481 |
08/2020 |
$9,938 |
$14,862 |
$9,911 |
09/2020 |
$9,540 |
$14,297 |
$9,530 |
10/2020 |
$9,704 |
$13,917 |
$9,745 |
11/2020 |
$11,601 |
$15,440 |
$11,450 |
12/2020 |
$12,884 |
$16,034 |
$12,246 |
01/2021 |
$13,879 |
$15,872 |
$12,517 |
02/2021 |
$14,685 |
$16,310 |
$13,631 |
03/2021 |
$15,231 |
$17,024 |
$14,307 |
04/2021 |
$15,764 |
$17,933 |
$14,921 |
05/2021 |
$16,416 |
$18,058 |
$15,224 |
06/2021 |
$16,226 |
$18,479 |
$15,023 |
07/2021 |
$15,657 |
$18,918 |
$14,803 |
08/2021 |
$15,799 |
$19,494 |
$15,115 |
09/2021 |
$15,622 |
$18,587 |
$14,712 |
10/2021 |
$16,036 |
$19,889 |
$15,411 |
11/2021 |
$15,705 |
$19,751 |
$14,875 |
12/2021 |
$16,513 |
$20,637 |
$15,649 |
01/2022 |
$15,762 |
$19,569 |
$14,853 |
02/2022 |
$16,312 |
$18,983 |
$15,095 |
03/2022 |
$16,164 |
$19,688 |
$15,414 |
04/2022 |
$15,172 |
$17,971 |
$14,369 |
05/2022 |
$15,078 |
$18,004 |
$14,644 |
06/2022 |
$13,872 |
$16,518 |
$13,041 |
07/2022 |
$14,998 |
$18,041 |
$14,304 |
08/2022 |
$14,623 |
$17,305 |
$13,855 |
09/2022 |
$13,256 |
$15,711 |
$12,454 |
10/2022 |
$14,703 |
$16,983 |
$13,769 |
11/2022 |
$15,722 |
$17,932 |
$14,460 |
12/2022 |
$14,941 |
$16,899 |
$13,601 |
01/2023 |
$16,734 |
$17,961 |
$14,960 |
02/2023 |
$16,118 |
$17,523 |
$14,536 |
03/2023 |
$15,913 |
$18,166 |
$13,791 |
04/2023 |
$15,735 |
$18,450 |
$13,607 |
05/2023 |
$15,051 |
$18,530 |
$13,219 |
06/2023 |
$16,241 |
$19,754 |
$14,394 |
07/2023 |
$16,775 |
$20,389 |
$15,237 |
08/2023 |
$15,557 |
$20,064 |
$14,651 |
09/2023 |
$14,626 |
$19,108 |
$13,867 |
10/2023 |
$13,381 |
$18,706 |
$13,089 |
11/2023 |
$14,599 |
$20,414 |
$14,276 |
12/2023 |
$16,368 |
$21,342 |
$15,775 |
01/2024 |
$15,999 |
$21,700 |
$15,332 |
02/2024 |
$16,235 |
$22,859 |
$15,947 |
03/2024 |
$16,870 |
$23,594 |
$16,732 |
04/2024 |
$15,674 |
$22,631 |
$15,680 |
05/2024 |
$16,294 |
$23,753 |
$16,341 |
06/2024 |
$15,940 |
$24,605 |
$16,012 |
07/2024 |
$17,091 |
$24,905 |
$17,308 |
08/2024 |
$16,575 |
$25,509 |
$17,308 |
09/2024 |
$16,648 |
$26,053 |
$17,553 |
10/2024 |
$16,368 |
$25,817 |
$17,332 |
11/2024 |
$17,401 |
$27,333 |
$18,861 |
12/2024 |
$16,153 |
$26,681 |
$17,507 |
01/2025 |
$16,137 |
$27,424 |
$18,103 |
02/2025 |
$14,981 |
$27,066 |
$17,434 |
03/2025 |
$13,841 |
$25,541 |
$16,486 |
04/2025 |
$12,947 |
$25,368 |
$16,009 |
05/2025 |
$13,872 |
$26,965 |
$16,923 |
06/2025 |
$14,889 |
$28,336 |
$17,688 |
|
|
| Average Annual Return [Table Text Block] |
HEADER |
1 Year |
5 Years |
Since Inception (9/12/17) |
R6 ClassFootnote Reference1 |
(6.59)% |
10.79% |
5.24% |
S&P 500® Index TR |
15.16% |
16.64% |
14.29% |
Russell 2500® Value Index |
10.47% |
13.96% |
7.59% | |
|
| Performance Inception Date |
Sep. 12, 2017
|
|
| No Deduction of Taxes [Text Block] |
The graph and table do not reflect the deduction of taxes that a shareholder would pay on fund distributions or redemption of fund shares.
|
|
| AssetsNet |
$ 28,918,644
|
|
| Holdings Count | Holding |
31
|
|
| Advisory Fees Paid, Amount |
$ 89,460
|
|
| InvestmentCompanyPortfolioTurnover |
67.00%
|
|
| Additional Fund Statistics [Text Block] |
Total Net Assets |
$28,918,644 |
# of Portfolio Holdings |
31 |
Portfolio Turnover Rate |
67% |
Total Management Fees Paid |
$89,460 | |
|
| Holdings [Text Block] |
Asset Allocation - % Investments
Value |
Value |
Common Stocks |
99.2 |
Investment Companies |
0.8 | Sector Allocation - % Equities
Value |
Value |
Consumer Staples |
1.3 |
Energy |
1.8 |
Consumer Discretionary |
9.4 |
Health Care |
10.1 |
Financials |
10.6 |
Industrials |
11.7 |
Communication Services |
14.9 |
Materials |
17.3 |
Information Technology |
22.9 | |
|
| Largest Holdings [Text Block] |
Top Ten Holdings - % Net Assets
Ultra Clean Holdings, Inc. |
5.3 |
Ecovyst, Inc. |
5.0 |
NCR Voyix Corp. |
5.0 |
Madison Square Garden Sports Corp. |
4.9 |
Elanco Animal Health, Inc. |
4.8 |
Penn Entertainment, Inc. |
4.7 |
Tenable Holdings, Inc. |
4.7 |
Topgolf Callaway Brands Corp. |
4.6 |
MKS, Inc. |
4.5 |
Ashland, Inc. |
4.4 | Excludes cash equivalents. |
|
| Material Fund Change [Text Block] |
|
|
| C000233650 |
|
|
| Shareholder Report [Line Items] |
|
|
| Fund Name |
Shapiro Equity Opportunities Fund
|
|
| Class Name |
A
|
|
| Trading Symbol |
SHXAX
|
|
| Annual or Semi-Annual Statement [Text Block] |
This annual shareholder report contains important information about American Beacon Shapiro Equity Opportunities Fund for the period of July 1, 2024 to June 30, 2025.
|
|
| Shareholder Report Annual or Semi-Annual |
Annual Shareholder Report
|
|
| Additional Information [Text Block] |
You can find additional information about the Fund at www.americanbeaconfunds.com/literature. You can also request this information by contacting us at 800-658-5811.
|
|
| Additional Information Phone Number |
800-658-5811
|
|
| Additional Information Website |
<span style="box-sizing: border-box; color: rgb(0, 0, 0); display: inline; flex-wrap: nowrap; font-size: 13.3333px; font-weight: 400; grid-area: auto; line-height: 16px; margin: 0px; overflow: visible; text-align: left; text-align-last: auto; white-space-collapse: preserve-breaks;">www.americanbeaconfunds.com/literature</span>
|
|
| Expenses [Text Block] |
What were the Fund costs for the last year?(based on a hypothetical $10,000 investment)
Class Name |
Costs of a $10,000 investment |
Costs paid as a percentage of a $10,000 investment |
Class A |
$110 |
1.07% | |
|
| Expenses Paid, Amount |
$ 110
|
|
| Expense Ratio, Percent |
1.07%
|
|
| Factors Affecting Performance [Text Block] |
How did the Fund perform and what affected its performance? The A Class of the Fund returned -1.18% (with sales charges) and 4.87% (without sales charges) for the twelve months ended June 30, 2025, compared to the S&P 500 Index return of 15.16% and the Russell 3000 Value Index return of 13.30%. • Broad market performance was driven significantly by AI-themed companies. • Continued higher interest rates and higher tariff expectations were particularly challenging for the Fund’s holdings in undervalued and out-of-favor companies. • The Fund’s investments in corporate spin-off situations lagged the overall market and caused the Fund’s performance to suffer substantially. • The Fund’s underperformance was mainly driven by the sub-advisor’s stock selection decisions in the Communication Services and Industrials sectors, while stock selection in the Consumer Discretionary sector contributed to performance. |
|
| Performance Past Does Not Indicate Future [Text] |
Performance shown is historical and is not indicative of future returns.
|
|
| Line Graph [Table Text Block] |
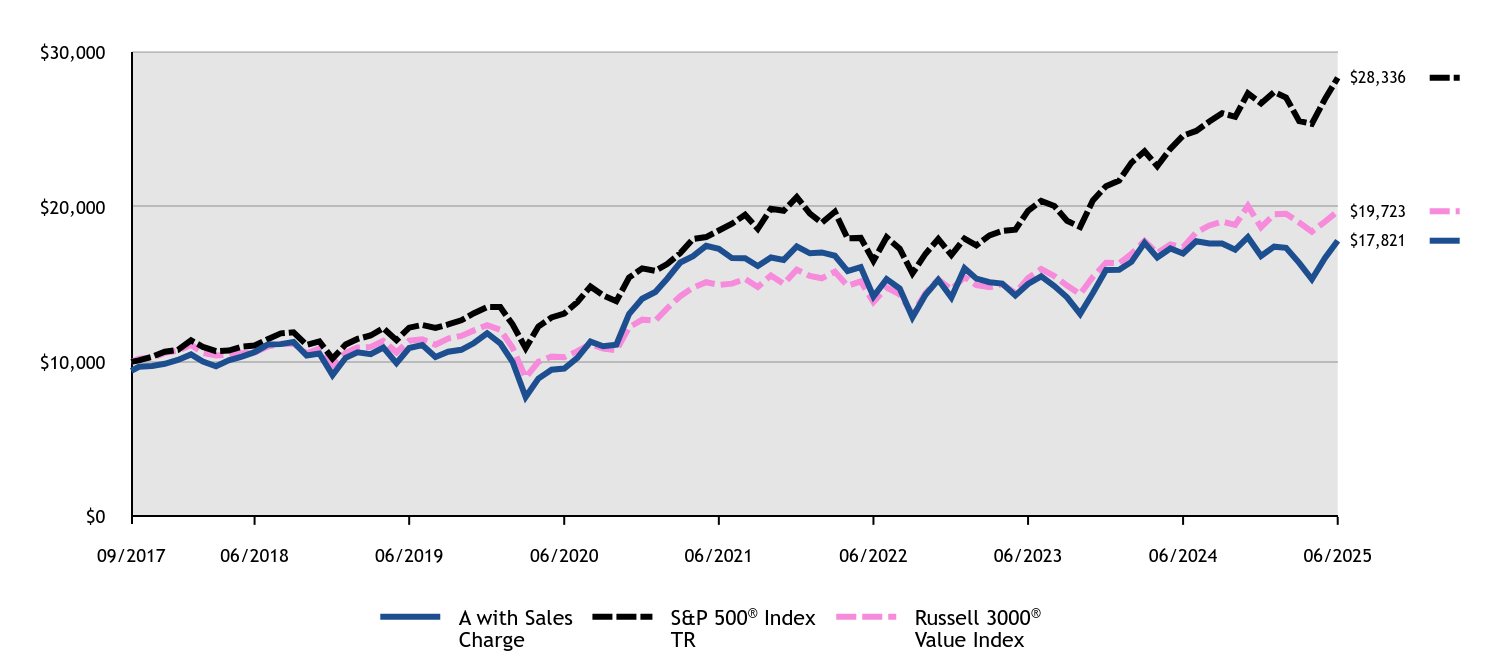
|
A with Sales Charge |
S&P 500® Index TR |
Russell 3000® Value Index |
09/2017 |
$9,425 |
$10,000 |
$10,000 |
09/2017 |
$9,689 |
$10,101 |
$10,201 |
10/2017 |
$9,736 |
$10,336 |
$10,270 |
11/2017 |
$9,877 |
$10,653 |
$10,583 |
12/2017 |
$10,129 |
$10,772 |
$10,718 |
01/2018 |
$10,487 |
$11,388 |
$11,112 |
02/2018 |
$10,025 |
$10,969 |
$10,580 |
03/2018 |
$9,723 |
$10,690 |
$10,416 |
04/2018 |
$10,100 |
$10,731 |
$10,461 |
05/2018 |
$10,346 |
$10,989 |
$10,565 |
06/2018 |
$10,629 |
$11,057 |
$10,594 |
07/2018 |
$11,120 |
$11,468 |
$10,996 |
08/2018 |
$11,148 |
$11,842 |
$11,166 |
09/2018 |
$11,280 |
$11,910 |
$11,165 |
10/2018 |
$10,412 |
$11,096 |
$10,556 |
11/2018 |
$10,544 |
$11,322 |
$10,861 |
12/2018 |
$9,147 |
$10,211 |
$9,799 |
01/2019 |
$10,266 |
$11,125 |
$10,583 |
02/2019 |
$10,616 |
$11,482 |
$10,926 |
03/2019 |
$10,499 |
$11,705 |
$10,969 |
04/2019 |
$10,927 |
$12,179 |
$11,359 |
05/2019 |
$9,925 |
$11,405 |
$10,616 |
06/2019 |
$10,898 |
$12,209 |
$11,372 |
07/2019 |
$11,083 |
$12,384 |
$11,461 |
08/2019 |
$10,314 |
$12,188 |
$11,104 |
09/2019 |
$10,655 |
$12,416 |
$11,511 |
10/2019 |
$10,781 |
$12,685 |
$11,680 |
11/2019 |
$11,219 |
$13,146 |
$12,035 |
12/2019 |
$11,850 |
$13,542 |
$12,372 |
01/2020 |
$11,195 |
$13,537 |
$12,079 |
02/2020 |
$10,008 |
$12,423 |
$10,909 |
03/2020 |
$7,736 |
$10,888 |
$8,992 |
04/2020 |
$8,923 |
$12,284 |
$10,009 |
05/2020 |
$9,496 |
$12,869 |
$10,348 |
06/2020 |
$9,568 |
$13,125 |
$10,300 |
07/2020 |
$10,264 |
$13,865 |
$10,697 |
08/2020 |
$11,308 |
$14,862 |
$11,146 |
09/2020 |
$11,011 |
$14,297 |
$10,859 |
10/2020 |
$11,113 |
$13,917 |
$10,746 |
11/2020 |
$13,088 |
$15,440 |
$12,228 |
12/2020 |
$14,075 |
$16,034 |
$12,728 |
01/2021 |
$14,514 |
$15,872 |
$12,662 |
02/2021 |
$15,371 |
$16,310 |
$13,456 |
03/2021 |
$16,416 |
$17,024 |
$14,241 |
04/2021 |
$16,823 |
$17,933 |
$14,791 |
05/2021 |
$17,492 |
$18,058 |
$15,144 |
06/2021 |
$17,304 |
$18,479 |
$14,976 |
07/2021 |
$16,698 |
$18,918 |
$15,052 |
08/2021 |
$16,687 |
$19,494 |
$15,357 |
09/2021 |
$16,186 |
$18,587 |
$14,837 |
10/2021 |
$16,740 |
$19,889 |
$15,578 |
11/2021 |
$16,583 |
$19,751 |
$15,031 |
12/2021 |
$17,457 |
$20,637 |
$15,957 |
01/2022 |
$17,009 |
$19,569 |
$15,549 |
02/2022 |
$17,065 |
$18,983 |
$15,396 |
03/2022 |
$16,853 |
$19,688 |
$15,822 |
04/2022 |
$15,857 |
$17,971 |
$14,908 |
05/2022 |
$16,114 |
$18,004 |
$15,197 |
06/2022 |
$14,223 |
$16,518 |
$13,859 |
07/2022 |
$15,342 |
$18,041 |
$14,803 |
08/2022 |
$14,738 |
$17,305 |
$14,361 |
09/2022 |
$12,880 |
$15,711 |
$13,089 |
10/2022 |
$14,335 |
$16,983 |
$14,449 |
11/2022 |
$15,297 |
$17,932 |
$15,324 |
12/2022 |
$14,156 |
$16,899 |
$14,683 |
01/2023 |
$16,043 |
$17,961 |
$15,481 |
02/2023 |
$15,373 |
$17,523 |
$14,947 |
03/2023 |
$15,142 |
$18,166 |
$14,817 |
04/2023 |
$15,057 |
$18,450 |
$15,007 |
05/2023 |
$14,290 |
$18,530 |
$14,444 |
06/2023 |
$15,032 |
$19,754 |
$15,414 |
07/2023 |
$15,519 |
$20,389 |
$15,992 |
08/2023 |
$14,898 |
$20,064 |
$15,540 |
09/2023 |
$14,168 |
$19,108 |
$14,928 |
10/2023 |
$13,097 |
$18,706 |
$14,380 |
11/2023 |
$14,448 |
$20,414 |
$15,477 |
12/2023 |
$15,928 |
$21,342 |
$16,395 |
01/2024 |
$15,940 |
$21,700 |
$16,366 |
02/2024 |
$16,454 |
$22,859 |
$16,966 |
03/2024 |
$17,680 |
$23,594 |
$17,808 |
04/2024 |
$16,736 |
$22,631 |
$17,026 |
05/2024 |
$17,324 |
$23,753 |
$17,580 |
06/2024 |
$16,994 |
$24,605 |
$17,407 |
07/2024 |
$17,790 |
$24,905 |
$18,358 |
08/2024 |
$17,643 |
$25,509 |
$18,807 |
09/2024 |
$17,643 |
$26,053 |
$19,055 |
10/2024 |
$17,239 |
$25,817 |
$18,841 |
11/2024 |
$18,047 |
$27,333 |
$20,075 |
12/2024 |
$16,836 |
$26,681 |
$18,687 |
01/2025 |
$17,439 |
$27,424 |
$19,527 |
02/2025 |
$17,365 |
$27,066 |
$19,566 |
03/2025 |
$16,392 |
$25,541 |
$18,994 |
04/2025 |
$15,332 |
$25,368 |
$18,406 |
05/2025 |
$16,712 |
$26,965 |
$19,058 |
06/2025 |
$17,821 |
$28,336 |
$19,723 |
|
|
| Average Annual Return [Table Text Block] |
HEADER |
1 Year |
5 Years |
Since Inception (9/12/17) |
Class A without Sales ChargeFootnote Reference1 |
4.87% |
13.25% |
8.51% |
Class A with Maximum Sales Charge - 5.75%Footnote Reference1 |
(1.18)% |
11.91% |
7.69% |
S&P 500® Index TR |
15.16% |
16.64% |
14.29% |
Russell 3000® Value Index |
13.30% |
13.87% |
9.10% | |
|
| Performance Inception Date |
Sep. 12, 2017
|
|
| No Deduction of Taxes [Text Block] |
The graph and table do not reflect the deduction of taxes that a shareholder would pay on fund distributions or redemption of fund shares.
|
|
| AssetsNet |
$ 81,142,124
|
|
| Holdings Count | Holding |
28
|
|
| Advisory Fees Paid, Amount |
$ 657,011
|
|
| InvestmentCompanyPortfolioTurnover |
57.00%
|
|
| Additional Fund Statistics [Text Block] |
Total Net Assets |
$81,142,124 |
# of Portfolio Holdings |
28 |
Portfolio Turnover Rate |
57% |
Total Management Fees Paid |
$657,011 | |
|
| Holdings [Text Block] |
Asset Allocation - % Investments
Value |
Value |
Common Stocks |
99.2 |
Investment Companies |
0.8 | Sector Allocation - % Equities
Value |
Value |
Energy |
2.3 |
Consumer Staples |
3.2 |
Materials |
5.4 |
Consumer Discretionary |
8.1 |
Industrials |
9.4 |
Health Care |
16.5 |
Information Technology |
17.0 |
Financials |
17.6 |
Communication Services |
20.5 | |
|
| Largest Holdings [Text Block] |
Top Ten Holdings - % Net Assets
Walt Disney Co. |
5.1 |
Alphabet, Inc., Class C |
5.1 |
Zimmer Biomet Holdings, Inc. |
5.1 |
Nasdaq, Inc. |
5.1 |
Elanco Animal Health, Inc. |
5.0 |
L3Harris Technologies, Inc. |
5.0 |
NCR Voyix Corp. |
5.0 |
Bank of America Corp. |
4.9 |
Micron Technology, Inc. |
4.9 |
Penn Entertainment, Inc. |
4.8 | Excludes cash equivalents. |
|
| Material Fund Change [Text Block] |
|
|
| C000233649 |
|
|
| Shareholder Report [Line Items] |
|
|
| Fund Name |
Shapiro Equity Opportunities Fund
|
|
| Class Name |
C
|
|
| Trading Symbol |
SHXCX
|
|
| Annual or Semi-Annual Statement [Text Block] |
This annual shareholder report contains important information about American Beacon Shapiro Equity Opportunities Fund for the period of July 1, 2024 to June 30, 2025.
|
|
| Shareholder Report Annual or Semi-Annual |
Annual Shareholder Report
|
|
| Additional Information [Text Block] |
You can find additional information about the Fund at www.americanbeaconfunds.com/literature. You can also request this information by contacting us at 800-658-5811.
|
|
| Additional Information Phone Number |
800-658-5811
|
|
| Additional Information Website |
<span style="box-sizing: border-box; color: rgb(0, 0, 0); display: inline; flex-wrap: nowrap; font-size: 13.3333px; font-weight: 400; grid-area: auto; line-height: 16px; margin: 0px; overflow: visible; text-align: left; text-align-last: auto; white-space-collapse: preserve-breaks;">www.americanbeaconfunds.com/literature</span>
|
|
| Expenses [Text Block] |
What were the Fund costs for the last year?(based on a hypothetical $10,000 investment)
Class Name |
Costs of a $10,000 investment |
Costs paid as a percentage of a $10,000 investment |
Class C |
$186 |
1.82% | |
|
| Expenses Paid, Amount |
$ 186
|
|
| Expense Ratio, Percent |
1.82%
|
|
| Factors Affecting Performance [Text Block] |
How did the Fund perform and what affected its performance? The C Class of the Fund returned 2.99% (with sales charges) and 3.99% (without sales charges) for the twelve months ended June 30, 2025, compared to the S&P 500 Index return of 15.16% and the Russell 3000 Value Index return of 13.30%. • Broad market performance was driven significantly by AI-themed companies. • Continued higher interest rates and higher tariff expectations were particularly challenging for the Fund’s holdings in undervalued and out-of-favor companies. • The Fund’s investments in corporate spin-off situations lagged the overall market and caused the Fund’s performance to suffer substantially. • The Fund’s underperformance was mainly driven by the sub-advisor’s stock selection decisions in the Communication Services and Industrials sectors, while stock selection in the Consumer Discretionary sector contributed to performance. |
|
| Performance Past Does Not Indicate Future [Text] |
Performance shown is historical and is not indicative of future returns.
|
|
| Line Graph [Table Text Block] |
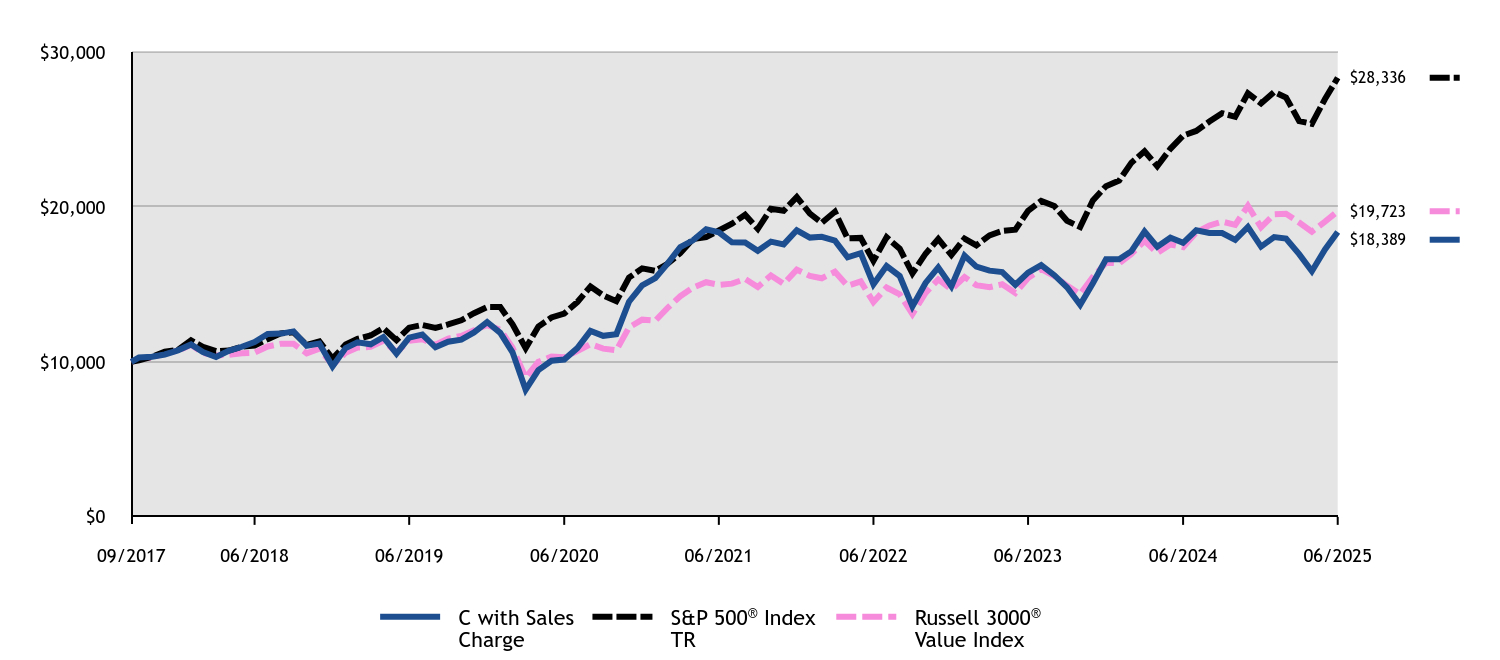
|
C with Sales Charge |
S&P 500® Index TR |
Russell 3000® Value Index |
09/2017 |
$10,000 |
$10,000 |
$10,000 |
09/2017 |
$10,280 |
$10,101 |
$10,201 |
10/2017 |
$10,330 |
$10,336 |
$10,270 |
11/2017 |
$10,480 |
$10,653 |
$10,583 |
12/2017 |
$10,747 |
$10,772 |
$10,718 |
01/2018 |
$11,127 |
$11,388 |
$11,112 |
02/2018 |
$10,636 |
$10,969 |
$10,580 |
03/2018 |
$10,316 |
$10,690 |
$10,416 |
04/2018 |
$10,717 |
$10,731 |
$10,461 |
05/2018 |
$10,977 |
$10,989 |
$10,565 |
06/2018 |
$11,277 |
$11,057 |
$10,594 |
07/2018 |
$11,798 |
$11,468 |
$10,996 |
08/2018 |
$11,828 |
$11,842 |
$11,166 |
09/2018 |
$11,969 |
$11,910 |
$11,165 |
10/2018 |
$11,047 |
$11,096 |
$10,556 |
11/2018 |
$11,187 |
$11,322 |
$10,861 |
12/2018 |
$9,704 |
$10,211 |
$9,799 |
01/2019 |
$10,892 |
$11,125 |
$10,583 |
02/2019 |
$11,263 |
$11,482 |
$10,926 |
03/2019 |
$11,139 |
$11,705 |
$10,969 |
04/2019 |
$11,594 |
$12,179 |
$11,359 |
05/2019 |
$10,530 |
$11,405 |
$10,616 |
06/2019 |
$11,563 |
$12,209 |
$11,372 |
07/2019 |
$11,759 |
$12,384 |
$11,461 |
08/2019 |
$10,943 |
$12,188 |
$11,104 |
09/2019 |
$11,305 |
$12,416 |
$11,511 |
10/2019 |
$11,439 |
$12,685 |
$11,680 |
11/2019 |
$11,903 |
$13,146 |
$12,035 |
12/2019 |
$12,573 |
$13,542 |
$12,372 |
01/2020 |
$11,878 |
$13,537 |
$12,079 |
02/2020 |
$10,618 |
$12,423 |
$10,909 |
03/2020 |
$8,208 |
$10,888 |
$8,992 |
04/2020 |
$9,468 |
$12,284 |
$10,009 |
05/2020 |
$10,076 |
$12,869 |
$10,348 |
06/2020 |
$10,152 |
$13,125 |
$10,300 |
07/2020 |
$10,890 |
$13,865 |
$10,697 |
08/2020 |
$11,997 |
$14,862 |
$11,146 |
09/2020 |
$11,682 |
$14,297 |
$10,859 |
10/2020 |
$11,791 |
$13,917 |
$10,746 |
11/2020 |
$13,886 |
$15,440 |
$12,228 |
12/2020 |
$14,934 |
$16,034 |
$12,728 |
01/2021 |
$15,399 |
$15,872 |
$12,662 |
02/2021 |
$16,308 |
$16,310 |
$13,456 |
03/2021 |
$17,417 |
$17,024 |
$14,241 |
04/2021 |
$17,849 |
$17,933 |
$14,791 |
05/2021 |
$18,559 |
$18,058 |
$15,144 |
06/2021 |
$18,359 |
$18,479 |
$14,976 |
07/2021 |
$17,716 |
$18,918 |
$15,052 |
08/2021 |
$17,705 |
$19,494 |
$15,357 |
09/2021 |
$17,173 |
$18,587 |
$14,837 |
10/2021 |
$17,761 |
$19,889 |
$15,578 |
11/2021 |
$17,583 |
$19,751 |
$15,031 |
12/2021 |
$18,496 |
$20,637 |
$15,957 |
01/2022 |
$18,022 |
$19,569 |
$15,549 |
02/2022 |
$18,070 |
$18,983 |
$15,396 |
03/2022 |
$17,821 |
$19,688 |
$15,822 |
04/2022 |
$16,754 |
$17,971 |
$14,908 |
05/2022 |
$17,014 |
$18,004 |
$15,197 |
06/2022 |
$15,011 |
$16,518 |
$13,859 |
07/2022 |
$16,184 |
$18,041 |
$14,803 |
08/2022 |
$15,544 |
$17,305 |
$14,361 |
09/2022 |
$13,576 |
$15,711 |
$13,089 |
10/2022 |
$15,094 |
$16,983 |
$14,449 |
11/2022 |
$16,101 |
$17,932 |
$15,324 |
12/2022 |
$14,878 |
$16,899 |
$14,683 |
01/2023 |
$16,864 |
$17,961 |
$15,481 |
02/2023 |
$16,147 |
$17,523 |
$14,947 |
03/2023 |
$15,890 |
$18,166 |
$14,817 |
04/2023 |
$15,801 |
$18,450 |
$15,007 |
05/2023 |
$14,981 |
$18,530 |
$14,444 |
06/2023 |
$15,762 |
$19,754 |
$15,414 |
07/2023 |
$16,249 |
$20,389 |
$15,992 |
08/2023 |
$15,596 |
$20,064 |
$15,540 |
09/2023 |
$14,814 |
$19,108 |
$14,928 |
10/2023 |
$13,686 |
$18,706 |
$14,380 |
11/2023 |
$15,083 |
$20,414 |
$15,477 |
12/2023 |
$16,621 |
$21,342 |
$16,395 |
01/2024 |
$16,621 |
$21,700 |
$16,366 |
02/2024 |
$17,146 |
$22,859 |
$16,966 |
03/2024 |
$18,415 |
$23,594 |
$17,808 |
04/2024 |
$17,428 |
$22,631 |
$17,026 |
05/2024 |
$18,018 |
$23,753 |
$17,580 |
06/2024 |
$17,684 |
$24,605 |
$17,407 |
07/2024 |
$18,492 |
$24,905 |
$18,358 |
08/2024 |
$18,325 |
$25,509 |
$18,807 |
09/2024 |
$18,312 |
$26,053 |
$19,055 |
10/2024 |
$17,877 |
$25,817 |
$18,841 |
11/2024 |
$18,710 |
$27,333 |
$20,075 |
12/2024 |
$17,441 |
$26,681 |
$18,687 |
01/2025 |
$18,056 |
$27,424 |
$19,527 |
02/2025 |
$17,966 |
$27,066 |
$19,566 |
03/2025 |
$16,954 |
$25,541 |
$18,994 |
04/2025 |
$15,852 |
$25,368 |
$18,406 |
05/2025 |
$17,262 |
$26,965 |
$19,058 |
06/2025 |
$18,389 |
$28,336 |
$19,723 |
|
|
| Average Annual Return [Table Text Block] |
HEADER |
1 Year |
5 Years |
Since Inception (9/12/17) |
Class C without Deferred Sales ChargeFootnote Reference1 |
3.99% |
12.62% |
8.13% |
Class C with Maximum Deferred Sales Charge -1.00%Footnote Reference1 |
2.99% |
12.62% |
8.13% |
S&P 500® Index TR |
15.16% |
16.64% |
14.29% |
Russell 3000® Value Index |
13.30% |
13.87% |
9.10% | |
|
| Performance Inception Date |
Sep. 12, 2017
|
|
| No Deduction of Taxes [Text Block] |
The graph and table do not reflect the deduction of taxes that a shareholder would pay on fund distributions or redemption of fund shares.
|
|
| AssetsNet |
$ 81,142,124
|
|
| Holdings Count | Holding |
28
|
|
| Advisory Fees Paid, Amount |
$ 657,011
|
|
| InvestmentCompanyPortfolioTurnover |
57.00%
|
|
| Additional Fund Statistics [Text Block] |
Total Net Assets |
$81,142,124 |
# of Portfolio Holdings |
28 |
Portfolio Turnover Rate |
57% |
Total Management Fees Paid |
$657,011 | |
|
| Holdings [Text Block] |
Asset Allocation - % Investments
Value |
Value |
Common Stocks |
99.2 |
Investment Companies |
0.8 | Sector Allocation - % Equities
Value |
Value |
Energy |
2.3 |
Consumer Staples |
3.2 |
Materials |
5.4 |
Consumer Discretionary |
8.1 |
Industrials |
9.4 |
Health Care |
16.5 |
Information Technology |
17.0 |
Financials |
17.6 |
Communication Services |
20.5 | |
|
| Largest Holdings [Text Block] |
Top Ten Holdings - % Net Assets
Walt Disney Co. |
5.1 |
Alphabet, Inc., Class C |
5.1 |
Zimmer Biomet Holdings, Inc. |
5.1 |
Nasdaq, Inc. |
5.1 |
Elanco Animal Health, Inc. |
5.0 |
L3Harris Technologies, Inc. |
5.0 |
NCR Voyix Corp. |
5.0 |
Bank of America Corp. |
4.9 |
Micron Technology, Inc. |
4.9 |
Penn Entertainment, Inc. |
4.8 | Excludes cash equivalents. |
|
| Material Fund Change [Text Block] |
|
|
| C000192444 |
|
|
| Shareholder Report [Line Items] |
|
|
| Fund Name |
Shapiro Equity Opportunities Fund
|
|
| Class Name |
R5
|
|
| Trading Symbol |
SHXIX
|
|
| Annual or Semi-Annual Statement [Text Block] |
This annual shareholder report contains important information about American Beacon Shapiro Equity Opportunities Fund for the period of July 1, 2024 to June 30, 2025.
|
|
| Shareholder Report Annual or Semi-Annual |
Annual Shareholder Report
|
|
| Additional Information [Text Block] |
You can find additional information about the Fund at www.americanbeaconfunds.com/literature. You can also request this information by contacting us at 800-658-5811.
|
|
| Additional Information Phone Number |
800-658-5811
|
|
| Additional Information Website |
<span style="box-sizing: border-box; color: rgb(0, 0, 0); display: inline; flex-wrap: nowrap; font-size: 13.3333px; font-weight: 400; grid-area: auto; line-height: 16px; margin: 0px; overflow: visible; text-align: left; text-align-last: auto; white-space-collapse: preserve-breaks;">www.americanbeaconfunds.com/literature</span>
|
|
| Expenses [Text Block] |
What were the Fund costs for the last year?(based on a hypothetical $10,000 investment)
Class Name |
Costs of a $10,000 investment |
Costs paid as a percentage of a $10,000 investment |
R5 |
$82 |
0.80% | |
|
| Expenses Paid, Amount |
$ 82
|
|
| Expense Ratio, Percent |
0.80%
|
|
| Factors Affecting Performance [Text Block] |
How did the Fund perform and what affected its performance? The R5 Class of the Fund returned 5.09% for the twelve months ended June 30, 2025, compared to the S&P 500 Index return of 15.16% and the Russell 3000 Value Index return of 13.30%. • Broad market performance was driven significantly by AI-themed companies. • Continued higher interest rates and higher tariff expectations were particularly challenging for the Fund’s holdings in undervalued and out-of-favor companies. • The Fund’s investments in corporate spin-off situations lagged the overall market and caused the Fund’s performance to suffer substantially. • The Fund’s underperformance was mainly driven by the sub-advisor’s stock selection decisions in the Communication Services and Industrials sectors, while stock selection in the Consumer Discretionary sector contributed to performance. |
|
| Performance Past Does Not Indicate Future [Text] |
Performance shown is historical and is not indicative of future returns.
|
|
| Line Graph [Table Text Block] |
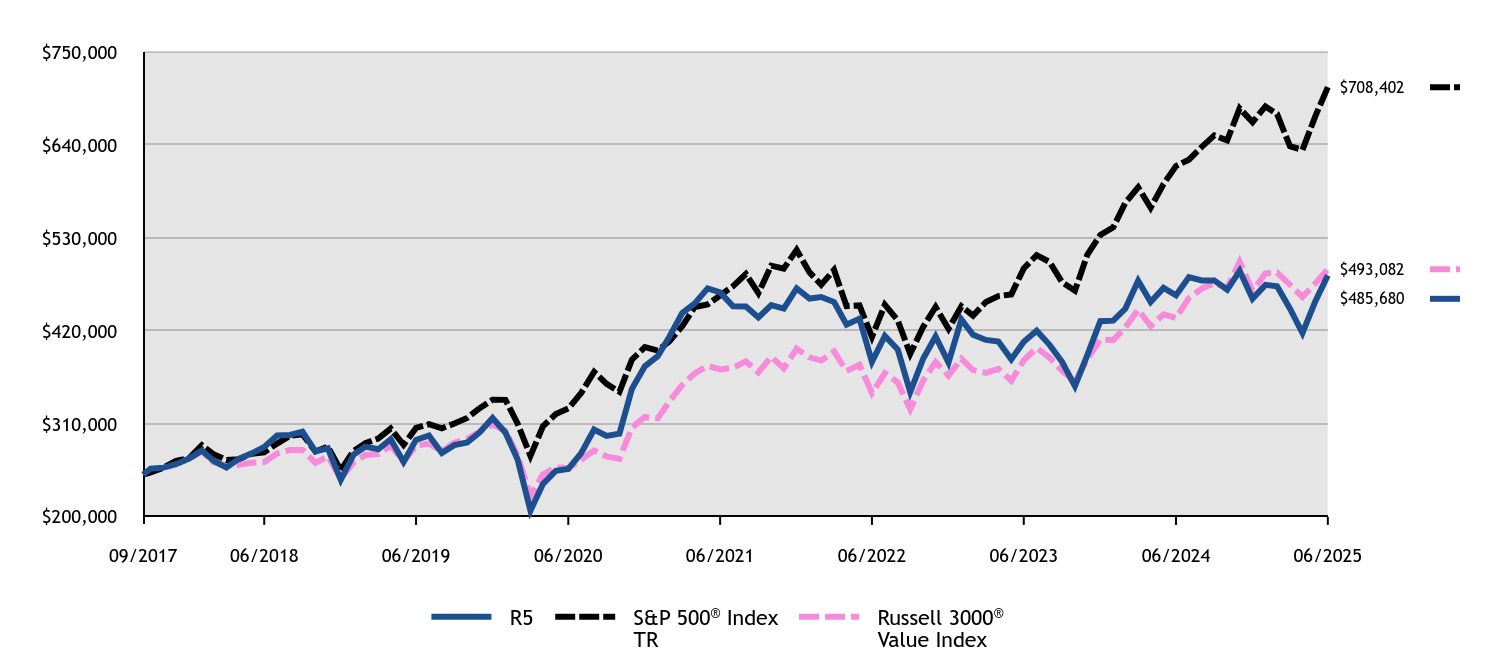
|
R5 |
S&P 500® Index TR |
Russell 3000® Value Index |
09/2017 |
$250,000 |
$250,000 |
$250,000 |
09/2017 |
$257,000 |
$252,514 |
$255,014 |
10/2017 |
$258,250 |
$258,406 |
$256,750 |
11/2017 |
$262,250 |
$266,331 |
$264,578 |
12/2017 |
$268,916 |
$269,293 |
$267,960 |
01/2018 |
$278,430 |
$284,711 |
$277,798 |
02/2018 |
$266,412 |
$274,217 |
$264,488 |
03/2018 |
$258,399 |
$267,248 |
$260,405 |
04/2018 |
$268,665 |
$268,274 |
$261,537 |
05/2018 |
$275,175 |
$274,734 |
$264,121 |
06/2018 |
$282,687 |
$276,425 |
$264,858 |
07/2018 |
$296,208 |
$286,712 |
$274,896 |
08/2018 |
$296,959 |
$296,055 |
$279,146 |
09/2018 |
$300,715 |
$297,740 |
$279,134 |
10/2018 |
$277,429 |
$277,389 |
$263,900 |
11/2018 |
$281,185 |
$283,042 |
$271,522 |
12/2018 |
$243,862 |
$255,285 |
$244,978 |
01/2019 |
$273,797 |
$278,120 |
$264,577 |
02/2019 |
$283,087 |
$287,050 |
$273,159 |
03/2019 |
$279,990 |
$292,628 |
$274,215 |
04/2019 |
$291,861 |
$304,476 |
$283,986 |
05/2019 |
$265,023 |
$285,127 |
$265,388 |
06/2019 |
$291,087 |
$305,222 |
$284,294 |
07/2019 |
$296,248 |
$309,608 |
$286,522 |
08/2019 |
$275,603 |
$304,704 |
$277,591 |
09/2019 |
$284,893 |
$310,405 |
$287,779 |
10/2019 |
$287,990 |
$317,129 |
$291,995 |
11/2019 |
$300,119 |
$328,640 |
$300,877 |
12/2019 |
$316,988 |
$338,559 |
$309,302 |
01/2020 |
$299,589 |
$338,426 |
$301,984 |
02/2020 |
$268,053 |
$310,567 |
$272,732 |
03/2020 |
$207,429 |
$272,208 |
$224,798 |
04/2020 |
$238,964 |
$307,104 |
$250,215 |
05/2020 |
$254,460 |
$321,730 |
$258,707 |
06/2020 |
$256,635 |
$328,129 |
$257,512 |
07/2020 |
$275,394 |
$346,630 |
$267,415 |
08/2020 |
$303,395 |
$371,546 |
$278,660 |
09/2020 |
$295,783 |
$357,429 |
$271,464 |
10/2020 |
$298,502 |
$347,923 |
$268,642 |
11/2020 |
$351,514 |
$386,008 |
$305,704 |
12/2020 |
$378,156 |
$400,850 |
$318,193 |
01/2021 |
$390,095 |
$396,803 |
$316,543 |
02/2021 |
$413,140 |
$407,745 |
$336,394 |
03/2021 |
$441,182 |
$425,602 |
$356,025 |
04/2021 |
$452,566 |
$448,316 |
$369,768 |
05/2021 |
$470,336 |
$451,447 |
$378,598 |
06/2021 |
$465,615 |
$461,986 |
$374,412 |
07/2021 |
$449,234 |
$472,961 |
$376,293 |
08/2021 |
$448,957 |
$487,341 |
$383,924 |
09/2021 |
$435,907 |
$464,675 |
$370,937 |
10/2021 |
$450,623 |
$497,231 |
$389,459 |
11/2021 |
$446,458 |
$493,786 |
$375,763 |
12/2021 |
$470,226 |
$515,915 |
$398,917 |
01/2022 |
$458,336 |
$489,218 |
$388,718 |
02/2022 |
$460,120 |
$474,570 |
$384,894 |
03/2022 |
$454,175 |
$492,191 |
$395,545 |
04/2022 |
$427,424 |
$449,271 |
$372,698 |
05/2022 |
$434,557 |
$450,095 |
$379,937 |
06/2022 |
$383,433 |
$412,943 |
$346,474 |
07/2022 |
$414,048 |
$451,018 |
$370,081 |
08/2022 |
$397,997 |
$432,624 |
$359,014 |
09/2022 |
$347,765 |
$392,780 |
$327,222 |
10/2022 |
$387,000 |
$424,580 |
$361,230 |
11/2022 |
$413,454 |
$448,308 |
$383,101 |
12/2022 |
$382,537 |
$422,479 |
$367,084 |
01/2023 |
$433,542 |
$449,025 |
$387,032 |
02/2023 |
$415,464 |
$438,069 |
$373,668 |
03/2023 |
$409,330 |
$454,152 |
$370,437 |
04/2023 |
$407,394 |
$461,241 |
$375,184 |
05/2023 |
$386,411 |
$463,246 |
$361,095 |
06/2023 |
$407,071 |
$493,855 |
$385,347 |
07/2023 |
$420,306 |
$509,720 |
$399,793 |
08/2023 |
$403,520 |
$501,604 |
$388,496 |
09/2023 |
$383,505 |
$477,689 |
$373,197 |
10/2023 |
$354,775 |
$467,645 |
$359,508 |
11/2023 |
$391,576 |
$510,353 |
$386,927 |
12/2023 |
$431,530 |
$533,538 |
$409,869 |
01/2024 |
$432,181 |
$542,504 |
$409,149 |
02/2024 |
$446,186 |
$571,471 |
$424,145 |
03/2024 |
$479,405 |
$589,858 |
$445,204 |
04/2024 |
$454,328 |
$565,766 |
$425,654 |
05/2024 |
$470,937 |
$593,819 |
$439,504 |
06/2024 |
$462,144 |
$615,126 |
$435,187 |
07/2024 |
$483,639 |
$622,614 |
$458,950 |
08/2024 |
$479,731 |
$637,717 |
$470,169 |
09/2024 |
$479,731 |
$651,336 |
$476,383 |
10/2024 |
$468,658 |
$645,430 |
$471,030 |
11/2024 |
$491,130 |
$683,317 |
$501,864 |
12/2024 |
$458,115 |
$667,028 |
$467,163 |
01/2025 |
$474,523 |
$685,603 |
$488,183 |
02/2025 |
$472,882 |
$676,657 |
$489,162 |
03/2025 |
$446,301 |
$638,531 |
$474,841 |
04/2025 |
$417,423 |
$634,202 |
$460,161 |
05/2025 |
$455,161 |
$674,121 |
$476,460 |
06/2025 |
$485,680 |
$708,402 |
$493,082 |
|
|
| Average Annual Return [Table Text Block] |
HEADER |
1 Year |
5 Years |
Since Inception (9/12/17) |
Class R5Footnote Reference1 |
5.09% |
13.61% |
8.89% |
S&P 500® Index TR |
15.16% |
16.64% |
14.29% |
Russell 3000® Value Index |
13.30% |
13.87% |
9.10% | |
|
| Performance Inception Date |
Sep. 12, 2017
|
|
| No Deduction of Taxes [Text Block] |
The graph and table do not reflect the deduction of taxes that a shareholder would pay on fund distributions or redemption of fund shares.
|
|
| AssetsNet |
$ 81,142,124
|
|
| Holdings Count | Holding |
28
|
|
| Advisory Fees Paid, Amount |
$ 657,011
|
|
| InvestmentCompanyPortfolioTurnover |
57.00%
|
|
| Additional Fund Statistics [Text Block] |
Total Net Assets |
$81,142,124 |
# of Portfolio Holdings |
28 |
Portfolio Turnover Rate |
57% |
Total Management Fees Paid |
$657,011 | |
|
| Holdings [Text Block] |
Asset Allocation - % Investments
Value |
Value |
Common Stocks |
99.2 |
Investment Companies |
0.8 | Sector Allocation - % Equities
Value |
Value |
Energy |
2.3 |
Consumer Staples |
3.2 |
Materials |
5.4 |
Consumer Discretionary |
8.1 |
Industrials |
9.4 |
Health Care |
16.5 |
Information Technology |
17.0 |
Financials |
17.6 |
Communication Services |
20.5 | |
|
| Largest Holdings [Text Block] |
Top Ten Holdings - % Net Assets
Walt Disney Co. |
5.1 |
Alphabet, Inc., Class C |
5.1 |
Zimmer Biomet Holdings, Inc. |
5.1 |
Nasdaq, Inc. |
5.1 |
Elanco Animal Health, Inc. |
5.0 |
L3Harris Technologies, Inc. |
5.0 |
NCR Voyix Corp. |
5.0 |
Bank of America Corp. |
4.9 |
Micron Technology, Inc. |
4.9 |
Penn Entertainment, Inc. |
4.8 | Excludes cash equivalents. |
|
| Material Fund Change [Text Block] |
|
|
| C000192446 |
|
|
| Shareholder Report [Line Items] |
|
|
| Fund Name |
Shapiro Equity Opportunities Fund
|
|
| Class Name |
Y
|
|
| Trading Symbol |
SHXYX
|
|
| Annual or Semi-Annual Statement [Text Block] |
This annual shareholder report contains important information about American Beacon Shapiro Equity Opportunities Fund for the period of July 1, 2024 to June 30, 2025.
|
|
| Shareholder Report Annual or Semi-Annual |
Annual Shareholder Report
|
|
| Additional Information [Text Block] |
You can find additional information about the Fund at www.americanbeaconfunds.com/literature. You can also request this information by contacting us at 800-658-5811.
|
|
| Additional Information Phone Number |
800-658-5811
|
|
| Additional Information Website |
<span style="box-sizing: border-box; color: rgb(0, 0, 0); display: inline; flex-wrap: nowrap; font-size: 13.3333px; font-weight: 400; grid-area: auto; line-height: 16px; margin: 0px; overflow: visible; text-align: left; text-align-last: auto; white-space-collapse: preserve-breaks;">www.americanbeaconfunds.com/literature</span>
|
|
| Expenses [Text Block] |
What were the Fund costs for the last year?(based on a hypothetical $10,000 investment)
Class Name |
Costs of a $10,000 investment |
Costs paid as a percentage of a $10,000 investment |
Y |
$92 |
0.90% | |
|
| Expenses Paid, Amount |
$ 92
|
|
| Expense Ratio, Percent |
0.90%
|
|
| Factors Affecting Performance [Text Block] |
How did the Fund perform and what affected its performance? The Y Class of the Fund returned 5.03% for the twelve months ended June 30, 2025, compared to the S&P 500 Index return of 15.16% and the Russell 3000 Value Index return of 13.30%. • Broad market performance was driven significantly by AI-themed companies. • Continued higher interest rates and higher tariff expectations were particularly challenging for the Fund’s holdings in undervalued and out-of-favor companies. • The Fund’s investments in corporate spin-off situations lagged the overall market and caused the Fund’s performance to suffer substantially. • The Fund’s underperformance was mainly driven by the sub-advisor’s stock selection decisions in the Communication Services and Industrials sectors, while stock selection in the Consumer Discretionary sector contributed to performance. |
|
| Performance Past Does Not Indicate Future [Text] |
Performance shown is historical and is not indicative of future returns.
|
|
| Line Graph [Table Text Block] |
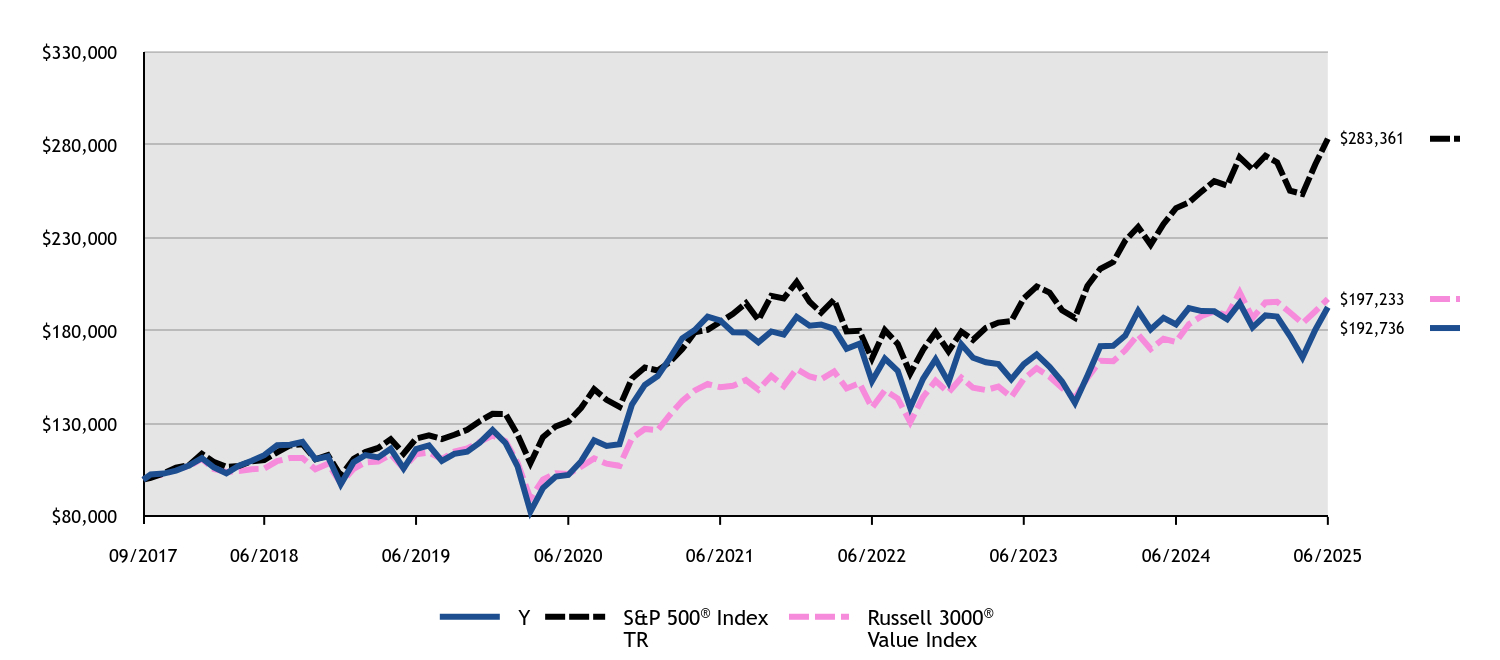
#ERROR:A result could not be returned because the conditional could not be evaluated to a True/False value (#ERROR:Invalid Formula (#!=""), 'Multiple values from an iterator cannot be used in a formula unless they are aggregrated.') |
Y |
S&P 500® Index TR |
Russell 3000® Value Index |
09/2017 |
$100,000 |
$100,000 |
$100,000 |
09/2017 |
$102,800 |
$101,006 |
$102,006 |
10/2017 |
$103,300 |
$103,362 |
$102,700 |
11/2017 |
$104,900 |
$106,533 |
$105,831 |
12/2017 |
$107,566 |
$107,717 |
$107,184 |
01/2018 |
$111,572 |
$113,884 |
$111,119 |
02/2018 |
$106,765 |
$109,687 |
$105,795 |
03/2018 |
$103,460 |
$106,899 |
$104,162 |
04/2018 |
$107,566 |
$107,310 |
$104,615 |
05/2018 |
$110,170 |
$109,894 |
$105,648 |
06/2018 |
$113,175 |
$110,570 |
$105,943 |
07/2018 |
$118,483 |
$114,685 |
$109,959 |
08/2018 |
$118,784 |
$118,422 |
$111,658 |
09/2018 |
$120,286 |
$119,096 |
$111,654 |
10/2018 |
$111,072 |
$110,956 |
$105,560 |
11/2018 |
$112,474 |
$113,217 |
$108,609 |
12/2018 |
$97,545 |
$102,114 |
$97,991 |
01/2019 |
$109,416 |
$111,248 |
$105,831 |
02/2019 |
$113,235 |
$114,820 |
$109,264 |
03/2019 |
$111,996 |
$117,051 |
$109,686 |
04/2019 |
$116,641 |
$121,790 |
$113,594 |
05/2019 |
$106,009 |
$114,051 |
$106,155 |
06/2019 |
$116,435 |
$122,089 |
$113,718 |
07/2019 |
$118,396 |
$123,843 |
$114,609 |
08/2019 |
$110,138 |
$121,882 |
$111,036 |
09/2019 |
$113,854 |
$124,162 |
$115,111 |
10/2019 |
$115,093 |
$126,851 |
$116,798 |
11/2019 |
$119,944 |
$131,456 |
$120,351 |
12/2019 |
$126,692 |
$135,424 |
$123,721 |
01/2020 |
$119,732 |
$135,371 |
$120,794 |
02/2020 |
$107,117 |
$124,227 |
$109,093 |
03/2020 |
$82,866 |
$108,883 |
$89,919 |
04/2020 |
$95,481 |
$122,841 |
$100,086 |
05/2020 |
$101,680 |
$128,692 |
$103,483 |
06/2020 |
$102,550 |
$131,251 |
$103,005 |
07/2020 |
$109,945 |
$138,652 |
$106,966 |
08/2020 |
$121,146 |
$148,619 |
$111,464 |
09/2020 |
$118,101 |
$142,972 |
$108,586 |
10/2020 |
$119,080 |
$139,169 |
$107,457 |
11/2020 |
$140,394 |
$154,403 |
$122,281 |
12/2020 |
$150,943 |
$160,340 |
$127,277 |
01/2021 |
$155,719 |
$158,721 |
$126,617 |
02/2021 |
$164,938 |
$163,098 |
$134,558 |
03/2021 |
$176,045 |
$170,241 |
$142,410 |
04/2021 |
$180,488 |
$179,326 |
$147,907 |
05/2021 |
$187,707 |
$180,579 |
$151,439 |
06/2021 |
$185,708 |
$184,794 |
$149,765 |
07/2021 |
$179,266 |
$189,184 |
$150,517 |
08/2021 |
$179,155 |
$194,937 |
$153,570 |
09/2021 |
$173,824 |
$185,870 |
$148,375 |
10/2021 |
$179,710 |
$198,892 |
$155,783 |
11/2021 |
$178,044 |
$197,514 |
$150,305 |
12/2021 |
$187,549 |
$206,366 |
$159,567 |
01/2022 |
$182,795 |
$195,687 |
$155,487 |
02/2022 |
$183,389 |
$189,828 |
$153,958 |
03/2022 |
$181,131 |
$196,876 |
$158,218 |
04/2022 |
$170,434 |
$179,708 |
$149,079 |
05/2022 |
$173,168 |
$180,038 |
$151,975 |
06/2022 |
$152,963 |
$165,177 |
$138,590 |
07/2022 |
$165,086 |
$180,407 |
$148,032 |
08/2022 |
$158,549 |
$173,050 |
$143,606 |
09/2022 |
$138,700 |
$157,112 |
$130,889 |
10/2022 |
$154,270 |
$169,832 |
$144,492 |
11/2022 |
$164,729 |
$179,323 |
$153,240 |
12/2022 |
$152,390 |
$168,991 |
$146,834 |
01/2023 |
$172,777 |
$179,610 |
$154,813 |
02/2023 |
$165,551 |
$175,228 |
$149,467 |
03/2023 |
$163,100 |
$181,661 |
$148,175 |
04/2023 |
$162,196 |
$184,496 |
$150,073 |
05/2023 |
$153,938 |
$185,298 |
$144,438 |
06/2023 |
$162,067 |
$197,542 |
$154,139 |
07/2023 |
$167,358 |
$203,888 |
$159,917 |
08/2023 |
$160,648 |
$200,642 |
$155,398 |
09/2023 |
$152,777 |
$191,076 |
$149,279 |
10/2023 |
$141,293 |
$187,058 |
$143,803 |
11/2023 |
$155,874 |
$204,141 |
$154,771 |
12/2023 |
$171,796 |
$213,415 |
$163,948 |
01/2024 |
$172,057 |
$217,002 |
$163,660 |
02/2024 |
$177,523 |
$228,589 |
$169,658 |
03/2024 |
$190,798 |
$235,943 |
$178,082 |
04/2024 |
$180,776 |
$226,306 |
$170,262 |
05/2024 |
$187,024 |
$237,528 |
$175,802 |
06/2024 |
$183,510 |
$246,051 |
$174,075 |
07/2024 |
$192,230 |
$249,046 |
$183,580 |
08/2024 |
$190,668 |
$255,087 |
$188,068 |
09/2024 |
$190,538 |
$260,535 |
$190,553 |
10/2024 |
$186,243 |
$258,172 |
$188,412 |
11/2024 |
$194,963 |
$273,327 |
$200,745 |
12/2024 |
$181,854 |
$266,811 |
$186,865 |
01/2025 |
$188,410 |
$274,241 |
$195,273 |
02/2025 |
$187,754 |
$270,663 |
$195,665 |
03/2025 |
$177,265 |
$255,413 |
$189,937 |
04/2025 |
$165,727 |
$253,681 |
$184,064 |
05/2025 |
$180,674 |
$269,648 |
$190,584 |
06/2025 |
$192,736 |
$283,361 |
$197,233 |
|
|
| Average Annual Return [Table Text Block] |
HEADER |
1 Year |
5 Years |
Since Inception (9/12/17) |
Class YFootnote Reference1 |
5.03% |
13.45% |
8.78% |
S&P 500® Index TR |
15.16% |
16.64% |
14.29% |
Russell 3000® Value Index |
13.30% |
13.87% |
9.10% | |
|
| Performance Inception Date |
Sep. 12, 2017
|
|
| No Deduction of Taxes [Text Block] |
The graph and table do not reflect the deduction of taxes that a shareholder would pay on fund distributions or redemption of fund shares.
|
|
| AssetsNet |
$ 81,142,124
|
|
| Holdings Count | Holding |
28
|
|
| Advisory Fees Paid, Amount |
$ 657,011
|
|
| InvestmentCompanyPortfolioTurnover |
57.00%
|
|
| Additional Fund Statistics [Text Block] |
Total Net Assets |
$81,142,124 |
# of Portfolio Holdings |
28 |
Portfolio Turnover Rate |
57% |
Total Management Fees Paid |
$657,011 | |
|
| Holdings [Text Block] |
Asset Allocation - % Investments
Value |
Value |
Common Stocks |
99.2 |
Investment Companies |
0.8 | Sector Allocation - % Equities
Value |
Value |
Energy |
2.3 |
Consumer Staples |
3.2 |
Materials |
5.4 |
Consumer Discretionary |
8.1 |
Industrials |
9.4 |
Health Care |
16.5 |
Information Technology |
17.0 |
Financials |
17.6 |
Communication Services |
20.5 | |
|
| Largest Holdings [Text Block] |
Top Ten Holdings - % Net Assets
Walt Disney Co. |
5.1 |
Alphabet, Inc., Class C |
5.1 |
Zimmer Biomet Holdings, Inc. |
5.1 |
Nasdaq, Inc. |
5.1 |
Elanco Animal Health, Inc. |
5.0 |
L3Harris Technologies, Inc. |
5.0 |
NCR Voyix Corp. |
5.0 |
Bank of America Corp. |
4.9 |
Micron Technology, Inc. |
4.9 |
Penn Entertainment, Inc. |
4.8 | Excludes cash equivalents. |
|
| Material Fund Change [Text Block] |
|
|
| C000192445 |
|
|
| Shareholder Report [Line Items] |
|
|
| Fund Name |
Shapiro Equity Opportunities Fund
|
|
| Class Name |
Investor
|
|
| Trading Symbol |
SHXPX
|
|
| Annual or Semi-Annual Statement [Text Block] |
This annual shareholder report contains important information about American Beacon Shapiro Equity Opportunities Fund for the period of July 1, 2024 to June 30, 2025.
|
|
| Shareholder Report Annual or Semi-Annual |
Annual Shareholder Report
|
|
| Additional Information [Text Block] |
You can find additional information about the Fund at www.americanbeaconfunds.com/literature. You can also request this information by contacting us at 800-658-5811.
|
|
| Additional Information Phone Number |
800-658-5811
|
|
| Additional Information Website |
<span style="box-sizing: border-box; color: rgb(0, 0, 0); display: inline; flex-wrap: nowrap; font-size: 13.3333px; font-weight: 400; grid-area: auto; line-height: 16px; margin: 0px; overflow: visible; text-align: left; text-align-last: auto; white-space-collapse: preserve-breaks;">www.americanbeaconfunds.com/literature</span>
|
|
| Expenses [Text Block] |
What were the Fund costs for the last year?(based on a hypothetical $10,000 investment)
Class Name |
Costs of a $10,000 investment |
Costs paid as a percentage of a $10,000 investment |
Investor |
$110 |
1.07% | |
|
| Expenses Paid, Amount |
$ 110
|
|
| Expense Ratio, Percent |
1.07%
|
|
| Factors Affecting Performance [Text Block] |
How did the Fund perform and what affected its performance? The Investor Class of the Fund returned 4.78% for the twelve months ended June 30, 2025, compared to the S&P 500 Index return of 15.16% and the Russell 3000 Value Index return of 13.30%. • Broad market performance was driven significantly by AI-themed companies. • Continued higher interest rates and higher tariff expectations were particularly challenging for the Fund’s holdings in undervalued and out-of-favor companies. • The Fund’s investments in corporate spin-off situations lagged the overall market and caused the Fund’s performance to suffer substantially. • The Fund’s underperformance was mainly driven by the sub-advisor’s stock selection decisions in the Communication Services and Industrials sectors, while stock selection in the Consumer Discretionary sector contributed to performance. |
|
| Performance Past Does Not Indicate Future [Text] |
Performance shown is historical and is not indicative of future returns.
|
|
| Line Graph [Table Text Block] |
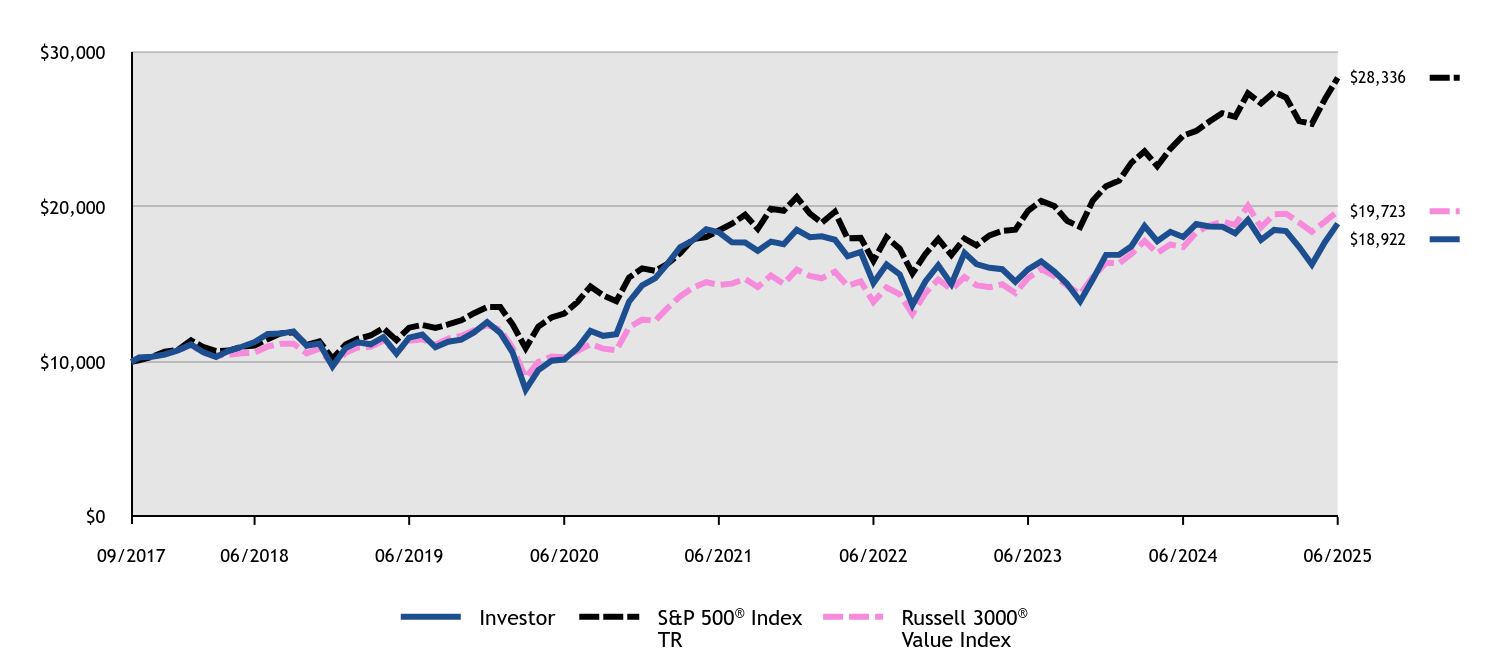
|
Investor |
S&P 500® Index TR |
Russell 3000® Value Index |
09/2017 |
$10,000 |
$10,000 |
$10,000 |
09/2017 |
$10,280 |
$10,101 |
$10,201 |
10/2017 |
$10,330 |
$10,336 |
$10,270 |
11/2017 |
$10,480 |
$10,653 |
$10,583 |
12/2017 |
$10,747 |
$10,772 |
$10,718 |
01/2018 |
$11,127 |
$11,388 |
$11,112 |
02/2018 |
$10,636 |
$10,969 |
$10,580 |
03/2018 |
$10,316 |
$10,690 |
$10,416 |
04/2018 |
$10,717 |
$10,731 |
$10,461 |
05/2018 |
$10,977 |
$10,989 |
$10,565 |
06/2018 |
$11,277 |
$11,057 |
$10,594 |
07/2018 |
$11,798 |
$11,468 |
$10,996 |
08/2018 |
$11,828 |
$11,842 |
$11,166 |
09/2018 |
$11,969 |
$11,910 |
$11,165 |
10/2018 |
$11,047 |
$11,096 |
$10,556 |
11/2018 |
$11,187 |
$11,322 |
$10,861 |
12/2018 |
$9,704 |
$10,211 |
$9,799 |
01/2019 |
$10,892 |
$11,125 |
$10,583 |
02/2019 |
$11,263 |
$11,482 |
$10,926 |
03/2019 |
$11,139 |
$11,705 |
$10,969 |
04/2019 |
$11,594 |
$12,179 |
$11,359 |
05/2019 |
$10,530 |
$11,405 |
$10,616 |
06/2019 |
$11,563 |
$12,209 |
$11,372 |
07/2019 |
$11,759 |
$12,384 |
$11,461 |
08/2019 |
$10,943 |
$12,188 |
$11,104 |
09/2019 |
$11,305 |
$12,416 |
$11,511 |
10/2019 |
$11,439 |
$12,685 |
$11,680 |
11/2019 |
$11,903 |
$13,146 |
$12,035 |
12/2019 |
$12,573 |
$13,542 |
$12,372 |
01/2020 |
$11,878 |
$13,537 |
$12,079 |
02/2020 |
$10,618 |
$12,423 |
$10,909 |
03/2020 |
$8,208 |
$10,888 |
$8,992 |
04/2020 |
$9,468 |
$12,284 |
$10,009 |
05/2020 |
$10,076 |
$12,869 |
$10,348 |
06/2020 |
$10,152 |
$13,125 |
$10,300 |
07/2020 |
$10,890 |
$13,865 |
$10,697 |
08/2020 |
$11,997 |
$14,862 |
$11,146 |
09/2020 |
$11,682 |
$14,297 |
$10,859 |
10/2020 |
$11,791 |
$13,917 |
$10,746 |
11/2020 |
$13,886 |
$15,440 |
$12,228 |
12/2020 |
$14,934 |
$16,034 |
$12,728 |
01/2021 |
$15,399 |
$15,872 |
$12,662 |
02/2021 |
$16,308 |
$16,310 |
$13,456 |
03/2021 |
$17,417 |
$17,024 |
$14,241 |
04/2021 |
$17,849 |
$17,933 |
$14,791 |
05/2021 |
$18,559 |
$18,058 |
$15,144 |
06/2021 |
$18,359 |
$18,479 |
$14,976 |
07/2021 |
$17,716 |
$18,918 |
$15,052 |
08/2021 |
$17,705 |
$19,494 |
$15,357 |
09/2021 |
$17,173 |
$18,587 |
$14,837 |
10/2021 |
$17,761 |
$19,889 |
$15,578 |
11/2021 |
$17,594 |
$19,751 |
$15,031 |
12/2021 |
$18,525 |
$20,637 |
$15,957 |
01/2022 |
$18,051 |
$19,569 |
$15,549 |
02/2022 |
$18,110 |
$18,983 |
$15,396 |
03/2022 |
$17,885 |
$19,688 |
$15,822 |
04/2022 |
$16,820 |
$17,971 |
$14,908 |
05/2022 |
$17,092 |
$18,004 |
$15,197 |
06/2022 |
$15,092 |
$16,518 |
$13,859 |
07/2022 |
$16,287 |
$18,041 |
$14,803 |
08/2022 |
$15,648 |
$17,305 |
$14,361 |
09/2022 |
$13,672 |
$15,711 |
$13,089 |
10/2022 |
$15,210 |
$16,983 |
$14,449 |
11/2022 |
$16,240 |
$17,932 |
$15,324 |
12/2022 |
$15,019 |
$16,899 |
$14,683 |
01/2023 |
$17,034 |
$17,961 |
$15,481 |
02/2023 |
$16,315 |
$17,523 |
$14,947 |
03/2023 |
$16,071 |
$18,166 |
$14,817 |
04/2023 |
$15,981 |
$18,450 |
$15,007 |
05/2023 |
$15,173 |
$18,530 |
$14,444 |
06/2023 |
$15,968 |
$19,754 |
$15,414 |
07/2023 |
$16,482 |
$20,389 |
$15,992 |
08/2023 |
$15,827 |
$20,064 |
$15,540 |
09/2023 |
$15,044 |
$19,108 |
$14,928 |
10/2023 |
$13,915 |
$18,706 |
$14,380 |
11/2023 |
$15,339 |
$20,414 |
$15,477 |
12/2023 |
$16,908 |
$21,342 |
$16,395 |
01/2024 |
$16,921 |
$21,700 |
$16,366 |
02/2024 |
$17,464 |
$22,859 |
$16,966 |
03/2024 |
$18,768 |
$23,594 |
$17,808 |
04/2024 |
$17,787 |
$22,631 |
$17,026 |
05/2024 |
$18,394 |
$23,753 |
$17,580 |
06/2024 |
$18,058 |
$24,605 |
$17,407 |
07/2024 |
$18,898 |
$24,905 |
$18,358 |
08/2024 |
$18,743 |
$25,509 |
$18,807 |
09/2024 |
$18,730 |
$26,053 |
$19,055 |
10/2024 |
$18,303 |
$25,817 |
$18,841 |
11/2024 |
$19,169 |
$27,333 |
$20,075 |
12/2024 |
$17,870 |
$26,681 |
$18,687 |
01/2025 |
$18,519 |
$27,424 |
$19,527 |
02/2025 |
$18,441 |
$27,066 |
$19,566 |
03/2025 |
$17,415 |
$25,541 |
$18,994 |
04/2025 |
$16,285 |
$25,368 |
$18,406 |
05/2025 |
$17,740 |
$26,965 |
$19,058 |
06/2025 |
$18,922 |
$28,336 |
$19,723 |
|
|
| Average Annual Return [Table Text Block] |
HEADER |
1 Year |
5 Years |
Since Inception (9/12/17) |
Investor ClassFootnote Reference1 |
4.78% |
13.26% |
8.52% |
S&P 500® Index TR |
15.16% |
16.64% |
14.29% |
Russell 3000® Value Index |
13.30% |
13.87% |
9.10% | |
|
| Performance Inception Date |
Sep. 12, 2017
|
|
| No Deduction of Taxes [Text Block] |
The graph and table do not reflect the deduction of taxes that a shareholder would pay on fund distributions or redemption of fund shares.
|
|
| AssetsNet |
$ 81,142,124
|
|
| Holdings Count | Holding |
28
|
|
| Advisory Fees Paid, Amount |
$ 657,011
|
|
| InvestmentCompanyPortfolioTurnover |
57.00%
|
|
| Additional Fund Statistics [Text Block] |
Total Net Assets |
$81,142,124 |
# of Portfolio Holdings |
28 |
Portfolio Turnover Rate |
57% |
Total Management Fees Paid |
$657,011 | |
|
| Holdings [Text Block] |
Asset Allocation - % Investments
Value |
Value |
Common Stocks |
99.2 |
Investment Companies |
0.8 | Sector Allocation - % Equities
Value |
Value |
Energy |
2.3 |
Consumer Staples |
3.2 |
Materials |
5.4 |
Consumer Discretionary |
8.1 |
Industrials |
9.4 |
Health Care |
16.5 |
Information Technology |
17.0 |
Financials |
17.6 |
Communication Services |
20.5 | |
|
| Largest Holdings [Text Block] |
Top Ten Holdings - % Net Assets
Walt Disney Co. |
5.1 |
Alphabet, Inc., Class C |
5.1 |
Zimmer Biomet Holdings, Inc. |
5.1 |
Nasdaq, Inc. |
5.1 |
Elanco Animal Health, Inc. |
5.0 |
L3Harris Technologies, Inc. |
5.0 |
NCR Voyix Corp. |
5.0 |
Bank of America Corp. |
4.9 |
Micron Technology, Inc. |
4.9 |
Penn Entertainment, Inc. |
4.8 | Excludes cash equivalents. |
|
| Material Fund Change [Text Block] |
|
|
| C000207658 |
|
|
| Shareholder Report [Line Items] |
|
|
| Fund Name |
SSI Alternative Income Fund
|
|
| Class Name |
R5
|
|
| Trading Symbol |
SSIJX
|
|
| Annual or Semi-Annual Statement [Text Block] |
This annual shareholder report contains important information about American Beacon SSI Alternative Income Fund for the period of July 1, 2024 to June 30, 2025.
|
|
| Shareholder Report Annual or Semi-Annual |
Annual Shareholder Report
|
|
| Additional Information [Text Block] |
You can find additional information about the Fund at www.americanbeaconfunds.com/literature. You can also request this information by contacting us at 800-658-5811.
|
|
| Additional Information Phone Number |
800-658-5811
|
|
| Additional Information Website |
<span style="box-sizing: border-box; color: rgb(0, 0, 0); display: inline; flex-wrap: nowrap; font-size: 13.3333px; font-weight: 400; grid-area: auto; line-height: 16px; margin: 0px; overflow: visible; text-align: left; text-align-last: auto; white-space-collapse: preserve-breaks;">www.americanbeaconfunds.com/literature</span>
|
|
| Expenses [Text Block] |
What were the Fund costs for the last year?(based on a hypothetical $10,000 investment)
Class Name |
Costs of a $10,000 investment |
Costs paid as a percentage of a $10,000 investment |
R5 |
$139 |
1.33% | |
|
| Expenses Paid, Amount |
$ 139
|
|
| Expense Ratio, Percent |
1.33%
|
|
| Factors Affecting Performance [Text Block] |
How did the Fund perform and what affected its performance? The R5 Class of the Fund returned 9.21% for the twelve months ended June 30, 2025, compared to the Bloomberg U.S. Aggregate Bond Index return of 6.08% and the ICE BofA U.S. 3-Month Treasury Bill Index return of 4.68%. • The Fund demonstrated attractive performance during the period as its hedged convertible bond strategy capitalized on equity market volatility and elevated interest rates. Income was a significant source of total return for the Fund. • Credit spreads also improved during the period as risk markets were resilient. • The Fund’s holdings were diversified across sectors and industries with no individual position having a material impact on performance. |
|
| Performance Past Does Not Indicate Future [Text] |
Performance shown is historical and is not indicative of future returns.
|
|
| Line Graph [Table Text Block] |
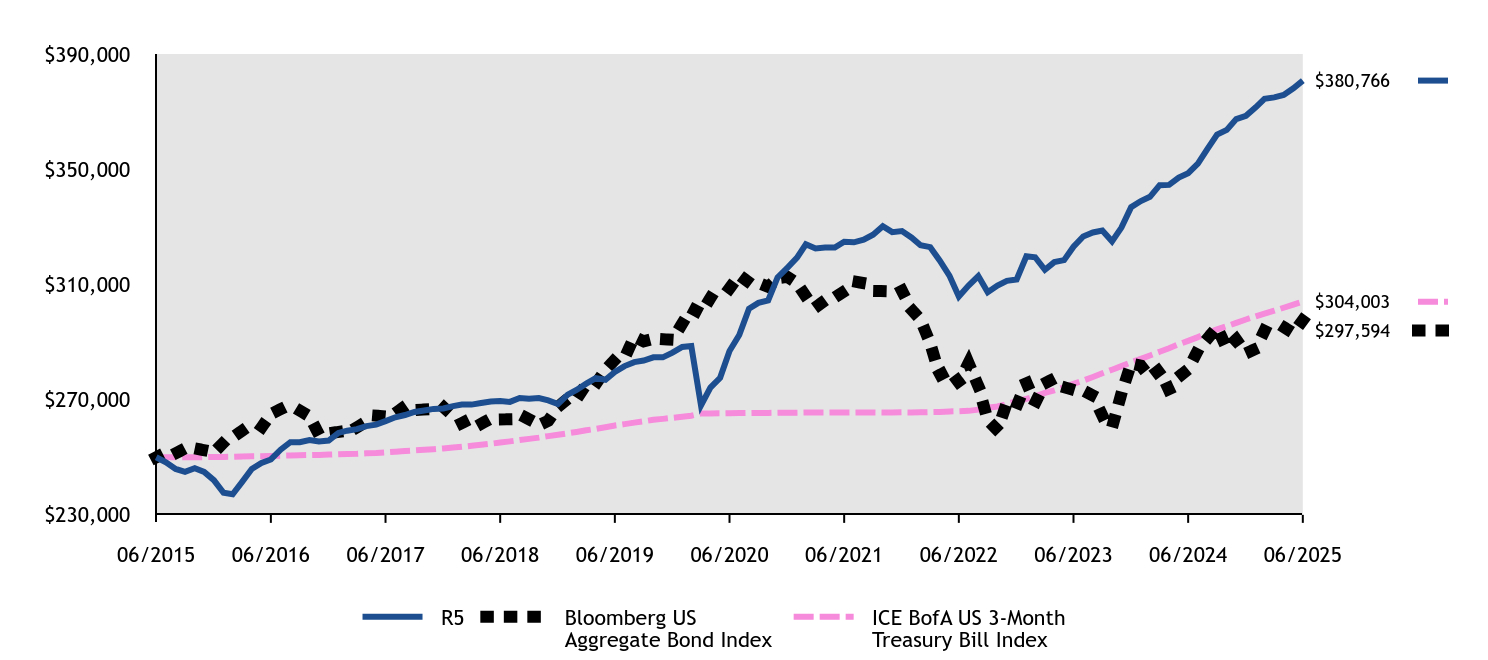
|
R5 |
Bloomberg US Aggregate Bond Index |
ICE BofA US 3-Month Treasury Bill Index |
06/2015 |
$250,000 |
$250,000 |
$250,000 |
07/2015 |
$248,222 |
$251,738 |
$249,986 |
08/2015 |
$245,935 |
$251,376 |
$250,025 |
09/2015 |
$244,919 |
$253,077 |
$250,029 |
10/2015 |
$246,189 |
$253,119 |
$250,011 |
11/2015 |
$244,919 |
$252,450 |
$250,025 |
12/2015 |
$242,068 |
$251,634 |
$250,109 |
01/2016 |
$237,667 |
$255,097 |
$250,116 |
02/2016 |
$237,149 |
$256,907 |
$250,178 |
03/2016 |
$241,550 |
$259,264 |
$250,294 |
04/2016 |
$245,951 |
$260,259 |
$250,359 |
05/2016 |
$248,022 |
$260,326 |
$250,381 |
06/2016 |
$249,237 |
$265,003 |
$250,475 |
07/2016 |
$252,622 |
$266,679 |
$250,544 |
08/2016 |
$255,227 |
$266,374 |
$250,591 |
09/2016 |
$255,227 |
$266,217 |
$250,714 |
10/2016 |
$256,008 |
$264,181 |
$250,776 |
11/2016 |
$255,487 |
$257,932 |
$250,819 |
12/2016 |
$255,818 |
$258,296 |
$250,924 |
01/2017 |
$258,442 |
$258,803 |
$251,037 |
02/2017 |
$259,229 |
$260,542 |
$251,142 |
03/2017 |
$259,754 |
$260,406 |
$251,185 |
04/2017 |
$260,803 |
$262,415 |
$251,356 |
05/2017 |
$261,328 |
$264,435 |
$251,482 |
06/2017 |
$262,556 |
$264,169 |
$251,693 |
07/2017 |
$263,878 |
$265,306 |
$251,907 |
08/2017 |
$264,671 |
$267,685 |
$252,142 |
09/2017 |
$265,729 |
$266,411 |
$252,360 |
10/2017 |
$266,257 |
$266,565 |
$252,584 |
11/2017 |
$266,786 |
$266,223 |
$252,795 |
12/2017 |
$266,950 |
$267,445 |
$253,074 |
01/2018 |
$267,752 |
$264,364 |
$253,378 |
02/2018 |
$268,286 |
$261,858 |
$253,617 |
03/2018 |
$268,286 |
$263,538 |
$253,973 |
04/2018 |
$268,821 |
$261,578 |
$254,306 |
05/2018 |
$269,355 |
$263,444 |
$254,694 |
06/2018 |
$269,496 |
$263,120 |
$255,122 |
07/2018 |
$269,227 |
$263,183 |
$255,520 |
08/2018 |
$270,574 |
$264,877 |
$255,981 |
09/2018 |
$270,305 |
$263,171 |
$256,376 |
10/2018 |
$270,574 |
$261,091 |
$256,818 |
11/2018 |
$269,766 |
$262,650 |
$257,347 |
12/2018 |
$268,483 |
$267,475 |
$257,818 |
01/2019 |
$271,751 |
$270,315 |
$258,326 |
02/2019 |
$273,384 |
$270,159 |
$258,786 |
03/2019 |
$275,563 |
$275,346 |
$259,366 |
04/2019 |
$277,469 |
$275,417 |
$259,852 |
05/2019 |
$276,924 |
$280,306 |
$260,446 |
06/2019 |
$279,647 |
$283,826 |
$261,022 |
07/2019 |
$281,656 |
$284,450 |
$261,497 |
08/2019 |
$283,037 |
$291,821 |
$262,034 |
09/2019 |
$283,589 |
$290,267 |
$262,490 |
10/2019 |
$284,694 |
$291,141 |
$262,994 |
11/2019 |
$284,694 |
$290,993 |
$263,324 |
12/2019 |
$286,340 |
$290,790 |
$263,697 |
01/2020 |
$288,317 |
$296,386 |
$264,053 |
02/2020 |
$288,599 |
$301,721 |
$264,440 |
03/2020 |
$267,985 |
$299,945 |
$265,212 |
04/2020 |
$274,198 |
$305,277 |
$265,234 |
05/2020 |
$277,586 |
$306,698 |
$265,238 |
06/2020 |
$286,905 |
$308,630 |
$265,274 |
07/2020 |
$292,468 |
$313,240 |
$265,325 |
08/2020 |
$301,589 |
$310,712 |
$265,347 |
09/2020 |
$303,585 |
$310,541 |
$265,376 |
10/2020 |
$304,440 |
$309,155 |
$265,405 |
11/2020 |
$312,422 |
$312,188 |
$265,430 |
12/2020 |
$315,789 |
$312,618 |
$265,459 |
01/2021 |
$319,285 |
$310,377 |
$265,481 |
02/2021 |
$323,946 |
$305,895 |
$265,506 |
03/2021 |
$322,490 |
$302,075 |
$265,524 |
04/2021 |
$322,781 |
$304,462 |
$265,528 |
05/2021 |
$322,781 |
$305,457 |
$265,535 |
06/2021 |
$324,820 |
$307,603 |
$265,524 |
07/2021 |
$324,628 |
$311,042 |
$265,539 |
08/2021 |
$325,510 |
$310,450 |
$265,550 |
09/2021 |
$327,275 |
$307,762 |
$265,564 |
10/2021 |
$330,215 |
$307,677 |
$265,553 |
11/2021 |
$328,157 |
$308,587 |
$265,568 |
12/2021 |
$328,539 |
$307,798 |
$265,589 |
01/2022 |
$326,234 |
$301,167 |
$265,575 |
02/2022 |
$323,601 |
$297,807 |
$265,611 |
03/2022 |
$322,942 |
$289,533 |
$265,691 |
04/2022 |
$318,333 |
$278,546 |
$265,731 |
05/2022 |
$313,066 |
$280,342 |
$265,912 |
06/2022 |
$305,824 |
$275,944 |
$265,970 |
07/2022 |
$309,597 |
$282,686 |
$266,108 |
08/2022 |
$312,918 |
$274,699 |
$266,535 |
09/2022 |
$307,271 |
$262,830 |
$267,199 |
10/2022 |
$309,597 |
$259,426 |
$267,619 |
11/2022 |
$311,257 |
$268,966 |
$268,482 |
12/2022 |
$311,738 |
$267,753 |
$269,453 |
01/2023 |
$319,766 |
$275,990 |
$270,298 |
02/2023 |
$319,431 |
$268,854 |
$271,179 |
03/2023 |
$315,083 |
$275,684 |
$272,346 |
04/2023 |
$317,759 |
$277,355 |
$273,205 |
05/2023 |
$318,428 |
$274,335 |
$274,274 |
06/2023 |
$323,111 |
$273,356 |
$275,528 |
07/2023 |
$326,662 |
$273,166 |
$276,626 |
08/2023 |
$328,030 |
$271,421 |
$277,873 |
09/2023 |
$328,714 |
$264,524 |
$279,149 |
10/2023 |
$324,951 |
$260,349 |
$280,396 |
11/2023 |
$329,740 |
$272,139 |
$281,654 |
12/2023 |
$336,830 |
$282,556 |
$282,966 |
01/2024 |
$338,942 |
$281,781 |
$284,176 |
02/2024 |
$340,421 |
$277,799 |
$285,340 |
03/2024 |
$344,475 |
$280,365 |
$286,623 |
04/2024 |
$344,562 |
$273,283 |
$287,852 |
05/2024 |
$347,126 |
$277,916 |
$289,233 |
06/2024 |
$348,641 |
$280,547 |
$290,411 |
07/2024 |
$351,969 |
$287,100 |
$291,712 |
08/2024 |
$357,169 |
$291,226 |
$293,107 |
09/2024 |
$361,992 |
$295,125 |
$294,380 |
10/2024 |
$363,646 |
$287,806 |
$295,500 |
11/2024 |
$367,385 |
$290,849 |
$296,627 |
12/2024 |
$368,523 |
$286,089 |
$297,827 |
01/2025 |
$371,480 |
$287,607 |
$298,921 |
02/2025 |
$374,467 |
$293,935 |
$299,871 |
03/2025 |
$374,950 |
$294,045 |
$300,875 |
04/2025 |
$375,768 |
$295,201 |
$301,908 |
05/2025 |
$378,117 |
$293,087 |
$303,006 |
06/2025 |
$380,766 |
$297,594 |
$304,003 |
|
|
| Average Annual Return [Table Text Block] |
HEADER |
1 Year |
5 Years |
10 Years |
Class R5Footnote Reference1 |
9.21% |
5.82% |
4.30% |
Bloomberg US Aggregate Bond Index |
6.08% |
(0.73)% |
1.76% |
ICE BofA US 3-Month Treasury Bill Index |
4.68% |
2.76% |
1.98% | |
|
| No Deduction of Taxes [Text Block] |
The graph and table do not reflect the deduction of taxes that a shareholder would pay on fund distributions or redemption of fund shares.
|
|
| Performance Table Market Index Changed [Text Block] |
The Bloomberg US Aggregate Bond Index is replacing the ICE BofA US 3-Month Treasury Bill Index as broad-based securities market index to comply with a new regulatory requirement.
|
|
| AssetsNet |
$ 298,401,454
|
|
| Holdings Count | Holding |
210
|
|
| Advisory Fees Paid, Amount |
$ 1,590,030
|
|
| InvestmentCompanyPortfolioTurnover |
172.00%
|
|
| Additional Fund Statistics [Text Block] |
Total Net Assets |
$298,401,454 |
# of Portfolio Holdings |
210 |
Portfolio Turnover Rate |
172% |
Total Management Fees Paid |
$1,590,030 | |
|
| Holdings [Text Block] |
Asset Allocation - % Investments
Convertible Obligations |
114.7 |
Convertible Preferred Stocks |
15.3 |
Investment Companies |
8.3 |
Foreign Convertible Obligations |
5.4 |
Preferred Stocks |
3.0 |
Common Stocks |
(46.7) | Top Ten Industry Allocations - % Fixed Income
Value |
Value |
Entertainment |
4.2 |
Electric |
4.5 |
Media |
4.6 |
Diversified Financial Services |
4.7 |
Internet |
4.8 |
Computers |
6.0 |
Pharmaceuticals |
6.8 |
Health Care - Products |
9.8 |
REITS |
11.7 |
Software |
12.1 | Includes long positions only. |
|
| Largest Holdings [Text Block] |
Top Ten Holdings - % Net Assets
Redwood Trust, Inc., 7.750%, Due 6/15/2027 |
1.8 |
Western Digital Corp., 3.000%, Due 11/15/2028 |
1.8 |
Live Nation Entertainment, Inc., 3.125%, Due 1/15/2029 |
1.6 |
BrightSpring Health Services, Inc., 6.750%, Due 2/1/2027 |
1.6 |
ARES Management Corp., Series B, 6.750%, Due 10/1/2027 |
1.4 |
LendingTree, Inc., 0.500%, Due 7/15/2025 |
1.4 |
Two Harbors Investment Corp., 6.250%, Due 1/15/2026 |
1.4 |
Enovis Corp., 3.875%, Due 10/15/2028 |
1.4 |
Sirius XM Holdings, Inc., 3.750%, Due 3/15/2028 |
1.4 |
Arbor Realty Trust, Inc., 7.500%, Due 8/1/2025 |
1.4 | Includes long positions only. |
|
| Material Fund Change [Text Block] |
|
|
| C000207659 |
|
|
| Shareholder Report [Line Items] |
|
|
| Fund Name |
SSI Alternative Income Fund
|
|
| Class Name |
Y
|
|
| Trading Symbol |
PSCIX
|
|
| Annual or Semi-Annual Statement [Text Block] |
This annual shareholder report contains important information about American Beacon SSI Alternative Income Fund for the period of July 1, 2024 to June 30, 2025.
|
|
| Shareholder Report Annual or Semi-Annual |
Annual Shareholder Report
|
|
| Additional Information [Text Block] |
You can find additional information about the Fund at www.americanbeaconfunds.com/literature. You can also request this information by contacting us at 800-658-5811.
|
|
| Additional Information Phone Number |
800-658-5811
|
|
| Additional Information Website |
<span style="box-sizing: border-box; color: rgb(0, 0, 0); display: inline; flex-wrap: nowrap; font-size: 13.3333px; font-weight: 400; grid-area: auto; line-height: 16px; margin: 0px; overflow: visible; text-align: left; text-align-last: auto; white-space-collapse: preserve-breaks;">www.americanbeaconfunds.com/literature</span>
|
|
| Expenses [Text Block] |
What were the Fund costs for the last year?(based on a hypothetical $10,000 investment)
Class Name |
Costs of a $10,000 investment |
Costs paid as a percentage of a $10,000 investment |
Y |
$148 |
1.42% | |
|
| Expenses Paid, Amount |
$ 148
|
|
| Expense Ratio, Percent |
1.42%
|
|
| Factors Affecting Performance [Text Block] |
How did the Fund perform and what affected its performance? The Y Class of the Fund returned 9.11% for the twelve months ended June 30, 2025, compared to the Bloomberg U.S. Aggregate Bond Index return of 6.08% and the ICE BofA U.S. 3-Month Treasury Bill Index return of 4.68%. • The Fund demonstrated attractive performance during the period as its hedged convertible bond strategy capitalized on equity market volatility and elevated interest rates. Income was a significant source of total return for the Fund. • Credit spreads also improved during the period as risk markets were resilient. • The Fund’s holdings were diversified across sectors and industries with no individual position having a material impact on performance. |
|
| Performance Past Does Not Indicate Future [Text] |
Performance shown is historical and is not indicative of future returns.
|
|
| Line Graph [Table Text Block] |
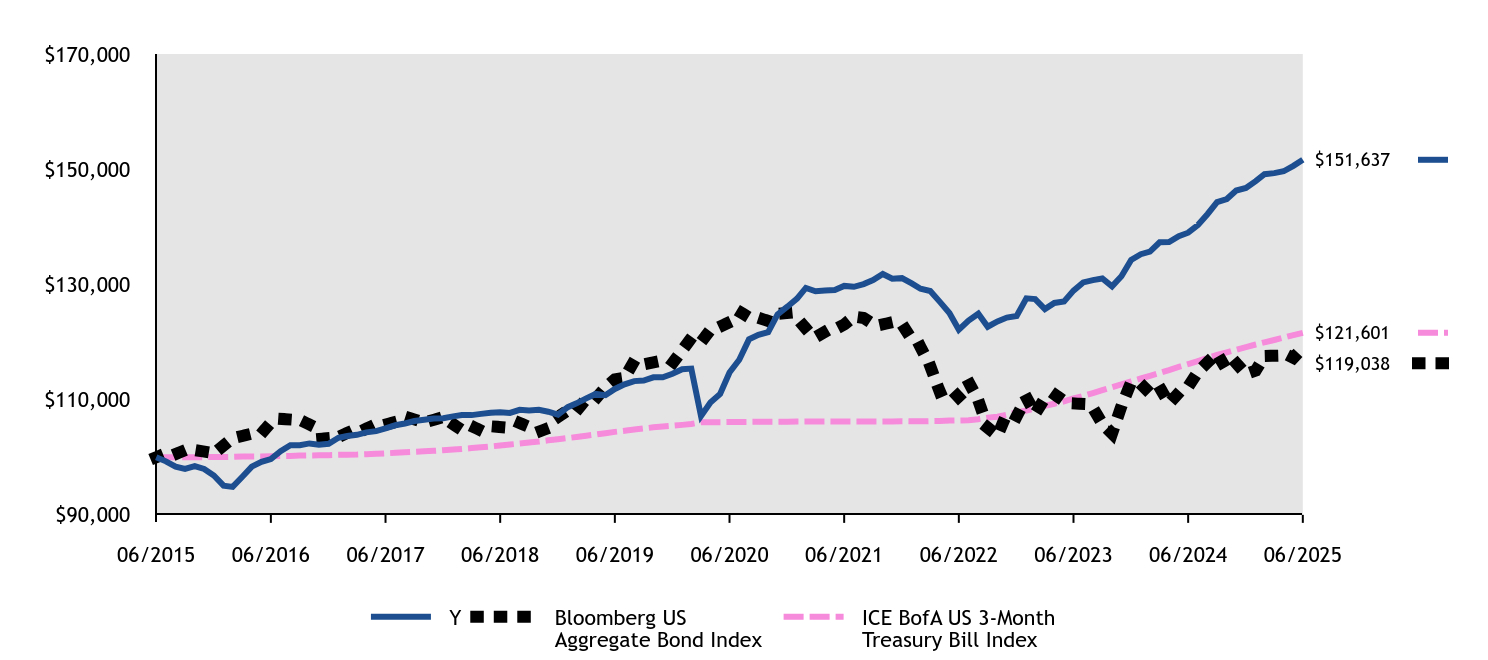
#ERROR:A result could not be returned because the conditional could not be evaluated to a True/False value (#ERROR:Invalid Formula (#!=""), 'Multiple values from an iterator cannot be used in a formula unless they are aggregrated.') |
Y |
Bloomberg US Aggregate Bond Index |
ICE BofA US 3-Month Treasury Bill Index |
06/2015 |
$100,000 |
$100,000 |
$100,000 |
07/2015 |
$99,289 |
$100,695 |
$99,994 |
08/2015 |
$98,374 |
$100,551 |
$100,010 |
09/2015 |
$97,967 |
$101,231 |
$100,012 |
10/2015 |
$98,476 |
$101,247 |
$100,004 |
11/2015 |
$97,967 |
$100,980 |
$100,010 |
12/2015 |
$96,827 |
$100,654 |
$100,043 |
01/2016 |
$95,067 |
$102,039 |
$100,046 |
02/2016 |
$94,860 |
$102,763 |
$100,071 |
03/2016 |
$96,620 |
$103,705 |
$100,117 |
04/2016 |
$98,381 |
$104,104 |
$100,144 |
05/2016 |
$99,209 |
$104,130 |
$100,152 |
06/2016 |
$99,695 |
$106,001 |
$100,190 |
07/2016 |
$101,049 |
$106,671 |
$100,217 |
08/2016 |
$102,091 |
$106,549 |
$100,236 |
09/2016 |
$102,091 |
$106,487 |
$100,286 |
10/2016 |
$102,403 |
$105,672 |
$100,310 |
11/2016 |
$102,195 |
$103,173 |
$100,328 |
12/2016 |
$102,327 |
$103,318 |
$100,370 |
01/2017 |
$103,377 |
$103,521 |
$100,415 |
02/2017 |
$103,692 |
$104,217 |
$100,457 |
03/2017 |
$103,901 |
$104,162 |
$100,474 |
04/2017 |
$104,321 |
$104,966 |
$100,542 |
05/2017 |
$104,531 |
$105,774 |
$100,593 |
06/2017 |
$105,022 |
$105,668 |
$100,677 |
07/2017 |
$105,551 |
$106,122 |
$100,763 |
08/2017 |
$105,868 |
$107,074 |
$100,857 |
09/2017 |
$106,291 |
$106,564 |
$100,944 |
10/2017 |
$106,503 |
$106,626 |
$101,034 |
11/2017 |
$106,715 |
$106,489 |
$101,118 |
12/2017 |
$106,780 |
$106,978 |
$101,229 |
01/2018 |
$107,101 |
$105,746 |
$101,351 |
02/2018 |
$107,315 |
$104,743 |
$101,447 |
03/2018 |
$107,315 |
$105,415 |
$101,589 |
04/2018 |
$107,528 |
$104,631 |
$101,722 |
05/2018 |
$107,742 |
$105,378 |
$101,878 |
06/2018 |
$107,799 |
$105,248 |
$102,049 |
07/2018 |
$107,691 |
$105,273 |
$102,208 |
08/2018 |
$108,230 |
$105,951 |
$102,392 |
09/2018 |
$108,122 |
$105,268 |
$102,550 |
10/2018 |
$108,230 |
$104,436 |
$102,727 |
11/2018 |
$107,906 |
$105,060 |
$102,939 |
12/2018 |
$107,393 |
$106,990 |
$103,127 |
01/2019 |
$108,700 |
$108,126 |
$103,330 |
02/2019 |
$109,354 |
$108,064 |
$103,514 |
03/2019 |
$110,225 |
$110,139 |
$103,746 |
04/2019 |
$110,988 |
$110,167 |
$103,941 |
05/2019 |
$110,770 |
$112,122 |
$104,178 |
06/2019 |
$111,859 |
$113,530 |
$104,409 |
07/2019 |
$112,663 |
$113,780 |
$104,599 |
08/2019 |
$113,215 |
$116,728 |
$104,813 |
09/2019 |
$113,325 |
$116,107 |
$104,996 |
10/2019 |
$113,878 |
$116,456 |
$105,198 |
11/2019 |
$113,878 |
$116,397 |
$105,330 |
12/2019 |
$114,485 |
$116,316 |
$105,479 |
01/2020 |
$115,276 |
$118,554 |
$105,621 |
02/2020 |
$115,389 |
$120,688 |
$105,776 |
03/2020 |
$107,146 |
$119,978 |
$106,085 |
04/2020 |
$109,517 |
$122,111 |
$106,094 |
05/2020 |
$110,985 |
$122,679 |
$106,095 |
06/2020 |
$114,711 |
$123,452 |
$106,110 |
07/2020 |
$116,935 |
$125,296 |
$106,130 |
08/2020 |
$120,468 |
$124,285 |
$106,139 |
09/2020 |
$121,266 |
$124,217 |
$106,150 |
10/2020 |
$121,722 |
$123,662 |
$106,162 |
11/2020 |
$124,799 |
$124,875 |
$106,172 |
12/2020 |
$126,135 |
$125,047 |
$106,184 |
01/2021 |
$127,533 |
$124,151 |
$106,192 |
02/2021 |
$129,396 |
$122,358 |
$106,202 |
03/2021 |
$128,814 |
$120,830 |
$106,210 |
04/2021 |
$128,931 |
$121,785 |
$106,211 |
05/2021 |
$129,047 |
$122,183 |
$106,214 |
06/2021 |
$129,746 |
$123,041 |
$106,210 |
07/2021 |
$129,585 |
$124,417 |
$106,215 |
08/2021 |
$130,055 |
$124,180 |
$106,220 |
09/2021 |
$130,760 |
$123,105 |
$106,226 |
10/2021 |
$131,818 |
$123,071 |
$106,221 |
11/2021 |
$130,995 |
$123,435 |
$106,227 |
12/2021 |
$131,091 |
$123,119 |
$106,236 |
01/2022 |
$130,171 |
$120,467 |
$106,230 |
02/2022 |
$129,251 |
$119,123 |
$106,244 |
03/2022 |
$128,856 |
$115,813 |
$106,276 |
04/2022 |
$127,015 |
$111,418 |
$106,292 |
05/2022 |
$125,043 |
$112,137 |
$106,365 |
06/2022 |
$122,150 |
$110,378 |
$106,388 |
07/2022 |
$123,717 |
$113,075 |
$106,443 |
08/2022 |
$124,910 |
$109,879 |
$106,614 |
09/2022 |
$122,656 |
$105,132 |
$106,880 |
10/2022 |
$123,584 |
$103,770 |
$107,048 |
11/2022 |
$124,247 |
$107,586 |
$107,393 |
12/2022 |
$124,523 |
$107,101 |
$107,781 |
01/2023 |
$127,593 |
$110,396 |
$108,119 |
02/2023 |
$127,459 |
$107,542 |
$108,471 |
03/2023 |
$125,724 |
$110,274 |
$108,938 |
04/2023 |
$126,792 |
$110,942 |
$109,282 |
05/2023 |
$127,059 |
$109,734 |
$109,710 |
06/2023 |
$128,928 |
$109,342 |
$110,211 |
07/2023 |
$130,345 |
$109,266 |
$110,651 |
08/2023 |
$130,754 |
$108,568 |
$111,149 |
09/2023 |
$131,027 |
$105,809 |
$111,660 |
10/2023 |
$129,662 |
$104,140 |
$112,158 |
11/2023 |
$131,436 |
$108,856 |
$112,661 |
12/2023 |
$134,265 |
$113,023 |
$113,186 |
01/2024 |
$135,248 |
$112,712 |
$113,671 |
02/2024 |
$135,698 |
$111,120 |
$114,136 |
03/2024 |
$137,316 |
$112,146 |
$114,649 |
04/2024 |
$137,351 |
$109,313 |
$115,141 |
05/2024 |
$138,374 |
$111,166 |
$115,693 |
06/2024 |
$138,979 |
$112,219 |
$116,164 |
07/2024 |
$140,303 |
$114,840 |
$116,685 |
08/2024 |
$142,233 |
$116,490 |
$117,243 |
09/2024 |
$144,303 |
$118,050 |
$117,752 |
10/2024 |
$144,818 |
$115,122 |
$118,200 |
11/2024 |
$146,303 |
$116,340 |
$118,651 |
12/2024 |
$146,755 |
$114,436 |
$119,131 |
01/2025 |
$147,935 |
$115,043 |
$119,569 |
02/2025 |
$149,127 |
$117,574 |
$119,948 |
03/2025 |
$149,320 |
$117,618 |
$120,350 |
04/2025 |
$149,645 |
$118,080 |
$120,763 |
05/2025 |
$150,582 |
$117,235 |
$121,202 |
06/2025 |
$151,637 |
$119,038 |
$121,601 |
|
|
| Average Annual Return [Table Text Block] |
HEADER |
1 Year |
5 Years |
10 Years |
Class YFootnote Reference1 |
9.11% |
5.74% |
4.25% |
Bloomberg US Aggregate Bond Index |
6.08% |
(0.73)% |
1.76% |
ICE BofA US 3-Month Treasury Bill Index |
4.68% |
2.76% |
1.98% | |
|
| No Deduction of Taxes [Text Block] |
The graph and table do not reflect the deduction of taxes that a shareholder would pay on fund distributions or redemption of fund shares.
|
|
| Performance Table Market Index Changed [Text Block] |
The Bloomberg US Aggregate Bond Index is replacing the ICE BofA US 3-Month Treasury Bill Index as broad-based securities market index to comply with a new regulatory requirement.
|
|
| AssetsNet |
$ 298,401,454
|
|
| Holdings Count | Holding |
210
|
|
| Advisory Fees Paid, Amount |
$ 1,590,030
|
|
| InvestmentCompanyPortfolioTurnover |
172.00%
|
|
| Additional Fund Statistics [Text Block] |
Total Net Assets |
$298,401,454 |
# of Portfolio Holdings |
210 |
Portfolio Turnover Rate |
172% |
Total Management Fees Paid |
$1,590,030 | |
|
| Holdings [Text Block] |
Asset Allocation - % Investments
Convertible Obligations |
114.7 |
Convertible Preferred Stocks |
15.3 |
Investment Companies |
8.3 |
Foreign Convertible Obligations |
5.4 |
Preferred Stocks |
3.0 |
Common Stocks |
(46.7) | Top Ten Industry Allocations - % Fixed Income
Value |
Value |
Entertainment |
4.2 |
Electric |
4.5 |
Media |
4.6 |
Diversified Financial Services |
4.7 |
Internet |
4.8 |
Computers |
6.0 |
Pharmaceuticals |
6.8 |
Health Care - Products |
9.8 |
REITS |
11.7 |
Software |
12.1 | Includes long positions only. |
|
| Largest Holdings [Text Block] |
Top Ten Holdings - % Net Assets
Redwood Trust, Inc., 7.750%, Due 6/15/2027 |
1.8 |
Western Digital Corp., 3.000%, Due 11/15/2028 |
1.8 |
Live Nation Entertainment, Inc., 3.125%, Due 1/15/2029 |
1.6 |
BrightSpring Health Services, Inc., 6.750%, Due 2/1/2027 |
1.6 |
ARES Management Corp., Series B, 6.750%, Due 10/1/2027 |
1.4 |
LendingTree, Inc., 0.500%, Due 7/15/2025 |
1.4 |
Two Harbors Investment Corp., 6.250%, Due 1/15/2026 |
1.4 |
Enovis Corp., 3.875%, Due 10/15/2028 |
1.4 |
Sirius XM Holdings, Inc., 3.750%, Due 3/15/2028 |
1.4 |
Arbor Realty Trust, Inc., 7.500%, Due 8/1/2025 |
1.4 | Includes long positions only. |
|
| Material Fund Change [Text Block] |
|
|
| C000207660 |
|
|
| Shareholder Report [Line Items] |
|
|
| Fund Name |
SSI Alternative Income Fund
|
|
| Class Name |
Investor
|
|
| Trading Symbol |
PSCAX
|
|
| Annual or Semi-Annual Statement [Text Block] |
This annual shareholder report contains important information about American Beacon SSI Alternative Income Fund for the period of July 1, 2024 to June 30, 2025.
|
|
| Shareholder Report Annual or Semi-Annual |
Annual Shareholder Report
|
|
| Additional Information [Text Block] |
You can find additional information about the Fund at www.americanbeaconfunds.com/literature. You can also request this information by contacting us at 800-658-5811.
|
|
| Additional Information Phone Number |
800-658-5811
|
|
| Additional Information Website |
<span style="box-sizing: border-box; color: rgb(0, 0, 0); display: inline; flex-wrap: nowrap; font-size: 13.3333px; font-weight: 400; grid-area: auto; line-height: 16px; margin: 0px; overflow: visible; text-align: left; text-align-last: auto; white-space-collapse: preserve-breaks;">www.americanbeaconfunds.com/literature</span>
|
|
| Expenses [Text Block] |
What were the Fund costs for the last year?(based on a hypothetical $10,000 investment)
Class Name |
Costs of a $10,000 investment |
Costs paid as a percentage of a $10,000 investment |
Investor |
$174 |
1.67% | |
|
| Expenses Paid, Amount |
$ 174
|
|
| Expense Ratio, Percent |
1.67%
|
|
| Factors Affecting Performance [Text Block] |
How did the Fund perform and what affected its performance? The Investor Class of the Fund returned 8.94% for the twelve months ended June 30, 2025, compared to the Bloomberg U.S. Aggregate Bond Index return of 6.08% and the ICE BofA U.S. 3-Month Treasury Bill Index return of 4.68%. • The Fund demonstrated attractive performance during the period as its hedged convertible bond strategy capitalized on equity market volatility and elevated interest rates. Income was a significant source of total return for the Fund. • Credit spreads also improved during the period as risk markets were resilient. • The Fund’s holdings were diversified across sectors and industries with no individual position having a material impact on performance. |
|
| Performance Past Does Not Indicate Future [Text] |
Performance shown is historical and is not indicative of future returns.
|
|
| Line Graph [Table Text Block] |
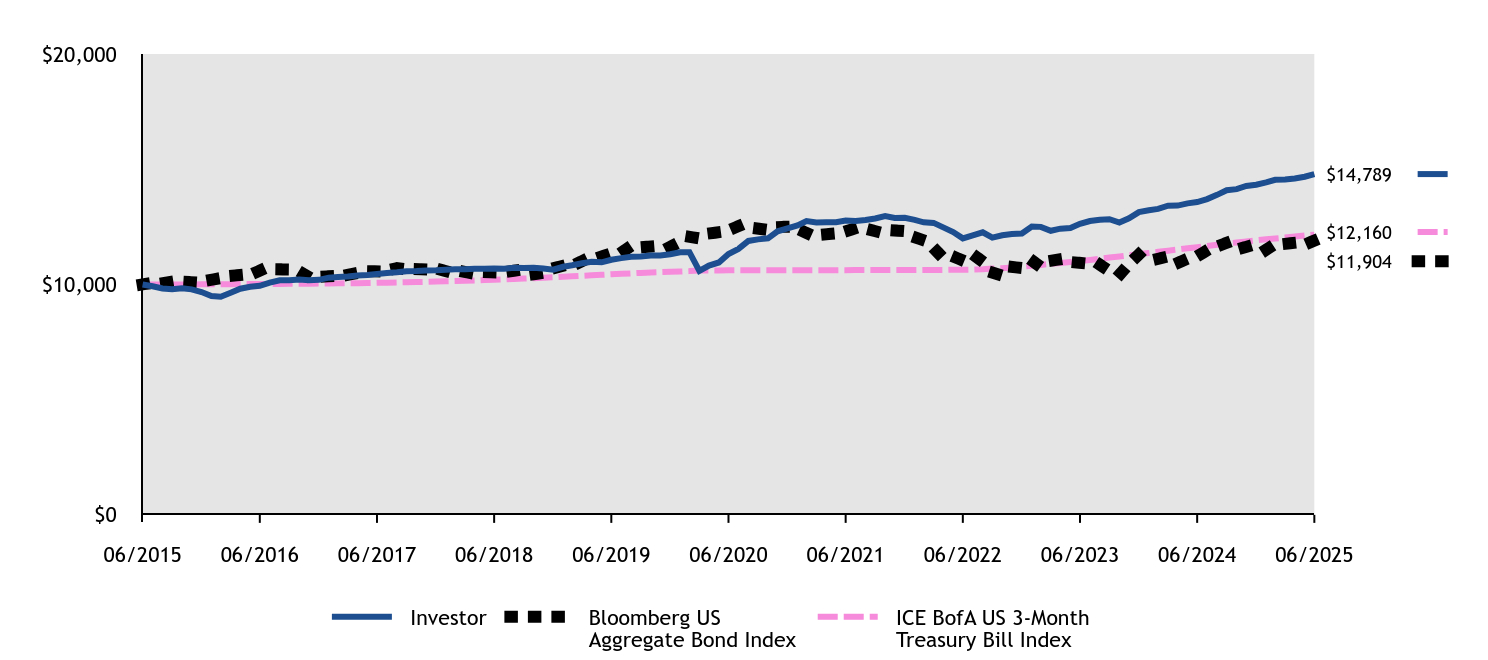
|
Investor |
Bloomberg US Aggregate Bond Index |
ICE BofA US 3-Month Treasury Bill Index |
06/2015 |
$10,000 |
$10,000 |
$10,000 |
07/2015 |
$9,919 |
$10,070 |
$9,999 |
08/2015 |
$9,827 |
$10,055 |
$10,001 |
09/2015 |
$9,787 |
$10,123 |
$10,001 |
10/2015 |
$9,837 |
$10,125 |
$10,000 |
11/2015 |
$9,787 |
$10,098 |
$10,001 |
12/2015 |
$9,669 |
$10,065 |
$10,004 |
01/2016 |
$9,494 |
$10,204 |
$10,005 |
02/2016 |
$9,463 |
$10,276 |
$10,007 |
03/2016 |
$9,638 |
$10,371 |
$10,012 |
04/2016 |
$9,814 |
$10,410 |
$10,014 |
05/2016 |
$9,897 |
$10,413 |
$10,015 |
06/2016 |
$9,942 |
$10,600 |
$10,019 |
07/2016 |
$10,077 |
$10,667 |
$10,022 |
08/2016 |
$10,181 |
$10,655 |
$10,024 |
09/2016 |
$10,181 |
$10,649 |
$10,029 |
10/2016 |
$10,213 |
$10,567 |
$10,031 |
11/2016 |
$10,181 |
$10,317 |
$10,033 |
12/2016 |
$10,198 |
$10,332 |
$10,037 |
01/2017 |
$10,293 |
$10,352 |
$10,041 |
02/2017 |
$10,324 |
$10,422 |
$10,046 |
03/2017 |
$10,345 |
$10,416 |
$10,047 |
04/2017 |
$10,387 |
$10,497 |
$10,054 |
05/2017 |
$10,407 |
$10,577 |
$10,059 |
06/2017 |
$10,454 |
$10,567 |
$10,068 |
07/2017 |
$10,496 |
$10,612 |
$10,076 |
08/2017 |
$10,527 |
$10,707 |
$10,086 |
09/2017 |
$10,569 |
$10,656 |
$10,094 |
10/2017 |
$10,580 |
$10,663 |
$10,103 |
11/2017 |
$10,601 |
$10,649 |
$10,112 |
12/2017 |
$10,612 |
$10,698 |
$10,123 |
01/2018 |
$10,633 |
$10,575 |
$10,135 |
02/2018 |
$10,654 |
$10,474 |
$10,145 |
03/2018 |
$10,654 |
$10,542 |
$10,159 |
04/2018 |
$10,676 |
$10,463 |
$10,172 |
05/2018 |
$10,686 |
$10,538 |
$10,188 |
06/2018 |
$10,690 |
$10,525 |
$10,205 |
07/2018 |
$10,679 |
$10,527 |
$10,221 |
08/2018 |
$10,722 |
$10,595 |
$10,239 |
09/2018 |
$10,711 |
$10,527 |
$10,255 |
10/2018 |
$10,722 |
$10,444 |
$10,273 |
11/2018 |
$10,690 |
$10,506 |
$10,294 |
12/2018 |
$10,638 |
$10,699 |
$10,313 |
01/2019 |
$10,767 |
$10,813 |
$10,333 |
02/2019 |
$10,832 |
$10,806 |
$10,351 |
03/2019 |
$10,918 |
$11,014 |
$10,375 |
04/2019 |
$10,983 |
$11,017 |
$10,394 |
05/2019 |
$10,961 |
$11,212 |
$10,418 |
06/2019 |
$11,069 |
$11,353 |
$10,441 |
07/2019 |
$11,142 |
$11,378 |
$10,460 |
08/2019 |
$11,197 |
$11,673 |
$10,481 |
09/2019 |
$11,208 |
$11,611 |
$10,500 |
10/2019 |
$11,252 |
$11,646 |
$10,520 |
11/2019 |
$11,252 |
$11,640 |
$10,533 |
12/2019 |
$11,310 |
$11,632 |
$10,548 |
01/2020 |
$11,399 |
$11,855 |
$10,562 |
02/2020 |
$11,399 |
$12,069 |
$10,578 |
03/2020 |
$10,585 |
$11,998 |
$10,608 |
04/2020 |
$10,819 |
$12,211 |
$10,609 |
05/2020 |
$10,953 |
$12,268 |
$10,610 |
06/2020 |
$11,321 |
$12,345 |
$10,611 |
07/2020 |
$11,540 |
$12,530 |
$10,613 |
08/2020 |
$11,888 |
$12,428 |
$10,614 |
09/2020 |
$11,956 |
$12,422 |
$10,615 |
10/2020 |
$12,001 |
$12,366 |
$10,616 |
11/2020 |
$12,304 |
$12,488 |
$10,617 |
12/2020 |
$12,437 |
$12,505 |
$10,618 |
01/2021 |
$12,563 |
$12,415 |
$10,619 |
02/2021 |
$12,747 |
$12,236 |
$10,620 |
03/2021 |
$12,690 |
$12,083 |
$10,621 |
04/2021 |
$12,701 |
$12,178 |
$10,621 |
05/2021 |
$12,701 |
$12,218 |
$10,621 |
06/2021 |
$12,770 |
$12,304 |
$10,621 |
07/2021 |
$12,758 |
$12,442 |
$10,622 |
08/2021 |
$12,793 |
$12,418 |
$10,622 |
09/2021 |
$12,862 |
$12,310 |
$10,623 |
10/2021 |
$12,966 |
$12,307 |
$10,622 |
11/2021 |
$12,885 |
$12,343 |
$10,623 |
12/2021 |
$12,890 |
$12,312 |
$10,624 |
01/2022 |
$12,800 |
$12,047 |
$10,623 |
02/2022 |
$12,696 |
$11,912 |
$10,624 |
03/2022 |
$12,671 |
$11,581 |
$10,628 |
04/2022 |
$12,477 |
$11,142 |
$10,629 |
05/2022 |
$12,271 |
$11,214 |
$10,636 |
06/2022 |
$12,000 |
$11,038 |
$10,639 |
07/2022 |
$12,134 |
$11,307 |
$10,644 |
08/2022 |
$12,264 |
$10,988 |
$10,661 |
09/2022 |
$12,031 |
$10,513 |
$10,688 |
10/2022 |
$12,134 |
$10,377 |
$10,705 |
11/2022 |
$12,186 |
$10,759 |
$10,739 |
12/2022 |
$12,211 |
$10,710 |
$10,778 |
01/2023 |
$12,511 |
$11,040 |
$10,812 |
02/2023 |
$12,498 |
$10,754 |
$10,847 |
03/2023 |
$12,328 |
$11,027 |
$10,894 |
04/2023 |
$12,419 |
$11,094 |
$10,928 |
05/2023 |
$12,445 |
$10,973 |
$10,971 |
06/2023 |
$12,628 |
$10,934 |
$11,021 |
07/2023 |
$12,752 |
$10,927 |
$11,065 |
08/2023 |
$12,806 |
$10,857 |
$11,115 |
09/2023 |
$12,832 |
$10,581 |
$11,166 |
10/2023 |
$12,686 |
$10,414 |
$11,216 |
11/2023 |
$12,872 |
$10,886 |
$11,266 |
12/2023 |
$13,140 |
$11,302 |
$11,319 |
01/2024 |
$13,222 |
$11,271 |
$11,367 |
02/2024 |
$13,278 |
$11,112 |
$11,414 |
03/2024 |
$13,420 |
$11,215 |
$11,465 |
04/2024 |
$13,421 |
$10,931 |
$11,514 |
05/2024 |
$13,519 |
$11,117 |
$11,569 |
06/2024 |
$13,575 |
$11,222 |
$11,616 |
07/2024 |
$13,702 |
$11,484 |
$11,668 |
08/2024 |
$13,887 |
$11,649 |
$11,724 |
09/2024 |
$14,086 |
$11,805 |
$11,775 |
10/2024 |
$14,134 |
$11,512 |
$11,820 |
11/2024 |
$14,276 |
$11,634 |
$11,865 |
12/2024 |
$14,328 |
$11,444 |
$11,913 |
01/2025 |
$14,429 |
$11,504 |
$11,957 |
02/2025 |
$14,542 |
$11,757 |
$11,995 |
03/2025 |
$14,558 |
$11,762 |
$12,035 |
04/2025 |
$14,601 |
$11,808 |
$12,076 |
05/2025 |
$14,675 |
$11,723 |
$12,120 |
06/2025 |
$14,789 |
$11,904 |
$12,160 |
|
|
| Average Annual Return [Table Text Block] |
HEADER |
1 Year |
5 Years |
10 Years |
Investor ClassFootnote Reference1 |
8.94% |
5.49% |
3.99% |
Bloomberg US Aggregate Bond Index |
6.08% |
(0.73)% |
1.76% |
ICE BofA US 3-Month Treasury Bill Index |
4.68% |
2.76% |
1.98% | |
|
| No Deduction of Taxes [Text Block] |
The graph and table do not reflect the deduction of taxes that a shareholder would pay on fund distributions or redemption of fund shares.
|
|
| Performance Table Market Index Changed [Text Block] |
The Bloomberg US Aggregate Bond Index is replacing the ICE BofA US 3-Month Treasury Bill Index as broad-based securities market index to comply with a new regulatory requirement.
|
|
| AssetsNet |
$ 298,401,454
|
|
| Holdings Count | Holding |
210
|
|
| Advisory Fees Paid, Amount |
$ 1,590,030
|
|
| InvestmentCompanyPortfolioTurnover |
172.00%
|
|
| Additional Fund Statistics [Text Block] |
Total Net Assets |
$298,401,454 |
# of Portfolio Holdings |
210 |
Portfolio Turnover Rate |
172% |
Total Management Fees Paid |
$1,590,030 | |
|
| Holdings [Text Block] |
Asset Allocation - % Investments
Convertible Obligations |
114.7 |
Convertible Preferred Stocks |
15.3 |
Investment Companies |
8.3 |
Foreign Convertible Obligations |
5.4 |
Preferred Stocks |
3.0 |
Common Stocks |
(46.7) | Top Ten Industry Allocations - % Fixed Income
Value |
Value |
Entertainment |
4.2 |
Electric |
4.5 |
Media |
4.6 |
Diversified Financial Services |
4.7 |
Internet |
4.8 |
Computers |
6.0 |
Pharmaceuticals |
6.8 |
Health Care - Products |
9.8 |
REITS |
11.7 |
Software |
12.1 | Includes long positions only. |
|
| Largest Holdings [Text Block] |
Top Ten Holdings - % Net Assets
Redwood Trust, Inc., 7.750%, Due 6/15/2027 |
1.8 |
Western Digital Corp., 3.000%, Due 11/15/2028 |
1.8 |
Live Nation Entertainment, Inc., 3.125%, Due 1/15/2029 |
1.6 |
BrightSpring Health Services, Inc., 6.750%, Due 2/1/2027 |
1.6 |
ARES Management Corp., Series B, 6.750%, Due 10/1/2027 |
1.4 |
LendingTree, Inc., 0.500%, Due 7/15/2025 |
1.4 |
Two Harbors Investment Corp., 6.250%, Due 1/15/2026 |
1.4 |
Enovis Corp., 3.875%, Due 10/15/2028 |
1.4 |
Sirius XM Holdings, Inc., 3.750%, Due 3/15/2028 |
1.4 |
Arbor Realty Trust, Inc., 7.500%, Due 8/1/2025 |
1.4 | Includes long positions only. |
|
| Material Fund Change [Text Block] |
|
|
| C000217746 |
|
|
| Shareholder Report [Line Items] |
|
|
| Fund Name |
TwentyFour Sustainable Short Term Bond Fund
|
|
| Class Name |
A
|
|
| Trading Symbol |
TFBAX
|
|
| Annual or Semi-Annual Statement [Text Block] |
This annual shareholder report contains important information about American Beacon TwentyFour Sustainable Short Term Bond Fund for the period of July 1, 2024 to June 30, 2025.
|
|
| Shareholder Report Annual or Semi-Annual |
Annual Shareholder Report
|
|
| Additional Information [Text Block] |
You can find additional information about the Fund at www.americanbeaconfunds.com/literature. You can also request this information by contacting us at 800-658-5811.
|
|
| Additional Information Phone Number |
800-658-5811
|
|
| Additional Information Website |
<span style="box-sizing: border-box; color: rgb(0, 0, 0); display: inline; flex-wrap: nowrap; font-size: 13.3333px; font-weight: 400; grid-area: auto; line-height: 16px; margin: 0px; overflow: visible; text-align: left; text-align-last: auto; white-space-collapse: preserve-breaks;">www.americanbeaconfunds.com/literature</span>
|
|
| Expenses [Text Block] |
What were the Fund costs for the last year?(based on a hypothetical $10,000 investment)
Class Name |
Costs of a $10,000 investment |
Costs paid as a percentage of a $10,000 investment |
Class A |
$90 |
0.87% | |
|
| Expenses Paid, Amount |
$ 90
|
|
| Expense Ratio, Percent |
0.87%
|
|
| Factors Affecting Performance [Text Block] |
How did the Fund perform and what affected its performance? The A Class of the Fund returned 3.37% (with sales charges) and 6.00% (without sales charges) for the twelve months ended June 30, 2025, compared to the Bloomberg Global-Aggregate Total Return Index Value Hedged USD return of 6.15% and the ICE BofA 1-3 Year U.S. Corporate Index return of 6.61%. • The Fund’s duration position contributed to performance as shorter-term interest rates declined while longer-term interest rates rose. • The Fund held a variety of exposures across credit sectors that the sub-advisor deemed to offer attractive yield, and most sectors contributed positively to total returns given strong credit markets. • Investments in the Financial sector, including Banking and Insurance, generated the largest contribution to the Fund’s return, followed by selections in Government Bonds. |
|
| Performance Past Does Not Indicate Future [Text] |
Performance shown is historical and is not indicative of future returns.
|
|
| Line Graph [Table Text Block] |
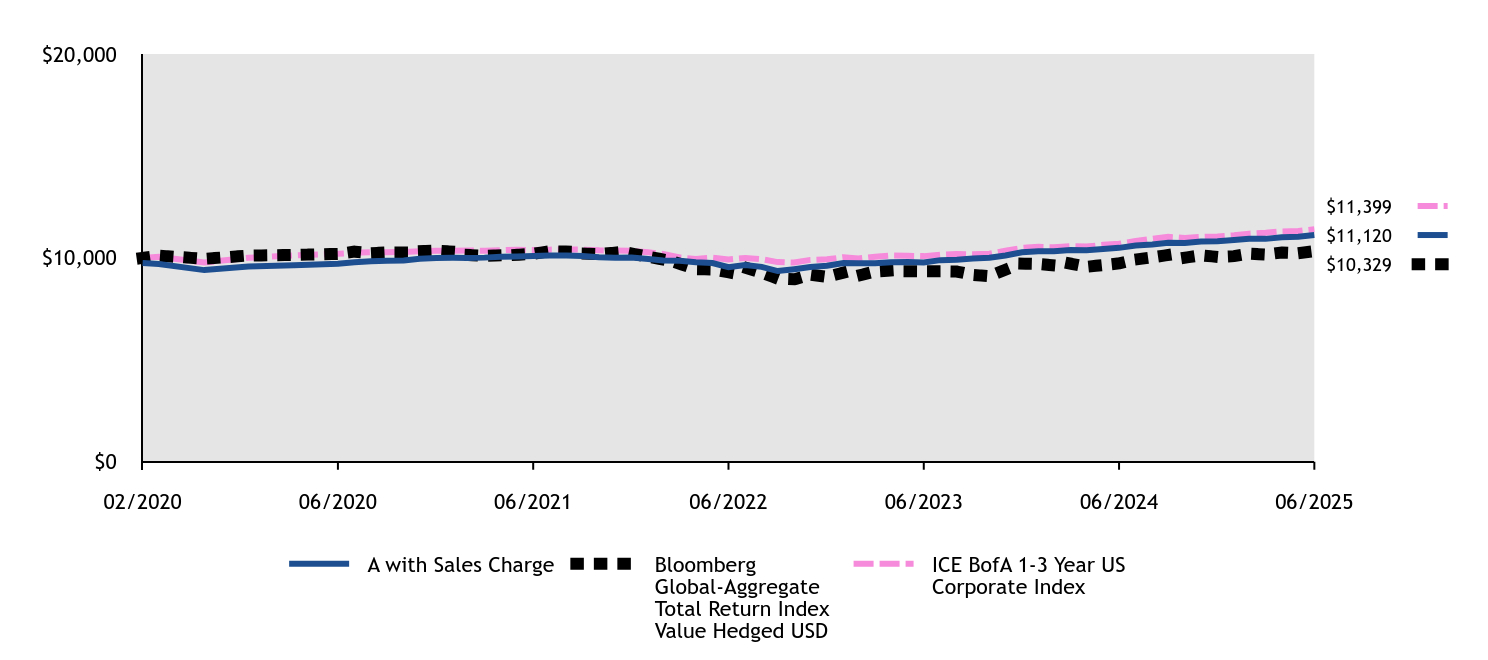
|
A with Sales Charge |
Bloomberg Global-Aggregate Total Return Index Value Hedged USD |
ICE BofA 1-3 Year US Corporate Index |
02/2020 |
$9,747 |
$10,000 |
$10,000 |
02/2020 |
$9,698 |
$10,111 |
$10,051 |
03/2020 |
$9,400 |
$9,953 |
$9,770 |
04/2020 |
$9,576 |
$10,114 |
$10,002 |
05/2020 |
$9,633 |
$10,143 |
$10,117 |
06/2020 |
$9,709 |
$10,194 |
$10,198 |
07/2020 |
$9,788 |
$10,305 |
$10,249 |
08/2020 |
$9,838 |
$10,230 |
$10,275 |
09/2020 |
$9,859 |
$10,268 |
$10,274 |
10/2020 |
$9,869 |
$10,268 |
$10,292 |
11/2020 |
$9,959 |
$10,327 |
$10,328 |
12/2020 |
$9,995 |
$10,359 |
$10,350 |
01/2021 |
$10,005 |
$10,303 |
$10,355 |
02/2021 |
$9,999 |
$10,143 |
$10,360 |
03/2021 |
$10,012 |
$10,103 |
$10,351 |
04/2021 |
$10,054 |
$10,129 |
$10,373 |
05/2021 |
$10,065 |
$10,152 |
$10,395 |
06/2021 |
$10,088 |
$10,202 |
$10,387 |
07/2021 |
$10,114 |
$10,328 |
$10,404 |
08/2021 |
$10,114 |
$10,308 |
$10,409 |
09/2021 |
$10,094 |
$10,210 |
$10,406 |
10/2021 |
$10,031 |
$10,184 |
$10,371 |
11/2021 |
$10,010 |
$10,256 |
$10,356 |
12/2021 |
$10,022 |
$10,215 |
$10,349 |
01/2022 |
$9,950 |
$10,054 |
$10,271 |
02/2022 |
$9,874 |
$9,920 |
$10,192 |
03/2022 |
$9,856 |
$9,707 |
$10,022 |
04/2022 |
$9,782 |
$9,446 |
$9,948 |
05/2022 |
$9,748 |
$9,433 |
$10,007 |
06/2022 |
$9,541 |
$9,290 |
$9,921 |
07/2022 |
$9,654 |
$9,526 |
$9,994 |
08/2022 |
$9,560 |
$9,278 |
$9,937 |
09/2022 |
$9,353 |
$8,980 |
$9,793 |
10/2022 |
$9,446 |
$8,949 |
$9,771 |
11/2022 |
$9,552 |
$9,177 |
$9,900 |
12/2022 |
$9,612 |
$9,069 |
$9,929 |
01/2023 |
$9,750 |
$9,278 |
$10,033 |
02/2023 |
$9,733 |
$9,130 |
$9,970 |
03/2023 |
$9,735 |
$9,332 |
$10,057 |
04/2023 |
$9,786 |
$9,380 |
$10,116 |
05/2023 |
$9,793 |
$9,343 |
$10,100 |
06/2023 |
$9,777 |
$9,338 |
$10,086 |
07/2023 |
$9,889 |
$9,341 |
$10,154 |
08/2023 |
$9,913 |
$9,329 |
$10,185 |
09/2023 |
$9,970 |
$9,168 |
$10,178 |
10/2023 |
$10,002 |
$9,103 |
$10,200 |
11/2023 |
$10,118 |
$9,416 |
$10,349 |
12/2023 |
$10,272 |
$9,717 |
$10,486 |
01/2024 |
$10,320 |
$9,698 |
$10,542 |
02/2024 |
$10,322 |
$9,631 |
$10,520 |
03/2024 |
$10,391 |
$9,718 |
$10,575 |
04/2024 |
$10,375 |
$9,562 |
$10,554 |
05/2024 |
$10,434 |
$9,646 |
$10,639 |
06/2024 |
$10,491 |
$9,730 |
$10,692 |
07/2024 |
$10,604 |
$9,918 |
$10,828 |
08/2024 |
$10,653 |
$10,026 |
$10,930 |
09/2024 |
$10,737 |
$10,143 |
$11,030 |
10/2024 |
$10,724 |
$10,006 |
$10,981 |
11/2024 |
$10,797 |
$10,124 |
$11,027 |
12/2024 |
$10,811 |
$10,047 |
$11,053 |
01/2025 |
$10,873 |
$10,086 |
$11,110 |
02/2025 |
$10,938 |
$10,207 |
$11,189 |
03/2025 |
$10,932 |
$10,164 |
$11,234 |
04/2025 |
$11,016 |
$10,265 |
$11,297 |
05/2025 |
$11,041 |
$10,231 |
$11,316 |
06/2025 |
$11,120 |
$10,329 |
$11,399 |
|
|
| Average Annual Return [Table Text Block] |
HEADER |
1 Year |
5 Years |
Since Inception (2/18/20) |
Class A without Sales ChargeFootnote Reference1 |
6.00% |
2.75% |
2.49% |
Class A with Maximum Sales Charge - 2.50%Footnote Reference1 |
3.37% |
2.24% |
2.00% |
Bloomberg Global-Aggregate Total Return Index Value Hedged USD |
6.15% |
0.26% |
0.60% |
ICE BofA 1-3 Year US Corporate Index |
6.61% |
2.25% |
2.47% | |
|
| Performance Inception Date |
Feb. 18, 2020
|
|
| No Deduction of Taxes [Text Block] |
The graph and table do not reflect the deduction of taxes that a shareholder would pay on fund distributions or redemption of fund shares.
|
|
| AssetsNet |
$ 10,493,831
|
|
| Holdings Count | Holding |
66
|
|
| Advisory Fees Paid, Amount |
$ 0
|
|
| InvestmentCompanyPortfolioTurnover |
79.00%
|
|
| Additional Fund Statistics [Text Block] |
Total Net Assets |
$10,493,831 |
# of Portfolio Holdings |
66 |
Portfolio Turnover Rate |
79% |
Total Management Fees Paid |
$0 | |
|
| Holdings [Text Block] |
Asset Allocation - % Investments
Value |
Value |
Foreign Corporate Obligations |
69.1 |
Corporate Obligations |
9.2 |
U.S. Treasury Obligations |
7.9 |
Foreign Sovereign Obligations |
7.8 |
Collateralized Mortgage Obligations |
6.0 | Excludes currency forwards. Top Ten Industry Allocations - % Investments
Value |
Value |
Real Estate |
2.6 |
Software |
3.6 |
Savings & Loans |
5.4 |
Collateralized Mortgage Obligations |
6.1 |
Foreign Sovereign Obligations |
7.8 |
U.S. Treasury Obligations |
7.9 |
Telecommunications |
8.1 |
Electric |
8.4 |
Insurance |
13.9 |
Banks |
24.2 | Country Exposure - % Investments
Value |
Value |
Belgium |
1.2 |
Australia |
1.3 |
Italy |
1.3 |
Sweden |
1.4 |
Spain |
3.5 |
Netherlands |
4.9 |
France |
10.6 |
Germany |
11.6 |
United States |
17.1 |
United Kingdom |
47.1 | Exludes currency forwards |
|
| Largest Holdings [Text Block] |
Top Ten Holdings - % Net Assets
U.S. Treasury Notes, 4.000%, Due 3/31/2030 |
7.7 |
Bundesobligation, 2.500%, Due 10/11/2029 |
5.0 |
Bundesobligation, 2.400%, Due 4/18/2030 |
2.6 |
Nationwide Building Society, 5.750%, Due 6/20/2027 |
2.6 |
BNP Paribas SA, 2.000%, Due 5/24/2031 |
2.5 |
Rothesay Life PLC, 8.000%, Due 10/30/2025 |
2.5 |
SSE PLC, 4.000%, Due 1/21/2028 |
2.3 |
Tower Bridge Funding PLC, Series 2021-2, 6.037%, Due 11/20/2063, Class D |
2.2 |
Societe Generale SA, 5.500%, Due 4/13/2029 |
1.9 |
Twin Bridges PLC, Series 2021-1, 6.339%, Due 3/12/2055, Class D |
1.7 | Excludes currency forwards. |
|
| Material Fund Change [Text Block] |
|
|
| C000217747 |
|
|
| Shareholder Report [Line Items] |
|
|
| Fund Name |
TwentyFour Sustainable Short Term Bond Fund
|
|
| Class Name |
C
|
|
| Trading Symbol |
TFBCX
|
|
| Annual or Semi-Annual Statement [Text Block] |
This annual shareholder report contains important information about American Beacon TwentyFour Sustainable Short Term Bond Fund for the period of July 1, 2024 to June 30, 2025.
|
|
| Shareholder Report Annual or Semi-Annual |
Annual Shareholder Report
|
|
| Additional Information [Text Block] |
You can find additional information about the Fund at www.americanbeaconfunds.com/literature. You can also request this information by contacting us at 800-658-5811.
|
|
| Additional Information Phone Number |
800-658-5811
|
|
| Additional Information Website |
<span style="box-sizing: border-box; color: rgb(0, 0, 0); display: inline; flex-wrap: nowrap; font-size: 13.3333px; font-weight: 400; grid-area: auto; line-height: 16px; margin: 0px; overflow: visible; text-align: left; text-align-last: auto; white-space-collapse: preserve-breaks;">www.americanbeaconfunds.com/literature</span>
|
|
| Expenses [Text Block] |
What were the Fund costs for the last year?(based on a hypothetical $10,000 investment)
Class Name |
Costs of a $10,000 investment |
Costs paid as a percentage of a $10,000 investment |
Class C |
$152 |
1.48% | |
|
| Expenses Paid, Amount |
$ 152
|
|
| Expense Ratio, Percent |
1.48%
|
|
| Factors Affecting Performance [Text Block] |
How did the Fund perform and what affected its performance? The C Class of the Fund returned 4.48% (with sales charges) and 5.48% (without sales charges) for the twelve months ended June 30, 2025, compared to the Bloomberg Global-Aggregate Total Return Index Value Hedged USD return of 6.15% and the ICE BofA 1-3 Year U.S. Corporate Index return of 6.61%. • The Fund’s duration position contributed to performance as shorter-term interest rates declined while longer-term interest rates rose. • The Fund held a variety of exposures across credit sectors that the sub-advisor deemed to offer attractive yield, and most sectors contributed positively to total returns given strong credit markets. • Investments in the Financial sector, including Banking and Insurance, generated the largest contribution to the Fund’s return, followed by selections in Government Bonds. |
|
| Performance Past Does Not Indicate Future [Text] |
Performance shown is historical and is not indicative of future returns.
|
|
| Line Graph [Table Text Block] |
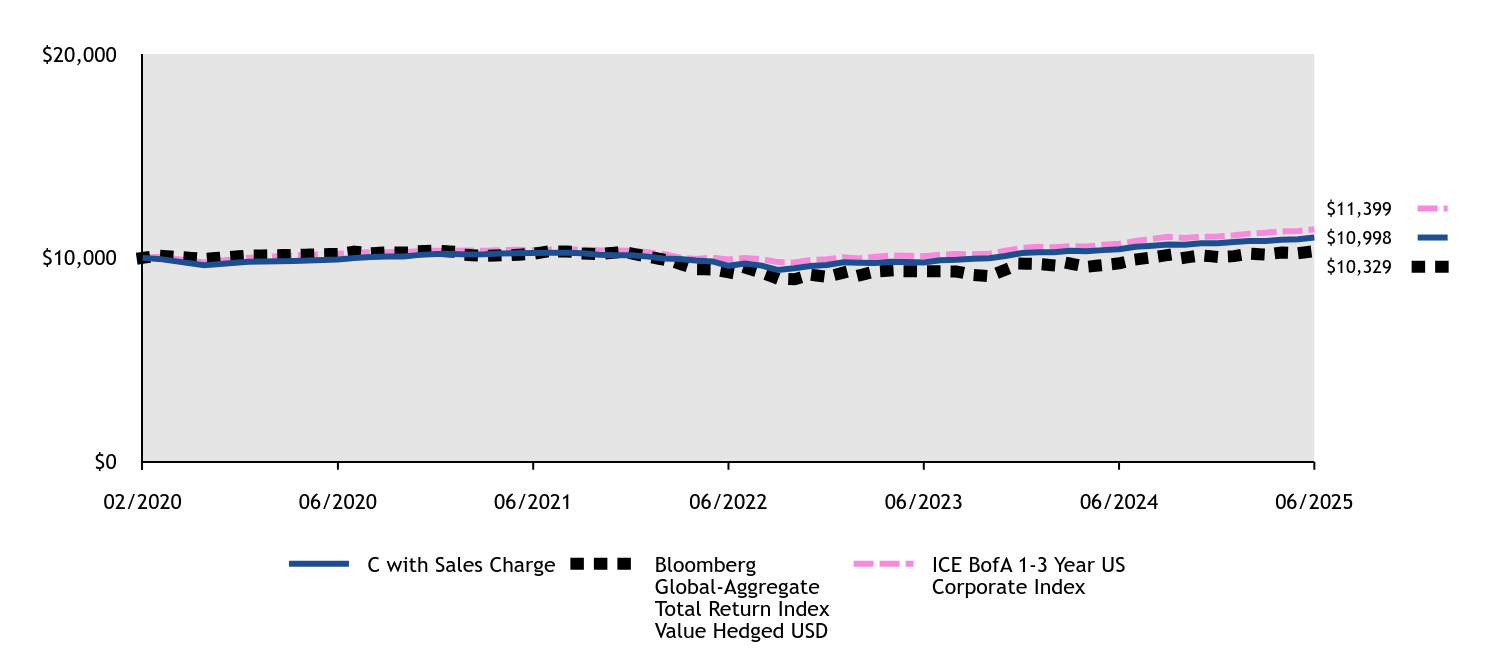
|
C with Sales Charge |
Bloomberg Global-Aggregate Total Return Index Value Hedged USD |
ICE BofA 1-3 Year US Corporate Index |
02/2020 |
$10,000 |
$10,000 |
$10,000 |
02/2020 |
$9,950 |
$10,111 |
$10,051 |
03/2020 |
$9,635 |
$9,953 |
$9,770 |
04/2020 |
$9,805 |
$10,114 |
$10,002 |
05/2020 |
$9,844 |
$10,143 |
$10,117 |
06/2020 |
$9,921 |
$10,194 |
$10,198 |
07/2020 |
$9,992 |
$10,305 |
$10,249 |
08/2020 |
$10,043 |
$10,230 |
$10,275 |
09/2020 |
$10,065 |
$10,268 |
$10,274 |
10/2020 |
$10,065 |
$10,268 |
$10,292 |
11/2020 |
$10,147 |
$10,327 |
$10,328 |
12/2020 |
$10,184 |
$10,359 |
$10,350 |
01/2021 |
$10,184 |
$10,303 |
$10,355 |
02/2021 |
$10,168 |
$10,143 |
$10,360 |
03/2021 |
$10,181 |
$10,103 |
$10,351 |
04/2021 |
$10,214 |
$10,129 |
$10,373 |
05/2021 |
$10,225 |
$10,152 |
$10,395 |
06/2021 |
$10,239 |
$10,202 |
$10,387 |
07/2021 |
$10,250 |
$10,328 |
$10,404 |
08/2021 |
$10,250 |
$10,308 |
$10,409 |
09/2021 |
$10,229 |
$10,210 |
$10,406 |
10/2021 |
$10,155 |
$10,184 |
$10,371 |
11/2021 |
$10,133 |
$10,256 |
$10,356 |
12/2021 |
$10,134 |
$10,215 |
$10,349 |
01/2022 |
$10,061 |
$10,054 |
$10,271 |
02/2022 |
$9,972 |
$9,920 |
$10,192 |
03/2022 |
$9,944 |
$9,707 |
$10,022 |
04/2022 |
$9,867 |
$9,446 |
$9,948 |
05/2022 |
$9,823 |
$9,433 |
$10,007 |
06/2022 |
$9,610 |
$9,290 |
$9,921 |
07/2022 |
$9,726 |
$9,526 |
$9,994 |
08/2022 |
$9,619 |
$9,278 |
$9,937 |
09/2022 |
$9,407 |
$8,980 |
$9,793 |
10/2022 |
$9,492 |
$8,949 |
$9,771 |
11/2022 |
$9,600 |
$9,177 |
$9,900 |
12/2022 |
$9,651 |
$9,069 |
$9,929 |
01/2023 |
$9,781 |
$9,278 |
$10,033 |
02/2023 |
$9,763 |
$9,130 |
$9,970 |
03/2023 |
$9,754 |
$9,332 |
$10,057 |
04/2023 |
$9,806 |
$9,380 |
$10,116 |
05/2023 |
$9,801 |
$9,343 |
$10,100 |
06/2023 |
$9,771 |
$9,338 |
$10,086 |
07/2023 |
$9,882 |
$9,341 |
$10,154 |
08/2023 |
$9,907 |
$9,329 |
$10,185 |
09/2023 |
$9,953 |
$9,168 |
$10,178 |
10/2023 |
$9,986 |
$9,103 |
$10,200 |
11/2023 |
$10,093 |
$9,416 |
$10,349 |
12/2023 |
$10,239 |
$9,717 |
$10,486 |
01/2024 |
$10,276 |
$9,698 |
$10,542 |
02/2024 |
$10,278 |
$9,631 |
$10,520 |
03/2024 |
$10,349 |
$9,718 |
$10,575 |
04/2024 |
$10,320 |
$9,562 |
$10,554 |
05/2024 |
$10,380 |
$9,646 |
$10,639 |
06/2024 |
$10,427 |
$9,730 |
$10,692 |
07/2024 |
$10,543 |
$9,918 |
$10,828 |
08/2024 |
$10,593 |
$10,026 |
$10,930 |
09/2024 |
$10,655 |
$10,143 |
$11,030 |
10/2024 |
$10,641 |
$10,006 |
$10,981 |
11/2024 |
$10,716 |
$10,124 |
$11,027 |
12/2024 |
$10,718 |
$10,047 |
$11,053 |
01/2025 |
$10,782 |
$10,086 |
$11,110 |
02/2025 |
$10,823 |
$10,207 |
$11,189 |
03/2025 |
$10,830 |
$10,164 |
$11,234 |
04/2025 |
$10,891 |
$10,265 |
$11,297 |
05/2025 |
$10,917 |
$10,231 |
$11,316 |
06/2025 |
$10,998 |
$10,329 |
$11,399 |
|
|
| Average Annual Return [Table Text Block] |
HEADER |
1 Year |
5 Years |
Since Inception (2/18/20) |
Class C without Deferred Sales ChargeFootnote Reference1 |
5.48% |
2.08% |
1.79% |
Class C with Maximum Deferred Sales Charge -1.00%Footnote Reference1 |
4.48% |
2.08% |
1.79% |
Bloomberg Global-Aggregate Total Return Index Value Hedged USD |
6.15% |
0.26% |
0.60% |
ICE BofA 1-3 Year US Corporate Index |
6.61% |
2.25% |
2.47% | |
|
| Performance Inception Date |
Feb. 18, 2020
|
|
| No Deduction of Taxes [Text Block] |
The graph and table do not reflect the deduction of taxes that a shareholder would pay on fund distributions or redemption of fund shares.
|
|
| AssetsNet |
$ 10,493,831
|
|
| Holdings Count | Holding |
66
|
|
| Advisory Fees Paid, Amount |
$ 0
|
|
| InvestmentCompanyPortfolioTurnover |
79.00%
|
|
| Additional Fund Statistics [Text Block] |
Total Net Assets |
$10,493,831 |
# of Portfolio Holdings |
66 |
Portfolio Turnover Rate |
79% |
Total Management Fees Paid |
$0 | |
|
| Holdings [Text Block] |
Asset Allocation - % Investments
Value |
Value |
Foreign Corporate Obligations |
69.1 |
Corporate Obligations |
9.2 |
U.S. Treasury Obligations |
7.9 |
Foreign Sovereign Obligations |
7.8 |
Collateralized Mortgage Obligations |
6.0 | Excludes currency forwards. Top Ten Industry Allocations - % Investments
Value |
Value |
Real Estate |
2.6 |
Software |
3.6 |
Savings & Loans |
5.4 |
Collateralized Mortgage Obligations |
6.1 |
Foreign Sovereign Obligations |
7.8 |
U.S. Treasury Obligations |
7.9 |
Telecommunications |
8.1 |
Electric |
8.4 |
Insurance |
13.9 |
Banks |
24.2 | Country Exposure - % Investments
Value |
Value |
Belgium |
1.2 |
Australia |
1.3 |
Italy |
1.3 |
Sweden |
1.4 |
Spain |
3.5 |
Netherlands |
4.9 |
France |
10.6 |
Germany |
11.6 |
United States |
17.1 |
United Kingdom |
47.1 | Exludes currency forwards |
|
| Largest Holdings [Text Block] |
Top Ten Holdings - % Net Assets
U.S. Treasury Notes, 4.000%, Due 3/31/2030 |
7.7 |
Bundesobligation, 2.500%, Due 10/11/2029 |
5.0 |
Bundesobligation, 2.400%, Due 4/18/2030 |
2.6 |
Nationwide Building Society, 5.750%, Due 6/20/2027 |
2.6 |
BNP Paribas SA, 2.000%, Due 5/24/2031 |
2.5 |
Rothesay Life PLC, 8.000%, Due 10/30/2025 |
2.5 |
SSE PLC, 4.000%, Due 1/21/2028 |
2.3 |
Tower Bridge Funding PLC, Series 2021-2, 6.037%, Due 11/20/2063, Class D |
2.2 |
Societe Generale SA, 5.500%, Due 4/13/2029 |
1.9 |
Twin Bridges PLC, Series 2021-1, 6.339%, Due 3/12/2055, Class D |
1.7 | Excludes currency forwards. |
|
| Material Fund Change [Text Block] |
|
|
| C000217745 |
|
|
| Shareholder Report [Line Items] |
|
|
| Fund Name |
TwentyFour Sustainable Short Term Bond Fund
|
|
| Class Name |
Y
|
|
| Trading Symbol |
TFBYX
|
|
| Annual or Semi-Annual Statement [Text Block] |
This annual shareholder report contains important information about American Beacon TwentyFour Sustainable Short Term Bond Fund for the period of July 1, 2024 to June 30, 2025.
|
|
| Shareholder Report Annual or Semi-Annual |
Annual Shareholder Report
|
|
| Additional Information [Text Block] |
You can find additional information about the Fund at www.americanbeaconfunds.com/literature. You can also request this information by contacting us at 800-658-5811.
|
|
| Additional Information Phone Number |
800-658-5811
|
|
| Additional Information Website |
<span style="box-sizing: border-box; color: rgb(0, 0, 0); display: inline; flex-wrap: nowrap; font-size: 13.3333px; font-weight: 400; grid-area: auto; line-height: 16px; margin: 0px; overflow: visible; text-align: left; text-align-last: auto; white-space-collapse: preserve-breaks;">www.americanbeaconfunds.com/literature</span>
|
|
| Expenses [Text Block] |
What were the Fund costs for the last year?(based on a hypothetical $10,000 investment)
Class Name |
Costs of a $10,000 investment |
Costs paid as a percentage of a $10,000 investment |
Y |
$59 |
0.57% | |
|
| Expenses Paid, Amount |
$ 59
|
|
| Expense Ratio, Percent |
0.57%
|
|
| Factors Affecting Performance [Text Block] |
How did the Fund perform and what affected its performance? The Y Class of the Fund returned 6.29% for the twelve months ended June 30, 2025, compared to the Bloomberg Global-Aggregate Total Return Index Value Hedged USD return of 6.15% and the ICE BofA 1-3 Year U.S. Corporate Index return of 6.61%. • The Fund’s duration position contributed to performance as shorter-term interest rates declined while longer-term interest rates rose. • The Fund held a variety of exposures across credit sectors that the sub-advisor deemed to offer attractive yield, and most sectors contributed positively to total returns given strong credit markets. • Investments in the Financial sector, including Banking and Insurance, generated the largest contribution to the Fund’s return, followed by selections in Government Bonds. |
|
| Performance Past Does Not Indicate Future [Text] |
Performance shown is historical and is not indicative of future returns.
|
|
| Line Graph [Table Text Block] |
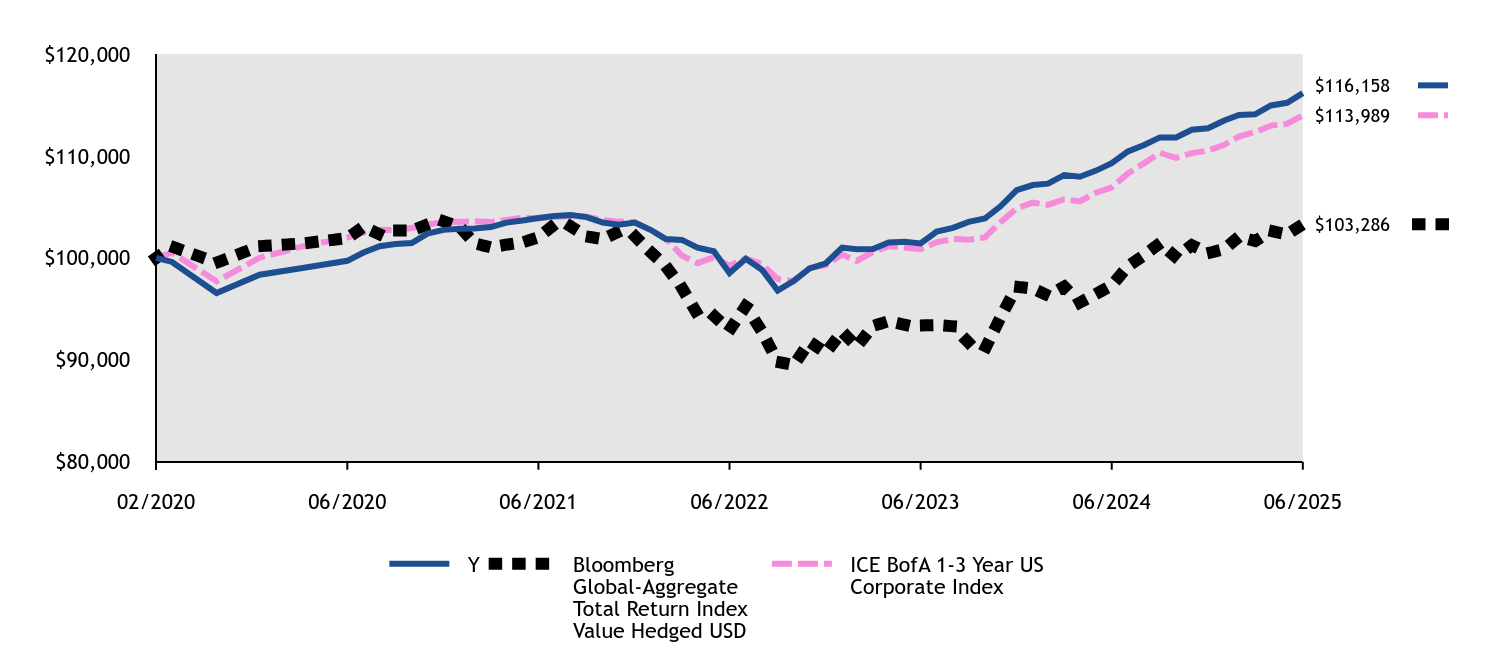
#ERROR:A result could not be returned because the conditional could not be evaluated to a True/False value (#ERROR:Invalid Formula (#!=""), 'Multiple values from an iterator cannot be used in a formula unless they are aggregrated.') |
Y |
Bloomberg Global-Aggregate Total Return Index Value Hedged USD |
ICE BofA 1-3 Year US Corporate Index |
02/2020 |
$100,000 |
$100,000 |
$100,000 |
02/2020 |
$99,600 |
$101,106 |
$100,507 |
03/2020 |
$96,549 |
$99,532 |
$97,699 |
04/2020 |
$98,347 |
$101,144 |
$100,017 |
05/2020 |
$99,038 |
$101,430 |
$101,168 |
06/2020 |
$99,712 |
$101,936 |
$101,984 |
07/2020 |
$100,522 |
$103,050 |
$102,493 |
08/2020 |
$101,138 |
$102,304 |
$102,752 |
09/2020 |
$101,357 |
$102,677 |
$102,739 |
10/2020 |
$101,455 |
$102,685 |
$102,923 |
11/2020 |
$102,378 |
$103,271 |
$103,276 |
12/2020 |
$102,746 |
$103,588 |
$103,498 |
01/2021 |
$102,848 |
$103,032 |
$103,549 |
02/2021 |
$102,892 |
$101,430 |
$103,599 |
03/2021 |
$103,025 |
$101,030 |
$103,514 |
04/2021 |
$103,461 |
$101,294 |
$103,729 |
05/2021 |
$103,669 |
$101,520 |
$103,950 |
06/2021 |
$103,913 |
$102,015 |
$103,867 |
07/2021 |
$104,103 |
$103,283 |
$104,040 |
08/2021 |
$104,208 |
$103,076 |
$104,086 |
09/2021 |
$103,998 |
$102,103 |
$104,056 |
10/2021 |
$103,461 |
$101,836 |
$103,708 |
11/2021 |
$103,245 |
$102,563 |
$103,556 |
12/2021 |
$103,466 |
$102,147 |
$103,488 |
01/2022 |
$102,728 |
$100,542 |
$102,712 |
02/2022 |
$101,841 |
$99,205 |
$101,921 |
03/2022 |
$101,765 |
$97,066 |
$100,222 |
04/2022 |
$100,998 |
$94,457 |
$99,483 |
05/2022 |
$100,655 |
$94,327 |
$100,066 |
06/2022 |
$98,515 |
$92,896 |
$99,209 |
07/2022 |
$99,909 |
$95,262 |
$99,941 |
08/2022 |
$98,830 |
$92,775 |
$99,375 |
09/2022 |
$96,800 |
$89,797 |
$97,931 |
10/2022 |
$97,760 |
$89,489 |
$97,708 |
11/2022 |
$98,958 |
$91,770 |
$98,996 |
12/2022 |
$99,472 |
$90,687 |
$99,293 |
01/2023 |
$101,014 |
$92,776 |
$100,333 |
02/2023 |
$100,840 |
$91,296 |
$99,699 |
03/2023 |
$100,863 |
$93,320 |
$100,574 |
04/2023 |
$101,505 |
$93,801 |
$101,157 |
05/2023 |
$101,582 |
$93,431 |
$100,996 |
06/2023 |
$101,418 |
$93,376 |
$100,858 |
07/2023 |
$102,575 |
$93,406 |
$101,541 |
08/2023 |
$102,944 |
$93,288 |
$101,848 |
09/2023 |
$103,531 |
$91,680 |
$101,780 |
10/2023 |
$103,859 |
$91,029 |
$102,004 |
11/2023 |
$105,055 |
$94,159 |
$103,494 |
12/2023 |
$106,648 |
$97,168 |
$104,863 |
01/2024 |
$107,141 |
$96,977 |
$105,415 |
02/2024 |
$107,284 |
$96,312 |
$105,203 |
03/2024 |
$108,122 |
$97,180 |
$105,751 |
04/2024 |
$107,953 |
$95,616 |
$105,539 |
05/2024 |
$108,561 |
$96,462 |
$106,394 |
06/2024 |
$109,281 |
$97,299 |
$106,921 |
07/2024 |
$110,448 |
$99,178 |
$108,283 |
08/2024 |
$111,075 |
$100,265 |
$109,296 |
09/2024 |
$111,818 |
$101,428 |
$110,296 |
10/2024 |
$111,807 |
$100,056 |
$109,808 |
11/2024 |
$112,564 |
$101,244 |
$110,273 |
12/2024 |
$112,709 |
$100,467 |
$110,527 |
01/2025 |
$113,477 |
$100,856 |
$111,095 |
02/2025 |
$114,018 |
$102,071 |
$111,892 |
03/2025 |
$114,088 |
$101,645 |
$112,342 |
04/2025 |
$114,953 |
$102,646 |
$112,972 |
05/2025 |
$115,214 |
$102,306 |
$113,157 |
06/2025 |
$116,158 |
$103,286 |
$113,989 |
|
|
| Average Annual Return [Table Text Block] |
HEADER |
1 Year |
5 Years |
Since Inception (2/18/20) |
Class YFootnote Reference1 |
6.29% |
3.10% |
2.83% |
Bloomberg Global-Aggregate Total Return Index Value Hedged USD |
6.15% |
0.26% |
0.60% |
ICE BofA 1-3 Year US Corporate Index |
6.61% |
2.25% |
2.47% | |
|
| Performance Inception Date |
Feb. 18, 2020
|
|
| No Deduction of Taxes [Text Block] |
The graph and table do not reflect the deduction of taxes that a shareholder would pay on fund distributions or redemption of fund shares.
|
|
| AssetsNet |
$ 10,493,831
|
|
| Holdings Count | Holding |
66
|
|
| Advisory Fees Paid, Amount |
$ 0
|
|
| InvestmentCompanyPortfolioTurnover |
79.00%
|
|
| Additional Fund Statistics [Text Block] |
Total Net Assets |
$10,493,831 |
# of Portfolio Holdings |
66 |
Portfolio Turnover Rate |
79% |
Total Management Fees Paid |
$0 | |
|
| Holdings [Text Block] |
Asset Allocation - % Investments
Value |
Value |
Foreign Corporate Obligations |
69.1 |
Corporate Obligations |
9.2 |
U.S. Treasury Obligations |
7.9 |
Foreign Sovereign Obligations |
7.8 |
Collateralized Mortgage Obligations |
6.0 | Excludes currency forwards. Top Ten Industry Allocations - % Investments
Value |
Value |
Real Estate |
2.6 |
Software |
3.6 |
Savings & Loans |
5.4 |
Collateralized Mortgage Obligations |
6.1 |
Foreign Sovereign Obligations |
7.8 |
U.S. Treasury Obligations |
7.9 |
Telecommunications |
8.1 |
Electric |
8.4 |
Insurance |
13.9 |
Banks |
24.2 | Country Exposure - % Investments
Value |
Value |
Belgium |
1.2 |
Australia |
1.3 |
Italy |
1.3 |
Sweden |
1.4 |
Spain |
3.5 |
Netherlands |
4.9 |
France |
10.6 |
Germany |
11.6 |
United States |
17.1 |
United Kingdom |
47.1 | Exludes currency forwards |
|
| Largest Holdings [Text Block] |
Top Ten Holdings - % Net Assets
U.S. Treasury Notes, 4.000%, Due 3/31/2030 |
7.7 |
Bundesobligation, 2.500%, Due 10/11/2029 |
5.0 |
Bundesobligation, 2.400%, Due 4/18/2030 |
2.6 |
Nationwide Building Society, 5.750%, Due 6/20/2027 |
2.6 |
BNP Paribas SA, 2.000%, Due 5/24/2031 |
2.5 |
Rothesay Life PLC, 8.000%, Due 10/30/2025 |
2.5 |
SSE PLC, 4.000%, Due 1/21/2028 |
2.3 |
Tower Bridge Funding PLC, Series 2021-2, 6.037%, Due 11/20/2063, Class D |
2.2 |
Societe Generale SA, 5.500%, Due 4/13/2029 |
1.9 |
Twin Bridges PLC, Series 2021-1, 6.339%, Due 3/12/2055, Class D |
1.7 | Excludes currency forwards. |
|
| Material Fund Change [Text Block] |
|
|
| C000217748 |
|
|
| Shareholder Report [Line Items] |
|
|
| Fund Name |
TwentyFour Sustainable Short Term Bond Fund
|
|
| Class Name |
R6
|
|
| Trading Symbol |
TFBRX
|
|
| Annual or Semi-Annual Statement [Text Block] |
This annual shareholder report contains important information about American Beacon TwentyFour Sustainable Short Term Bond Fund for the period of July 1, 2024 to June 30, 2025.
|
|
| Shareholder Report Annual or Semi-Annual |
Annual Shareholder Report
|
|
| Additional Information [Text Block] |
You can find additional information about the Fund at www.americanbeaconfunds.com/literature. You can also request this information by contacting us at 800-658-5811.
|
|
| Additional Information Phone Number |
800-658-5811
|
|
| Additional Information Website |
<span style="box-sizing: border-box; color: rgb(0, 0, 0); display: inline; flex-wrap: nowrap; font-size: 13.3333px; font-weight: 400; grid-area: auto; line-height: 16px; margin: 0px; overflow: visible; text-align: left; text-align-last: auto; white-space-collapse: preserve-breaks;">www.americanbeaconfunds.com/literature</span>
|
|
| Expenses [Text Block] |
What were the Fund costs for the last year?(based on a hypothetical $10,000 investment)
Class Name |
Costs of a $10,000 investment |
Costs paid as a percentage of a $10,000 investment |
R6 |
$49 |
0.47% | |
|
| Expenses Paid, Amount |
$ 49
|
|
| Expense Ratio, Percent |
0.47%
|
|
| Factors Affecting Performance [Text Block] |
How did the Fund perform and what affected its performance? The R6 Class of the Fund returned 6.42% for the twelve months ended June 30, 2025, compared to the Bloomberg Global-Aggregate Total Return Index Value Hedged USD return of 6.15% and the ICE BofA 1-3 Year U.S. Corporate Index return of 6.61%. • The Fund’s duration position contributed to performance as shorter-term interest rates declined while longer-term interest rates rose. • The Fund held a variety of exposures across credit sectors that the sub-advisor deemed to offer attractive yield, and most sectors contributed positively to total returns given strong credit markets. • Investments in the Financial sector, including Banking and Insurance, generated the largest contribution to the Fund’s return, followed by selections in Government Bonds. |
|
| Performance Past Does Not Indicate Future [Text] |
Performance shown is historical and is not indicative of future returns.
|
|
| Line Graph [Table Text Block] |
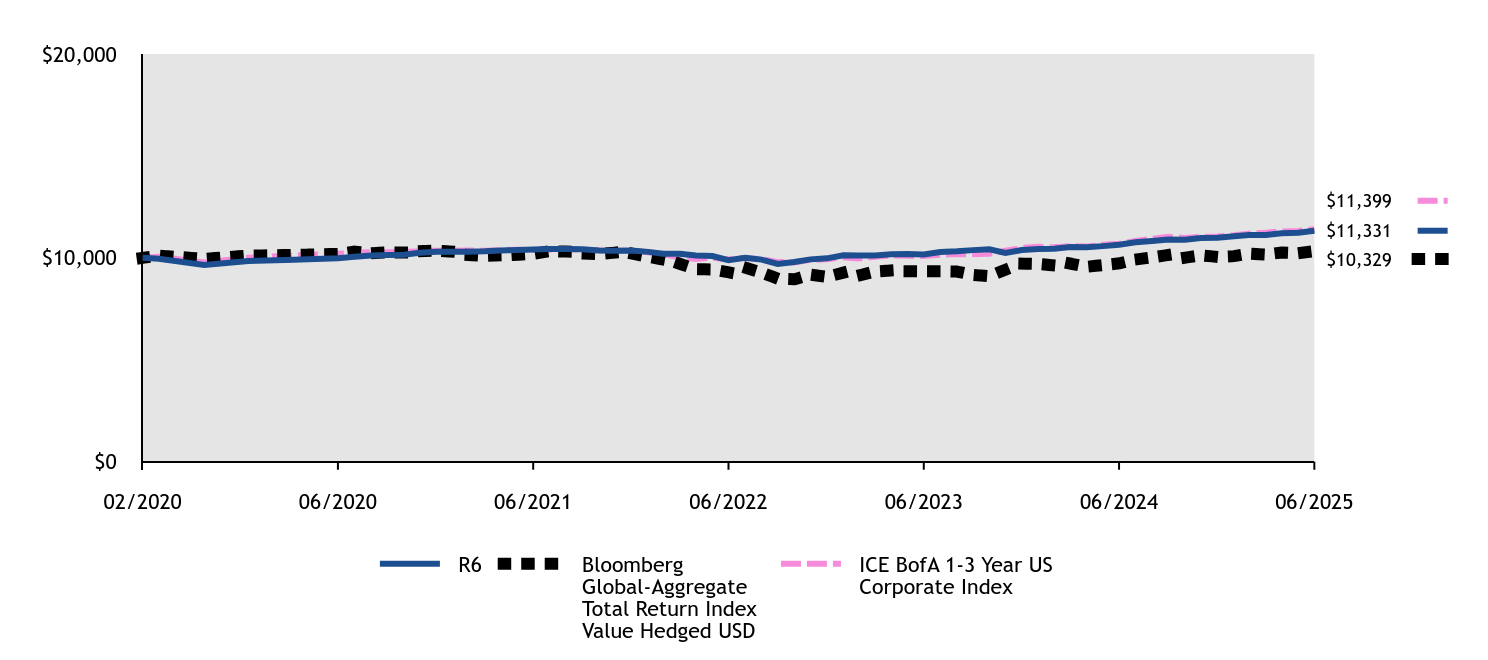
|
R6 |
Bloomberg Global-Aggregate Total Return Index Value Hedged USD |
ICE BofA 1-3 Year US Corporate Index |
02/2020 |
$10,000 |
$10,000 |
$10,000 |
02/2020 |
$9,960 |
$10,111 |
$10,051 |
03/2020 |
$9,655 |
$9,953 |
$9,770 |
04/2020 |
$9,845 |
$10,114 |
$10,002 |
05/2020 |
$9,904 |
$10,143 |
$10,117 |
06/2020 |
$9,981 |
$10,194 |
$10,198 |
07/2020 |
$10,052 |
$10,305 |
$10,249 |
08/2020 |
$10,114 |
$10,230 |
$10,275 |
09/2020 |
$10,146 |
$10,268 |
$10,274 |
10/2020 |
$10,156 |
$10,268 |
$10,292 |
11/2020 |
$10,248 |
$10,327 |
$10,328 |
12/2020 |
$10,295 |
$10,359 |
$10,350 |
01/2021 |
$10,305 |
$10,303 |
$10,355 |
02/2021 |
$10,299 |
$10,143 |
$10,360 |
03/2021 |
$10,323 |
$10,103 |
$10,351 |
04/2021 |
$10,366 |
$10,129 |
$10,373 |
05/2021 |
$10,387 |
$10,152 |
$10,395 |
06/2021 |
$10,412 |
$10,202 |
$10,387 |
07/2021 |
$10,431 |
$10,328 |
$10,404 |
08/2021 |
$10,441 |
$10,308 |
$10,409 |
09/2021 |
$10,420 |
$10,210 |
$10,406 |
10/2021 |
$10,367 |
$10,184 |
$10,371 |
11/2021 |
$10,345 |
$10,256 |
$10,356 |
12/2021 |
$10,367 |
$10,215 |
$10,349 |
01/2022 |
$10,294 |
$10,054 |
$10,271 |
02/2022 |
$10,205 |
$9,920 |
$10,192 |
03/2022 |
$10,198 |
$9,707 |
$10,022 |
04/2022 |
$10,121 |
$9,446 |
$9,948 |
05/2022 |
$10,087 |
$9,433 |
$10,007 |
06/2022 |
$9,884 |
$9,290 |
$9,921 |
07/2022 |
$10,010 |
$9,526 |
$9,994 |
08/2022 |
$9,913 |
$9,278 |
$9,937 |
09/2022 |
$9,701 |
$8,980 |
$9,793 |
10/2022 |
$9,796 |
$8,949 |
$9,771 |
11/2022 |
$9,926 |
$9,177 |
$9,900 |
12/2022 |
$9,977 |
$9,069 |
$9,929 |
01/2023 |
$10,130 |
$9,278 |
$10,033 |
02/2023 |
$10,113 |
$9,130 |
$9,970 |
03/2023 |
$10,115 |
$9,332 |
$10,057 |
04/2023 |
$10,179 |
$9,380 |
$10,116 |
05/2023 |
$10,187 |
$9,343 |
$10,100 |
06/2023 |
$10,171 |
$9,338 |
$10,086 |
07/2023 |
$10,285 |
$9,341 |
$10,154 |
08/2023 |
$10,322 |
$9,329 |
$10,185 |
09/2023 |
$10,380 |
$9,168 |
$10,178 |
10/2023 |
$10,425 |
$9,103 |
$10,200 |
11/2023 |
$10,240 |
$9,416 |
$10,349 |
12/2023 |
$10,386 |
$9,717 |
$10,486 |
01/2024 |
$10,435 |
$9,698 |
$10,542 |
02/2024 |
$10,449 |
$9,631 |
$10,520 |
03/2024 |
$10,533 |
$9,718 |
$10,575 |
04/2024 |
$10,516 |
$9,562 |
$10,554 |
05/2024 |
$10,576 |
$9,646 |
$10,639 |
06/2024 |
$10,648 |
$9,730 |
$10,692 |
07/2024 |
$10,764 |
$9,918 |
$10,828 |
08/2024 |
$10,826 |
$10,026 |
$10,930 |
09/2024 |
$10,900 |
$10,143 |
$11,030 |
10/2024 |
$10,886 |
$10,006 |
$10,981 |
11/2024 |
$10,974 |
$10,124 |
$11,027 |
12/2024 |
$10,988 |
$10,047 |
$11,053 |
01/2025 |
$11,065 |
$10,086 |
$11,110 |
02/2025 |
$11,119 |
$10,207 |
$11,189 |
03/2025 |
$11,126 |
$10,164 |
$11,234 |
04/2025 |
$11,212 |
$10,265 |
$11,297 |
05/2025 |
$11,237 |
$10,231 |
$11,316 |
06/2025 |
$11,331 |
$10,329 |
$11,399 |
|
|
| Average Annual Return [Table Text Block] |
HEADER |
1 Year |
5 Years |
Since Inception (2/18/20) |
R6 ClassFootnote Reference1 |
6.42% |
2.57% |
2.36% |
Bloomberg Global-Aggregate Total Return Index Value Hedged USD |
6.15% |
0.26% |
0.60% |
ICE BofA 1-3 Year US Corporate Index |
6.61% |
2.25% |
2.47% | |
|
| Performance Inception Date |
Feb. 18, 2020
|
|
| No Deduction of Taxes [Text Block] |
The graph and table do not reflect the deduction of taxes that a shareholder would pay on fund distributions or redemption of fund shares.
|
|
| AssetsNet |
$ 10,493,831
|
|
| Holdings Count | Holding |
66
|
|
| Advisory Fees Paid, Amount |
$ 0
|
|
| InvestmentCompanyPortfolioTurnover |
79.00%
|
|
| Additional Fund Statistics [Text Block] |
Total Net Assets |
$10,493,831 |
# of Portfolio Holdings |
66 |
Portfolio Turnover Rate |
79% |
Total Management Fees Paid |
$0 | |
|
| Holdings [Text Block] |
Asset Allocation - % Investments
Value |
Value |
Foreign Corporate Obligations |
69.1 |
Corporate Obligations |
9.2 |
U.S. Treasury Obligations |
7.9 |
Foreign Sovereign Obligations |
7.8 |
Collateralized Mortgage Obligations |
6.0 | Excludes currency forwards. Top Ten Industry Allocations - % Investments
Value |
Value |
Real Estate |
2.6 |
Software |
3.6 |
Savings & Loans |
5.4 |
Collateralized Mortgage Obligations |
6.1 |
Foreign Sovereign Obligations |
7.8 |
U.S. Treasury Obligations |
7.9 |
Telecommunications |
8.1 |
Electric |
8.4 |
Insurance |
13.9 |
Banks |
24.2 | Country Exposure - % Investments
Value |
Value |
Belgium |
1.2 |
Australia |
1.3 |
Italy |
1.3 |
Sweden |
1.4 |
Spain |
3.5 |
Netherlands |
4.9 |
France |
10.6 |
Germany |
11.6 |
United States |
17.1 |
United Kingdom |
47.1 | Exludes currency forwards |
|
| Largest Holdings [Text Block] |
Top Ten Holdings - % Net Assets
U.S. Treasury Notes, 4.000%, Due 3/31/2030 |
7.7 |
Bundesobligation, 2.500%, Due 10/11/2029 |
5.0 |
Bundesobligation, 2.400%, Due 4/18/2030 |
2.6 |
Nationwide Building Society, 5.750%, Due 6/20/2027 |
2.6 |
BNP Paribas SA, 2.000%, Due 5/24/2031 |
2.5 |
Rothesay Life PLC, 8.000%, Due 10/30/2025 |
2.5 |
SSE PLC, 4.000%, Due 1/21/2028 |
2.3 |
Tower Bridge Funding PLC, Series 2021-2, 6.037%, Due 11/20/2063, Class D |
2.2 |
Societe Generale SA, 5.500%, Due 4/13/2029 |
1.9 |
Twin Bridges PLC, Series 2021-1, 6.339%, Due 3/12/2055, Class D |
1.7 | Excludes currency forwards. |
|
| Material Fund Change [Text Block] |
|
|