Shareholder Report
|
6 Months Ended |
12 Months Ended |
|
Jun. 30, 2025
USD ($)
Holding
|
Dec. 31, 2024 |
| Shareholder Report [Line Items] |
|
|
|
| Document Type |
|
N-CSRS
|
|
| Amendment Flag |
|
false
|
|
| Registrant Name |
|
AMERICAN BEACON FUNDS
|
|
| Entity Central Index Key |
|
0000809593
|
|
| Entity Investment Company Type |
|
N-1A
|
|
| Document Period End Date |
|
Jun. 30, 2025
|
|
| C000213183 |
|
|
|
| Shareholder Report [Line Items] |
|
|
|
| Fund Name |
|
AHL TargetRisk Fund
|
|
| Class Name |
|
A
|
|
| Trading Symbol |
|
AHTAX
|
|
| Annual or Semi-Annual Statement [Text Block] |
|
This semi-annual shareholder report contains important information about American Beacon AHL TargetRisk Fund for the period of January 1, 2025 to June 30, 2025.
|
|
| Shareholder Report Annual or Semi-Annual |
|
Semi-Annual Shareholder Report
|
|
| Additional Information [Text Block] |
|
You can find additional information about the Fund at www.americanbeaconfunds.com/literature. You can also request this information by contacting us at 800-658-5811.
|
|
| Additional Information Phone Number |
|
800-658-5811
|
|
| Additional Information Website |
|
<span style="box-sizing: border-box; color: rgb(0, 0, 0); display: inline; flex-wrap: nowrap; font-size: 12px; font-weight: 400; grid-area: auto; line-height: 18px; margin: 0px; overflow: visible; text-align: left; text-align-last: auto; white-space-collapse: preserve-breaks;">www.americanbeaconfunds.com/literature</span>
|
|
| Expenses [Text Block] |
|
What were the Fund costs for the last six months?(based on a hypothetical $10,000 investment)
Class Name |
Costs of a $10,000 investment |
Costs paid as a percentage of a $10,000 investment |
Class A |
$71 |
1.44%Footnote Reference* |
| Footnote |
Description |
Footnote* |
Annualized. | |
|
| Expenses Paid, Amount |
|
$ 71
|
|
| Expense Ratio, Percent |
[1] |
1.44%
|
|
| AssetsNet |
|
$ 231,464,201
|
|
| Holdings Count | Holding |
|
20
|
|
| Advisory Fees Paid, Amount |
|
$ 1,167,613
|
|
| InvestmentCompanyPortfolioTurnover |
|
166.00%
|
|
| Additional Fund Statistics [Text Block] |
|
Total Net Assets |
$231,464,201 |
# of Portfolio Holdings |
20 |
Portfolio Turnover Rate |
166% |
Total Management Fees Paid |
$1,167,613 | |
|
| Holdings [Text Block] |
|
Asset Class Exposure % of VaR*
Header |
Net (%) |
% of VaR |
Stocks |
41.6 |
48.3 |
Credit |
47.3 |
6.1 |
Bonds and Rates |
75.1 |
27.6 |
Commodities |
14.7 |
18.0 |
Value |
Value |
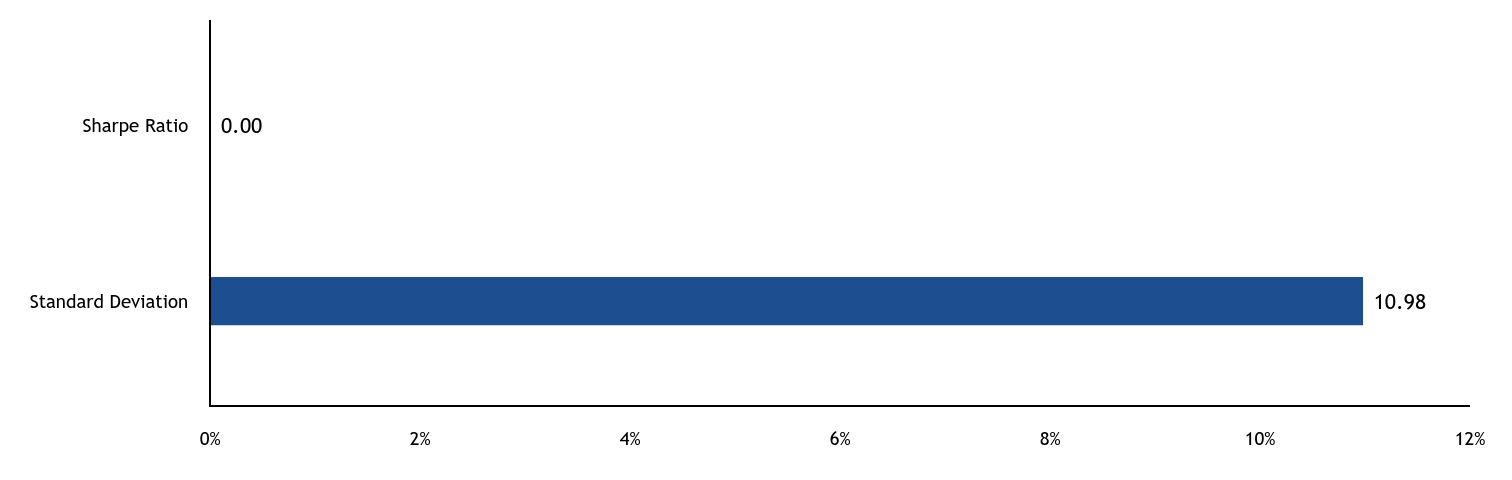
Standard Deviation |
10.98 |
Sharpe Ratio |
0.00 | Sharpe Ratio is a measure of the Fund’s return per unit of total risk. Standard Deviation is a measure of the historical volatility of the Fund’s returns. |
|
| Largest Holdings [Text Block] |
|
Top Ten Exposures - % of VaR*
BBG Commodity ex-Agriculturals Index |
Long |
18.0 |
US Treasuries |
Long |
12.4 |
S&P 500 Index |
Long |
7.8 |
Tokyo Stock Exchange Index |
Long |
4.6 |
NASDAQ 100 Index |
Long |
4.6 |
FTSE 100 |
Long |
3.7 |
Euro-STOXX |
Long |
3.6 |
Gilts |
Long |
3.5 |
S&P TSX 60 Index |
Long |
3.4 |
Nikkei |
Long |
3.0 | * Value at Risk (“VaR”) is a measure of the potential loss in value of a portfolio over a defined period for a given confidence interval. A one-day VaR at the 95% confidence level represents that there is a 5% probability that the mark-to-market loss on the portfolio over a one day horizon will exceed this value (assuming normal markets and no trading in the portfolio). |
|
| Material Fund Change [Text Block] |
|
|
|
| C000213182 |
|
|
|
| Shareholder Report [Line Items] |
|
|
|
| Fund Name |
|
AHL TargetRisk Fund
|
|
| Class Name |
|
C
|
|
| Trading Symbol |
|
AHACX
|
|
| Annual or Semi-Annual Statement [Text Block] |
|
This semi-annual shareholder report contains important information about American Beacon AHL TargetRisk Fund for the period of January 1, 2025 to June 30, 2025.
|
|
| Shareholder Report Annual or Semi-Annual |
|
Semi-Annual Shareholder Report
|
|
| Additional Information [Text Block] |
|
You can find additional information about the Fund at www.americanbeaconfunds.com/literature. You can also request this information by contacting us at 800-658-5811.
|
|
| Additional Information Phone Number |
|
800-658-5811
|
|
| Additional Information Website |
|
<span style="box-sizing: border-box; color: rgb(0, 0, 0); display: inline; flex-wrap: nowrap; font-size: 12px; font-weight: 400; grid-area: auto; line-height: 18px; margin: 0px; overflow: visible; text-align: left; text-align-last: auto; white-space-collapse: preserve-breaks;">www.americanbeaconfunds.com/literature</span>
|
|
| Expenses [Text Block] |
|
What were the Fund costs for the last six months?(based on a hypothetical $10,000 investment)
Class Name |
Costs of a $10,000 investment |
Costs paid as a percentage of a $10,000 investment |
Class C |
$108 |
2.22%Footnote Reference* |
| Footnote |
Description |
Footnote* |
Annualized. | |
|
| Expenses Paid, Amount |
|
$ 108
|
|
| Expense Ratio, Percent |
[2] |
2.22%
|
|
| AssetsNet |
|
$ 231,464,201
|
|
| Holdings Count | Holding |
|
20
|
|
| Advisory Fees Paid, Amount |
|
$ 1,167,613
|
|
| InvestmentCompanyPortfolioTurnover |
|
166.00%
|
|
| Additional Fund Statistics [Text Block] |
|
Total Net Assets |
$231,464,201 |
# of Portfolio Holdings |
20 |
Portfolio Turnover Rate |
166% |
Total Management Fees Paid |
$1,167,613 | |
|
| Holdings [Text Block] |
|
Asset Class Exposure % of VaR*
Header |
Net (%) |
% of VaR |
Stocks |
41.6 |
48.3 |
Credit |
47.3 |
6.1 |
Bonds and Rates |
75.1 |
27.6 |
Commodities |
14.7 |
18.0 |
Value |
Value |
Standard Deviation |
10.98 |
Sharpe Ratio |
0.00 | Sharpe Ratio is a measure of the Fund’s return per unit of total risk. Standard Deviation is a measure of the historical volatility of the Fund’s returns. |
|
| Largest Holdings [Text Block] |
|
Top Ten Exposures - % of VaR*
BBG Commodity ex-Agriculturals Index |
Long |
18.0 |
US Treasuries |
Long |
12.4 |
S&P 500 Index |
Long |
7.8 |
Tokyo Stock Exchange Index |
Long |
4.6 |
NASDAQ 100 Index |
Long |
4.6 |
FTSE 100 |
Long |
3.7 |
Euro-STOXX |
Long |
3.6 |
Gilts |
Long |
3.5 |
S&P TSX 60 Index |
Long |
3.4 |
Nikkei |
Long |
3.0 | * Value at Risk (“VaR”) is a measure of the potential loss in value of a portfolio over a defined period for a given confidence interval. A one-day VaR at the 95% confidence level represents that there is a 5% probability that the mark-to-market loss on the portfolio over a one day horizon will exceed this value (assuming normal markets and no trading in the portfolio). |
|
| Material Fund Change [Text Block] |
|
|
|
| C000207202 |
|
|
|
| Shareholder Report [Line Items] |
|
|
|
| Fund Name |
|
AHL TargetRisk Fund
|
|
| Class Name |
|
Investor
|
|
| Trading Symbol |
|
AHTPX
|
|
| Annual or Semi-Annual Statement [Text Block] |
|
This semi-annual shareholder report contains important information about American Beacon AHL TargetRisk Fund for the period of January 1, 2025 to June 30, 2025.
|
|
| Shareholder Report Annual or Semi-Annual |
|
Semi-Annual Shareholder Report
|
|
| Additional Information [Text Block] |
|
You can find additional information about the Fund at www.americanbeaconfunds.com/literature. You can also request this information by contacting us at 800-658-5811.
|
|
| Additional Information Phone Number |
|
800-658-5811
|
|
| Additional Information Website |
|
<span style="box-sizing: border-box; color: rgb(0, 0, 0); display: inline; flex-wrap: nowrap; font-size: 12px; font-weight: 400; grid-area: auto; line-height: 18px; margin: 0px; overflow: visible; text-align: left; text-align-last: auto; white-space-collapse: preserve-breaks;">www.americanbeaconfunds.com/literature</span>
|
|
| Expenses [Text Block] |
|
What were the Fund costs for the last six months?(based on a hypothetical $10,000 investment)
Class Name |
Costs of a $10,000 investment |
Costs paid as a percentage of a $10,000 investment |
Investor |
$76 |
1.55%Footnote Reference* |
| Footnote |
Description |
Footnote* |
Annualized. | |
|
| Expenses Paid, Amount |
|
$ 76
|
|
| Expense Ratio, Percent |
[3] |
1.55%
|
|
| AssetsNet |
|
$ 231,464,201
|
|
| Holdings Count | Holding |
|
20
|
|
| Advisory Fees Paid, Amount |
|
$ 1,167,613
|
|
| InvestmentCompanyPortfolioTurnover |
|
166.00%
|
|
| Additional Fund Statistics [Text Block] |
|
Total Net Assets |
$231,464,201 |
# of Portfolio Holdings |
20 |
Portfolio Turnover Rate |
166% |
Total Management Fees Paid |
$1,167,613 | |
|
| Holdings [Text Block] |
|
Asset Class Exposure % of VaR*
Header |
Net (%) |
% of VaR |
Stocks |
41.6 |
48.3 |
Credit |
47.3 |
6.1 |
Bonds and Rates |
75.1 |
27.6 |
Commodities |
14.7 |
18.0 |
Value |
Value |
Standard Deviation |
10.98 |
Sharpe Ratio |
0.00 | Sharpe Ratio is a measure of the Fund’s return per unit of total risk. Standard Deviation is a measure of the historical volatility of the Fund’s returns. |
|
| Largest Holdings [Text Block] |
|
Top Ten Exposures - % of VaR*
BBG Commodity ex-Agriculturals Index |
Long |
18.0 |
US Treasuries |
Long |
12.4 |
S&P 500 Index |
Long |
7.8 |
Tokyo Stock Exchange Index |
Long |
4.6 |
NASDAQ 100 Index |
Long |
4.6 |
FTSE 100 |
Long |
3.7 |
Euro-STOXX |
Long |
3.6 |
Gilts |
Long |
3.5 |
S&P TSX 60 Index |
Long |
3.4 |
Nikkei |
Long |
3.0 | * Value at Risk (“VaR”) is a measure of the potential loss in value of a portfolio over a defined period for a given confidence interval. A one-day VaR at the 95% confidence level represents that there is a 5% probability that the mark-to-market loss on the portfolio over a one day horizon will exceed this value (assuming normal markets and no trading in the portfolio). |
|
| Material Fund Change [Text Block] |
|
|
|
| C000207200 |
|
|
|
| Shareholder Report [Line Items] |
|
|
|
| Fund Name |
|
AHL TargetRisk Fund
|
|
| Class Name |
|
R5
|
|
| Trading Symbol |
|
AHTIX
|
|
| Annual or Semi-Annual Statement [Text Block] |
|
This semi-annual shareholder report contains important information about American Beacon AHL TargetRisk Fund for the period of January 1, 2025 to June 30, 2025.
|
|
| Shareholder Report Annual or Semi-Annual |
|
Semi-Annual Shareholder Report
|
|
| Additional Information [Text Block] |
|
You can find additional information about the Fund at www.americanbeaconfunds.com/literature. You can also request this information by contacting us at 800-658-5811.
|
|
| Additional Information Phone Number |
|
800-658-5811
|
|
| Additional Information Website |
|
<span style="box-sizing: border-box; color: rgb(0, 0, 0); display: inline; flex-wrap: nowrap; font-size: 12px; font-weight: 400; grid-area: auto; line-height: 18px; margin: 0px; overflow: visible; text-align: left; text-align-last: auto; white-space-collapse: preserve-breaks;">www.americanbeaconfunds.com/literature</span>
|
|
| Expenses [Text Block] |
|
What were the Fund costs for the last six months?(based on a hypothetical $10,000 investment)
Class Name |
Costs of a $10,000 investment |
Costs paid as a percentage of a $10,000 investment |
R5 |
$51 |
1.04%Footnote Reference* |
| Footnote |
Description |
Footnote* |
Annualized. | |
|
| Expenses Paid, Amount |
|
$ 51
|
|
| Expense Ratio, Percent |
[4] |
1.04%
|
|
| AssetsNet |
|
$ 231,464,201
|
|
| Holdings Count | Holding |
|
20
|
|
| Advisory Fees Paid, Amount |
|
$ 1,167,613
|
|
| InvestmentCompanyPortfolioTurnover |
|
166.00%
|
|
| Additional Fund Statistics [Text Block] |
|
Total Net Assets |
$231,464,201 |
# of Portfolio Holdings |
20 |
Portfolio Turnover Rate |
166% |
Total Management Fees Paid |
$1,167,613 | |
|
| Holdings [Text Block] |
|
Asset Class Exposure % of VaR*
Header |
Net (%) |
% of VaR |
Stocks |
41.6 |
48.3 |
Credit |
47.3 |
6.1 |
Bonds and Rates |
75.1 |
27.6 |
Commodities |
14.7 |
18.0 |
Value |
Value |
Standard Deviation |
10.98 |
Sharpe Ratio |
0.00 | Sharpe Ratio is a measure of the Fund’s return per unit of total risk. Standard Deviation is a measure of the historical volatility of the Fund’s returns. |
|
| Largest Holdings [Text Block] |
|
Top Ten Exposures - % of VaR*
BBG Commodity ex-Agriculturals Index |
Long |
18.0 |
US Treasuries |
Long |
12.4 |
S&P 500 Index |
Long |
7.8 |
Tokyo Stock Exchange Index |
Long |
4.6 |
NASDAQ 100 Index |
Long |
4.6 |
FTSE 100 |
Long |
3.7 |
Euro-STOXX |
Long |
3.6 |
Gilts |
Long |
3.5 |
S&P TSX 60 Index |
Long |
3.4 |
Nikkei |
Long |
3.0 | * Value at Risk (“VaR”) is a measure of the potential loss in value of a portfolio over a defined period for a given confidence interval. A one-day VaR at the 95% confidence level represents that there is a 5% probability that the mark-to-market loss on the portfolio over a one day horizon will exceed this value (assuming normal markets and no trading in the portfolio). |
|
| Material Fund Change [Text Block] |
|
|
|
| C000207201 |
|
|
|
| Shareholder Report [Line Items] |
|
|
|
| Fund Name |
|
AHL TargetRisk Fund
|
|
| Class Name |
|
Y
|
|
| Trading Symbol |
|
AHTYX
|
|
| Annual or Semi-Annual Statement [Text Block] |
|
This semi-annual shareholder report contains important information about American Beacon AHL TargetRisk Fund for the period of January 1, 2025 to June 30, 2025.
|
|
| Shareholder Report Annual or Semi-Annual |
|
Semi-Annual Shareholder Report
|
|
| Additional Information [Text Block] |
|
You can find additional information about the Fund at www.americanbeaconfunds.com/literature. You can also request this information by contacting us at 800-658-5811.
|
|
| Additional Information Phone Number |
|
800-658-5811
|
|
| Additional Information Website |
|
<span style="box-sizing: border-box; color: rgb(0, 0, 0); display: inline; flex-wrap: nowrap; font-size: 12px; font-weight: 400; grid-area: auto; line-height: 18px; margin: 0px; overflow: visible; text-align: left; text-align-last: auto; white-space-collapse: preserve-breaks;">www.americanbeaconfunds.com/literature</span>
|
|
| Expenses [Text Block] |
|
What were the Fund costs for the last six months?(based on a hypothetical $10,000 investment)
Class Name |
Costs of a $10,000 investment |
Costs paid as a percentage of a $10,000 investment |
Y |
$59 |
1.21%Footnote Reference* |
| Footnote |
Description |
Footnote* |
Annualized. | |
|
| Expenses Paid, Amount |
|
$ 59
|
|
| Expense Ratio, Percent |
[5] |
1.21%
|
|
| AssetsNet |
|
$ 231,464,201
|
|
| Holdings Count | Holding |
|
20
|
|
| Advisory Fees Paid, Amount |
|
$ 1,167,613
|
|
| InvestmentCompanyPortfolioTurnover |
|
166.00%
|
|
| Additional Fund Statistics [Text Block] |
|
Total Net Assets |
$231,464,201 |
# of Portfolio Holdings |
20 |
Portfolio Turnover Rate |
166% |
Total Management Fees Paid |
$1,167,613 | |
|
| Holdings [Text Block] |
|
Asset Class Exposure % of VaR*
Header |
Net (%) |
% of VaR |
Stocks |
41.6 |
48.3 |
Credit |
47.3 |
6.1 |
Bonds and Rates |
75.1 |
27.6 |
Commodities |
14.7 |
18.0 |
Value |
Value |
Standard Deviation |
10.98 |
Sharpe Ratio |
0.00 | Sharpe Ratio is a measure of the Fund’s return per unit of total risk. Standard Deviation is a measure of the historical volatility of the Fund’s returns. |
|
| Largest Holdings [Text Block] |
|
Top Ten Exposures - % of VaR*
BBG Commodity ex-Agriculturals Index |
Long |
18.0 |
US Treasuries |
Long |
12.4 |
S&P 500 Index |
Long |
7.8 |
Tokyo Stock Exchange Index |
Long |
4.6 |
NASDAQ 100 Index |
Long |
4.6 |
FTSE 100 |
Long |
3.7 |
Euro-STOXX |
Long |
3.6 |
Gilts |
Long |
3.5 |
S&P TSX 60 Index |
Long |
3.4 |
Nikkei |
Long |
3.0 | * Value at Risk (“VaR”) is a measure of the potential loss in value of a portfolio over a defined period for a given confidence interval. A one-day VaR at the 95% confidence level represents that there is a 5% probability that the mark-to-market loss on the portfolio over a one day horizon will exceed this value (assuming normal markets and no trading in the portfolio). |
|
| Material Fund Change [Text Block] |
|
|
|
| C000244413 |
|
|
|
| Shareholder Report [Line Items] |
|
|
|
| Fund Name |
|
AHL Multi-Alternatives Fund
|
|
| Class Name |
|
A
|
|
| Trading Symbol |
|
AHMAX
|
|
| Annual or Semi-Annual Statement [Text Block] |
|
This semi-annual shareholder report contains important information about American Beacon AHL Multi-Alternatives Fund for the period of January 1, 2025 to June 30, 2025.
|
|
| Shareholder Report Annual or Semi-Annual |
|
Semi-Annual Shareholder Report
|
|
| Additional Information [Text Block] |
|
You can find additional information about the Fund at www.americanbeaconfunds.com/literature. You can also request this information by contacting us at 800-658-5811.
|
|
| Additional Information Phone Number |
|
800-658-5811
|
|
| Additional Information Website |
|
<span style="box-sizing: border-box; color: rgb(0, 0, 0); display: inline; flex-wrap: nowrap; font-size: 13.3333px; font-weight: 400; grid-area: auto; line-height: 20px; margin: 0px; overflow: visible; text-align: left; text-align-last: auto; white-space-collapse: preserve-breaks;">www.americanbeaconfunds.com/literature</span>
|
|
| Expenses [Text Block] |
|
What were the Fund costs for the last six months?(based on a hypothetical $10,000 investment)
Class Name |
Costs of a $10,000 investment |
Costs paid as a percentage of a $10,000 investment |
Class A |
$75 |
1.56%Footnote Reference* |
| Footnote |
Description |
Footnote* |
Annualized. | |
|
| Expenses Paid, Amount |
|
$ 75
|
|
| Expense Ratio, Percent |
[6] |
1.56%
|
|
| AssetsNet |
|
$ 36,358,360
|
|
| Holdings Count | Holding |
|
12
|
|
| Advisory Fees Paid, Amount |
|
$ 0
|
|
| InvestmentCompanyPortfolioTurnover |
|
162.00%
|
|
| Additional Fund Statistics [Text Block] |
|
Total Net Assets |
$36,358,360 |
# of Portfolio Holdings |
12 |
Portfolio Turnover Rate |
162% |
Total Management Fees Paid |
$0 | |
|
| Holdings [Text Block] |
|
Top Active Exposures by Asset Class % of VaR*
Commodities |
Header |
% of VaR |
BBG Commodity ex-Agriculturals Index |
Long |
6.6 |
Silver |
Long |
2.2 |
Wheat |
Short |
2.0 |
Gold |
Long |
1.9 |
Natural Gas |
Short |
1.6 |
Credit |
Header |
% of VaR |
US 5yr CDX Index |
Long |
1.8 |
Currencies |
Header |
% of VaR |
Mexican Peso/US Dollar |
Long/Short |
2.4 |
South African Rand/US Dollar |
Long/Short |
1.7 |
Norwegian Krone/US Dollar |
Long/Short |
1.5 |
UK Sterling/US Dollar |
Long/Short |
1.4 |
Euro/US Dollar |
Long/Short |
1.2 |
Equities |
Header |
% of VaR |
S&P 500 Index |
Long |
4.1 |
FTSE 100 |
Long |
3.0 |
Tokyo Stock Exchange Index |
Long |
2.7 |
S&P TSX 60 Index |
Long |
2.6 |
NASDAQ 100 Index |
Long |
2.4 |
Fixed Income |
Header |
% of VaR |
US Treasuries |
Long |
3.3 |
Euribor |
Long |
2.3 |
Italian Bonds |
Long |
2.0 |
Australian Bonds |
Long |
1.4 |
French Bonds |
Long |
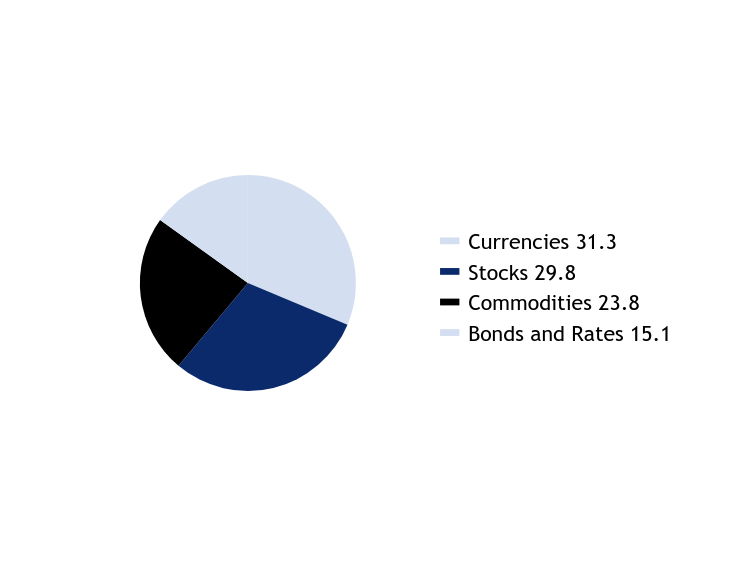
1.3 | Asset Class Exposure % of VaR*
Value |
Value |
Stocks |
35.4 |
Commodities |
24.6 |
Currencies |
21.8 |
Bonds and Rates |
16.4 |
Credit |
1.8 | *Value at Risk (“VaR”) is a measure of the potential loss in value of a portfolio over a defined period for a given confidence interval. A one-day VaR at the 95% confidence level represents that there is a 5% probability that the mark-to-market loss on the portfolio over a one day horizon will exceed this value (assuming normal markets and no trading in the portfolio). |
|
| Largest Holdings [Text Block] |
|
Top 10 Holdings % of VaR*
BBG Commodity ex-Agriculturals Index |
Long |
6.6 |
S&P 500 Index |
Long |
4.1 |
US Treasuries |
Long |
3.3 |
FTSE 100 |
Long |
3.0 |
Tokyo Stock Exchange Index |
Long |
2.7 |
S&P TSX 60 Index |
Long |
2.6 |
NASDAQ 100 Index |
Long |
2.4 |
Mexican Peso/US Dollar |
Long/Short |
2.4 |
Euribor |
Long |
2.3 |
Euro-STOXX |
Long |
2.2 | |
|
| C000244414 |
|
|
|
| Shareholder Report [Line Items] |
|
|
|
| Fund Name |
|
AHL Multi-Alternatives Fund
|
|
| Class Name |
|
C
|
|
| Trading Symbol |
|
AHMCX
|
|
| Annual or Semi-Annual Statement [Text Block] |
|
This semi-annual shareholder report contains important information about American Beacon AHL Multi-Alternatives Fund for the period of January 1, 2025 to June 30, 2025.
|
|
| Shareholder Report Annual or Semi-Annual |
|
Semi-Annual Shareholder Report
|
|
| Additional Information [Text Block] |
|
You can find additional information about the Fund at www.americanbeaconfunds.com/literature. You can also request this information by contacting us at 800-658-5811.
|
|
| Additional Information Phone Number |
|
800-658-5811
|
|
| Additional Information Website |
|
<span style="box-sizing: border-box; color: rgb(0, 0, 0); display: inline; flex-wrap: nowrap; font-size: 13.3333px; font-weight: 400; grid-area: auto; line-height: 20px; margin: 0px; overflow: visible; text-align: left; text-align-last: auto; white-space-collapse: preserve-breaks;">www.americanbeaconfunds.com/literature</span>
|
|
| Expenses [Text Block] |
|
What were the Fund costs for the last six months?(based on a hypothetical $10,000 investment)
Class Name |
Costs of a $10,000 investment |
Costs paid as a percentage of a $10,000 investment |
Class C |
$111 |
2.31%Footnote Reference* |
| Footnote |
Description |
Footnote* |
Annualized. | |
|
| Expenses Paid, Amount |
|
$ 111
|
|
| Expense Ratio, Percent |
[7] |
2.31%
|
|
| AssetsNet |
|
$ 36,358,360
|
|
| Holdings Count | Holding |
|
12
|
|
| Advisory Fees Paid, Amount |
|
$ 0
|
|
| InvestmentCompanyPortfolioTurnover |
|
162.00%
|
|
| Additional Fund Statistics [Text Block] |
|
Total Net Assets |
$36,358,360 |
# of Portfolio Holdings |
12 |
Portfolio Turnover Rate |
162% |
Total Management Fees Paid |
$0 | |
|
| Holdings [Text Block] |
|
Top Active Exposures by Asset Class % of VaR*
Commodities |
Header |
% of VaR |
BBG Commodity ex-Agriculturals Index |
Long |
6.6 |
Silver |
Long |
2.2 |
Wheat |
Short |
2.0 |
Gold |
Long |
1.9 |
Natural Gas |
Short |
1.6 |
Credit |
Header |
% of VaR |
US 5yr CDX Index |
Long |
1.8 |
Currencies |
Header |
% of VaR |
Mexican Peso/US Dollar |
Long/Short |
2.4 |
South African Rand/US Dollar |
Long/Short |
1.7 |
Norwegian Krone/US Dollar |
Long/Short |
1.5 |
UK Sterling/US Dollar |
Long/Short |
1.4 |
Euro/US Dollar |
Long/Short |
1.2 |
Equities |
Header |
% of VaR |
S&P 500 Index |
Long |
4.1 |
FTSE 100 |
Long |
3.0 |
Tokyo Stock Exchange Index |
Long |
2.7 |
S&P TSX 60 Index |
Long |
2.6 |
NASDAQ 100 Index |
Long |
2.4 |
Fixed Income |
Header |
% of VaR |
US Treasuries |
Long |
3.3 |
Euribor |
Long |
2.3 |
Italian Bonds |
Long |
2.0 |
Australian Bonds |
Long |
1.4 |
French Bonds |
Long |
1.3 | Asset Class Exposure % of VaR*
Value |
Value |
Stocks |
35.4 |
Commodities |
24.6 |
Currencies |
21.8 |
Bonds and Rates |
16.4 |
Credit |
1.8 | *Value at Risk (“VaR”) is a measure of the potential loss in value of a portfolio over a defined period for a given confidence interval. A one-day VaR at the 95% confidence level represents that there is a 5% probability that the mark-to-market loss on the portfolio over a one day horizon will exceed this value (assuming normal markets and no trading in the portfolio). |
|
| Largest Holdings [Text Block] |
|
Top 10 Holdings % of VaR*
BBG Commodity ex-Agriculturals Index |
Long |
6.6 |
S&P 500 Index |
Long |
4.1 |
US Treasuries |
Long |
3.3 |
FTSE 100 |
Long |
3.0 |
Tokyo Stock Exchange Index |
Long |
2.7 |
S&P TSX 60 Index |
Long |
2.6 |
NASDAQ 100 Index |
Long |
2.4 |
Mexican Peso/US Dollar |
Long/Short |
2.4 |
Euribor |
Long |
2.3 |
Euro-STOXX |
Long |
2.2 | |
|
| C000244411 |
|
|
|
| Shareholder Report [Line Items] |
|
|
|
| Fund Name |
|
AHL Multi-Alternatives Fund
|
|
| Class Name |
|
R6
|
|
| Trading Symbol |
|
AHMRX
|
|
| Annual or Semi-Annual Statement [Text Block] |
|
This semi-annual shareholder report contains important information about American Beacon AHL Multi-Alternatives Fund for the period of January 1, 2025 to June 30, 2025.
|
|
| Shareholder Report Annual or Semi-Annual |
|
Semi-Annual Shareholder Report
|
|
| Additional Information [Text Block] |
|
You can find additional information about the Fund at www.americanbeaconfunds.com/literature. You can also request this information by contacting us at 800-658-5811.
|
|
| Additional Information Phone Number |
|
800-658-5811
|
|
| Additional Information Website |
|
<span style="box-sizing: border-box; color: rgb(0, 0, 0); display: inline; flex-wrap: nowrap; font-size: 13.3333px; font-weight: 400; grid-area: auto; line-height: 20px; margin: 0px; overflow: visible; text-align: left; text-align-last: auto; white-space-collapse: preserve-breaks;">www.americanbeaconfunds.com/literature</span>
|
|
| Expenses [Text Block] |
|
What were the Fund costs for the last six months?(based on a hypothetical $10,000 investment)
Class Name |
Costs of a $10,000 investment |
Costs paid as a percentage of a $10,000 investment |
R6 |
$59 |
1.23%Footnote Reference* |
| Footnote |
Description |
Footnote* |
Annualized. | |
|
| Expenses Paid, Amount |
|
$ 59
|
|
| Expense Ratio, Percent |
[8] |
1.23%
|
|
| AssetsNet |
|
$ 36,358,360
|
|
| Holdings Count | Holding |
|
12
|
|
| Advisory Fees Paid, Amount |
|
$ 0
|
|
| InvestmentCompanyPortfolioTurnover |
|
162.00%
|
|
| Additional Fund Statistics [Text Block] |
|
Total Net Assets |
$36,358,360 |
# of Portfolio Holdings |
12 |
Portfolio Turnover Rate |
162% |
Total Management Fees Paid |
$0 | |
|
| Holdings [Text Block] |
|
Top Active Exposures by Asset Class % of VaR*
Commodities |
Header |
% of VaR |
BBG Commodity ex-Agriculturals Index |
Long |
6.6 |
Silver |
Long |
2.2 |
Wheat |
Short |
2.0 |
Gold |
Long |
1.9 |
Natural Gas |
Short |
1.6 |
Credit |
Header |
% of VaR |
US 5yr CDX Index |
Long |
1.8 |
Currencies |
Header |
% of VaR |
Mexican Peso/US Dollar |
Long/Short |
2.4 |
South African Rand/US Dollar |
Long/Short |
1.7 |
Norwegian Krone/US Dollar |
Long/Short |
1.5 |
UK Sterling/US Dollar |
Long/Short |
1.4 |
Euro/US Dollar |
Long/Short |
1.2 |
Equities |
Header |
% of VaR |
S&P 500 Index |
Long |
4.1 |
FTSE 100 |
Long |
3.0 |
Tokyo Stock Exchange Index |
Long |
2.7 |
S&P TSX 60 Index |
Long |
2.6 |
NASDAQ 100 Index |
Long |
2.4 |
Fixed Income |
Header |
% of VaR |
US Treasuries |
Long |
3.3 |
Euribor |
Long |
2.3 |
Italian Bonds |
Long |
2.0 |
Australian Bonds |
Long |
1.4 |
French Bonds |
Long |
1.3 | Asset Class Exposure % of VaR*
Value |
Value |
Stocks |
35.4 |
Commodities |
24.6 |
Currencies |
21.8 |
Bonds and Rates |
16.4 |
Credit |
1.8 | *Value at Risk (“VaR”) is a measure of the potential loss in value of a portfolio over a defined period for a given confidence interval. A one-day VaR at the 95% confidence level represents that there is a 5% probability that the mark-to-market loss on the portfolio over a one day horizon will exceed this value (assuming normal markets and no trading in the portfolio). |
|
| Largest Holdings [Text Block] |
|
Top 10 Holdings % of VaR*
BBG Commodity ex-Agriculturals Index |
Long |
6.6 |
S&P 500 Index |
Long |
4.1 |
US Treasuries |
Long |
3.3 |
FTSE 100 |
Long |
3.0 |
Tokyo Stock Exchange Index |
Long |
2.7 |
S&P TSX 60 Index |
Long |
2.6 |
NASDAQ 100 Index |
Long |
2.4 |
Mexican Peso/US Dollar |
Long/Short |
2.4 |
Euribor |
Long |
2.3 |
Euro-STOXX |
Long |
2.2 | |
|
| C000244412 |
|
|
|
| Shareholder Report [Line Items] |
|
|
|
| Fund Name |
|
AHL Multi-Alternatives Fund
|
|
| Class Name |
|
Y
|
|
| Trading Symbol |
|
AHMYX
|
|
| Annual or Semi-Annual Statement [Text Block] |
|
This semi-annual shareholder report contains important information about American Beacon AHL Multi-Alternatives Fund for the period of January 1, 2025 to June 30, 2025.
|
|
| Shareholder Report Annual or Semi-Annual |
|
Semi-Annual Shareholder Report
|
|
| Additional Information [Text Block] |
|
You can find additional information about the Fund at www.americanbeaconfunds.com/literature. You can also request this information by contacting us at 800-658-5811.
|
|
| Additional Information Phone Number |
|
800-658-5811
|
|
| Additional Information Website |
|
<span style="box-sizing: border-box; color: rgb(0, 0, 0); display: inline; flex-wrap: nowrap; font-size: 13.3333px; font-weight: 400; grid-area: auto; line-height: 20px; margin: 0px; overflow: visible; text-align: left; text-align-last: auto; white-space-collapse: preserve-breaks;">www.americanbeaconfunds.com/literature</span>
|
|
| Expenses [Text Block] |
|
What were the Fund costs for the last six months?(based on a hypothetical $10,000 investment)
Class Name |
Costs of a $10,000 investment |
Costs paid as a percentage of a $10,000 investment |
Y |
$64 |
1.33%Footnote Reference* |
| Footnote |
Description |
Footnote* |
Annualized. | |
|
| Expenses Paid, Amount |
|
$ 64
|
|
| Expense Ratio, Percent |
[9] |
1.33%
|
|
| AssetsNet |
|
$ 36,358,360
|
|
| Holdings Count | Holding |
|
12
|
|
| Advisory Fees Paid, Amount |
|
$ 0
|
|
| InvestmentCompanyPortfolioTurnover |
|
162.00%
|
|
| Additional Fund Statistics [Text Block] |
|
Total Net Assets |
$36,358,360 |
# of Portfolio Holdings |
12 |
Portfolio Turnover Rate |
162% |
Total Management Fees Paid |
$0 | |
|
| Holdings [Text Block] |
|
Top Active Exposures by Asset Class % of VaR*
Commodities |
Header |
% of VaR |
BBG Commodity ex-Agriculturals Index |
Long |
6.6 |
Silver |
Long |
2.2 |
Wheat |
Short |
2.0 |
Gold |
Long |
1.9 |
Natural Gas |
Short |
1.6 |
Credit |
Header |
% of VaR |
US 5yr CDX Index |
Long |
1.8 |
Currencies |
Header |
% of VaR |
Mexican Peso/US Dollar |
Long/Short |
2.4 |
South African Rand/US Dollar |
Long/Short |
1.7 |
Norwegian Krone/US Dollar |
Long/Short |
1.5 |
UK Sterling/US Dollar |
Long/Short |
1.4 |
Euro/US Dollar |
Long/Short |
1.2 |
Equities |
Header |
% of VaR |
S&P 500 Index |
Long |
4.1 |
FTSE 100 |
Long |
3.0 |
Tokyo Stock Exchange Index |
Long |
2.7 |
S&P TSX 60 Index |
Long |
2.6 |
NASDAQ 100 Index |
Long |
2.4 |
Fixed Income |
Header |
% of VaR |
US Treasuries |
Long |
3.3 |
Euribor |
Long |
2.3 |
Italian Bonds |
Long |
2.0 |
Australian Bonds |
Long |
1.4 |
French Bonds |
Long |
1.3 | Asset Class Exposure % of VaR*
Value |
Value |
Stocks |
35.4 |
Commodities |
24.6 |
Currencies |
21.8 |
Bonds and Rates |
16.4 |
Credit |
1.8 | *Value at Risk (“VaR”) is a measure of the potential loss in value of a portfolio over a defined period for a given confidence interval. A one-day VaR at the 95% confidence level represents that there is a 5% probability that the mark-to-market loss on the portfolio over a one day horizon will exceed this value (assuming normal markets and no trading in the portfolio). |
|
| Largest Holdings [Text Block] |
|
Top 10 Holdings % of VaR*
BBG Commodity ex-Agriculturals Index |
Long |
6.6 |
S&P 500 Index |
Long |
4.1 |
US Treasuries |
Long |
3.3 |
FTSE 100 |
Long |
3.0 |
Tokyo Stock Exchange Index |
Long |
2.7 |
S&P TSX 60 Index |
Long |
2.6 |
NASDAQ 100 Index |
Long |
2.4 |
Mexican Peso/US Dollar |
Long/Short |
2.4 |
Euribor |
Long |
2.3 |
Euro-STOXX |
Long |
2.2 | |
|
| C000162332 |
|
|
|
| Shareholder Report [Line Items] |
|
|
|
| Fund Name |
|
Man Large Cap Growth Fund
|
|
| Class Name |
|
A
|
|
| Trading Symbol |
|
BLYAX
|
|
| Annual or Semi-Annual Statement [Text Block] |
|
This semi-annual shareholder report contains important information about Man Large Cap Growth Fund for the period of January 1, 2025 to June 30, 2025.
|
|
| Shareholder Report Annual or Semi-Annual |
|
Semi-Annual Shareholder Report
|
|
| Additional Information [Text Block] |
|
You can find additional information about the Fund at www.americanbeaconfunds.com/literature. You can also request this information by contacting us at 800-658-5811.
|
|
| Additional Information Phone Number |
|
800-658-5811
|
|
| Additional Information Website |
|
<span style="box-sizing: border-box; color: rgb(0, 0, 0); display: inline; flex-wrap: nowrap; font-size: 12px; font-weight: 400; grid-area: auto; line-height: 18px; margin: 0px; overflow: visible; text-align: left; text-align-last: auto; white-space-collapse: preserve-breaks;">www.americanbeaconfunds.com/literature</span>
|
|
| Expenses [Text Block] |
|
What were the Fund costs for the last six months?(based on a hypothetical $10,000 investment)
Class Name |
Costs of a $10,000 investment |
Costs paid as a percentage of a $10,000 investment |
Class A |
$56 |
1.09%Footnote Reference* |
| Footnote |
Description |
Footnote* |
Annualized. | |
|
| Expenses Paid, Amount |
|
$ 56
|
|
| Expense Ratio, Percent |
[10] |
1.09%
|
|
| AssetsNet |
|
$ 199,114,598
|
|
| Holdings Count | Holding |
|
66
|
|
| Advisory Fees Paid, Amount |
|
$ 518,398
|
|
| InvestmentCompanyPortfolioTurnover |
|
12.00%
|
|
| Additional Fund Statistics [Text Block] |
|
Total Net Assets |
$199,114,598 |
# of Portfolio Holdings |
66 |
Portfolio Turnover Rate |
12% |
Total Management Fees Paid |
$518,398 | |
|
| Holdings [Text Block] |
|
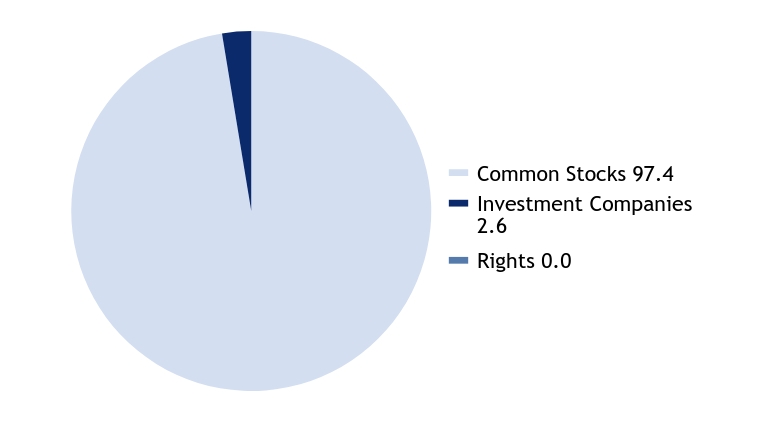
Asset Allocation - % Investments
Value |
Value |
Common Stocks |
97.4 |
Investment Companies |
2.6 |
Rights |
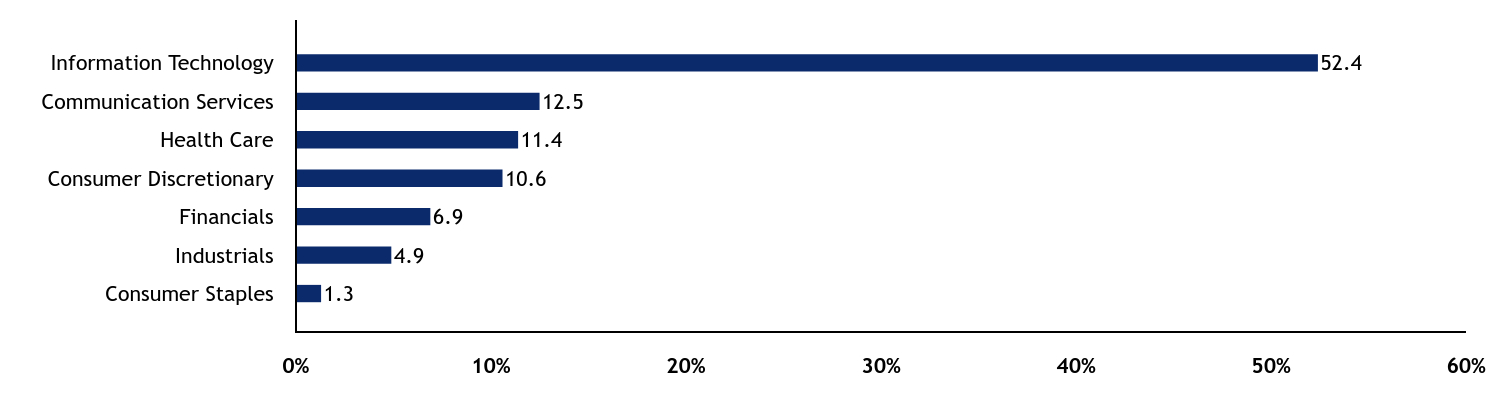
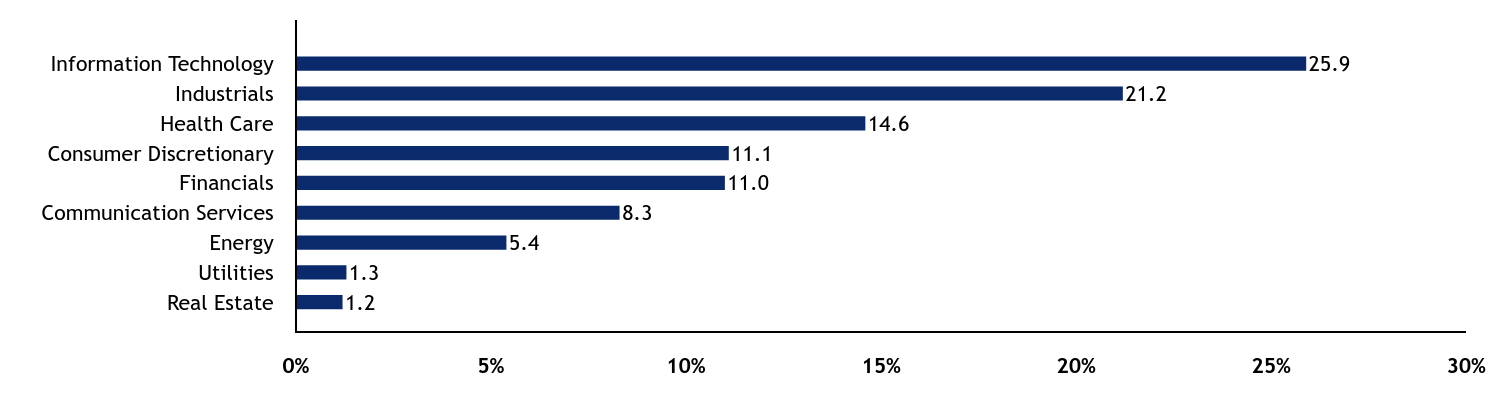
0.0 | The Fund may purchase and sell futures contracts to gain market exposure on cash balances. Sector Allocation - % Equities
Value |
Value |
Consumer Staples |
1.3 |
Industrials |
4.9 |
Financials |
6.9 |
Consumer Discretionary |
10.6 |
Health Care |
11.4 |
Communication Services |
12.5 |
Information Technology |
52.4 | |
|
| Largest Holdings [Text Block] |
|
Top Ten Holdings - % Net Assets
NVIDIA Corp. |
6.5 |
Alphabet, Inc., Class A |
6.2 |
Amazon.com, Inc. |
6.0 |
Microsoft Corp. |
5.7 |
Meta Platforms, Inc., Class A |
4.7 |
Apple, Inc. |
4.2 |
Mastercard, Inc., Class A |
3.9 |
Booking Holdings, Inc. |
3.6 |
Fortinet, Inc. |
3.0 |
Veeva Systems, Inc., Class A |
2.0 | Excludes cash equivalents. |
|
| Material Fund Change [Text Block] |
|
|
|
| C000162333 |
|
|
|
| Shareholder Report [Line Items] |
|
|
|
| Fund Name |
|
Man Large Cap Growth Fund
|
|
| Class Name |
|
C
|
|
| Trading Symbol |
|
BLYCX
|
|
| Annual or Semi-Annual Statement [Text Block] |
|
This semi-annual shareholder report contains important information about Man Large Cap Growth Fund for the period of January 1, 2025 to June 30, 2025.
|
|
| Shareholder Report Annual or Semi-Annual |
|
Semi-Annual Shareholder Report
|
|
| Additional Information [Text Block] |
|
You can find additional information about the Fund at www.americanbeaconfunds.com/literature. You can also request this information by contacting us at 800-658-5811.
|
|
| Additional Information Phone Number |
|
800-658-5811
|
|
| Additional Information Website |
|
<span style="box-sizing: border-box; color: rgb(0, 0, 0); display: inline; flex-wrap: nowrap; font-size: 12px; font-weight: 400; grid-area: auto; line-height: 18px; margin: 0px; overflow: visible; text-align: left; text-align-last: auto; white-space-collapse: preserve-breaks;">www.americanbeaconfunds.com/literature</span>
|
|
| Expenses [Text Block] |
|
What were the Fund costs for the last six months?(based on a hypothetical $10,000 investment)
Class Name |
Costs of a $10,000 investment |
Costs paid as a percentage of a $10,000 investment |
Class C |
$93 |
1.83%Footnote Reference* |
| Footnote |
Description |
Footnote* |
Annualized. | |
|
| Expenses Paid, Amount |
|
$ 93
|
|
| Expense Ratio, Percent |
[11] |
1.83%
|
|
| AssetsNet |
|
$ 199,114,598
|
|
| Holdings Count | Holding |
|
66
|
|
| Advisory Fees Paid, Amount |
|
$ 518,398
|
|
| InvestmentCompanyPortfolioTurnover |
|
12.00%
|
|
| Additional Fund Statistics [Text Block] |
|
Total Net Assets |
$199,114,598 |
# of Portfolio Holdings |
66 |
Portfolio Turnover Rate |
12% |
Total Management Fees Paid |
$518,398 | |
|
| Holdings [Text Block] |
|
Asset Allocation - % Investments
Value |
Value |
Common Stocks |
97.4 |
Investment Companies |
2.6 |
Rights |
0.0 | The Fund may purchase and sell futures contracts to gain market exposure on cash balances. Sector Allocation - % Equities
Value |
Value |
Consumer Staples |
1.3 |
Industrials |
4.9 |
Financials |
6.9 |
Consumer Discretionary |
10.6 |
Health Care |
11.4 |
Communication Services |
12.5 |
Information Technology |
52.4 | |
|
| Largest Holdings [Text Block] |
|
Top Ten Holdings - % Net Assets
NVIDIA Corp. |
6.5 |
Alphabet, Inc., Class A |
6.2 |
Amazon.com, Inc. |
6.0 |
Microsoft Corp. |
5.7 |
Meta Platforms, Inc., Class A |
4.7 |
Apple, Inc. |
4.2 |
Mastercard, Inc., Class A |
3.9 |
Booking Holdings, Inc. |
3.6 |
Fortinet, Inc. |
3.0 |
Veeva Systems, Inc., Class A |
2.0 | Excludes cash equivalents. |
|
| Material Fund Change [Text Block] |
|
|
|
| C000162335 |
|
|
|
| Shareholder Report [Line Items] |
|
|
|
| Fund Name |
|
Man Large Cap Growth Fund
|
|
| Class Name |
|
Investor
|
|
| Trading Symbol |
|
BLYPX
|
|
| Annual or Semi-Annual Statement [Text Block] |
|
This semi-annual shareholder report contains important information about Man Large Cap Growth Fund for the period of January 1, 2025 to June 30, 2025.
|
|
| Shareholder Report Annual or Semi-Annual |
|
Semi-Annual Shareholder Report
|
|
| Additional Information [Text Block] |
|
You can find additional information about the Fund at www.americanbeaconfunds.com/literature. You can also request this information by contacting us at 800-658-5811.
|
|
| Additional Information Phone Number |
|
800-658-5811
|
|
| Additional Information Website |
|
<span style="box-sizing: border-box; color: rgb(0, 0, 0); display: inline; flex-wrap: nowrap; font-size: 12px; font-weight: 400; grid-area: auto; line-height: 18px; margin: 0px; overflow: visible; text-align: left; text-align-last: auto; white-space-collapse: preserve-breaks;">www.americanbeaconfunds.com/literature</span>
|
|
| Expenses [Text Block] |
|
What were the Fund costs for the last six months?(based on a hypothetical $10,000 investment)
Class Name |
Costs of a $10,000 investment |
Costs paid as a percentage of a $10,000 investment |
Investor |
$57 |
1.12%Footnote Reference* |
| Footnote |
Description |
Footnote* |
Annualized. | |
|
| Expenses Paid, Amount |
|
$ 57
|
|
| Expense Ratio, Percent |
[12] |
1.12%
|
|
| AssetsNet |
|
$ 199,114,598
|
|
| Holdings Count | Holding |
|
66
|
|
| Advisory Fees Paid, Amount |
|
$ 518,398
|
|
| InvestmentCompanyPortfolioTurnover |
|
12.00%
|
|
| Additional Fund Statistics [Text Block] |
|
Total Net Assets |
$199,114,598 |
# of Portfolio Holdings |
66 |
Portfolio Turnover Rate |
12% |
Total Management Fees Paid |
$518,398 | |
|
| Holdings [Text Block] |
|
Asset Allocation - % Investments
Value |
Value |
Common Stocks |
97.4 |
Investment Companies |
2.6 |
Rights |
0.0 | The Fund may purchase and sell futures contracts to gain market exposure on cash balances. Sector Allocation - % Equities
Value |
Value |
Consumer Staples |
1.3 |
Industrials |
4.9 |
Financials |
6.9 |
Consumer Discretionary |
10.6 |
Health Care |
11.4 |
Communication Services |
12.5 |
Information Technology |
52.4 | |
|
| Largest Holdings [Text Block] |
|
Top Ten Holdings - % Net Assets
NVIDIA Corp. |
6.5 |
Alphabet, Inc., Class A |
6.2 |
Amazon.com, Inc. |
6.0 |
Microsoft Corp. |
5.7 |
Meta Platforms, Inc., Class A |
4.7 |
Apple, Inc. |
4.2 |
Mastercard, Inc., Class A |
3.9 |
Booking Holdings, Inc. |
3.6 |
Fortinet, Inc. |
3.0 |
Veeva Systems, Inc., Class A |
2.0 | Excludes cash equivalents. |
|
| Material Fund Change [Text Block] |
|
|
|
| C000162334 |
|
|
|
| Shareholder Report [Line Items] |
|
|
|
| Fund Name |
|
Man Large Cap Growth Fund
|
|
| Class Name |
|
R5
|
|
| Trading Symbol |
|
BRLGX
|
|
| Annual or Semi-Annual Statement [Text Block] |
|
This semi-annual shareholder report contains important information about Man Large Cap Growth Fund for the period of January 1, 2025 to June 30, 2025.
|
|
| Shareholder Report Annual or Semi-Annual |
|
Semi-Annual Shareholder Report
|
|
| Additional Information [Text Block] |
|
You can find additional information about the Fund at www.americanbeaconfunds.com/literature. You can also request this information by contacting us at 800-658-5811.
|
|
| Additional Information Phone Number |
|
800-658-5811
|
|
| Additional Information Website |
|
<span style="box-sizing: border-box; color: rgb(0, 0, 0); display: inline; flex-wrap: nowrap; font-size: 12px; font-weight: 400; grid-area: auto; line-height: 18px; margin: 0px; overflow: visible; text-align: left; text-align-last: auto; white-space-collapse: preserve-breaks;">www.americanbeaconfunds.com/literature</span>
|
|
| Expenses [Text Block] |
|
What were the Fund costs for the last six months?(based on a hypothetical $10,000 investment)
Class Name |
Costs of a $10,000 investment |
Costs paid as a percentage of a $10,000 investment |
R5 |
$41 |
0.80%Footnote Reference* |
| Footnote |
Description |
Footnote* |
Annualized. | |
|
| Expenses Paid, Amount |
|
$ 41
|
|
| Expense Ratio, Percent |
[13] |
0.80%
|
|
| AssetsNet |
|
$ 199,114,598
|
|
| Holdings Count | Holding |
|
66
|
|
| Advisory Fees Paid, Amount |
|
$ 518,398
|
|
| InvestmentCompanyPortfolioTurnover |
|
12.00%
|
|
| Additional Fund Statistics [Text Block] |
|
Total Net Assets |
$199,114,598 |
# of Portfolio Holdings |
66 |
Portfolio Turnover Rate |
12% |
Total Management Fees Paid |
$518,398 | |
|
| Holdings [Text Block] |
|
Asset Allocation - % Investments
Value |
Value |
Common Stocks |
97.4 |
Investment Companies |
2.6 |
Rights |
0.0 | The Fund may purchase and sell futures contracts to gain market exposure on cash balances. Sector Allocation - % Equities
Value |
Value |
Consumer Staples |
1.3 |
Industrials |
4.9 |
Financials |
6.9 |
Consumer Discretionary |
10.6 |
Health Care |
11.4 |
Communication Services |
12.5 |
Information Technology |
52.4 | |
|
| Largest Holdings [Text Block] |
|
Top Ten Holdings - % Net Assets
NVIDIA Corp. |
6.5 |
Alphabet, Inc., Class A |
6.2 |
Amazon.com, Inc. |
6.0 |
Microsoft Corp. |
5.7 |
Meta Platforms, Inc., Class A |
4.7 |
Apple, Inc. |
4.2 |
Mastercard, Inc., Class A |
3.9 |
Booking Holdings, Inc. |
3.6 |
Fortinet, Inc. |
3.0 |
Veeva Systems, Inc., Class A |
2.0 | Excludes cash equivalents. |
|
| Material Fund Change [Text Block] |
|
|
|
| C000202403 |
|
|
|
| Shareholder Report [Line Items] |
|
|
|
| Fund Name |
|
Man Large Cap Growth Fund
|
|
| Class Name |
|
R6
|
|
| Trading Symbol |
|
BLYRX
|
|
| Annual or Semi-Annual Statement [Text Block] |
|
This semi-annual shareholder report contains important information about Man Large Cap Growth Fund for the period of January 1, 2025 to June 30, 2025.
|
|
| Shareholder Report Annual or Semi-Annual |
|
Semi-Annual Shareholder Report
|
|
| Additional Information [Text Block] |
|
You can find additional information about the Fund at www.americanbeaconfunds.com/literature. You can also request this information by contacting us at 800-658-5811.
|
|
| Additional Information Phone Number |
|
800-658-5811
|
|
| Additional Information Website |
|
<span style="box-sizing: border-box; color: rgb(0, 0, 0); display: inline; flex-wrap: nowrap; font-size: 12px; font-weight: 400; grid-area: auto; line-height: 18px; margin: 0px; overflow: visible; text-align: left; text-align-last: auto; white-space-collapse: preserve-breaks;">www.americanbeaconfunds.com/literature</span>
|
|
| Expenses [Text Block] |
|
What were the Fund costs for the last six months?(based on a hypothetical $10,000 investment)
Class Name |
Costs of a $10,000 investment |
Costs paid as a percentage of a $10,000 investment |
R6 |
$39 |
0.77%Footnote Reference* |
| Footnote |
Description |
Footnote* |
Annualized. | |
|
| Expenses Paid, Amount |
|
$ 39
|
|
| Expense Ratio, Percent |
[14] |
0.77%
|
|
| AssetsNet |
|
$ 199,114,598
|
|
| Holdings Count | Holding |
|
66
|
|
| Advisory Fees Paid, Amount |
|
$ 518,398
|
|
| InvestmentCompanyPortfolioTurnover |
|
12.00%
|
|
| Additional Fund Statistics [Text Block] |
|
Total Net Assets |
$199,114,598 |
# of Portfolio Holdings |
66 |
Portfolio Turnover Rate |
12% |
Total Management Fees Paid |
$518,398 | |
|
| Holdings [Text Block] |
|
Asset Allocation - % Investments
Value |
Value |
Common Stocks |
97.4 |
Investment Companies |
2.6 |
Rights |
0.0 | The Fund may purchase and sell futures contracts to gain market exposure on cash balances. Sector Allocation - % Equities
Value |
Value |
Consumer Staples |
1.3 |
Industrials |
4.9 |
Financials |
6.9 |
Consumer Discretionary |
10.6 |
Health Care |
11.4 |
Communication Services |
12.5 |
Information Technology |
52.4 | |
|
| Largest Holdings [Text Block] |
|
Top Ten Holdings - % Net Assets
NVIDIA Corp. |
6.5 |
Alphabet, Inc., Class A |
6.2 |
Amazon.com, Inc. |
6.0 |
Microsoft Corp. |
5.7 |
Meta Platforms, Inc., Class A |
4.7 |
Apple, Inc. |
4.2 |
Mastercard, Inc., Class A |
3.9 |
Booking Holdings, Inc. |
3.6 |
Fortinet, Inc. |
3.0 |
Veeva Systems, Inc., Class A |
2.0 | Excludes cash equivalents. |
|
| Material Fund Change [Text Block] |
|
|
|
| C000162336 |
|
|
|
| Shareholder Report [Line Items] |
|
|
|
| Fund Name |
|
Man Large Cap Growth Fund
|
|
| Class Name |
|
Y
|
|
| Trading Symbol |
|
BLYYX
|
|
| Annual or Semi-Annual Statement [Text Block] |
|
This semi-annual shareholder report contains important information about Man Large Cap Growth Fund for the period of January 1, 2025 to June 30, 2025.
|
|
| Shareholder Report Annual or Semi-Annual |
|
Semi-Annual Shareholder Report
|
|
| Additional Information [Text Block] |
|
You can find additional information about the Fund at www.americanbeaconfunds.com/literature. You can also request this information by contacting us at 800-658-5811.
|
|
| Additional Information Phone Number |
|
800-658-5811
|
|
| Additional Information Website |
|
<span style="box-sizing: border-box; color: rgb(0, 0, 0); display: inline; flex-wrap: nowrap; font-size: 12px; font-weight: 400; grid-area: auto; line-height: 18px; margin: 0px; overflow: visible; text-align: left; text-align-last: auto; white-space-collapse: preserve-breaks;">www.americanbeaconfunds.com/literature</span>
|
|
| Expenses [Text Block] |
|
What were the Fund costs for the last six months?(based on a hypothetical $10,000 investment)
Class Name |
Costs of a $10,000 investment |
Costs paid as a percentage of a $10,000 investment |
Y |
$42 |
0.83%Footnote Reference* |
| Footnote |
Description |
Footnote* |
Annualized. | |
|
| Expenses Paid, Amount |
|
$ 42
|
|
| Expense Ratio, Percent |
[15] |
0.83%
|
|
| AssetsNet |
|
$ 199,114,598
|
|
| Holdings Count | Holding |
|
66
|
|
| Advisory Fees Paid, Amount |
|
$ 518,398
|
|
| InvestmentCompanyPortfolioTurnover |
|
12.00%
|
|
| Additional Fund Statistics [Text Block] |
|
Total Net Assets |
$199,114,598 |
# of Portfolio Holdings |
66 |
Portfolio Turnover Rate |
12% |
Total Management Fees Paid |
$518,398 | |
|
| Holdings [Text Block] |
|
Asset Allocation - % Investments
Value |
Value |
Common Stocks |
97.4 |
Investment Companies |
2.6 |
Rights |
0.0 | The Fund may purchase and sell futures contracts to gain market exposure on cash balances. Sector Allocation - % Equities
Value |
Value |
Consumer Staples |
1.3 |
Industrials |
4.9 |
Financials |
6.9 |
Consumer Discretionary |
10.6 |
Health Care |
11.4 |
Communication Services |
12.5 |
Information Technology |
52.4 | |
|
| Largest Holdings [Text Block] |
|
Top Ten Holdings - % Net Assets
NVIDIA Corp. |
6.5 |
Alphabet, Inc., Class A |
6.2 |
Amazon.com, Inc. |
6.0 |
Microsoft Corp. |
5.7 |
Meta Platforms, Inc., Class A |
4.7 |
Apple, Inc. |
4.2 |
Mastercard, Inc., Class A |
3.9 |
Booking Holdings, Inc. |
3.6 |
Fortinet, Inc. |
3.0 |
Veeva Systems, Inc., Class A |
2.0 | Excludes cash equivalents. |
|
| Material Fund Change [Text Block] |
|
|
|
| C000110036 |
|
|
|
| Shareholder Report [Line Items] |
|
|
|
| Fund Name |
|
Man Large Cap Value Fund
|
|
| Class Name |
|
A
|
|
| Trading Symbol |
|
BWLAX
|
|
| Annual or Semi-Annual Statement [Text Block] |
|
This semi-annual shareholder report contains important information about Man Large Cap Value Fund for the period of January 1, 2025 to June 30, 2025.
|
|
| Shareholder Report Annual or Semi-Annual |
|
Semi-Annual Shareholder Report
|
|
| Additional Information [Text Block] |
|
You can find additional information about the Fund at www.americanbeaconfunds.com/literature. You can also request this information by contacting us at 800-658-5811.
|
|
| Additional Information Phone Number |
|
800-658-5811
|
|
| Additional Information Website |
|
<span style="box-sizing: border-box; color: rgb(0, 0, 0); display: inline; flex-wrap: nowrap; font-size: 12px; font-weight: 400; grid-area: auto; line-height: 18px; margin: 0px; overflow: visible; text-align: left; text-align-last: auto; white-space-collapse: preserve-breaks;">www.americanbeaconfunds.com/literature</span>
|
|
| Expenses [Text Block] |
|
What were the Fund costs for the last six months?(based on a hypothetical $10,000 investment)
Class Name |
Costs of a $10,000 investment |
Costs paid as a percentage of a $10,000 investment |
Class A |
$56 |
1.10%Footnote Reference* |
| Footnote |
Description |
Footnote* |
Annualized. | |
|
| Expenses Paid, Amount |
|
$ 56
|
|
| Expense Ratio, Percent |
[16] |
1.10%
|
|
| AssetsNet |
|
$ 223,748,141
|
|
| Holdings Count | Holding |
|
99
|
|
| Advisory Fees Paid, Amount |
|
$ 619,548
|
|
| InvestmentCompanyPortfolioTurnover |
|
12.00%
|
|
| Additional Fund Statistics [Text Block] |
|
Total Net Assets |
$223,748,141 |
# of Portfolio Holdings |
99 |
Portfolio Turnover Rate |
12% |
Total Management Fees Paid |
$619,548 | |
|
| Holdings [Text Block] |
|
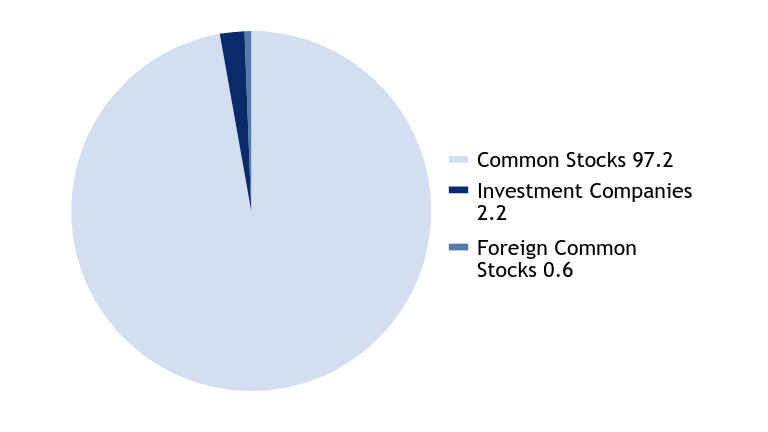
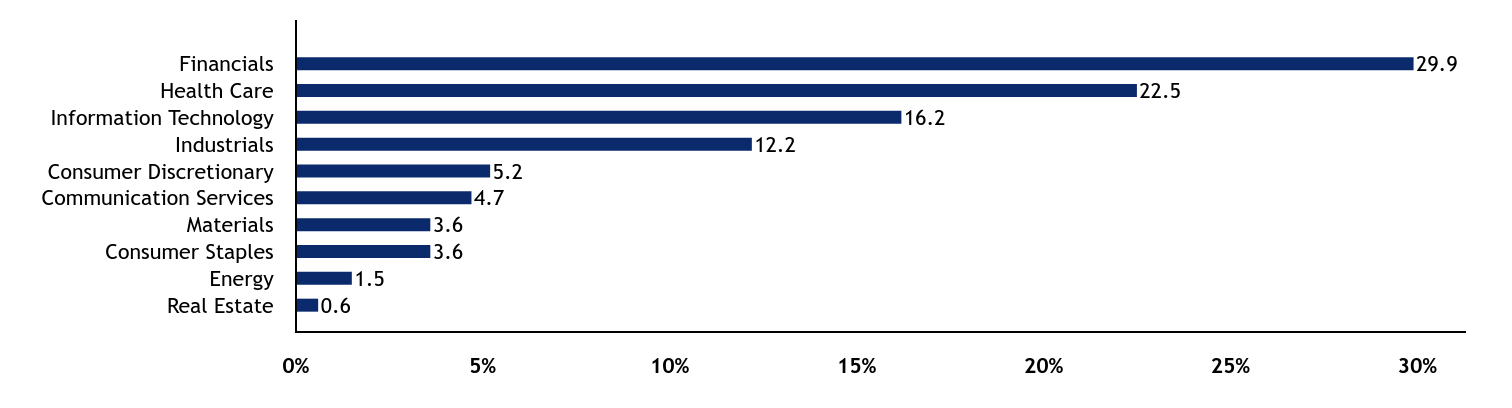
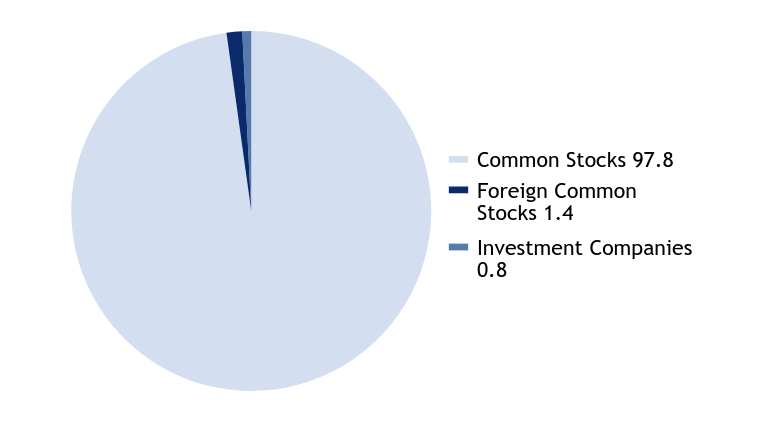
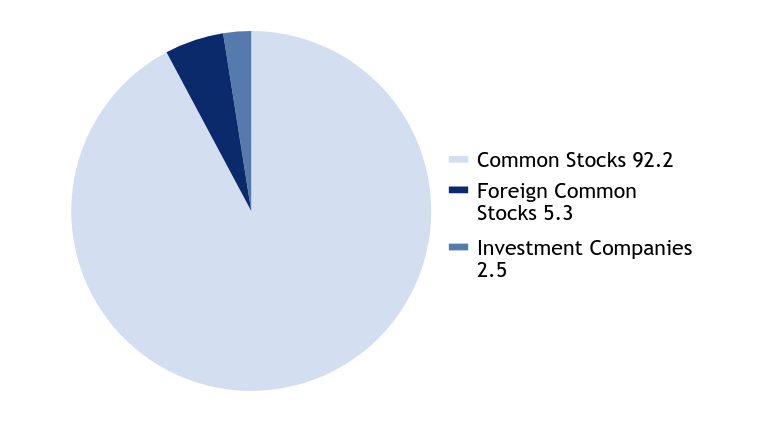
Asset Allocation - % Investments
Value |
Value |
Common Stocks |
97.2 |
Investment Companies |
2.2 |
Foreign Common Stocks |
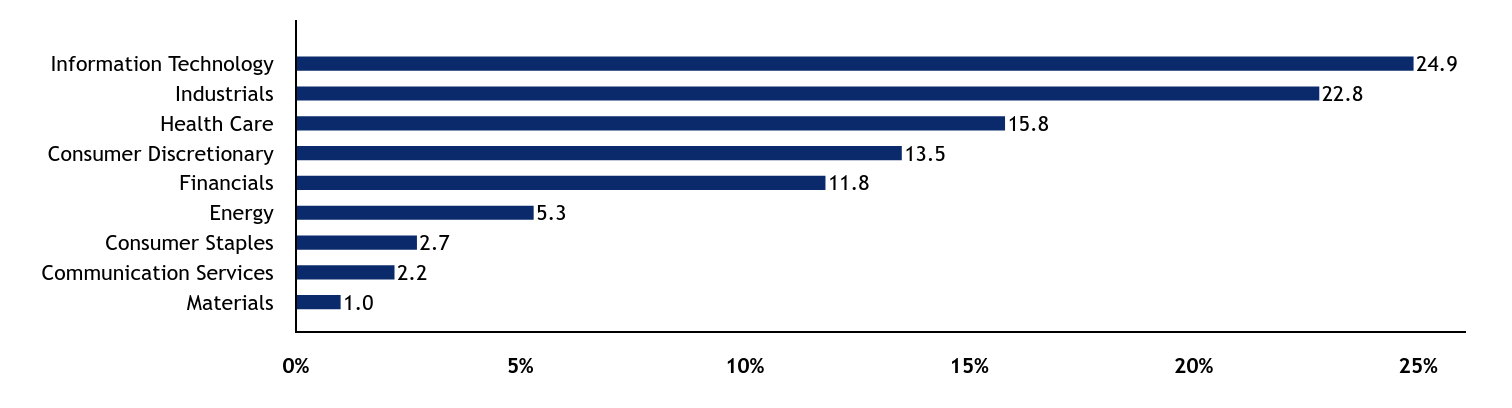
0.6 | The Fund may purchase and sell futures contracts to gain market exposure on cash balances. Sector Allocation - % Equities
Value |
Value |
Real Estate |
0.6 |
Energy |
1.5 |
Consumer Staples |
3.6 |
Materials |
3.6 |
Communication Services |
4.7 |
Consumer Discretionary |
5.2 |
Industrials |
12.2 |
Information Technology |
16.2 |
Health Care |
22.5 |
Financials |
29.9 | |
|
| Largest Holdings [Text Block] |
|
Top Ten Holdings - % Net Assets
RTX Corp. |
3.5 |
Cisco Systems, Inc. |
3.3 |
Synchrony Financial |
3.2 |
eBay, Inc. |
2.6 |
Salesforce, Inc. |
2.5 |
Capital One Financial Corp. |
2.5 |
Gilead Sciences, Inc. |
2.4 |
MetLife, Inc. |
2.2 |
Johnson & Johnson |
2.2 |
Cardinal Health, Inc. |
2.0 | Excludes cash equivalents. |
|
| Material Fund Change [Text Block] |
|
|
|
| C000110037 |
|
|
|
| Shareholder Report [Line Items] |
|
|
|
| Fund Name |
|
Man Large Cap Value Fund
|
|
| Class Name |
|
C
|
|
| Trading Symbol |
|
BWLCX
|
|
| Annual or Semi-Annual Statement [Text Block] |
|
This semi-annual shareholder report contains important information about Man Large Cap Value Fund for the period of January 1, 2025 to June 30, 2025.
|
|
| Shareholder Report Annual or Semi-Annual |
|
Semi-Annual Shareholder Report
|
|
| Additional Information [Text Block] |
|
You can find additional information about the Fund at www.americanbeaconfunds.com/literature. You can also request this information by contacting us at 800-658-5811.
|
|
| Additional Information Phone Number |
|
800-658-5811
|
|
| Additional Information Website |
|
<span style="box-sizing: border-box; color: rgb(0, 0, 0); display: inline; flex-wrap: nowrap; font-size: 12px; font-weight: 400; grid-area: auto; line-height: 18px; margin: 0px; overflow: visible; text-align: left; text-align-last: auto; white-space-collapse: preserve-breaks;">www.americanbeaconfunds.com/literature</span>
|
|
| Expenses [Text Block] |
|
What were the Fund costs for the last six months?(based on a hypothetical $10,000 investment)
Class Name |
Costs of a $10,000 investment |
Costs paid as a percentage of a $10,000 investment |
Class C |
$94 |
1.84%Footnote Reference* |
| Footnote |
Description |
Footnote* |
Annualized. | |
|
| Expenses Paid, Amount |
|
$ 94
|
|
| Expense Ratio, Percent |
[17] |
1.84%
|
|
| AssetsNet |
|
$ 223,748,141
|
|
| Holdings Count | Holding |
|
99
|
|
| Advisory Fees Paid, Amount |
|
$ 619,548
|
|
| InvestmentCompanyPortfolioTurnover |
|
12.00%
|
|
| Additional Fund Statistics [Text Block] |
|
Total Net Assets |
$223,748,141 |
# of Portfolio Holdings |
99 |
Portfolio Turnover Rate |
12% |
Total Management Fees Paid |
$619,548 | |
|
| Holdings [Text Block] |
|
Asset Allocation - % Investments
Value |
Value |
Common Stocks |
97.2 |
Investment Companies |
2.2 |
Foreign Common Stocks |
0.6 | The Fund may purchase and sell futures contracts to gain market exposure on cash balances. Sector Allocation - % Equities
Value |
Value |
Real Estate |
0.6 |
Energy |
1.5 |
Consumer Staples |
3.6 |
Materials |
3.6 |
Communication Services |
4.7 |
Consumer Discretionary |
5.2 |
Industrials |
12.2 |
Information Technology |
16.2 |
Health Care |
22.5 |
Financials |
29.9 | |
|
| Largest Holdings [Text Block] |
|
Top Ten Holdings - % Net Assets
RTX Corp. |
3.5 |
Cisco Systems, Inc. |
3.3 |
Synchrony Financial |
3.2 |
eBay, Inc. |
2.6 |
Salesforce, Inc. |
2.5 |
Capital One Financial Corp. |
2.5 |
Gilead Sciences, Inc. |
2.4 |
MetLife, Inc. |
2.2 |
Johnson & Johnson |
2.2 |
Cardinal Health, Inc. |
2.0 | Excludes cash equivalents. |
|
| Material Fund Change [Text Block] |
|
|
|
| C000110040 |
|
|
|
| Shareholder Report [Line Items] |
|
|
|
| Fund Name |
|
Man Large Cap Value Fund
|
|
| Class Name |
|
Investor
|
|
| Trading Symbol |
|
BWLIX
|
|
| Annual or Semi-Annual Statement [Text Block] |
|
This semi-annual shareholder report contains important information about Man Large Cap Value Fund for the period of January 1, 2025 to June 30, 2025.
|
|
| Shareholder Report Annual or Semi-Annual |
|
Semi-Annual Shareholder Report
|
|
| Additional Information [Text Block] |
|
You can find additional information about the Fund at www.americanbeaconfunds.com/literature. You can also request this information by contacting us at 800-658-5811.
|
|
| Additional Information Phone Number |
|
800-658-5811
|
|
| Additional Information Website |
|
<span style="box-sizing: border-box; color: rgb(0, 0, 0); display: inline; flex-wrap: nowrap; font-size: 12px; font-weight: 400; grid-area: auto; line-height: 18px; margin: 0px; overflow: visible; text-align: left; text-align-last: auto; white-space-collapse: preserve-breaks;">www.americanbeaconfunds.com/literature</span>
|
|
| Expenses [Text Block] |
|
What were the Fund costs for the last six months?(based on a hypothetical $10,000 investment)
Class Name |
Costs of a $10,000 investment |
Costs paid as a percentage of a $10,000 investment |
Investor |
$55 |
1.07%Footnote Reference* |
| Footnote |
Description |
Footnote* |
Annualized. | |
|
| Expenses Paid, Amount |
|
$ 55
|
|
| Expense Ratio, Percent |
[18] |
1.07%
|
|
| AssetsNet |
|
$ 223,748,141
|
|
| Holdings Count | Holding |
|
99
|
|
| Advisory Fees Paid, Amount |
|
$ 619,548
|
|
| InvestmentCompanyPortfolioTurnover |
|
12.00%
|
|
| Additional Fund Statistics [Text Block] |
|
Total Net Assets |
$223,748,141 |
# of Portfolio Holdings |
99 |
Portfolio Turnover Rate |
12% |
Total Management Fees Paid |
$619,548 | |
|
| Holdings [Text Block] |
|
Asset Allocation - % Investments
Value |
Value |
Common Stocks |
97.2 |
Investment Companies |
2.2 |
Foreign Common Stocks |
0.6 | The Fund may purchase and sell futures contracts to gain market exposure on cash balances. Sector Allocation - % Equities
Value |
Value |
Real Estate |
0.6 |
Energy |
1.5 |
Consumer Staples |
3.6 |
Materials |
3.6 |
Communication Services |
4.7 |
Consumer Discretionary |
5.2 |
Industrials |
12.2 |
Information Technology |
16.2 |
Health Care |
22.5 |
Financials |
29.9 | |
|
| Largest Holdings [Text Block] |
|
Top Ten Holdings - % Net Assets
RTX Corp. |
3.5 |
Cisco Systems, Inc. |
3.3 |
Synchrony Financial |
3.2 |
eBay, Inc. |
2.6 |
Salesforce, Inc. |
2.5 |
Capital One Financial Corp. |
2.5 |
Gilead Sciences, Inc. |
2.4 |
MetLife, Inc. |
2.2 |
Johnson & Johnson |
2.2 |
Cardinal Health, Inc. |
2.0 | Excludes cash equivalents. |
|
| Material Fund Change [Text Block] |
|
|
|
| C000110038 |
|
|
|
| Shareholder Report [Line Items] |
|
|
|
| Fund Name |
|
Man Large Cap Value Fund
|
|
| Class Name |
|
R5
|
|
| Trading Symbol |
|
BRLVX
|
|
| Annual or Semi-Annual Statement [Text Block] |
|
This semi-annual shareholder report contains important information about Man Large Cap Value Fund for the period of January 1, 2025 to June 30, 2025.
|
|
| Shareholder Report Annual or Semi-Annual |
|
Semi-Annual Shareholder Report
|
|
| Additional Information [Text Block] |
|
You can find additional information about the Fund at www.americanbeaconfunds.com/literature. You can also request this information by contacting us at 800-658-5811.
|
|
| Additional Information Phone Number |
|
800-658-5811
|
|
| Additional Information Website |
|
<span style="box-sizing: border-box; color: rgb(0, 0, 0); display: inline; flex-wrap: nowrap; font-size: 12px; font-weight: 400; grid-area: auto; line-height: 18px; margin: 0px; overflow: visible; text-align: left; text-align-last: auto; white-space-collapse: preserve-breaks;">www.americanbeaconfunds.com/literature</span>
|
|
| Expenses [Text Block] |
|
What were the Fund costs for the last six months?(based on a hypothetical $10,000 investment)
Class Name |
Costs of a $10,000 investment |
Costs paid as a percentage of a $10,000 investment |
R5 |
$38 |
0.75%Footnote Reference* |
| Footnote |
Description |
Footnote* |
Annualized. | |
|
| Expenses Paid, Amount |
|
$ 38
|
|
| Expense Ratio, Percent |
[19] |
0.75%
|
|
| AssetsNet |
|
$ 223,748,141
|
|
| Holdings Count | Holding |
|
99
|
|
| Advisory Fees Paid, Amount |
|
$ 619,548
|
|
| InvestmentCompanyPortfolioTurnover |
|
12.00%
|
|
| Additional Fund Statistics [Text Block] |
|
Total Net Assets |
$223,748,141 |
# of Portfolio Holdings |
99 |
Portfolio Turnover Rate |
12% |
Total Management Fees Paid |
$619,548 | |
|
| Holdings [Text Block] |
|
Asset Allocation - % Investments
Value |
Value |
Common Stocks |
97.2 |
Investment Companies |
2.2 |
Foreign Common Stocks |
0.6 | The Fund may purchase and sell futures contracts to gain market exposure on cash balances. Sector Allocation - % Equities
Value |
Value |
Real Estate |
0.6 |
Energy |
1.5 |
Consumer Staples |
3.6 |
Materials |
3.6 |
Communication Services |
4.7 |
Consumer Discretionary |
5.2 |
Industrials |
12.2 |
Information Technology |
16.2 |
Health Care |
22.5 |
Financials |
29.9 | |
|
| Largest Holdings [Text Block] |
|
Top Ten Holdings - % Net Assets
RTX Corp. |
3.5 |
Cisco Systems, Inc. |
3.3 |
Synchrony Financial |
3.2 |
eBay, Inc. |
2.6 |
Salesforce, Inc. |
2.5 |
Capital One Financial Corp. |
2.5 |
Gilead Sciences, Inc. |
2.4 |
MetLife, Inc. |
2.2 |
Johnson & Johnson |
2.2 |
Cardinal Health, Inc. |
2.0 | Excludes cash equivalents. |
|
| Material Fund Change [Text Block] |
|
|
|
| C000190448 |
|
|
|
| Shareholder Report [Line Items] |
|
|
|
| Fund Name |
|
Man Large Cap Value Fund
|
|
| Class Name |
|
R6
|
|
| Trading Symbol |
|
BWLRX
|
|
| Annual or Semi-Annual Statement [Text Block] |
|
This semi-annual shareholder report contains important information about Man Large Cap Value Fund for the period of January 1, 2025 to June 30, 2025.
|
|
| Shareholder Report Annual or Semi-Annual |
|
Semi-Annual Shareholder Report
|
|
| Additional Information [Text Block] |
|
You can find additional information about the Fund at www.americanbeaconfunds.com/literature. You can also request this information by contacting us at 800-658-5811.
|
|
| Additional Information Phone Number |
|
800-658-5811
|
|
| Additional Information Website |
|
<span style="box-sizing: border-box; color: rgb(0, 0, 0); display: inline; flex-wrap: nowrap; font-size: 12px; font-weight: 400; grid-area: auto; line-height: 18px; margin: 0px; overflow: visible; text-align: left; text-align-last: auto; white-space-collapse: preserve-breaks;">www.americanbeaconfunds.com/literature</span>
|
|
| Expenses [Text Block] |
|
What were the Fund costs for the last six months?(based on a hypothetical $10,000 investment)
Class Name |
Costs of a $10,000 investment |
Costs paid as a percentage of a $10,000 investment |
R6 |
$37 |
0.73%Footnote Reference* |
| Footnote |
Description |
Footnote* |
Annualized. | |
|
| Expenses Paid, Amount |
|
$ 37
|
|
| Expense Ratio, Percent |
[20] |
0.73%
|
|
| AssetsNet |
|
$ 223,748,141
|
|
| Holdings Count | Holding |
|
99
|
|
| Advisory Fees Paid, Amount |
|
$ 619,548
|
|
| InvestmentCompanyPortfolioTurnover |
|
12.00%
|
|
| Additional Fund Statistics [Text Block] |
|
Total Net Assets |
$223,748,141 |
# of Portfolio Holdings |
99 |
Portfolio Turnover Rate |
12% |
Total Management Fees Paid |
$619,548 | |
|
| Holdings [Text Block] |
|
Asset Allocation - % Investments
Value |
Value |
Common Stocks |
97.2 |
Investment Companies |
2.2 |
Foreign Common Stocks |
0.6 | The Fund may purchase and sell futures contracts to gain market exposure on cash balances. Sector Allocation - % Equities
Value |
Value |
Real Estate |
0.6 |
Energy |
1.5 |
Consumer Staples |
3.6 |
Materials |
3.6 |
Communication Services |
4.7 |
Consumer Discretionary |
5.2 |
Industrials |
12.2 |
Information Technology |
16.2 |
Health Care |
22.5 |
Financials |
29.9 | |
|
| Largest Holdings [Text Block] |
|
Top Ten Holdings - % Net Assets
RTX Corp. |
3.5 |
Cisco Systems, Inc. |
3.3 |
Synchrony Financial |
3.2 |
eBay, Inc. |
2.6 |
Salesforce, Inc. |
2.5 |
Capital One Financial Corp. |
2.5 |
Gilead Sciences, Inc. |
2.4 |
MetLife, Inc. |
2.2 |
Johnson & Johnson |
2.2 |
Cardinal Health, Inc. |
2.0 | Excludes cash equivalents. |
|
| Material Fund Change [Text Block] |
|
|
|
| C000110039 |
|
|
|
| Shareholder Report [Line Items] |
|
|
|
| Fund Name |
|
Man Large Cap Value Fund
|
|
| Class Name |
|
Y
|
|
| Trading Symbol |
|
BWLYX
|
|
| Annual or Semi-Annual Statement [Text Block] |
|
This semi-annual shareholder report contains important information about Man Large Cap Value Fund for the period of January 1, 2025 to June 30, 2025.
|
|
| Shareholder Report Annual or Semi-Annual |
|
Semi-Annual Shareholder Report
|
|
| Additional Information [Text Block] |
|
You can find additional information about the Fund at www.americanbeaconfunds.com/literature. You can also request this information by contacting us at 800-658-5811.
|
|
| Additional Information Phone Number |
|
800-658-5811
|
|
| Additional Information Website |
|
<span style="box-sizing: border-box; color: rgb(0, 0, 0); display: inline; flex-wrap: nowrap; font-size: 12px; font-weight: 400; grid-area: auto; line-height: 18px; margin: 0px; overflow: visible; text-align: left; text-align-last: auto; white-space-collapse: preserve-breaks;">www.americanbeaconfunds.com/literature</span>
|
|
| Expenses [Text Block] |
|
What were the Fund costs for the last six months?(based on a hypothetical $10,000 investment)
Class Name |
Costs of a $10,000 investment |
Costs paid as a percentage of a $10,000 investment |
Y |
$42 |
0.82%Footnote Reference* |
| Footnote |
Description |
Footnote* |
Annualized. | |
|
| Expenses Paid, Amount |
|
$ 42
|
|
| Expense Ratio, Percent |
[21] |
0.82%
|
|
| AssetsNet |
|
$ 223,748,141
|
|
| Holdings Count | Holding |
|
99
|
|
| Advisory Fees Paid, Amount |
|
$ 619,548
|
|
| InvestmentCompanyPortfolioTurnover |
|
12.00%
|
|
| Additional Fund Statistics [Text Block] |
|
Total Net Assets |
$223,748,141 |
# of Portfolio Holdings |
99 |
Portfolio Turnover Rate |
12% |
Total Management Fees Paid |
$619,548 | |
|
| Holdings [Text Block] |
|
Asset Allocation - % Investments
Value |
Value |
Common Stocks |
97.2 |
Investment Companies |
2.2 |
Foreign Common Stocks |
0.6 | The Fund may purchase and sell futures contracts to gain market exposure on cash balances. Sector Allocation - % Equities
Value |
Value |
Real Estate |
0.6 |
Energy |
1.5 |
Consumer Staples |
3.6 |
Materials |
3.6 |
Communication Services |
4.7 |
Consumer Discretionary |
5.2 |
Industrials |
12.2 |
Information Technology |
16.2 |
Health Care |
22.5 |
Financials |
29.9 | |
|
| Largest Holdings [Text Block] |
|
Top Ten Holdings - % Net Assets
RTX Corp. |
3.5 |
Cisco Systems, Inc. |
3.3 |
Synchrony Financial |
3.2 |
eBay, Inc. |
2.6 |
Salesforce, Inc. |
2.5 |
Capital One Financial Corp. |
2.5 |
Gilead Sciences, Inc. |
2.4 |
MetLife, Inc. |
2.2 |
Johnson & Johnson |
2.2 |
Cardinal Health, Inc. |
2.0 | Excludes cash equivalents. |
|
| Material Fund Change [Text Block] |
|
|
|
| C000144085 |
|
|
|
| Shareholder Report [Line Items] |
|
|
|
| Fund Name |
|
AHL Managed Futures Strategy Fund
|
|
| Class Name |
|
A
|
|
| Trading Symbol |
|
AHLAX
|
|
| Annual or Semi-Annual Statement [Text Block] |
|
This semi-annual shareholder report contains important information about American Beacon AHL Managed Futures Strategy Fund for the period of January 1, 2025 to June 30, 2025.
|
|
| Shareholder Report Annual or Semi-Annual |
|
Semi-Annual Shareholder Report
|
|
| Additional Information [Text Block] |
|
You can find additional information about the Fund at www.americanbeaconfunds.com/literature. You can also request this information by contacting us at 800-658-5811.
|
|
| Material Fund Change Notice [Text Block] |
|
This report describes material changes to the Fund that occurred during the reporting period.
|
|
| Additional Information Phone Number |
|
800-658-5811
|
|
| Additional Information Website |
|
<span style="box-sizing: border-box; color: rgb(0, 0, 0); display: inline; flex-wrap: nowrap; font-size: 13.3333px; font-weight: 400; grid-area: auto; line-height: 20px; margin: 0px; overflow: visible; text-align: left; text-align-last: auto; white-space-collapse: preserve-breaks;">www.americanbeaconfunds.com/literature</span>
|
|
| Expenses [Text Block] |
|
What were the Fund costs for the last six months?(based on a hypothetical $10,000 investment)
Class Name |
Costs of a $10,000 investment |
Costs paid as a percentage of a $10,000 investment |
Class A |
$97 |
2.05%Footnote Reference* |
| Footnote |
Description |
Footnote* |
Annualized. | |
|
| Expenses Paid, Amount |
|
$ 97
|
|
| Expense Ratio, Percent |
[22] |
2.05%
|
|
| Material Change Date |
|
|
Dec. 31, 2024
|
| AssetsNet |
|
$ 2,061,861,410
|
|
| Holdings Count | Holding |
|
12
|
|
| Advisory Fees Paid, Amount |
|
$ 17,890,192
|
|
| InvestmentCompanyPortfolioTurnover |
|
0.00%
|
|
| Additional Fund Statistics [Text Block] |
|
Total Net Assets |
$2,061,861,410 |
# of Portfolio Holdings |
12 |
Portfolio Turnover RateFootnote Reference* |
0% |
Total Management Fees Paid |
$17,890,192 |
| Footnote |
Description |
Footnote* |
Portfolio turnover is based on the lesser of long-term purchases or sales divided by the average long-term fair value during the period. The Fund did not invest in any long-term securities during the reporting period. | |
|
| Holdings [Text Block] |
|
Top Active Exposures by Asset Class % of VaR*
Commodities |
Header |
% of VaR |
Silver |
Long |
3.1 |
Gold |
Long |
2.9 |
Copper |
Long |
1.9 |
Crude Oil |
Long |
1.9 |
Wheat |
Short |
1.8 |
Currencies |
Header |
% of VaR |
Mexican Peso/US Dollar |
Long/Short |
3.4 |
South African Rand/US Dollar |
Long/Short |
2.4 |
Norwegian Krone/US Dollar |
Long/Short |
2.2 |
UK Sterling/US Dollar |
Long/Short |
2.0 |
Euro/US Dollar |
Long/Short |
1.7 |
Equities |
Header |
% of VaR |
FTSE 100 |
Long |
2.5 |
S&P TSX 60 Index |
Long |
2.2 |
Australian SPI 200 Index |
Long |
1.9 |
MSCI EAFE Index |
Long |
1.9 |
Hang Seng |
Long |
1.9 |
Fixed Income |
Header |
% of VaR |
Euribor |
Long |
3.3 |
Italian Bonds |
Long |
2.1 |
SONIA 3Mth Index |
Long |
1.9 |
SOFR 3Mth Index |
Long |
1.6 |
Australian Bonds |
Long |
1.4 | Asset Class Exposure % of VaR*
Value |
Value |
Currencies |
31.3 |
Stocks |
29.8 |
Commodities |
23.8 |
Bonds and Rates |
15.1 | *Value at Risk (“VaR”) is a measure of the potential loss in value of a portfolio over a defined period for a given confidence interval. A one-day VaR at the 95% confidence level represents that there is a 5% probability that the mark-to-market loss on the portfolio over a one day horizon will exceed this value (assuming normal markets and no trading in the portfolio). |
|
| Largest Holdings [Text Block] |
|
Top 10 Holdings % of VaR*
Mexican Peso/US Dollar |
Long/Short |
3.4 |
Euribor |
Long |
3.3 |
Silver |
Long |
3.1 |
Gold |
Long |
2.9 |
FTSE 100 |
Long |
2.5 |
South African Rand/US Dollar |
Long/Short |
2.4 |
S&P TSX 60 Index |
Long |
2.2 |
Norwegian Krone/US Dollar |
Long/Short |
2.2 |
Italian Bonds |
Long |
2.1 |
UK Sterling/US Dollar |
Long/Short |
2.0 | |
|
| Material Fund Change [Text Block] |
|
This is a summary of certain changes to the Fund since December 31, 2024. For more complete information, you may review the Fund's next prospectus, which we expect to be available by May 1, 2026 at www.americanbeaconfunds.com/literature or upon request at 800-658-5811. Effective August 25, 2025, American Beacon Advisors has agreed to enter into a contractual expense limitation agreement with the American Beacon AHL Managed Futures Strategy Fund. The contractual expense limitation for the A Class increased from 0.00% to 1.85% (excluding taxes, interest, brokerage commissions, acquired fund fees and expenses, securities lending fees, expenses related to securities sold short, litigation and other extraordinary expenses) with an expiration date of 4/30/2026. |
|
| Material Fund Change Expenses [Text Block] |
|
Effective August 25, 2025, American Beacon Advisors has agreed to enter into a contractual expense limitation agreement with the American Beacon AHL Managed Futures Strategy Fund. The contractual expense limitation for the A Class increased from 0.00% to 1.85% (excluding taxes, interest, brokerage commissions, acquired fund fees and expenses, securities lending fees, expenses related to securities sold short, litigation and other extraordinary expenses) with an expiration date of 4/30/2026.
|
|
| Summary of Change Legend [Text Block] |
|
This is a summary of certain changes to the Fund since December 31, 2024. For more complete information, you may review the Fund's next prospectus, which we expect to be available by May 1, 2026 at www.americanbeaconfunds.com/literature or upon request at 800-658-5811.
|
This is a summary of certain changes to the Fund since December 31, 2024.
|
| C000144086 |
|
|
|
| Shareholder Report [Line Items] |
|
|
|
| Fund Name |
|
AHL Managed Futures Strategy Fund
|
|
| Class Name |
|
C
|
|
| Trading Symbol |
|
AHLCX
|
|
| Annual or Semi-Annual Statement [Text Block] |
|
This semi-annual shareholder report contains important information about American Beacon AHL Managed Futures Strategy Fund for the period of January 1, 2025 to June 30, 2025.
|
|
| Shareholder Report Annual or Semi-Annual |
|
Semi-Annual Shareholder Report
|
|
| Additional Information [Text Block] |
|
You can find additional information about the Fund at www.americanbeaconfunds.com/literature. You can also request this information by contacting us at 800-658-5811.
|
|
| Material Fund Change Notice [Text Block] |
|
This report describes material changes to the Fund that occurred during the reporting period.
|
|
| Additional Information Phone Number |
|
800-658-5811
|
|
| Additional Information Website |
|
<span style="box-sizing: border-box; color: rgb(0, 0, 0); display: inline; flex-wrap: nowrap; font-size: 13.3333px; font-weight: 400; grid-area: auto; line-height: 20px; margin: 0px; overflow: visible; text-align: left; text-align-last: auto; white-space-collapse: preserve-breaks;">www.americanbeaconfunds.com/literature</span>
|
|
| Expenses [Text Block] |
|
What were the Fund costs for the last six months?(based on a hypothetical $10,000 investment)
Class Name |
Costs of a $10,000 investment |
Costs paid as a percentage of a $10,000 investment |
Class C |
$133 |
2.82%Footnote Reference* |
| Footnote |
Description |
Footnote* |
Annualized. | |
|
| Expenses Paid, Amount |
|
$ 133
|
|
| Expense Ratio, Percent |
[23] |
2.82%
|
|
| Material Change Date |
|
|
Dec. 31, 2024
|
| AssetsNet |
|
$ 2,061,861,410
|
|
| Holdings Count | Holding |
|
12
|
|
| Advisory Fees Paid, Amount |
|
$ 17,890,192
|
|
| InvestmentCompanyPortfolioTurnover |
|
0.00%
|
|
| Additional Fund Statistics [Text Block] |
|
Total Net Assets |
$2,061,861,410 |
# of Portfolio Holdings |
12 |
Portfolio Turnover RateFootnote Reference* |
0% |
Total Management Fees Paid |
$17,890,192 |
| Footnote |
Description |
Footnote* |
Portfolio turnover is based on the lesser of long-term purchases or sales divided by the average long-term fair value during the period. The Fund did not invest in any long-term securities during the reporting period. | |
|
| Holdings [Text Block] |
|
Top Active Exposures by Asset Class % of VaR*
Commodities |
Header |
% of VaR |
Silver |
Long |
3.1 |
Gold |
Long |
2.9 |
Copper |
Long |
1.9 |
Crude Oil |
Long |
1.9 |
Wheat |
Short |
1.8 |
Currencies |
Header |
% of VaR |
Mexican Peso/US Dollar |
Long/Short |
3.4 |
South African Rand/US Dollar |
Long/Short |
2.4 |
Norwegian Krone/US Dollar |
Long/Short |
2.2 |
UK Sterling/US Dollar |
Long/Short |
2.0 |
Euro/US Dollar |
Long/Short |
1.7 |
Equities |
Header |
% of VaR |
FTSE 100 |
Long |
2.5 |
S&P TSX 60 Index |
Long |
2.2 |
Australian SPI 200 Index |
Long |
1.9 |
MSCI EAFE Index |
Long |
1.9 |
Hang Seng |
Long |
1.9 |
Fixed Income |
Header |
% of VaR |
Euribor |
Long |
3.3 |
Italian Bonds |
Long |
2.1 |
SONIA 3Mth Index |
Long |
1.9 |
SOFR 3Mth Index |
Long |
1.6 |
Australian Bonds |
Long |
1.4 | Asset Class Exposure % of VaR*
Value |
Value |
Currencies |
31.3 |
Stocks |
29.8 |
Commodities |
23.8 |
Bonds and Rates |
15.1 | *Value at Risk (“VaR”) is a measure of the potential loss in value of a portfolio over a defined period for a given confidence interval. A one-day VaR at the 95% confidence level represents that there is a 5% probability that the mark-to-market loss on the portfolio over a one day horizon will exceed this value (assuming normal markets and no trading in the portfolio). |
|
| Largest Holdings [Text Block] |
|
Top 10 Holdings % of VaR*
Mexican Peso/US Dollar |
Long/Short |
3.4 |
Euribor |
Long |
3.3 |
Silver |
Long |
3.1 |
Gold |
Long |
2.9 |
FTSE 100 |
Long |
2.5 |
South African Rand/US Dollar |
Long/Short |
2.4 |
S&P TSX 60 Index |
Long |
2.2 |
Norwegian Krone/US Dollar |
Long/Short |
2.2 |
Italian Bonds |
Long |
2.1 |
UK Sterling/US Dollar |
Long/Short |
2.0 | |
|
| Material Fund Change [Text Block] |
|
This is a summary of certain changes to the Fund since December 31, 2024. For more complete information, you may review the Fund's next prospectus, which we expect to be available by May 1, 2026 at www.americanbeaconfunds.com/literature or upon request at 800-658-5811. Effective August 25, 2025, American Beacon Advisors has agreed to enter into a contractual expense limitation agreement with the American Beacon AHL Managed Futures Strategy Fund. The contractual expense limitation for the C Class increased from 0.00% to 2.62% (excluding taxes, interest, brokerage commissions, acquired fund fees and expenses, securities lending fees, expenses related to securities sold short, litigation and other extraordinary expenses) with an expiration date of 4/30/2026. |
|
| Material Fund Change Expenses [Text Block] |
|
Effective August 25, 2025, American Beacon Advisors has agreed to enter into a contractual expense limitation agreement with the American Beacon AHL Managed Futures Strategy Fund. The contractual expense limitation for the C Class increased from 0.00% to 2.62% (excluding taxes, interest, brokerage commissions, acquired fund fees and expenses, securities lending fees, expenses related to securities sold short, litigation and other extraordinary expenses) with an expiration date of 4/30/2026.
|
|
| Summary of Change Legend [Text Block] |
|
This is a summary of certain changes to the Fund since December 31, 2024. For more complete information, you may review the Fund's next prospectus, which we expect to be available by May 1, 2026 at www.americanbeaconfunds.com/literature or upon request at 800-658-5811.
|
This is a summary of certain changes to the Fund since December 31, 2024.
|
| C000144089 |
|
|
|
| Shareholder Report [Line Items] |
|
|
|
| Fund Name |
|
AHL Managed Futures Strategy Fund
|
|
| Class Name |
|
Investor
|
|
| Trading Symbol |
|
AHLPX
|
|
| Annual or Semi-Annual Statement [Text Block] |
|
This semi-annual shareholder report contains important information about American Beacon AHL Managed Futures Strategy Fund for the period of January 1, 2025 to June 30, 2025.
|
|
| Shareholder Report Annual or Semi-Annual |
|
Semi-Annual Shareholder Report
|
|
| Additional Information [Text Block] |
|
You can find additional information about the Fund at www.americanbeaconfunds.com/literature. You can also request this information by contacting us at 800-658-5811.
|
|
| Material Fund Change Notice [Text Block] |
|
This report describes material changes to the Fund that occurred during the reporting period.
|
|
| Additional Information Phone Number |
|
800-658-5811
|
|
| Additional Information Website |
|
<span style="box-sizing: border-box; color: rgb(0, 0, 0); display: inline; flex-wrap: nowrap; font-size: 13.3333px; font-weight: 400; grid-area: auto; line-height: 20px; margin: 0px; overflow: visible; text-align: left; text-align-last: auto; white-space-collapse: preserve-breaks;">www.americanbeaconfunds.com/literature</span>
|
|
| Expenses [Text Block] |
|
What were the Fund costs for the last six months?(based on a hypothetical $10,000 investment)
Class Name |
Costs of a $10,000 investment |
Costs paid as a percentage of a $10,000 investment |
Investor |
$101 |
2.14%Footnote Reference* |
| Footnote |
Description |
Footnote* |
Annualized. | |
|
| Expenses Paid, Amount |
|
$ 101
|
|
| Expense Ratio, Percent |
[24] |
2.14%
|
|
| Material Change Date |
|
|
Dec. 31, 2024
|
| AssetsNet |
|
$ 2,061,861,410
|
|
| Holdings Count | Holding |
|
12
|
|
| Advisory Fees Paid, Amount |
|
$ 17,890,192
|
|
| InvestmentCompanyPortfolioTurnover |
|
0.00%
|
|
| Additional Fund Statistics [Text Block] |
|
Total Net Assets |
$2,061,861,410 |
# of Portfolio Holdings |
12 |
Portfolio Turnover RateFootnote Reference* |
0% |
Total Management Fees Paid |
$17,890,192 |
| Footnote |
Description |
Footnote* |
Portfolio turnover is based on the lesser of long-term purchases or sales divided by the average long-term fair value during the period. The Fund did not invest in any long-term securities during the reporting period. | |
|
| Holdings [Text Block] |
|
Top Active Exposures by Asset Class % of VaR*
Commodities |
Header |
% of VaR |
Silver |
Long |
3.1 |
Gold |
Long |
2.9 |
Copper |
Long |
1.9 |
Crude Oil |
Long |
1.9 |
Wheat |
Short |
1.8 |
Currencies |
Header |
% of VaR |
Mexican Peso/US Dollar |
Long/Short |
3.4 |
South African Rand/US Dollar |
Long/Short |
2.4 |
Norwegian Krone/US Dollar |
Long/Short |
2.2 |
UK Sterling/US Dollar |
Long/Short |
2.0 |
Euro/US Dollar |
Long/Short |
1.7 |
Equities |
Header |
% of VaR |
FTSE 100 |
Long |
2.5 |
S&P TSX 60 Index |
Long |
2.2 |
Australian SPI 200 Index |
Long |
1.9 |
MSCI EAFE Index |
Long |
1.9 |
Hang Seng |
Long |
1.9 |
Fixed Income |
Header |
% of VaR |
Euribor |
Long |
3.3 |
Italian Bonds |
Long |
2.1 |
SONIA 3Mth Index |
Long |
1.9 |
SOFR 3Mth Index |
Long |
1.6 |
Australian Bonds |
Long |
1.4 | Asset Class Exposure % of VaR*
Value |
Value |
Currencies |
31.3 |
Stocks |
29.8 |
Commodities |
23.8 |
Bonds and Rates |
15.1 | *Value at Risk (“VaR”) is a measure of the potential loss in value of a portfolio over a defined period for a given confidence interval. A one-day VaR at the 95% confidence level represents that there is a 5% probability that the mark-to-market loss on the portfolio over a one day horizon will exceed this value (assuming normal markets and no trading in the portfolio). |
|
| Largest Holdings [Text Block] |
|
Top 10 Holdings % of VaR*
Mexican Peso/US Dollar |
Long/Short |
3.4 |
Euribor |
Long |
3.3 |
Silver |
Long |
3.1 |
Gold |
Long |
2.9 |
FTSE 100 |
Long |
2.5 |
South African Rand/US Dollar |
Long/Short |
2.4 |
S&P TSX 60 Index |
Long |
2.2 |
Norwegian Krone/US Dollar |
Long/Short |
2.2 |
Italian Bonds |
Long |
2.1 |
UK Sterling/US Dollar |
Long/Short |
2.0 | |
|
| Material Fund Change [Text Block] |
|
This is a summary of certain changes to the Fund since December 31, 2024. For more complete information, you may review the Fund's next prospectus, which we expect to be available by May 1, 2026 at www.americanbeaconfunds.com/literature or upon request at 800-658-5811. Effective August 25, 2025, American Beacon Advisors has agreed to enter into a contractual expense limitation agreement with the American Beacon AHL Managed Futures Strategy Fund. The contractual expense limitation for the Investor Class increased from 0.00% to 1.94% (excluding taxes, interest, brokerage commissions, acquired fund fees and expenses, securities lending fees, expenses related to securities sold short, litigation and other extraordinary expenses) with an expiration date of 4/30/2026. |
|
| Material Fund Change Expenses [Text Block] |
|
Effective August 25, 2025, American Beacon Advisors has agreed to enter into a contractual expense limitation agreement with the American Beacon AHL Managed Futures Strategy Fund. The contractual expense limitation for the Investor Class increased from 0.00% to 1.94% (excluding taxes, interest, brokerage commissions, acquired fund fees and expenses, securities lending fees, expenses related to securities sold short, litigation and other extraordinary expenses) with an expiration date of 4/30/2026.
|
|
| Summary of Change Legend [Text Block] |
|
This is a summary of certain changes to the Fund since December 31, 2024. For more complete information, you may review the Fund's next prospectus, which we expect to be available by May 1, 2026 at www.americanbeaconfunds.com/literature or upon request at 800-658-5811.
|
This is a summary of certain changes to the Fund since December 31, 2024.
|
| C000144088 |
|
|
|
| Shareholder Report [Line Items] |
|
|
|
| Fund Name |
|
AHL Managed Futures Strategy Fund
|
|
| Class Name |
|
R5
|
|
| Trading Symbol |
|
AHLIX
|
|
| Annual or Semi-Annual Statement [Text Block] |
|
This semi-annual shareholder report contains important information about American Beacon AHL Managed Futures Strategy Fund for the period of January 1, 2025 to June 30, 2025.
|
|
| Shareholder Report Annual or Semi-Annual |
|
Semi-Annual Shareholder Report
|
|
| Additional Information [Text Block] |
|
You can find additional information about the Fund at www.americanbeaconfunds.com/literature. You can also request this information by contacting us at 800-658-5811.
|
|
| Material Fund Change Notice [Text Block] |
|
This report describes material changes to the Fund that occurred during the reporting period.
|
|
| Additional Information Phone Number |
|
800-658-5811
|
|
| Additional Information Website |
|
<span style="box-sizing: border-box; color: rgb(0, 0, 0); display: inline; flex-wrap: nowrap; font-size: 13.3333px; font-weight: 400; grid-area: auto; line-height: 20px; margin: 0px; overflow: visible; text-align: left; text-align-last: auto; white-space-collapse: preserve-breaks;">www.americanbeaconfunds.com/literature</span>
|
|
| Expenses [Text Block] |
|
What were the Fund costs for the last six months?(based on a hypothetical $10,000 investment)
Class Name |
Costs of a $10,000 investment |
Costs paid as a percentage of a $10,000 investment |
R5 |
$82 |
1.73%Footnote Reference* |
| Footnote |
Description |
Footnote* |
Annualized. | |
|
| Expenses Paid, Amount |
|
$ 82
|
|
| Expense Ratio, Percent |
[25] |
1.73%
|
|
| Material Change Date |
|
|
Dec. 31, 2024
|
| AssetsNet |
|
$ 2,061,861,410
|
|
| Holdings Count | Holding |
|
12
|
|
| Advisory Fees Paid, Amount |
|
$ 17,890,192
|
|
| InvestmentCompanyPortfolioTurnover |
|
0.00%
|
|
| Additional Fund Statistics [Text Block] |
|
Total Net Assets |
$2,061,861,410 |
# of Portfolio Holdings |
12 |
Portfolio Turnover RateFootnote Reference* |
0% |
Total Management Fees Paid |
$17,890,192 |
| Footnote |
Description |
Footnote* |
Portfolio turnover is based on the lesser of long-term purchases or sales divided by the average long-term fair value during the period. The Fund did not invest in any long-term securities during the reporting period. | |
|
| Holdings [Text Block] |
|
Top Active Exposures by Asset Class % of VaR*
Commodities |
Header |
% of VaR |
Silver |
Long |
3.1 |
Gold |
Long |
2.9 |
Copper |
Long |
1.9 |
Crude Oil |
Long |
1.9 |
Wheat |
Short |
1.8 |
Currencies |
Header |
% of VaR |
Mexican Peso/US Dollar |
Long/Short |
3.4 |
South African Rand/US Dollar |
Long/Short |
2.4 |
Norwegian Krone/US Dollar |
Long/Short |
2.2 |
UK Sterling/US Dollar |
Long/Short |
2.0 |
Euro/US Dollar |
Long/Short |
1.7 |
Equities |
Header |
% of VaR |
FTSE 100 |
Long |
2.5 |
S&P TSX 60 Index |
Long |
2.2 |
Australian SPI 200 Index |
Long |
1.9 |
MSCI EAFE Index |
Long |
1.9 |
Hang Seng |
Long |
1.9 |
Fixed Income |
Header |
% of VaR |
Euribor |
Long |
3.3 |
Italian Bonds |
Long |
2.1 |
SONIA 3Mth Index |
Long |
1.9 |
SOFR 3Mth Index |
Long |
1.6 |
Australian Bonds |
Long |
1.4 | Asset Class Exposure % of VaR*
Value |
Value |
Currencies |
31.3 |
Stocks |
29.8 |
Commodities |
23.8 |
Bonds and Rates |
15.1 | *Value at Risk (“VaR”) is a measure of the potential loss in value of a portfolio over a defined period for a given confidence interval. A one-day VaR at the 95% confidence level represents that there is a 5% probability that the mark-to-market loss on the portfolio over a one day horizon will exceed this value (assuming normal markets and no trading in the portfolio). |
|
| Largest Holdings [Text Block] |
|
Top 10 Holdings % of VaR*
Mexican Peso/US Dollar |
Long/Short |
3.4 |
Euribor |
Long |
3.3 |
Silver |
Long |
3.1 |
Gold |
Long |
2.9 |
FTSE 100 |
Long |
2.5 |
South African Rand/US Dollar |
Long/Short |
2.4 |
S&P TSX 60 Index |
Long |
2.2 |
Norwegian Krone/US Dollar |
Long/Short |
2.2 |
Italian Bonds |
Long |
2.1 |
UK Sterling/US Dollar |
Long/Short |
2.0 | |
|
| Material Fund Change [Text Block] |
|
This is a summary of certain changes to the Fund since December 31, 2024. For more complete information, you may review the Fund's next prospectus, which we expect to be available by May 1, 2026 at www.americanbeaconfunds.com/literature or upon request at 800-658-5811. Effective August 25, 2025, American Beacon Advisors has agreed to enter into a contractual expense limitation agreement with the American Beacon AHL Managed Futures Strategy Fund. The contractual expense limitation for the R5 Class increased from 0.00% to 1.53% (excluding taxes, interest, brokerage commissions, acquired fund fees and expenses, securities lending fees, expenses related to securities sold short, litigation and other extraordinary expenses) with an expiration date of 4/30/2026. |
|
| Material Fund Change Expenses [Text Block] |
|
Effective August 25, 2025, American Beacon Advisors has agreed to enter into a contractual expense limitation agreement with the American Beacon AHL Managed Futures Strategy Fund. The contractual expense limitation for the R5 Class increased from 0.00% to 1.53% (excluding taxes, interest, brokerage commissions, acquired fund fees and expenses, securities lending fees, expenses related to securities sold short, litigation and other extraordinary expenses) with an expiration date of 4/30/2026.
|
|
| Summary of Change Legend [Text Block] |
|
This is a summary of certain changes to the Fund since December 31, 2024. For more complete information, you may review the Fund's next prospectus, which we expect to be available by May 1, 2026 at www.americanbeaconfunds.com/literature or upon request at 800-658-5811.
|
This is a summary of certain changes to the Fund since December 31, 2024.
|
| C000144087 |
|
|
|
| Shareholder Report [Line Items] |
|
|
|
| Fund Name |
|
AHL Managed Futures Strategy Fund
|
|
| Class Name |
|
Y
|
|
| Trading Symbol |
|
AHLYX
|
|
| Annual or Semi-Annual Statement [Text Block] |
|
This semi-annual shareholder report contains important information about American Beacon AHL Managed Futures Strategy Fund for the period of January 1, 2025 to June 30, 2025.
|
|
| Shareholder Report Annual or Semi-Annual |
|
Semi-Annual Shareholder Report
|
|
| Additional Information [Text Block] |
|
You can find additional information about the Fund at www.americanbeaconfunds.com/literature. You can also request this information by contacting us at 800-658-5811.
|
|
| Material Fund Change Notice [Text Block] |
|
This report describes material changes to the Fund that occurred during the reporting period.
|
|
| Additional Information Phone Number |
|
800-658-5811
|
|
| Additional Information Website |
|
<span style="box-sizing: border-box; color: rgb(0, 0, 0); display: inline; flex-wrap: nowrap; font-size: 13.3333px; font-weight: 400; grid-area: auto; line-height: 20px; margin: 0px; overflow: visible; text-align: left; text-align-last: auto; white-space-collapse: preserve-breaks;">www.americanbeaconfunds.com/literature</span>
|
|
| Expenses [Text Block] |
|
What were the Fund costs for the last six months?(based on a hypothetical $10,000 investment)
Class Name |
Costs of a $10,000 investment |
Costs paid as a percentage of a $10,000 investment |
Y |
$87 |
1.85%Footnote Reference* |
| Footnote |
Description |
Footnote* |
Annualized. | |
|
| Expenses Paid, Amount |
|
$ 87
|
|
| Expense Ratio, Percent |
[26] |
1.85%
|
|
| Material Change Date |
|
|
Dec. 31, 2024
|
| AssetsNet |
|
$ 2,061,861,410
|
|
| Holdings Count | Holding |
|
12
|
|
| Advisory Fees Paid, Amount |
|
$ 17,890,192
|
|
| InvestmentCompanyPortfolioTurnover |
|
0.00%
|
|
| Additional Fund Statistics [Text Block] |
|
Total Net Assets |
$2,061,861,410 |
# of Portfolio Holdings |
12 |
Portfolio Turnover RateFootnote Reference* |
0% |
Total Management Fees Paid |
$17,890,192 |
| Footnote |
Description |
Footnote* |
Portfolio turnover is based on the lesser of long-term purchases or sales divided by the average long-term fair value during the period. The Fund did not invest in any long-term securities during the reporting period. | |
|
| Holdings [Text Block] |
|
Top Active Exposures by Asset Class % of VaR*
Commodities |
Header |
% of VaR |
Silver |
Long |
3.1 |
Gold |
Long |
2.9 |
Copper |
Long |
1.9 |
Crude Oil |
Long |
1.9 |
Wheat |
Short |
1.8 |
Currencies |
Header |
% of VaR |
Mexican Peso/US Dollar |
Long/Short |
3.4 |
South African Rand/US Dollar |
Long/Short |
2.4 |
Norwegian Krone/US Dollar |
Long/Short |
2.2 |
UK Sterling/US Dollar |
Long/Short |
2.0 |
Euro/US Dollar |
Long/Short |
1.7 |
Equities |
Header |
% of VaR |
FTSE 100 |
Long |
2.5 |
S&P TSX 60 Index |
Long |
2.2 |
Australian SPI 200 Index |
Long |
1.9 |
MSCI EAFE Index |
Long |
1.9 |
Hang Seng |
Long |
1.9 |
Fixed Income |
Header |
% of VaR |
Euribor |
Long |
3.3 |
Italian Bonds |
Long |
2.1 |
SONIA 3Mth Index |
Long |
1.9 |
SOFR 3Mth Index |
Long |
1.6 |
Australian Bonds |
Long |
1.4 | Asset Class Exposure % of VaR*
Value |
Value |
Currencies |
31.3 |
Stocks |
29.8 |
Commodities |
23.8 |
Bonds and Rates |
15.1 | *Value at Risk (“VaR”) is a measure of the potential loss in value of a portfolio over a defined period for a given confidence interval. A one-day VaR at the 95% confidence level represents that there is a 5% probability that the mark-to-market loss on the portfolio over a one day horizon will exceed this value (assuming normal markets and no trading in the portfolio). |
|
| Largest Holdings [Text Block] |
|
Top 10 Holdings % of VaR*
Mexican Peso/US Dollar |
Long/Short |
3.4 |
Euribor |
Long |
3.3 |
Silver |
Long |
3.1 |
Gold |
Long |
2.9 |
FTSE 100 |
Long |
2.5 |
South African Rand/US Dollar |
Long/Short |
2.4 |
S&P TSX 60 Index |
Long |
2.2 |
Norwegian Krone/US Dollar |
Long/Short |
2.2 |
Italian Bonds |
Long |
2.1 |
UK Sterling/US Dollar |
Long/Short |
2.0 | |
|
| Material Fund Change [Text Block] |
|
This is a summary of certain changes to the Fund since December 31, 2024. For more complete information, you may review the Fund's next prospectus, which we expect to be available by May 1, 2026 at www.americanbeaconfunds.com/literature or upon request at 800-658-5811. Effective August 25, 2025, American Beacon Advisors has agreed to enter into a contractual expense limitation agreement with the American Beacon AHL Managed Futures Strategy Fund. The contractual expense limitation for the Y Class increased from 0.00% to 1.65% (excluding taxes, interest, brokerage commissions, acquired fund fees and expenses, securities lending fees, expenses related to securities sold short, litigation and other extraordinary expenses) with an expiration date of 4/30/2026. |
|
| Material Fund Change Expenses [Text Block] |
|
Effective August 25, 2025, American Beacon Advisors has agreed to enter into a contractual expense limitation agreement with the American Beacon AHL Managed Futures Strategy Fund. The contractual expense limitation for the Y Class increased from 0.00% to 1.65% (excluding taxes, interest, brokerage commissions, acquired fund fees and expenses, securities lending fees, expenses related to securities sold short, litigation and other extraordinary expenses) with an expiration date of 4/30/2026.
|
|
| Summary of Change Legend [Text Block] |
|
This is a summary of certain changes to the Fund since December 31, 2024. For more complete information, you may review the Fund's next prospectus, which we expect to be available by May 1, 2026 at www.americanbeaconfunds.com/literature or upon request at 800-658-5811.
|
This is a summary of certain changes to the Fund since December 31, 2024.
|
| C000110032 |
|
|
|
| Shareholder Report [Line Items] |
|
|
|
| Fund Name |
|
Stephens Mid-Cap Growth Fund
|
|
| Class Name |
|
A
|
|
| Trading Symbol |
|
SMFAX
|
|
| Annual or Semi-Annual Statement [Text Block] |
|
This semi-annual shareholder report contains important information about American Beacon Stephens Mid-Cap Growth Fund for the period of January 1, 2025 to June 30, 2025.
|
|
| Shareholder Report Annual or Semi-Annual |
|
Semi-Annual Shareholder Report
|
|
| Additional Information [Text Block] |
|
You can find additional information about the Fund at www.americanbeaconfunds.com/literature. You can also request this information by contacting us at 800-658-5811.
|
|
| Additional Information Phone Number |
|
800-658-5811
|
|
| Additional Information Website |
|
<span style="box-sizing: border-box; color: rgb(0, 0, 0); display: inline; flex-wrap: nowrap; font-size: 12px; font-weight: 400; grid-area: auto; line-height: 18px; margin: 0px; overflow: visible; text-align: left; text-align-last: auto; white-space-collapse: preserve-breaks;">www.americanbeaconfunds.com/literature</span>
|
|
| Expenses [Text Block] |
|
What were the Fund costs for the last six months?(based on a hypothetical $10,000 investment)
Class Name |
Costs of a $10,000 investment |
Costs paid as a percentage of a $10,000 investment |
Class A |
$63 |
1.21%Footnote Reference* |
| Footnote |
Description |
Footnote* |
Annualized. | |
|
| Expenses Paid, Amount |
|
$ 63
|
|
| Expense Ratio, Percent |
[27] |
1.21%
|
|
| AssetsNet |
|
$ 664,331,861
|
|
| Holdings Count | Holding |
|
93
|
|
| Advisory Fees Paid, Amount |
|
$ 2,975,675
|
|
| InvestmentCompanyPortfolioTurnover |
|
27.00%
|
|
| Additional Fund Statistics [Text Block] |
|
Total Net Assets |
$664,331,861 |
# of Portfolio Holdings |
93 |
Portfolio Turnover Rate |
27% |
Total Management Fees Paid |
$2,975,675 | |
|
| Holdings [Text Block] |
|
Asset Allocation - % Investments
Value |
Value |
Common Stocks |
97.8 |
Foreign Common Stocks |
1.4 |
Investment Companies |
0.8 | Sector Allocation - % Equities
Value |
Value |
Real Estate |
1.2 |
Utilities |
1.3 |
Energy |
5.4 |
Communication Services |
8.3 |
Financials |
11.0 |
Consumer Discretionary |
11.1 |
Health Care |
14.6 |
Industrials |
21.2 |
Information Technology |
25.9 | |
|
| Largest Holdings [Text Block] |
|
Top Ten Holdings - % Net Assets
Axon Enterprise, Inc. |
2.6 |
AeroVironment, Inc. |
2.5 |
Spotify Technology SA |
2.1 |
Robinhood Markets, Inc., Class A |
2.0 |
Guidewire Software, Inc. |
2.0 |
Tradeweb Markets, Inc., Class A |
1.8 |
Live Nation Entertainment, Inc. |
1.8 |
Wingstop, Inc. |
1.8 |
Take-Two Interactive Software, Inc. |
1.8 |
Verisk Analytics, Inc. |
1.7 | Excludes cash equivalents. |
|
| Material Fund Change [Text Block] |
|
|
|
| C000110033 |
|
|
|
| Shareholder Report [Line Items] |
|
|
|
| Fund Name |
|
Stephens Mid-Cap Growth Fund
|
|
| Class Name |
|
C
|
|
| Trading Symbol |
|
SMFCX
|
|
| Annual or Semi-Annual Statement [Text Block] |
|
This semi-annual shareholder report contains important information about American Beacon Stephens Mid-Cap Growth Fund for the period of January 1, 2025 to June 30, 2025.
|
|
| Shareholder Report Annual or Semi-Annual |
|
Semi-Annual Shareholder Report
|
|
| Additional Information [Text Block] |
|
You can find additional information about the Fund at www.americanbeaconfunds.com/literature. You can also request this information by contacting us at 800-658-5811.
|
|
| Additional Information Phone Number |
|
800-658-5811
|
|
| Additional Information Website |
|
<span style="box-sizing: border-box; color: rgb(0, 0, 0); display: inline; flex-wrap: nowrap; font-size: 12px; font-weight: 400; grid-area: auto; line-height: 18px; margin: 0px; overflow: visible; text-align: left; text-align-last: auto; white-space-collapse: preserve-breaks;">www.americanbeaconfunds.com/literature</span>
|
|
| Expenses [Text Block] |
|
What were the Fund costs for the last six months?(based on a hypothetical $10,000 investment)
Class Name |
Costs of a $10,000 investment |
Costs paid as a percentage of a $10,000 investment |
Class C |
$101 |
1.95%Footnote Reference* |
| Footnote |
Description |
Footnote* |
Annualized. | |
|
| Expenses Paid, Amount |
|
$ 101
|
|
| Expense Ratio, Percent |
[28] |
1.95%
|
|
| AssetsNet |
|
$ 664,331,861
|
|
| Holdings Count | Holding |
|
93
|
|
| Advisory Fees Paid, Amount |
|
$ 2,975,675
|
|
| InvestmentCompanyPortfolioTurnover |
|
27.00%
|
|
| Additional Fund Statistics [Text Block] |
|
Total Net Assets |
$664,331,861 |
# of Portfolio Holdings |
93 |
Portfolio Turnover Rate |
27% |
Total Management Fees Paid |
$2,975,675 | |
|
| Holdings [Text Block] |
|
Asset Allocation - % Investments
Value |
Value |
Common Stocks |
97.8 |
Foreign Common Stocks |
1.4 |
Investment Companies |
0.8 | Sector Allocation - % Equities
Value |
Value |
Real Estate |
1.2 |
Utilities |
1.3 |
Energy |
5.4 |
Communication Services |
8.3 |
Financials |
11.0 |
Consumer Discretionary |
11.1 |
Health Care |
14.6 |
Industrials |
21.2 |
Information Technology |
25.9 | |
|
| Largest Holdings [Text Block] |
|
Top Ten Holdings - % Net Assets
Axon Enterprise, Inc. |
2.6 |
AeroVironment, Inc. |
2.5 |
Spotify Technology SA |
2.1 |
Robinhood Markets, Inc., Class A |
2.0 |
Guidewire Software, Inc. |
2.0 |
Tradeweb Markets, Inc., Class A |
1.8 |
Live Nation Entertainment, Inc. |
1.8 |
Wingstop, Inc. |
1.8 |
Take-Two Interactive Software, Inc. |
1.8 |
Verisk Analytics, Inc. |
1.7 | Excludes cash equivalents. |
|
| Material Fund Change [Text Block] |
|
|
|
| C000110031 |
|
|
|
| Shareholder Report [Line Items] |
|
|
|
| Fund Name |
|
Stephens Mid-Cap Growth Fund
|
|
| Class Name |
|
Investor
|
|
| Trading Symbol |
|
STMGX
|
|
| Annual or Semi-Annual Statement [Text Block] |
|
This semi-annual shareholder report contains important information about American Beacon Stephens Mid-Cap Growth Fund for the period of January 1, 2025 to June 30, 2025.
|
|
| Shareholder Report Annual or Semi-Annual |
|
Semi-Annual Shareholder Report
|
|
| Additional Information [Text Block] |
|
You can find additional information about the Fund at www.americanbeaconfunds.com/literature. You can also request this information by contacting us at 800-658-5811.
|
|
| Additional Information Phone Number |
|
800-658-5811
|
|
| Additional Information Website |
|
<span style="box-sizing: border-box; color: rgb(0, 0, 0); display: inline; flex-wrap: nowrap; font-size: 12px; font-weight: 400; grid-area: auto; line-height: 18px; margin: 0px; overflow: visible; text-align: left; text-align-last: auto; white-space-collapse: preserve-breaks;">www.americanbeaconfunds.com/literature</span>
|
|
| Expenses [Text Block] |
|
What were the Fund costs for the last six months?(based on a hypothetical $10,000 investment)
Class Name |
Costs of a $10,000 investment |
Costs paid as a percentage of a $10,000 investment |
Investor |
$60 |
1.16%Footnote Reference* |
| Footnote |
Description |
Footnote* |
Annualized. | |
|
| Expenses Paid, Amount |
|
$ 60
|
|
| Expense Ratio, Percent |
[29] |
1.16%
|
|
| AssetsNet |
|
$ 664,331,861
|
|
| Holdings Count | Holding |
|
93
|
|
| Advisory Fees Paid, Amount |
|
$ 2,975,675
|
|
| InvestmentCompanyPortfolioTurnover |
|
27.00%
|
|
| Additional Fund Statistics [Text Block] |
|
Total Net Assets |
$664,331,861 |
# of Portfolio Holdings |
93 |
Portfolio Turnover Rate |
27% |
Total Management Fees Paid |
$2,975,675 | |
|
| Holdings [Text Block] |
|
Asset Allocation - % Investments
Value |
Value |
Common Stocks |
97.8 |
Foreign Common Stocks |
1.4 |
Investment Companies |
0.8 | Sector Allocation - % Equities
Value |
Value |
Real Estate |
1.2 |
Utilities |
1.3 |
Energy |
5.4 |
Communication Services |
8.3 |
Financials |
11.0 |
Consumer Discretionary |
11.1 |
Health Care |
14.6 |
Industrials |
21.2 |
Information Technology |
25.9 | |
|
| Largest Holdings [Text Block] |
|
Top Ten Holdings - % Net Assets
Axon Enterprise, Inc. |
2.6 |
AeroVironment, Inc. |
2.5 |
Spotify Technology SA |
2.1 |
Robinhood Markets, Inc., Class A |
2.0 |
Guidewire Software, Inc. |
2.0 |
Tradeweb Markets, Inc., Class A |
1.8 |
Live Nation Entertainment, Inc. |
1.8 |
Wingstop, Inc. |
1.8 |
Take-Two Interactive Software, Inc. |
1.8 |
Verisk Analytics, Inc. |
1.7 | Excludes cash equivalents. |
|
| Material Fund Change [Text Block] |
|
|
|
| C000110034 |
|
|
|
| Shareholder Report [Line Items] |
|
|
|
| Fund Name |
|
Stephens Mid-Cap Growth Fund
|
|
| Class Name |
|
R5
|
|
| Trading Symbol |
|
SFMIX
|
|
| Annual or Semi-Annual Statement [Text Block] |
|
This semi-annual shareholder report contains important information about American Beacon Stephens Mid-Cap Growth Fund for the period of January 1, 2025 to June 30, 2025.
|
|
| Shareholder Report Annual or Semi-Annual |
|
Semi-Annual Shareholder Report
|
|
| Additional Information [Text Block] |
|
You can find additional information about the Fund at www.americanbeaconfunds.com/literature. You can also request this information by contacting us at 800-658-5811.
|
|
| Additional Information Phone Number |
|
800-658-5811
|
|
| Additional Information Website |
|
<span style="box-sizing: border-box; color: rgb(0, 0, 0); display: inline; flex-wrap: nowrap; font-size: 12px; font-weight: 400; grid-area: auto; line-height: 18px; margin: 0px; overflow: visible; text-align: left; text-align-last: auto; white-space-collapse: preserve-breaks;">www.americanbeaconfunds.com/literature</span>
|
|
| Expenses [Text Block] |
|
What were the Fund costs for the last six months?(based on a hypothetical $10,000 investment)
Class Name |
Costs of a $10,000 investment |
Costs paid as a percentage of a $10,000 investment |
R5 |
$47 |
0.90%Footnote Reference* |
| Footnote |
Description |
Footnote* |
Annualized. | |
|
| Expenses Paid, Amount |
|
$ 47
|
|
| Expense Ratio, Percent |
[30] |
0.90%
|
|
| AssetsNet |
|
$ 664,331,861
|
|
| Holdings Count | Holding |
|
93
|
|
| Advisory Fees Paid, Amount |
|
$ 2,975,675
|
|
| InvestmentCompanyPortfolioTurnover |
|
27.00%
|
|
| Additional Fund Statistics [Text Block] |
|
Total Net Assets |
$664,331,861 |
# of Portfolio Holdings |
93 |
Portfolio Turnover Rate |
27% |
Total Management Fees Paid |
$2,975,675 | |
|
| Holdings [Text Block] |
|
Asset Allocation - % Investments
Value |
Value |
Common Stocks |
97.8 |
Foreign Common Stocks |
1.4 |
Investment Companies |
0.8 | Sector Allocation - % Equities
Value |
Value |
Real Estate |
1.2 |
Utilities |
1.3 |
Energy |
5.4 |
Communication Services |
8.3 |
Financials |
11.0 |
Consumer Discretionary |
11.1 |
Health Care |
14.6 |
Industrials |
21.2 |
Information Technology |
25.9 | |
|
| Largest Holdings [Text Block] |
|
Top Ten Holdings - % Net Assets
Axon Enterprise, Inc. |
2.6 |
AeroVironment, Inc. |
2.5 |
Spotify Technology SA |
2.1 |
Robinhood Markets, Inc., Class A |
2.0 |
Guidewire Software, Inc. |
2.0 |
Tradeweb Markets, Inc., Class A |
1.8 |
Live Nation Entertainment, Inc. |
1.8 |
Wingstop, Inc. |
1.8 |
Take-Two Interactive Software, Inc. |
1.8 |
Verisk Analytics, Inc. |
1.7 | Excludes cash equivalents. |
|
| Material Fund Change [Text Block] |
|
|
|
| C000210485 |
|
|
|
| Shareholder Report [Line Items] |
|
|
|
| Fund Name |
|
Stephens Mid-Cap Growth Fund
|
|
| Class Name |
|
R6
|
|
| Trading Symbol |
|
SFMRX
|
|
| Annual or Semi-Annual Statement [Text Block] |
|
This semi-annual shareholder report contains important information about American Beacon Stephens Mid-Cap Growth Fund for the period of January 1, 2025 to June 30, 2025.
|
|
| Shareholder Report Annual or Semi-Annual |
|
Semi-Annual Shareholder Report
|
|
| Additional Information [Text Block] |
|
You can find additional information about the Fund at www.americanbeaconfunds.com/literature. You can also request this information by contacting us at 800-658-5811.
|
|
| Additional Information Phone Number |
|
800-658-5811
|
|
| Additional Information Website |
|
<span style="box-sizing: border-box; color: rgb(0, 0, 0); display: inline; flex-wrap: nowrap; font-size: 12px; font-weight: 400; grid-area: auto; line-height: 18px; margin: 0px; overflow: visible; text-align: left; text-align-last: auto; white-space-collapse: preserve-breaks;">www.americanbeaconfunds.com/literature</span>
|
|
| Expenses [Text Block] |
|
What were the Fund costs for the last six months?(based on a hypothetical $10,000 investment)
Class Name |
Costs of a $10,000 investment |
Costs paid as a percentage of a $10,000 investment |
R6 |
$46 |
0.89%Footnote Reference* |
| Footnote |
Description |
Footnote* |
Annualized. | |
|
| Expenses Paid, Amount |
|
$ 46
|
|
| Expense Ratio, Percent |
[31] |
0.89%
|
|
| AssetsNet |
|
$ 664,331,861
|
|
| Holdings Count | Holding |
|
93
|
|
| Advisory Fees Paid, Amount |
|
$ 2,975,675
|
|
| InvestmentCompanyPortfolioTurnover |
|
27.00%
|
|
| Additional Fund Statistics [Text Block] |
|
Total Net Assets |
$664,331,861 |
# of Portfolio Holdings |
93 |
Portfolio Turnover Rate |
27% |
Total Management Fees Paid |
$2,975,675 | |
|
| Holdings [Text Block] |
|
Asset Allocation - % Investments
Value |
Value |
Common Stocks |
97.8 |
Foreign Common Stocks |
1.4 |
Investment Companies |
0.8 | Sector Allocation - % Equities
Value |
Value |
Real Estate |
1.2 |
Utilities |
1.3 |
Energy |
5.4 |
Communication Services |
8.3 |
Financials |
11.0 |
Consumer Discretionary |
11.1 |
Health Care |
14.6 |
Industrials |
21.2 |
Information Technology |
25.9 | |
|
| Largest Holdings [Text Block] |
|
Top Ten Holdings - % Net Assets
Axon Enterprise, Inc. |
2.6 |
AeroVironment, Inc. |
2.5 |
Spotify Technology SA |
2.1 |
Robinhood Markets, Inc., Class A |
2.0 |
Guidewire Software, Inc. |
2.0 |
Tradeweb Markets, Inc., Class A |
1.8 |
Live Nation Entertainment, Inc. |
1.8 |
Wingstop, Inc. |
1.8 |
Take-Two Interactive Software, Inc. |
1.8 |
Verisk Analytics, Inc. |
1.7 | Excludes cash equivalents. |
|
| Material Fund Change [Text Block] |
|
|
|
| C000110035 |
|
|
|
| Shareholder Report [Line Items] |
|
|
|
| Fund Name |
|
Stephens Mid-Cap Growth Fund
|
|
| Class Name |
|
Y
|
|
| Trading Symbol |
|
SMFYX
|
|
| Annual or Semi-Annual Statement [Text Block] |
|
This semi-annual shareholder report contains important information about American Beacon Stephens Mid-Cap Growth Fund for the period of January 1, 2025 to June 30, 2025.
|
|
| Shareholder Report Annual or Semi-Annual |
|
Semi-Annual Shareholder Report
|
|
| Additional Information [Text Block] |
|
You can find additional information about the Fund at www.americanbeaconfunds.com/literature. You can also request this information by contacting us at 800-658-5811.
|
|
| Additional Information Phone Number |
|
800-658-5811
|
|
| Additional Information Website |
|
<span style="box-sizing: border-box; color: rgb(0, 0, 0); display: inline; flex-wrap: nowrap; font-size: 12px; font-weight: 400; grid-area: auto; line-height: 18px; margin: 0px; overflow: visible; text-align: left; text-align-last: auto; white-space-collapse: preserve-breaks;">www.americanbeaconfunds.com/literature</span>
|
|
| Expenses [Text Block] |
|
What were the Fund costs for the last six months?(based on a hypothetical $10,000 investment)
Class Name |
Costs of a $10,000 investment |
Costs paid as a percentage of a $10,000 investment |
Y |
$50 |
0.96%Footnote Reference* |
| Footnote |
Description |
Footnote* |
Annualized. | |
|
| Expenses Paid, Amount |
|
$ 50
|
|
| Expense Ratio, Percent |
[32] |
0.96%
|
|
| AssetsNet |
|
$ 664,331,861
|
|
| Holdings Count | Holding |
|
93
|
|
| Advisory Fees Paid, Amount |
|
$ 2,975,675
|
|
| InvestmentCompanyPortfolioTurnover |
|
27.00%
|
|
| Additional Fund Statistics [Text Block] |
|
Total Net Assets |
$664,331,861 |
# of Portfolio Holdings |
93 |
Portfolio Turnover Rate |
27% |
Total Management Fees Paid |
$2,975,675 | |
|
| Holdings [Text Block] |
|
Asset Allocation - % Investments
Value |
Value |
Common Stocks |
97.8 |
Foreign Common Stocks |
1.4 |
Investment Companies |
0.8 | Sector Allocation - % Equities
Value |
Value |
Real Estate |
1.2 |
Utilities |
1.3 |
Energy |
5.4 |
Communication Services |
8.3 |
Financials |
11.0 |
Consumer Discretionary |
11.1 |
Health Care |
14.6 |
Industrials |
21.2 |
Information Technology |
25.9 | |
|
| Largest Holdings [Text Block] |
|
Top Ten Holdings - % Net Assets
Axon Enterprise, Inc. |
2.6 |
AeroVironment, Inc. |
2.5 |
Spotify Technology SA |
2.1 |
Robinhood Markets, Inc., Class A |
2.0 |
Guidewire Software, Inc. |
2.0 |
Tradeweb Markets, Inc., Class A |
1.8 |
Live Nation Entertainment, Inc. |
1.8 |
Wingstop, Inc. |
1.8 |
Take-Two Interactive Software, Inc. |
1.8 |
Verisk Analytics, Inc. |
1.7 | Excludes cash equivalents. |
|
| Material Fund Change [Text Block] |
|
|
|
| C000110026 |
|
|
|
| Shareholder Report [Line Items] |
|
|
|
| Fund Name |
|
Stephens Small Cap Growth Fund
|
|
| Class Name |
|
A
|
|
| Trading Symbol |
|
SPWAX
|
|
| Annual or Semi-Annual Statement [Text Block] |
|
This semi-annual shareholder report contains important information about American Beacon Stephens Small Cap Growth Fund for the period of January 1, 2025 to June 30, 2025.
|
|
| Shareholder Report Annual or Semi-Annual |
|
Semi-Annual Shareholder Report
|
|
| Additional Information [Text Block] |
|
You can find additional information about the Fund at www.americanbeaconfunds.com/literature. You can also request this information by contacting us at 800-658-5811.
|
|
| Additional Information Phone Number |
|
800-658-5811
|
|
| Additional Information Website |
|
<span style="box-sizing: border-box; color: rgb(0, 0, 0); display: inline; flex-wrap: nowrap; font-size: 12px; font-weight: 400; grid-area: auto; line-height: 18px; margin: 0px; overflow: visible; text-align: left; text-align-last: auto; white-space-collapse: preserve-breaks;">www.americanbeaconfunds.com/literature</span>
|
|
| Expenses [Text Block] |
|
What were the Fund costs for the last six months?(based on a hypothetical $10,000 investment)
Class Name |
Costs of a $10,000 investment |
Costs paid as a percentage of a $10,000 investment |
Class A |
$64 |
1.28%Footnote Reference* |
| Footnote |
Description |
Footnote* |
Annualized. | |
|
| Expenses Paid, Amount |
|
$ 64
|
|
| Expense Ratio, Percent |
[33] |
1.28%
|
|
| AssetsNet |
|
$ 404,774,621
|
|
| Holdings Count | Holding |
|
106
|
|
| Advisory Fees Paid, Amount |
|
$ 1,516,636
|
|
| InvestmentCompanyPortfolioTurnover |
|
17.00%
|
|
| Additional Fund Statistics [Text Block] |
|
Total Net Assets |
$404,774,621 |
# of Portfolio Holdings |
106 |
Portfolio Turnover Rate |
17% |
Total Management Fees Paid |
$1,516,636 | |
|
| Holdings [Text Block] |
|
Asset Allocation - % Investments
Value |
Value |
Common Stocks |
92.2 |
Foreign Common Stocks |
5.3 |
Investment Companies |
2.5 | Sector Allocation - % Equities
Value |
Value |
Materials |
1.0 |
Communication Services |
2.2 |
Consumer Staples |
2.7 |
Energy |
5.3 |
Financials |
11.8 |
Consumer Discretionary |
13.5 |
Health Care |
15.8 |
Industrials |
22.8 |
Information Technology |
24.9 | |
|
| Largest Holdings [Text Block] |
|
Top Ten Holdings - % Net Assets
AeroVironment, Inc. |
2.3 |
Magnite, Inc. |
2.1 |
Kratos Defense & Security Solutions, Inc. |
2.0 |
Wingstop, Inc. |
1.8 |
Ollie's Bargain Outlet Holdings, Inc. |
1.8 |
FirstCash Holdings, Inc. |
1.8 |
RBC Bearings, Inc. |
1.7 |
Palomar Holdings, Inc. |
1.7 |
CyberArk Software Ltd. |
1.7 |
HealthEquity, Inc. |
1.6 | Excludes cash equivalents. |
|
| Material Fund Change [Text Block] |
|
|
|
| C000110027 |
|
|
|
| Shareholder Report [Line Items] |
|
|
|
| Fund Name |
|
Stephens Small Cap Growth Fund
|
|
| Class Name |
|
C
|
|
| Trading Symbol |
|
SPWCX
|
|
| Annual or Semi-Annual Statement [Text Block] |
|
This semi-annual shareholder report contains important information about American Beacon Stephens Small Cap Growth Fund for the period of January 1, 2025 to June 30, 2025.
|
|
| Shareholder Report Annual or Semi-Annual |
|
Semi-Annual Shareholder Report
|
|
| Additional Information [Text Block] |
|
You can find additional information about the Fund at www.americanbeaconfunds.com/literature. You can also request this information by contacting us at 800-658-5811.
|
|
| Additional Information Phone Number |
|
800-658-5811
|
|
| Additional Information Website |
|
<span style="box-sizing: border-box; color: rgb(0, 0, 0); display: inline; flex-wrap: nowrap; font-size: 12px; font-weight: 400; grid-area: auto; line-height: 18px; margin: 0px; overflow: visible; text-align: left; text-align-last: auto; white-space-collapse: preserve-breaks;">www.americanbeaconfunds.com/literature</span>
|
|
| Expenses [Text Block] |
|
What were the Fund costs for the last six months?(based on a hypothetical $10,000 investment)
Class Name |
Costs of a $10,000 investment |
Costs paid as a percentage of a $10,000 investment |
Class C |
$103 |
2.06%Footnote Reference* |
| Footnote |
Description |
Footnote* |
Annualized. | |
|
| Expenses Paid, Amount |
|
$ 103
|
|
| Expense Ratio, Percent |
[34] |
2.06%
|
|
| AssetsNet |
|
$ 404,774,621
|
|
| Holdings Count | Holding |
|
106
|
|
| Advisory Fees Paid, Amount |
|
$ 1,516,636
|
|
| InvestmentCompanyPortfolioTurnover |
|
17.00%
|
|
| Additional Fund Statistics [Text Block] |
|
Total Net Assets |
$404,774,621 |
# of Portfolio Holdings |
106 |
Portfolio Turnover Rate |
17% |
Total Management Fees Paid |
$1,516,636 | |
|
| Holdings [Text Block] |
|
Asset Allocation - % Investments
Value |
Value |
Common Stocks |
92.2 |
Foreign Common Stocks |
5.3 |
Investment Companies |
2.5 | Sector Allocation - % Equities
Value |
Value |
Materials |
1.0 |
Communication Services |
2.2 |
Consumer Staples |
2.7 |
Energy |
5.3 |
Financials |
11.8 |
Consumer Discretionary |
13.5 |
Health Care |
15.8 |
Industrials |
22.8 |
Information Technology |
24.9 | |
|
| Largest Holdings [Text Block] |
|
Top Ten Holdings - % Net Assets
AeroVironment, Inc. |
2.3 |
Magnite, Inc. |
2.1 |
Kratos Defense & Security Solutions, Inc. |
2.0 |
Wingstop, Inc. |
1.8 |
Ollie's Bargain Outlet Holdings, Inc. |
1.8 |
FirstCash Holdings, Inc. |
1.8 |
RBC Bearings, Inc. |
1.7 |
Palomar Holdings, Inc. |
1.7 |
CyberArk Software Ltd. |
1.7 |
HealthEquity, Inc. |
1.6 | Excludes cash equivalents. |
|
| Material Fund Change [Text Block] |
|
|
|
| C000110030 |
|
|
|
| Shareholder Report [Line Items] |
|
|
|
| Fund Name |
|
Stephens Small Cap Growth Fund
|
|
| Class Name |
|
Investor
|
|
| Trading Symbol |
|
STSGX
|
|
| Annual or Semi-Annual Statement [Text Block] |
|
This semi-annual shareholder report contains important information about American Beacon Stephens Small Cap Growth Fund for the period of January 1, 2025 to June 30, 2025.
|
|
| Shareholder Report Annual or Semi-Annual |
|
Semi-Annual Shareholder Report
|
|
| Additional Information [Text Block] |
|
You can find additional information about the Fund at www.americanbeaconfunds.com/literature. You can also request this information by contacting us at 800-658-5811.
|
|
| Additional Information Phone Number |
|
800-658-5811
|
|
| Additional Information Website |
|
<span style="box-sizing: border-box; color: rgb(0, 0, 0); display: inline; flex-wrap: nowrap; font-size: 12px; font-weight: 400; grid-area: auto; line-height: 18px; margin: 0px; overflow: visible; text-align: left; text-align-last: auto; white-space-collapse: preserve-breaks;">www.americanbeaconfunds.com/literature</span>
|
|
| Expenses [Text Block] |
|
What were the Fund costs for the last six months?(based on a hypothetical $10,000 investment)
Class Name |
Costs of a $10,000 investment |
Costs paid as a percentage of a $10,000 investment |
Investor |
$64 |
1.27%Footnote Reference* |
| Footnote |
Description |
Footnote* |
Annualized. | |
|
| Expenses Paid, Amount |
|
$ 64
|
|
| Expense Ratio, Percent |
[35] |
1.27%
|
|
| AssetsNet |
|
$ 404,774,621
|
|
| Holdings Count | Holding |
|
106
|
|
| Advisory Fees Paid, Amount |
|
$ 1,516,636
|
|
| InvestmentCompanyPortfolioTurnover |
|
17.00%
|
|
| Additional Fund Statistics [Text Block] |
|
Total Net Assets |
$404,774,621 |
# of Portfolio Holdings |
106 |
Portfolio Turnover Rate |
17% |
Total Management Fees Paid |
$1,516,636 | |
|
| Holdings [Text Block] |
|
Asset Allocation - % Investments
Value |
Value |
Common Stocks |
92.2 |
Foreign Common Stocks |
5.3 |
Investment Companies |
2.5 | Sector Allocation - % Equities
Value |
Value |
Materials |
1.0 |
Communication Services |
2.2 |
Consumer Staples |
2.7 |
Energy |
5.3 |
Financials |
11.8 |
Consumer Discretionary |
13.5 |
Health Care |
15.8 |
Industrials |
22.8 |
Information Technology |
24.9 | |
|
| Largest Holdings [Text Block] |
|
Top Ten Holdings - % Net Assets
AeroVironment, Inc. |
2.3 |
Magnite, Inc. |
2.1 |
Kratos Defense & Security Solutions, Inc. |
2.0 |
Wingstop, Inc. |
1.8 |
Ollie's Bargain Outlet Holdings, Inc. |
1.8 |
FirstCash Holdings, Inc. |
1.8 |
RBC Bearings, Inc. |
1.7 |
Palomar Holdings, Inc. |
1.7 |
CyberArk Software Ltd. |
1.7 |
HealthEquity, Inc. |
1.6 | Excludes cash equivalents. |
|
| Material Fund Change [Text Block] |
|
|
|
| C000110028 |
|
|
|
| Shareholder Report [Line Items] |
|
|
|
| Fund Name |
|
Stephens Small Cap Growth Fund
|
|
| Class Name |
|
R5
|
|
| Trading Symbol |
|
STSIX
|
|
| Annual or Semi-Annual Statement [Text Block] |
|
This semi-annual shareholder report contains important information about American Beacon Stephens Small Cap Growth Fund for the period of January 1, 2025 to June 30, 2025.
|
|
| Shareholder Report Annual or Semi-Annual |
|
Semi-Annual Shareholder Report
|
|
| Additional Information [Text Block] |
|
You can find additional information about the Fund at www.americanbeaconfunds.com/literature. You can also request this information by contacting us at 800-658-5811.
|
|
| Additional Information Phone Number |
|
800-658-5811
|
|
| Additional Information Website |
|
<span style="box-sizing: border-box; color: rgb(0, 0, 0); display: inline; flex-wrap: nowrap; font-size: 12px; font-weight: 400; grid-area: auto; line-height: 18px; margin: 0px; overflow: visible; text-align: left; text-align-last: auto; white-space-collapse: preserve-breaks;">www.americanbeaconfunds.com/literature</span>
|
|
| Expenses [Text Block] |
|
What were the Fund costs for the last six months?(based on a hypothetical $10,000 investment)
Class Name |
Costs of a $10,000 investment |
Costs paid as a percentage of a $10,000 investment |
R5 |
$50 |
0.99%Footnote Reference* |
| Footnote |
Description |
Footnote* |
Annualized. | |
|
| Expenses Paid, Amount |
|
$ 50
|
|
| Expense Ratio, Percent |
[36] |
0.99%
|
|
| AssetsNet |
|
$ 404,774,621
|
|
| Holdings Count | Holding |
|
106
|
|
| Advisory Fees Paid, Amount |
|
$ 1,516,636
|
|
| InvestmentCompanyPortfolioTurnover |
|
17.00%
|
|
| Additional Fund Statistics [Text Block] |
|
Total Net Assets |
$404,774,621 |
# of Portfolio Holdings |
106 |
Portfolio Turnover Rate |
17% |
Total Management Fees Paid |
$1,516,636 | |
|
| Holdings [Text Block] |
|
Asset Allocation - % Investments
Value |
Value |
Common Stocks |
92.2 |
Foreign Common Stocks |
5.3 |
Investment Companies |
2.5 | Sector Allocation - % Equities
Value |
Value |
Materials |
1.0 |
Communication Services |
2.2 |
Consumer Staples |
2.7 |
Energy |
5.3 |
Financials |
11.8 |
Consumer Discretionary |
13.5 |
Health Care |
15.8 |
Industrials |
22.8 |
Information Technology |
24.9 | |
|
| Largest Holdings [Text Block] |
|
Top Ten Holdings - % Net Assets
AeroVironment, Inc. |
2.3 |
Magnite, Inc. |
2.1 |
Kratos Defense & Security Solutions, Inc. |
2.0 |
Wingstop, Inc. |
1.8 |
Ollie's Bargain Outlet Holdings, Inc. |
1.8 |
FirstCash Holdings, Inc. |
1.8 |
RBC Bearings, Inc. |
1.7 |
Palomar Holdings, Inc. |
1.7 |
CyberArk Software Ltd. |
1.7 |
HealthEquity, Inc. |
1.6 | Excludes cash equivalents. |
|
| Material Fund Change [Text Block] |
|
|
|
| C000213181 |
|
|
|
| Shareholder Report [Line Items] |
|
|
|
| Fund Name |
|
Stephens Small Cap Growth Fund
|
|
| Class Name |
|
R6
|
|
| Trading Symbol |
|
STSRX
|
|
| Annual or Semi-Annual Statement [Text Block] |
|
This semi-annual shareholder report contains important information about American Beacon Stephens Small Cap Growth Fund for the period of January 1, 2025 to June 30, 2025.
|
|
| Shareholder Report Annual or Semi-Annual |
|
Semi-Annual Shareholder Report
|
|
| Additional Information [Text Block] |
|
You can find additional information about the Fund at www.americanbeaconfunds.com/literature. You can also request this information by contacting us at 800-658-5811.
|
|
| Additional Information Phone Number |
|
800-658-5811
|
|
| Additional Information Website |
|
<span style="box-sizing: border-box; color: rgb(0, 0, 0); display: inline; flex-wrap: nowrap; font-size: 12px; font-weight: 400; grid-area: auto; line-height: 18px; margin: 0px; overflow: visible; text-align: left; text-align-last: auto; white-space-collapse: preserve-breaks;">www.americanbeaconfunds.com/literature</span>
|
|
| Expenses [Text Block] |
|
What were the Fund costs for the last six months?(based on a hypothetical $10,000 investment)
Class Name |
Costs of a $10,000 investment |
Costs paid as a percentage of a $10,000 investment |
R6 |
$48 |
0.96%Footnote Reference* |
| Footnote |
Description |
Footnote* |
Annualized. | |
|
| Expenses Paid, Amount |
|
$ 48
|
|
| Expense Ratio, Percent |
[37] |
0.96%
|
|
| AssetsNet |
|
$ 404,774,621
|
|
| Holdings Count | Holding |
|
106
|
|
| Advisory Fees Paid, Amount |
|
$ 1,516,636
|
|
| InvestmentCompanyPortfolioTurnover |
|
17.00%
|
|
| Additional Fund Statistics [Text Block] |
|
Total Net Assets |
$404,774,621 |
# of Portfolio Holdings |
106 |
Portfolio Turnover Rate |
17% |
Total Management Fees Paid |
$1,516,636 | |
|
| Holdings [Text Block] |
|
Asset Allocation - % Investments
Value |
Value |
Common Stocks |
92.2 |
Foreign Common Stocks |
5.3 |
Investment Companies |
2.5 | Sector Allocation - % Equities
Value |
Value |
Materials |
1.0 |
Communication Services |
2.2 |
Consumer Staples |
2.7 |
Energy |
5.3 |
Financials |
11.8 |
Consumer Discretionary |
13.5 |
Health Care |
15.8 |
Industrials |
22.8 |
Information Technology |
24.9 | |
|
| Largest Holdings [Text Block] |
|
Top Ten Holdings - % Net Assets
AeroVironment, Inc. |
2.3 |
Magnite, Inc. |
2.1 |
Kratos Defense & Security Solutions, Inc. |
2.0 |
Wingstop, Inc. |
1.8 |
Ollie's Bargain Outlet Holdings, Inc. |
1.8 |
FirstCash Holdings, Inc. |
1.8 |
RBC Bearings, Inc. |
1.7 |
Palomar Holdings, Inc. |
1.7 |
CyberArk Software Ltd. |
1.7 |
HealthEquity, Inc. |
1.6 | Excludes cash equivalents. |
|
| Material Fund Change [Text Block] |
|
|
|
| C000110029 |
|
|
|
| Shareholder Report [Line Items] |
|
|
|
| Fund Name |
|
Stephens Small Cap Growth Fund
|
|
| Class Name |
|
Y
|
|
| Trading Symbol |
|
SPWYX
|
|
| Annual or Semi-Annual Statement [Text Block] |
|
This semi-annual shareholder report contains important information about American Beacon Stephens Small Cap Growth Fund for the period of January 1, 2025 to June 30, 2025.
|
|
| Shareholder Report Annual or Semi-Annual |
|
Semi-Annual Shareholder Report
|
|
| Additional Information [Text Block] |
|
You can find additional information about the Fund at www.americanbeaconfunds.com/literature. You can also request this information by contacting us at 800-658-5811.
|
|
| Additional Information Phone Number |
|
800-658-5811
|
|
| Additional Information Website |
|
<span style="box-sizing: border-box; color: rgb(0, 0, 0); display: inline; flex-wrap: nowrap; font-size: 12px; font-weight: 400; grid-area: auto; line-height: 18px; margin: 0px; overflow: visible; text-align: left; text-align-last: auto; white-space-collapse: preserve-breaks;">www.americanbeaconfunds.com/literature</span>
|
|
| Expenses [Text Block] |
|
What were the Fund costs for the last six months?(based on a hypothetical $10,000 investment)
Class Name |
Costs of a $10,000 investment |
Costs paid as a percentage of a $10,000 investment |
Y |
$53 |
1.05%Footnote Reference* |
| Footnote |
Description |
Footnote* |
Annualized. | |
|
| Expenses Paid, Amount |
|
$ 53
|
|
| Expense Ratio, Percent |
[38] |
1.05%
|
|
| AssetsNet |
|
$ 404,774,621
|
|
| Holdings Count | Holding |
|
106
|
|
| Advisory Fees Paid, Amount |
|
$ 1,516,636
|
|
| InvestmentCompanyPortfolioTurnover |
|
17.00%
|
|
| Additional Fund Statistics [Text Block] |
|
Total Net Assets |
$404,774,621 |
# of Portfolio Holdings |
106 |
Portfolio Turnover Rate |
17% |
Total Management Fees Paid |
$1,516,636 | |
|
| Holdings [Text Block] |
|
Asset Allocation - % Investments
Value |
Value |
Common Stocks |
92.2 |
Foreign Common Stocks |
5.3 |
Investment Companies |
2.5 | Sector Allocation - % Equities
Value |
Value |
Materials |
1.0 |
Communication Services |
2.2 |
Consumer Staples |
2.7 |
Energy |
5.3 |
Financials |
11.8 |
Consumer Discretionary |
13.5 |
Health Care |
15.8 |
Industrials |
22.8 |
Information Technology |
24.9 | |
|
| Largest Holdings [Text Block] |
|
Top Ten Holdings - % Net Assets
AeroVironment, Inc. |
2.3 |
Magnite, Inc. |
2.1 |
Kratos Defense & Security Solutions, Inc. |
2.0 |
Wingstop, Inc. |
1.8 |
Ollie's Bargain Outlet Holdings, Inc. |
1.8 |
FirstCash Holdings, Inc. |
1.8 |
RBC Bearings, Inc. |
1.7 |
Palomar Holdings, Inc. |
1.7 |
CyberArk Software Ltd. |
1.7 |
HealthEquity, Inc. |
1.6 | Excludes cash equivalents. |
|
| Material Fund Change [Text Block] |
|
|
|
|
|