Shareholder Report |
6 Months Ended | |||||||||||||||||||||||
---|---|---|---|---|---|---|---|---|---|---|---|---|---|---|---|---|---|---|---|---|---|---|---|---|
Jun. 30, 2025
USD ($)
Holdings
| ||||||||||||||||||||||||
Shareholder Report [Line Items] | ||||||||||||||||||||||||
Document Type | N-CSRS | |||||||||||||||||||||||
Amendment Flag | false | |||||||||||||||||||||||
Registrant Name | ETF Opportunities Trust | |||||||||||||||||||||||
Entity Central Index Key | 0001771146 | |||||||||||||||||||||||
Entity Investment Company Type | N-1A | |||||||||||||||||||||||
Document Period End Date | Jun. 30, 2025 | |||||||||||||||||||||||
SMI 3Fourteen REAL Asset Allocation ETF | ||||||||||||||||||||||||
Shareholder Report [Line Items] | ||||||||||||||||||||||||
Fund Name | SMI 3Fourteen REAL Asset Allocation ETF | |||||||||||||||||||||||
Class Name | SMI 3Fourteen REAL Asset Allocation ETF | |||||||||||||||||||||||
Trading Symbol | RAA | |||||||||||||||||||||||
Security Exchange Name | NASDAQ | |||||||||||||||||||||||
Annual or Semi-Annual Statement [Text Block] | This | contains important information about the SMI 3Fourteen REAL Asset Allocation ETF for the period of February 26, 2025 (inception) to June 30, 2025.|||||||||||||||||||||||
Shareholder Report Annual or Semi-Annual | semi-annual shareholder report | |||||||||||||||||||||||
Additional Information [Text Block] | You can find additional information about the Fund at www.3fourteensmi.com/raa . You can also contact us at (844) 328-3383 . | |||||||||||||||||||||||
Additional Information Phone Number | (844) 328-3383 | |||||||||||||||||||||||
Additional Information Website | www.3fourteensmi.com/raa | |||||||||||||||||||||||
Expenses [Text Block] |
What were the Fund costs for the period? (based on a hypothetical $10,000 investment)
¹ Costs are for the period of February 26, 2025 to June 30, 2025. Costs for a full semi-annual period would be higher. ² Annualized.
|
|||||||||||||||||||||||
Expenses Paid, Amount | $ 27 | [1] | ||||||||||||||||||||||
Expense Ratio, Percent | 0.77% | [2] | ||||||||||||||||||||||
Net Assets | $ 438,074,993 | |||||||||||||||||||||||
Holdings Count | Holdings | 170 | |||||||||||||||||||||||
Advisory Fees Paid, Amount | $ 972,667 | |||||||||||||||||||||||
Investment Company, Portfolio Turnover | 72.21% | |||||||||||||||||||||||
Additional Fund Statistics [Text Block] |
Key Fund Statistics (as of June 30, 2025)
|
|||||||||||||||||||||||
Holdings [Text Block] |
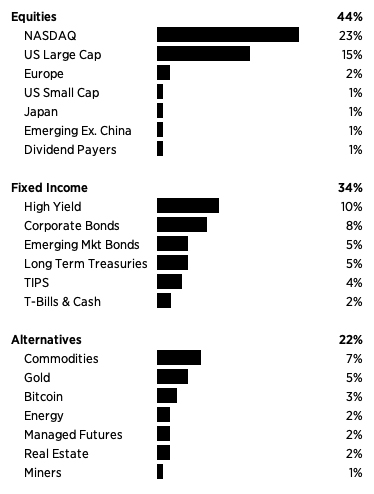
What did the Fund invest in? (% of Net Assets as of June 30, 2025) Sector Breakdown
![]()
|
|||||||||||||||||||||||
Largest Holdings [Text Block] |
|
|||||||||||||||||||||||
|