What were the Fund costs for the past year?
(based on a hypothetical $10,000 investment)
|
Class
Name |
Costs
of a $10,000 investment |
Costs
paid as a percentage of a $10,000 investment |
|---|---|---|
|
T-REX
2X
Long
Tesla
Daily
Target ETF |
$119 |
1.05% |
Market Overview
For the twelve months ending June 30, 2025, Tesla Inc. (“TSLA”) continued its position as a highly traded and influential equity within the U.S. markets, advancing 51.37% over the period. The stock’s gains were supported by breakthroughs in autonomous driving, AI integration, and expansion in energy storage. However, Tesla experienced significant intraday volatility and sharp price reversals around key corporate developments, which affected the performance of leveraged ETFs designed to track its daily returns.
Fund Objective: The T-Rex 2x Long Tesla Daily Target ETF (the “Fund”) seeks daily investment results, before fees and expenses, of 200% of the daily performance of TSLA.
• Fund Performance: For the period of July 1, 2024 to June 30, 2025, the Fund returned +27.45%, while TSLA’s shares increased +51.37% over the same period. The Fund’s broad based index, the S&P 500® Index, over the same period, returned +15.16%.
• Performance Drivers: Despite strong performance from TSLA over the year—fueled by breakthroughs in autonomous driving, AI robotics, and an expansion of the company’s energy storage business—the Fund returned far less than 2x the stock’s price appreciation. This was again due to compounding drag in a volatile market environment, particularly during months where TSLA experienced sharp reversals that negatively impacted the Fund’s ability to track the 2x cumulative return over longer periods.
Cumulative Performance
(based on a hypothetical $10,000 investment)
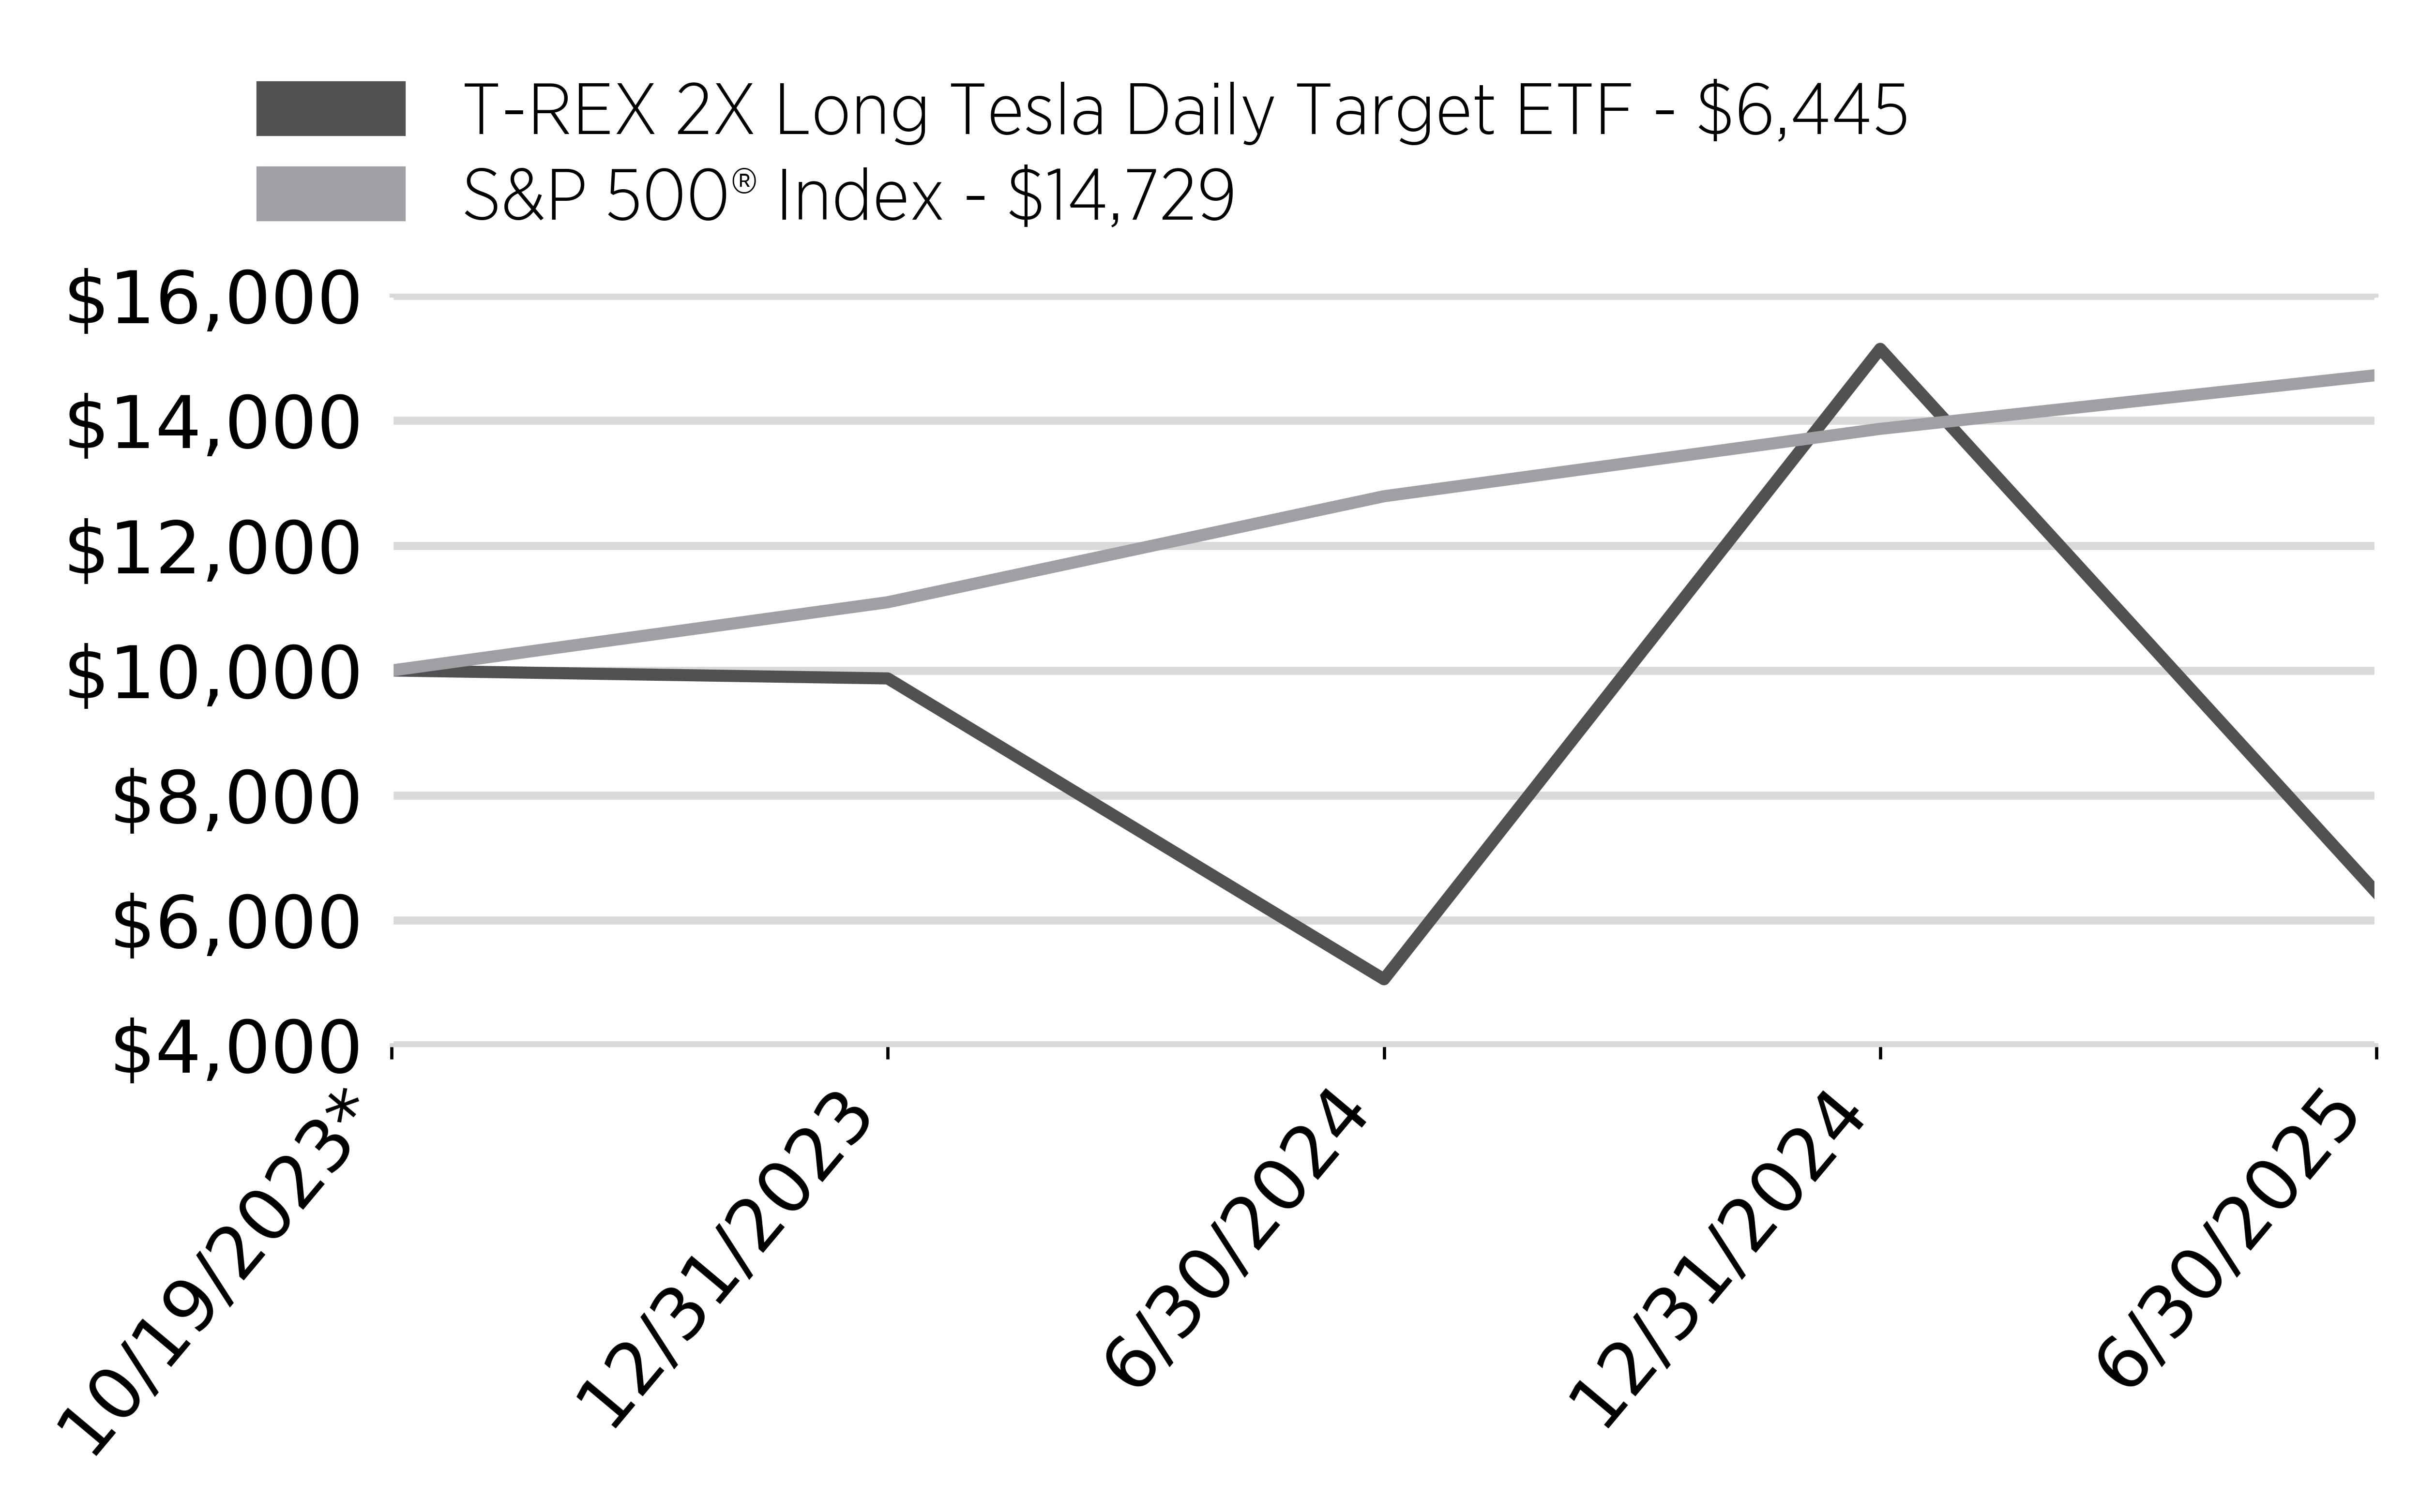
| * | Inception |
Annual Performance
|
|
1
Year |
Average
Annual Return
Since
Inception |
|---|---|---|
|
T-REX
2X Long Tesla Daily Target ETF |
27.45% |
-22.78% |
|
S&P
500® Index |
15.16% |
25.56% |
Key Fund Statistics
(as of June 30, 2025)
|
Fund
Net Assets |
$382,651,392 |
|
Number
of Holdings |
7 |
|
Total
Advisory Fee Paid |
$4,385,198 |
|
Portfolio
Turnover Rate |
19,034.58% |
Market Exposure
"Market Exposure" includes the values of total investments (including the contract value of any derivatives) and excludes any short-term investments.
|
Portfolio
Composition |
|
|---|---|
|
Cash |
|
|
Other
Assets, Net of Liabilities |
|
|
Derivatives |
|
|
Common
Stocks |
What were the Fund costs for the past year?
(based on a hypothetical $10,000 investment)
|
Class
Name |
Costs
of a $10,000 investment |
Costs
paid as a percentage of a $10,000 investment |
|---|---|---|
|
T-REX
2X
Inverse
Tesla
Daily
Target ETF |
$56 |
1.05% |
Market Overview
For the twelve months ending June 30, 2025, Tesla Inc. (“TSLA”) continued its position as a highly traded and influential equity within the U.S. markets, advancing 51.37% over the period. The stock’s gains were supported by breakthroughs in autonomous driving, AI integration, and expansion in energy storage. However, Tesla experienced significant intraday volatility and sharp price reversals around key corporate developments, which affected the performance of inverse ETFs designed to track its daily returns.
Fund Objective: The T-Rex 2x Inverse Tesla Daily Target ETF (the “Fund”) seeks daily investment results, before fees and expenses, of –200% of the daily performance of TSLA.
• Fund Performance: For the period of July 1, 2024 to June 30, 2025, the Fund returned -93.07%, while TSLA’s shares increased +51.37% over the same period. The Fund’s broad based index, the S&P 500® Index, over the same period, returned +15.16%.
• Performance Drivers: The Fund was designed to benefit from daily declines in Tesla stock. However, with TSLA in a sustained uptrend, the Fund’s performance was severely impacted by the compounding effect of daily losses. Tesla’s large daily price swings throughout the year further exacerbated losses in the Fund, especially during earnings seasons and AI-related market rallies.
Cumulative Performance
(based on a hypothetical $10,000 investment)
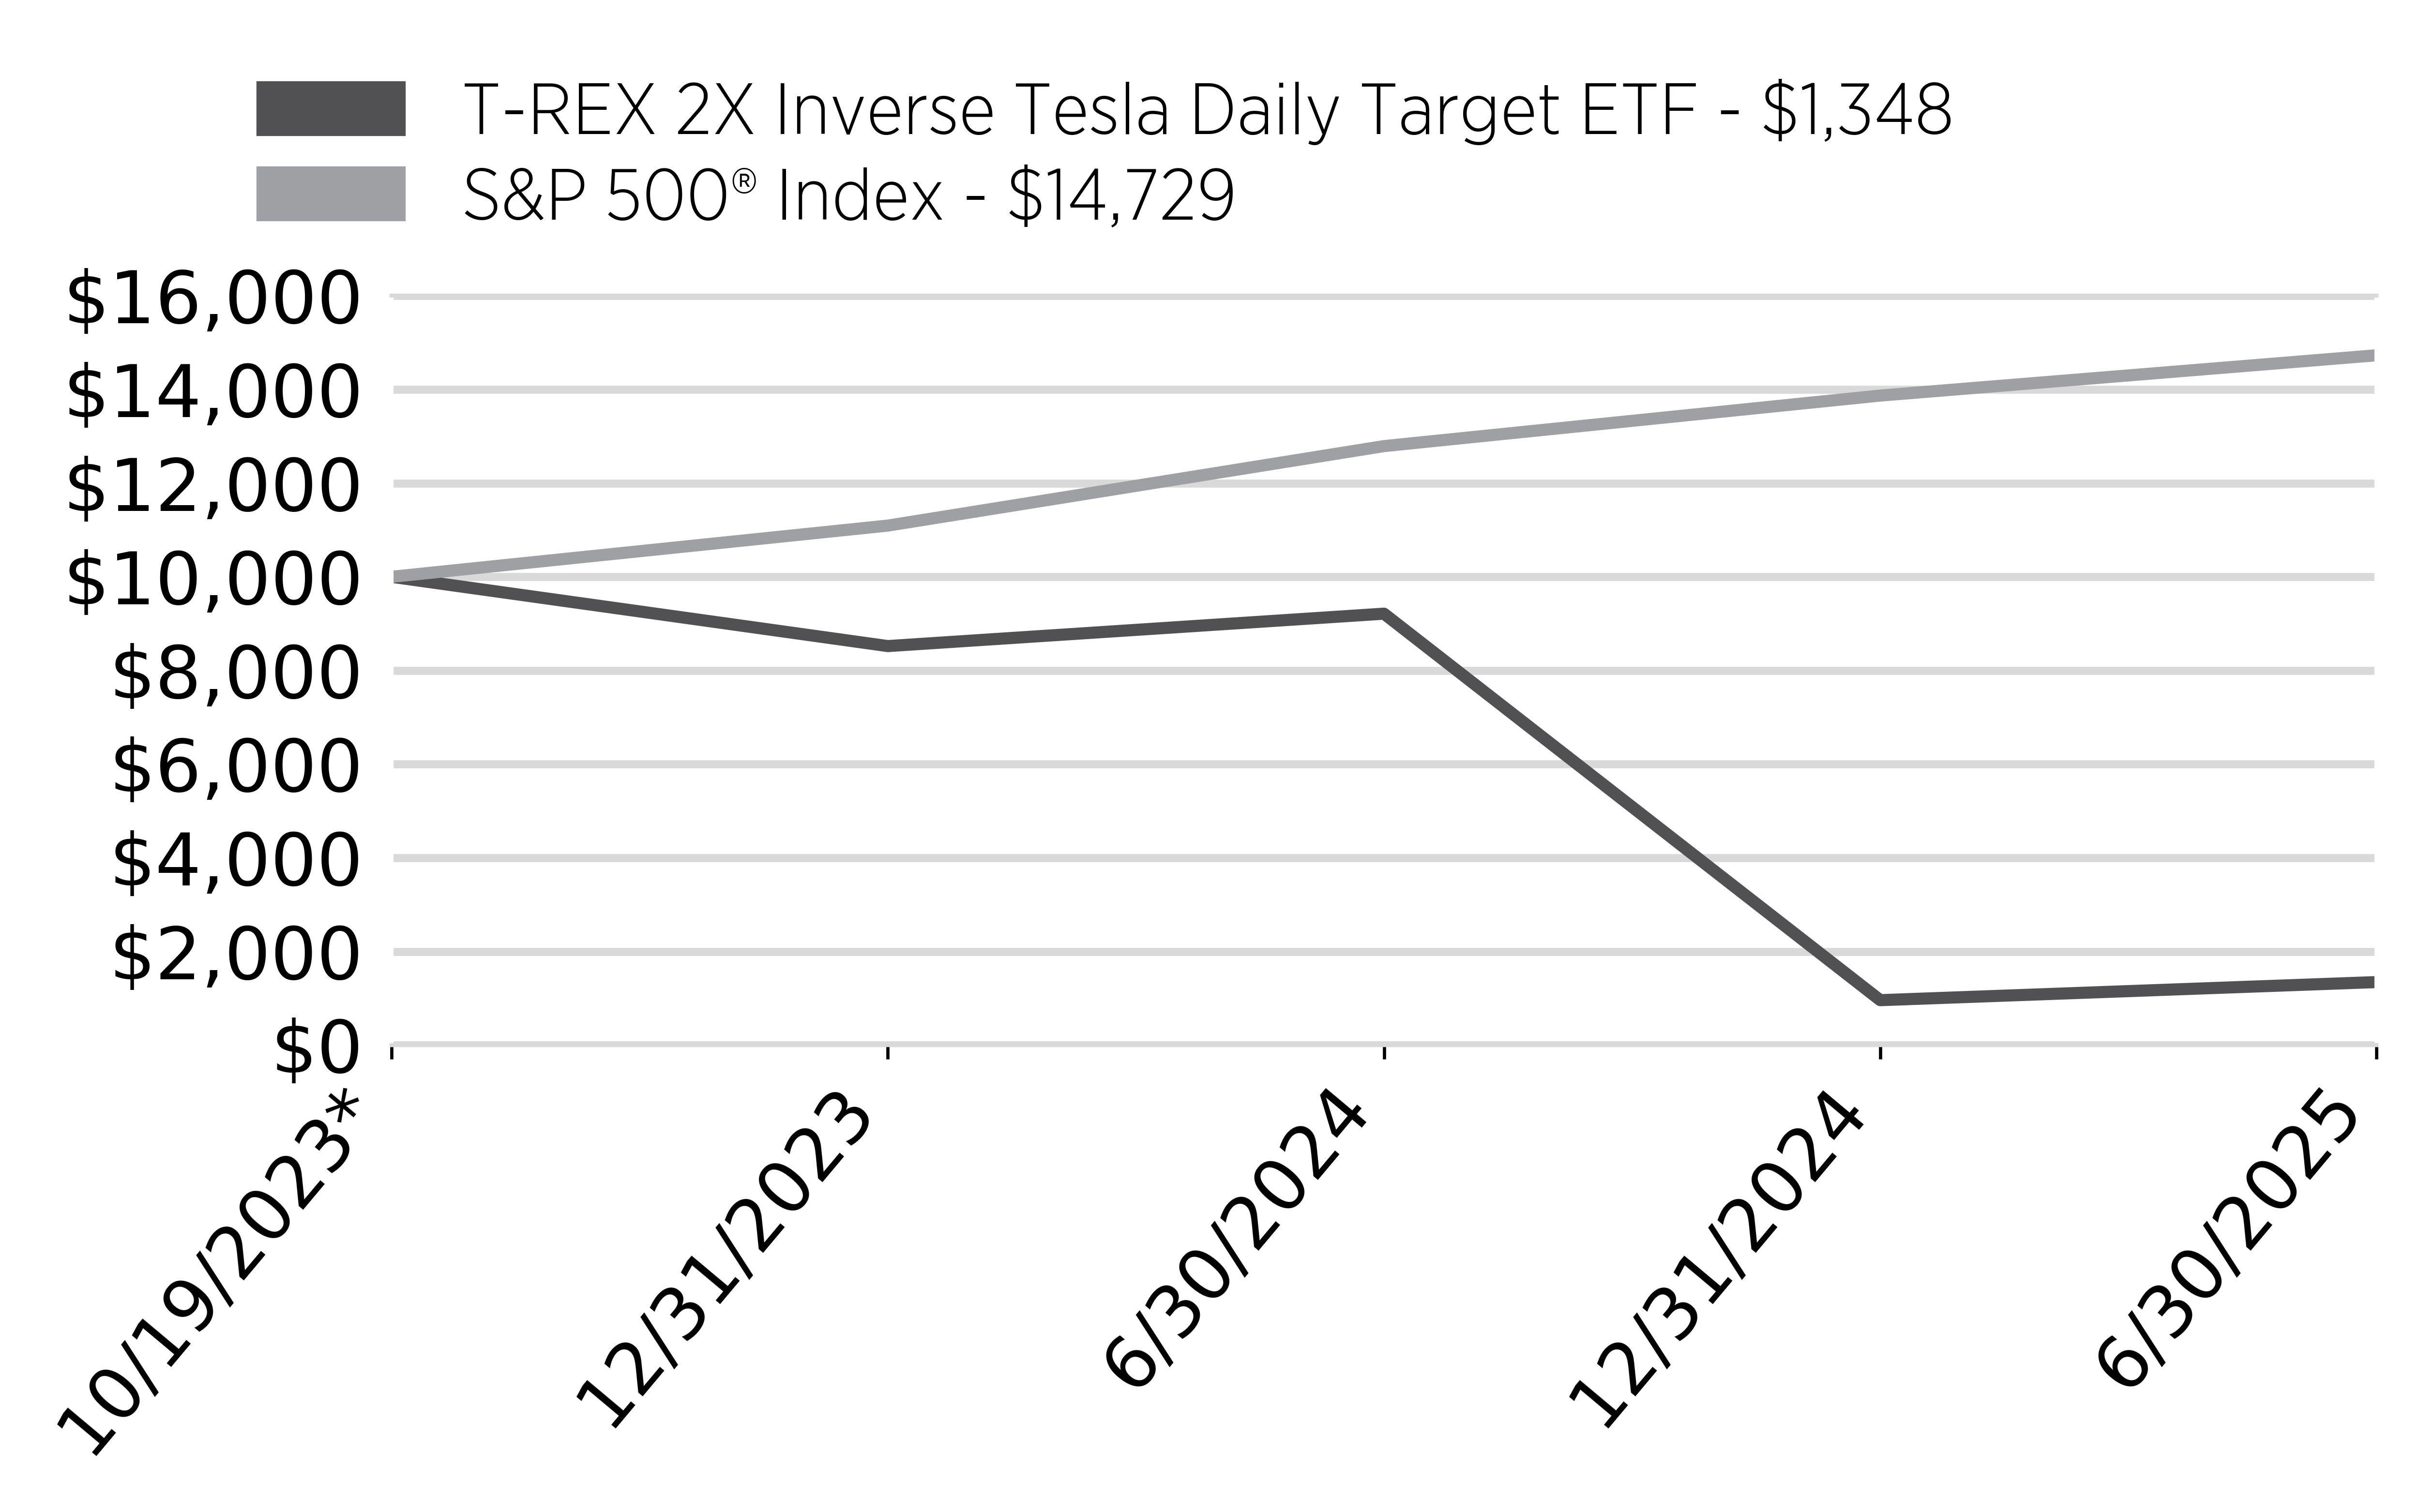
| * | Inception |
Annual Performance
|
|
1
Year |
Average
Annual Return
Since
Inception |
|---|---|---|
|
T-REX
2X Inverse Tesla Daily Target ETF |
-93.07% |
-80.18% |
|
S&P
500® Index |
15.16% |
25.56% |
Key Fund Statistics
(as of June 30, 2025)
|
Fund
Net Assets |
$89,559,610 |
|
Number
of Holdings |
3 |
|
Total
Advisory Fee Paid |
$773,517 |
|
Portfolio
Turnover Rate |
0.00% |
Market Exposure
"Market Exposure" includes the values of total investments (including the contract value of any derivatives) and excludes any short-term investments.
|
Portfolio
Composition |
|
|---|---|
|
Cash |
|
|
Derivatives |
|
|
Other
Assets, Net of Liabilities |
What were the Fund costs for the past year?
(based on a hypothetical $10,000 investment)
|
Class
Name |
Costs
of a $10,000 investment |
Costs
paid as a percentage of a $10,000 investment |
|---|---|---|
|
T-REX
2X
Long
NVIDIA
Daily
Target ETF |
$104 |
1.05% |
Market Overview
During the twelve-month period ended June 30, 2025, Nvidia Corporation (“NVDA”) stood out in U.S. equity markets as a leading growth stock driven by strong momentum in artificial intelligence, semiconductor innovation, and data center demand. Investor enthusiasm propelled the stock to a 27.14% gain despite periods of pronounced daily volatility, especially in the second half of 2024. These price swings notably influenced the returns of leveraged products tracking NVDA’s daily performance.
Fund Objective: The T-Rex 2x Long NVIDIA Daily Target ETF (the “Fund”) seeks daily investment results, before fees and expenses, of 200% of the daily performance of NVDA.
• Fund Performance: For the period of July 1, 2024 to June 30, 2025, the Fund returned -1.49%, compared to a +27.14% return for the common shares of NVDA. The Fund’s broad based index, the S&P 500® Index, over the same period, returned +15.16%.
• Performance Drivers: While NVDA shares appreciated over the one-year period, the Fund’s compounding drag impacted returns. Due to the Fund’s daily reset feature, the compounding of daily returns in a volatile environment led to significant underperformance relative to the expected two-times return of NVDA over the full year. Volatility, particularly during the second half of 2024, eroded cumulative gains despite the stock’s net appreciation.
Cumulative Performance
(based on a hypothetical $10,000 investment)
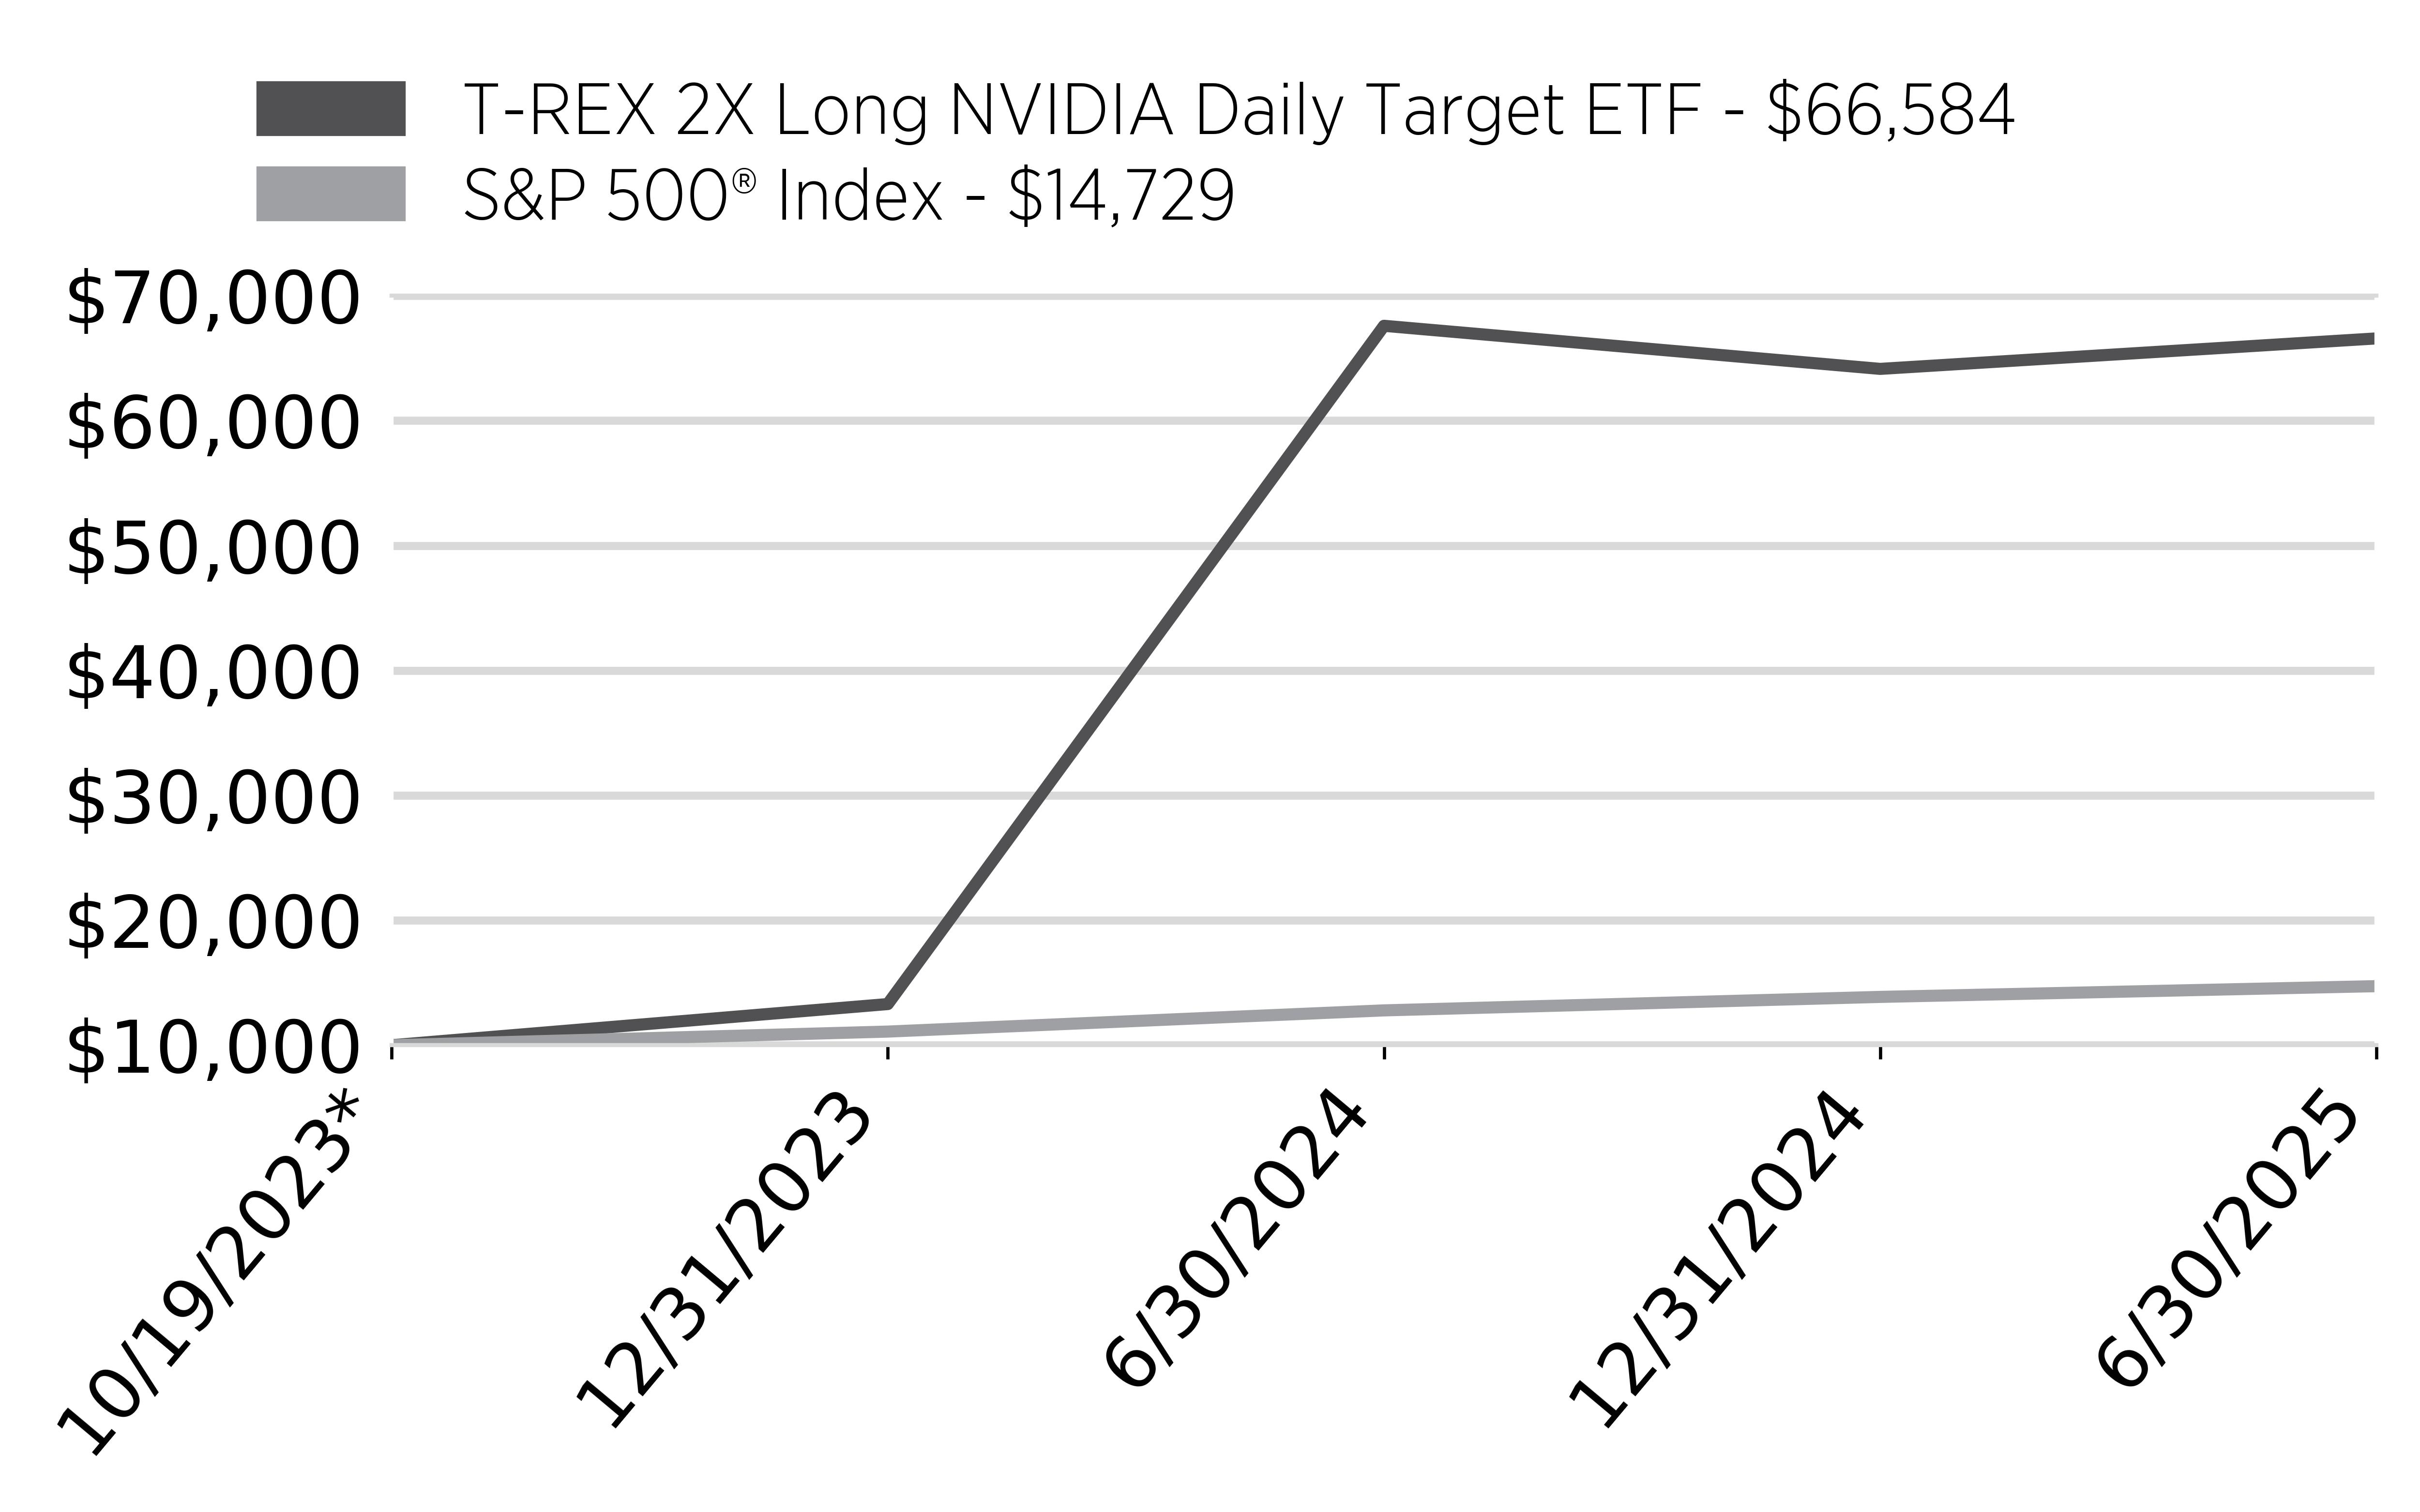
| * | Inception |
Annual Performance
|
|
1
Year |
Average
Annual Return
Since
Inception |
|---|---|---|
|
T-REX
2X Long NVIDIA Daily Target ETF |
-1.49% |
205.06% |
|
S&P
500® Index |
15.16% |
25.56% |
Key Fund Statistics
(as of June 30, 2025)
|
Fund
Net Assets |
$646,713,990 |
|
Number
of Holdings |
6 |
|
Total
Advisory Fee Paid |
$6,472,477 |
|
Portfolio
Turnover Rate |
37,731.66% |
Market Exposure
"Market Exposure" includes the values of total investments (including the contract value of any derivatives) and excludes any short-term investments.
|
Portfolio
Composition |
|
|---|---|
|
Cash |
|
|
Derivatives |
|
|
Other
Assets in Excess of Liabilities |
What were the Fund costs for the past year?
(based on a hypothetical $10,000 investment)
|
Class
Name |
Costs
of a $10,000 investment |
Costs
paid as a percentage of a $10,000 investment |
|---|---|---|
|
T-REX
2X
Inverse
NVIDIA
Daily
Target ETF |
$65 |
1.05% |
Market Overview
During the twelve-month period ended June 30, 2025, Nvidia Corporation (“NVDA”) stood out in U.S. equity markets as a leading growth stock driven by strong momentum in artificial intelligence, semiconductor innovation, and data center demand. Investor enthusiasm propelled the stock to a 27.14% gain despite periods of pronounced daily volatility, especially in the second half of 2024. These price swings notably influenced the returns of inverse products tracking NVDA’s daily performance.
Fund Objective: The T-Rex 2x Inverse NVIDIA Daily Target ETF (the “Fund”) seeks daily investment results, before fees and expenses, of –200% of the daily performance of NVDA.
• Fund Performance: For the period of July 1, 2024 to June 30, 2025, the Fund returned -76.27%, while NVDA’s shares increased +27.14% over the same period. The Fund’s broad based index, the S&P 500® Index, over the same period, returned +15.16%.
• Performance Drivers: As a 2x inverse daily ETF, the Fund was expected to deliver the opposite of NVDA’s daily movements, magnified by a factor of two. With NVDA appreciating steadily over the year—buoyed by strong AI chip demand and continued earnings beats—the Fund suffered substantial losses. Daily resetting in a trending upward market, combined with periodic volatility, resulted in significant negative compounding.
Cumulative Performance
(based on a hypothetical $10,000 investment)
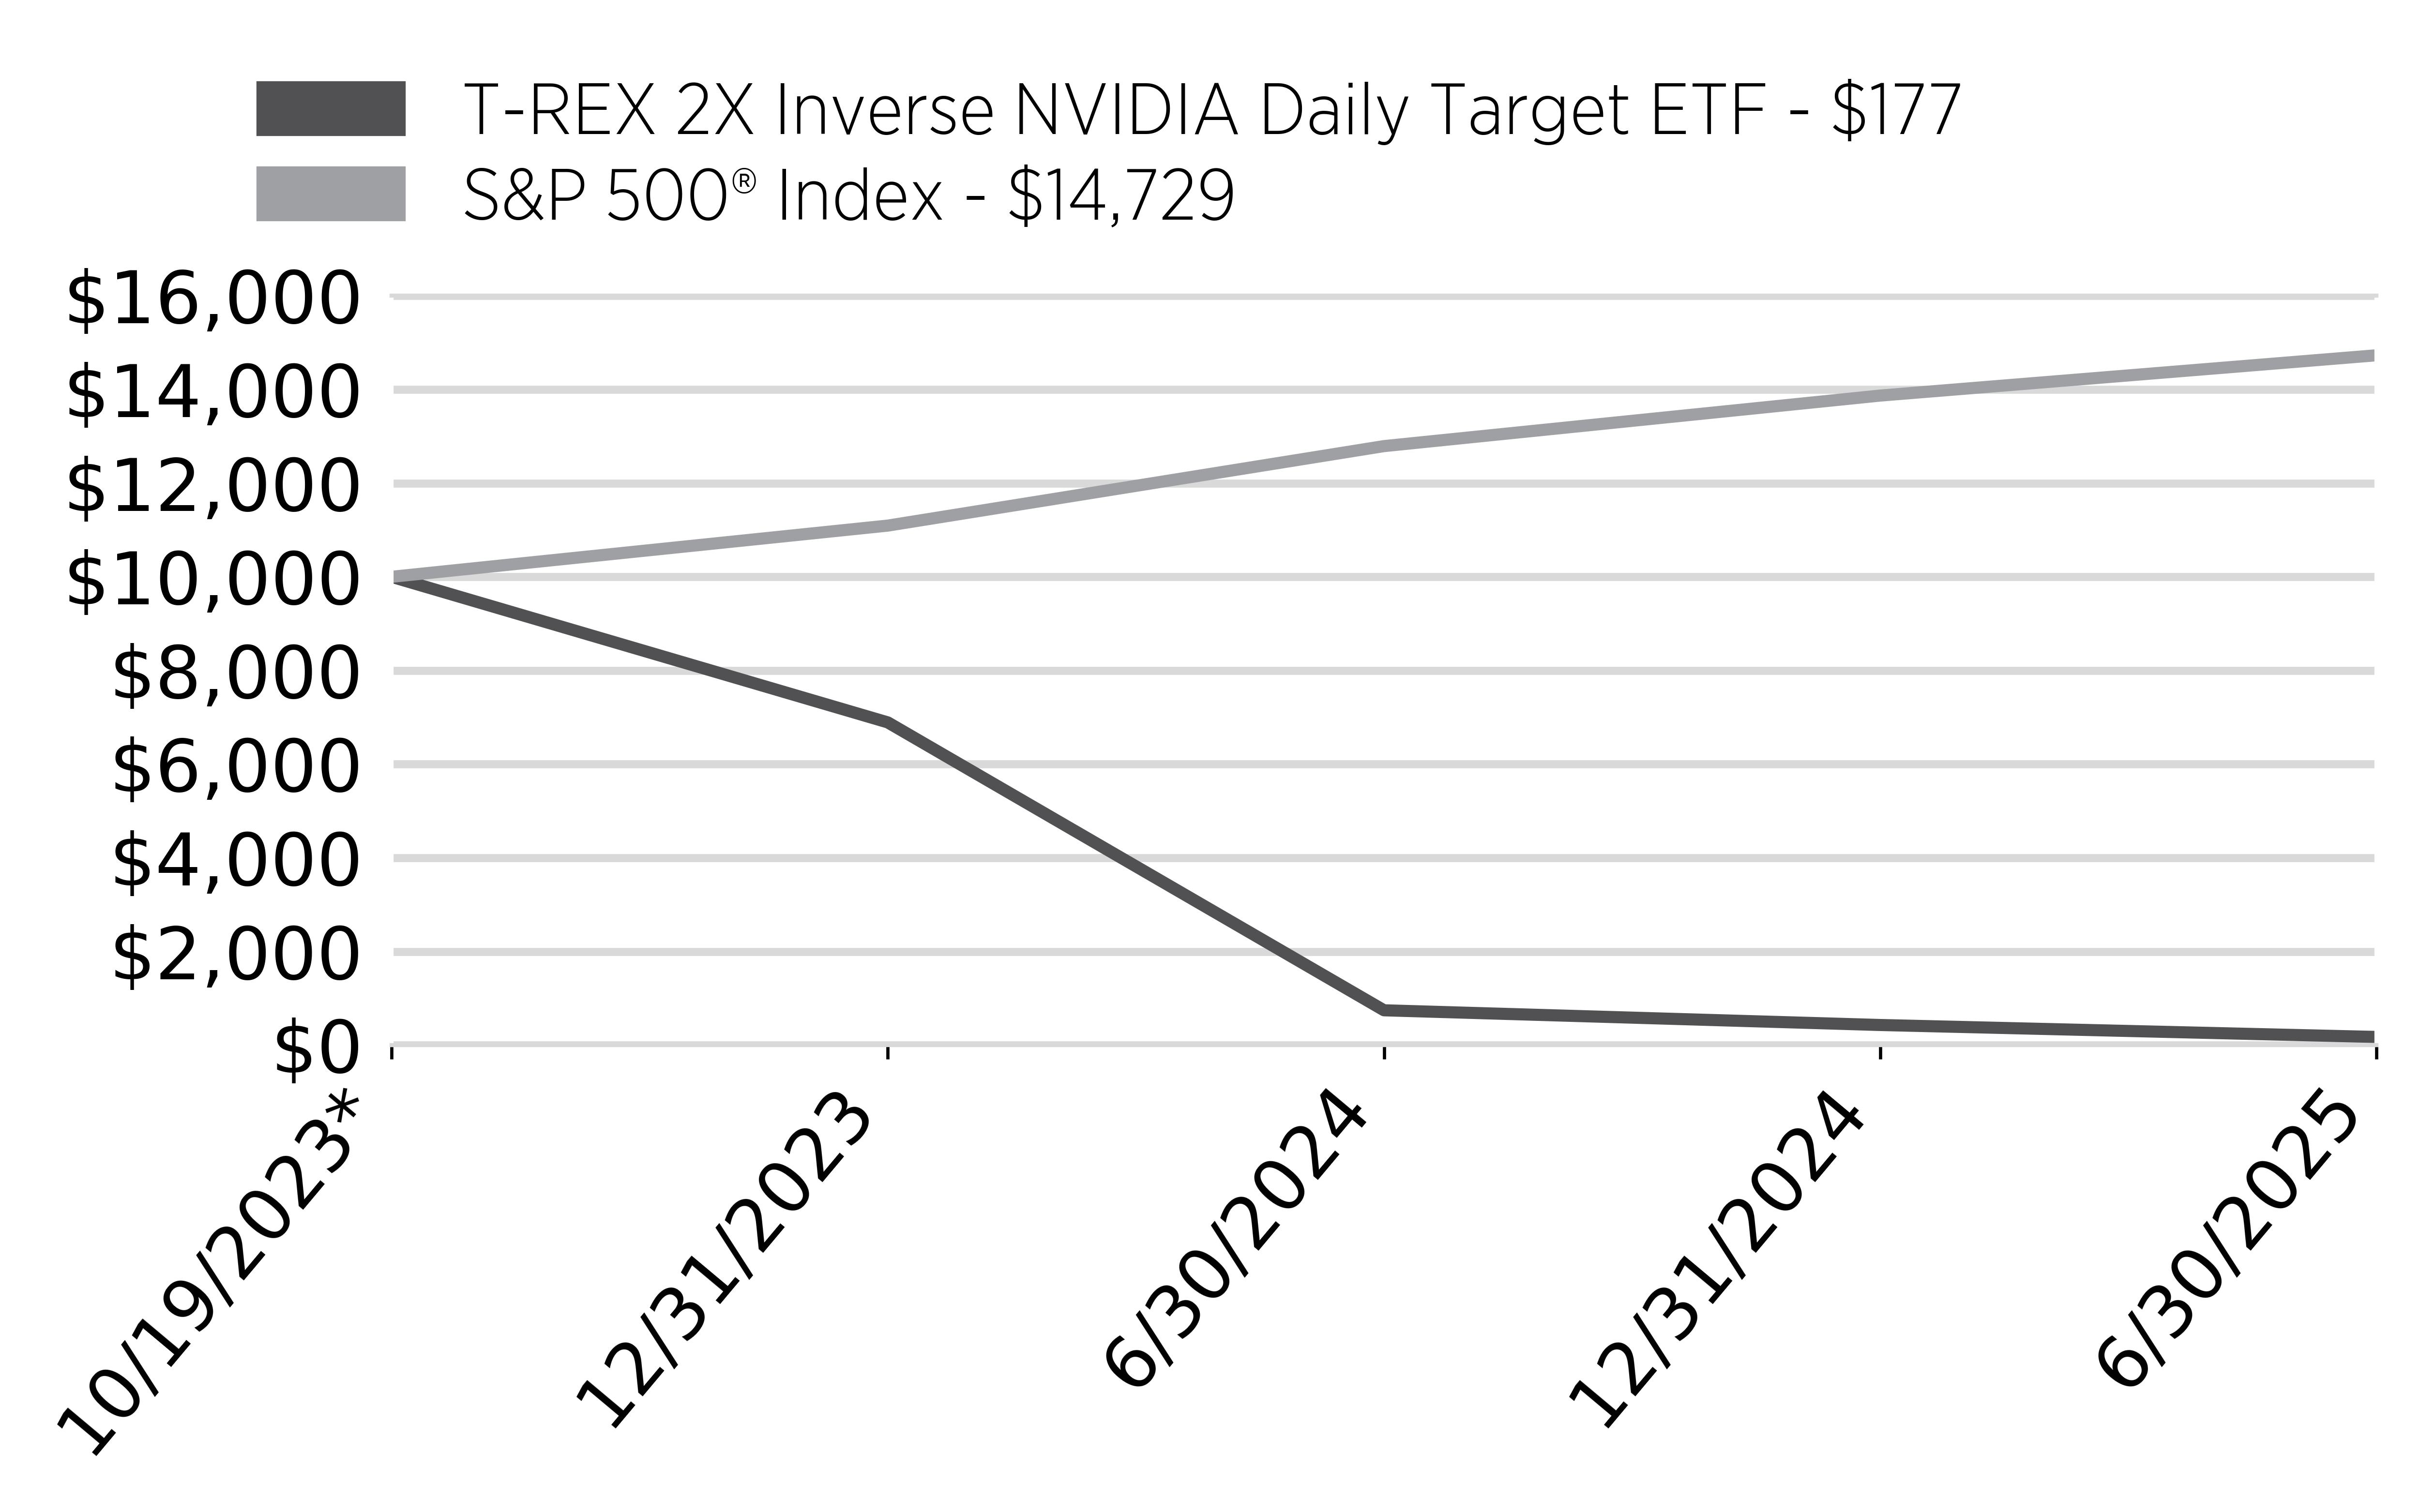
| * | Inception |
Annual Performance
|
|
1
Year |
Average
Annual Return
Since
Inception |
|---|---|---|
|
T-REX
2X Inverse NVIDIA Daily Target ETF |
-76.27% |
-90.69% |
|
S&P
500® Index |
15.16% |
25.56% |
Key Fund Statistics
(as of June 30, 2025)
|
Fund
Net Assets |
$47,572,512 |
|
Number
of Holdings |
2 |
|
Total
Advisory Fee Paid |
$501,473 |
|
Portfolio
Turnover Rate |
0.00% |
Market Exposure
"Market Exposure" includes the values of total investments (including the contract value of any derivatives) and excludes any short-term investments.
|
Portfolio
Composition |
|
|---|---|
|
Cash |
|
|
Other
Assets, Net of Liabilities |
|
|
Derivatives |