Shareholder Report
|
12 Months Ended |
|
Jun. 30, 2025
USD ($)
Holding
|
|---|
| Shareholder Report [Line Items] |
|
| Document Type |
N-CSR
|
| Amendment Flag |
false
|
| Registrant Name |
Palmer Square Funds Trust
|
| Entity Central Index Key |
0002014487
|
| Entity Investment Company Type |
N-1A
|
| Document Period End Date |
Jun. 30, 2025
|
| C000252104 |
|
| Shareholder Report [Line Items] |
|
| Fund Name |
Palmer Square CLO Senior Debt ETF
|
| Trading Symbol |
PSQA
|
| Security Exchange Name |
NYSEArca
|
| Annual or Semi-Annual Statement [Text Block] |
This annual shareholder report contains important information about the Palmer Square CLO Senior Debt ETF ("Fund") for the period of September 11, 2024 (inception) to June 30, 2025.
|
| Shareholder Report Annual or Semi-Annual |
Annual Shareholder Report
|
| Additional Information [Text Block] |
You can find additional information about the Fund at https://etf.palmersquarefunds.com/funds/us-etfs/palmer-square-us-etfs. You can also request this information by contacting us at (855) 513-9988.
|
| Material Fund Change Notice [Text Block] |
The Fund did not have any material changes that occurred since the beginning of the reporting period.
|
| Additional Information Phone Number |
(855) 513-9988
|
| Additional Information Website |
https://etf.palmersquarefunds.com/funds/us-etfs/palmer-square-us-etfs
|
| Expenses [Text Block] |
What were the Fund costs for the last year?(Based on a hypothetical $10,000 investment) Ticker | Costs of a $10,000 investmentFootnote Reference* | Costs paid as a percentage of a $10,000 investmentFootnote Reference† |
|---|
PSQA | $16 | 0.20% |
|---|
| Footnote | Description | Footnote* | Amount shown reflects the expenses of the Fund from inception date through June 30, 2025. Expenses would be higher if the Fund had been in operation for the full year. | Footnote† | Annualized. |
|
| Expenses Paid, Amount |
$ 16
|
| Expense Ratio, Percent |
0.20%
|
| Expenses Short Period Footnote [Text Block] |
Amount shown reflects the expenses of the Fund from inception date through June 30, 2025. Expenses would be higher if the Fund had been in operation for the full year.
|
| Factors Affecting Performance [Text Block] |
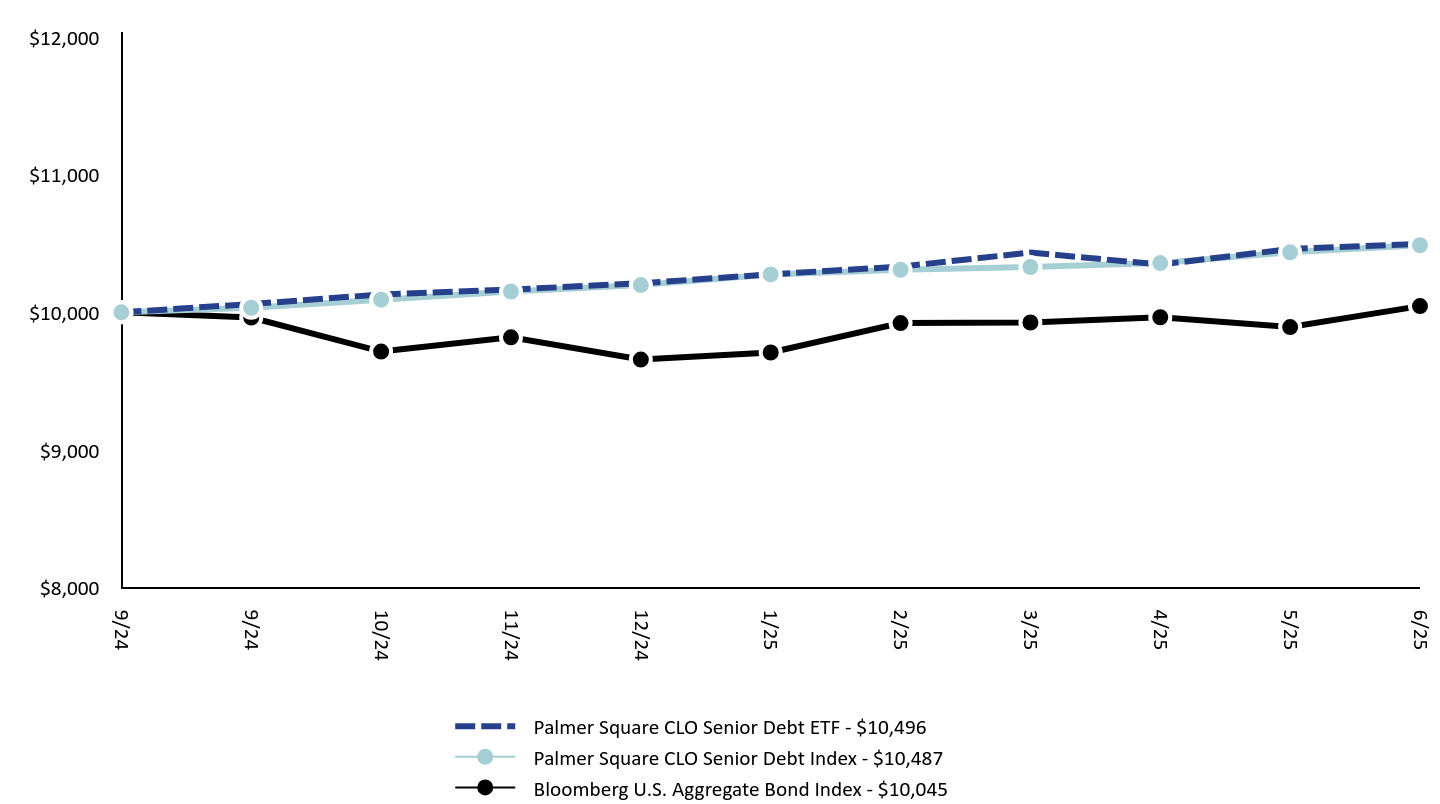
Management's Discussion of Fund Performance Summary of Results The investment objective of the Palmer Square CLO Senior Debt ETF (“PSQA”) is to seek to provide investment results that correspond generally to the price and yield (before the Fund’s fees and expenses) of Palmer Square CLO Senior Debt Index. For the period ended on June 30, 2025, the Palmer Square CLO Senior Debt ETF returned 4.96% (net of fees) (NAV). While the Palmer Square CLO Senior Debt Index, PSQA’s benchmark, returned 4.87%, and the broad based Bloomberg Aggregate Bond Index returned 0.45% over the same time period. Top Performance Contributors The positive absolute performance since inception was driven by current income from floating rate securities with exposure to high base rates. PSQA invests primarily in Collateralized Loan Obligations ("CLO") Debt (specifically CLO AAA and CLO AA holdings). Short duration CLO AAA current yields are generally 5.25-5.75%, which appear very high and compelling compared to historical rates and have been benefiting from elevated rates. Top Performance Detractors Each of PSQA’s sector allocations provided a positive contribution to performance. Current Positioning The Fund closed the fiscal year with an 82% allocation to AAA CLO Debt and an 18% allocation to AA CLO Debt. The size of the CLO market continues to grow in the U.S. and has surpassed $1 trillion and $1.4 trillion globally, which is now the largest credit sector within securitized products. Demand continued in 2025 with $96.8B in new issues (-4% Year-over-Year) and $159B in Refinancings/Resets. Based on this backdrop, the management team is confident they can continue to manage the Fund to correspond generally to the price and yield (before the Fund’s fees and expenses) of Palmer Square CLO Senior Debt Index. |
| Line Graph [Table Text Block] |
| Palmer Square CLO Senior Debt ETF | Palmer Square CLO Senior Debt Index | Bloomberg U.S. Aggregate Bond Index |
|---|
9/24 | $10,000 | $10,000 | $10,000 |
|---|
9/24 | $10,060 | $10,033 | $9,962 |
|---|
10/24 | $10,130 | $10,092 | $9,715 |
|---|
11/24 | $10,165 | $10,151 | $9,818 |
|---|
12/24 | $10,211 | $10,198 | $9,657 |
|---|
1/25 | $10,276 | $10,275 | $9,708 |
|---|
2/25 | $10,332 | $10,309 | $9,922 |
|---|
3/25 | $10,434 | $10,329 | $9,926 |
|---|
4/25 | $10,347 | $10,358 | $9,964 |
|---|
5/25 | $10,460 | $10,436 | $9,893 |
|---|
6/25 | $10,496 | $10,487 | $10,045 |
|---|
|
| Average Annual Return [Table Text Block] |
Fund/Index Name | Since
Inception
(9/11/24) |
|---|
Palmer Square CLO Senior Debt ETF | 4.96% |
|---|
Palmer Square CLO Senior Debt Index | 4.87% |
|---|
Bloomberg U.S. Aggregate Bond Index | 0.45% |
|---|
|
| Performance Inception Date |
Sep. 11, 2024
|
| AssetsNet |
$ 35,438,723
|
| Holdings Count | Holding |
50
|
| Advisory Fees Paid, Amount |
$ 39,279
|
| InvestmentCompanyPortfolioTurnover |
68.00%
|
| Additional Fund Statistics [Text Block] |
Net Assets | $35,438,723 |
|---|
Investment advisory fees paid | $39,279 |
|---|
Total Number of Portfolio Holdings | 50 |
|---|
Portfolio Turnover Rate | 68% |
|---|
|
| Holdings [Text Block] |
Ratings Summary* (% of Total Investments) AAA | 80.0% |
|---|
AA | 20.0% |
|---|
|
|---|
* Credit quality ratings reflect the middle rating received from Moody’s, Standard & Poor's and Fitch, where all three agencies have provided a rating. If only two agencies rate a security, the lowest rating is used. If only one agency rates a security, that rating is used. Ratings are measured on a scale that ranges from AAA (highest) to D (lowest). |
|---|
|
| Largest Holdings [Text Block] |
Top 10 Issuers (% of net assets) Bain Capital Credit CLO Ltd. | 10.4% |
|---|
CIFC Funding Ltd. | 9.5% |
|---|
Neuberger Berman Loan Advisers CLO Ltd. | 6.8% |
|---|
Dryden CLO Ltd. | 5.7% |
|---|
Dryden Senior Loan Fund | 4.2% |
|---|
Thompson Park CLO Ltd. | 4.2% |
|---|
Palmer Square CLO Ltd. | 3.9% |
|---|
Madison Park Funding Ltd. | 3.5% |
|---|
CarVal CLO VII-C Ltd. | 2.8% |
|---|
Apidos CLO XVIII-R | 2.8% |
|---|
|
| Material Fund Change [Text Block] |
The Fund did not have any material changes that occurred since the beginning of the reporting period. |
| C000249932 |
|
| Shareholder Report [Line Items] |
|
| Fund Name |
Palmer Square Credit Opportunities ETF
|
| Trading Symbol |
PSQO
|
| Security Exchange Name |
NYSEArca
|
| Annual or Semi-Annual Statement [Text Block] |
This annual shareholder report contains important information about the Palmer Square Credit Opportunities ETF ("Fund") for the period of September 11, 2024 (inception) to June 30, 2025.
|
| Shareholder Report Annual or Semi-Annual |
Annual Shareholder Report
|
| Additional Information [Text Block] |
You can find additional information about the Fund at https://etf.palmersquarefunds.com/funds/us-etfs/palmer-square-us-etfs. You can also request this information by contacting us at (855) 513-9988.
|
| Material Fund Change Notice [Text Block] |
The Fund did not have any material changes that occurred since the beginning of the reporting period.
|
| Additional Information Phone Number |
(855) 513-9988
|
| Additional Information Website |
https://etf.palmersquarefunds.com/funds/us-etfs/palmer-square-us-etfs
|
| Expenses [Text Block] |
What were the Fund costs for the last year?(Based on a hypothetical $10,000 investment) Ticker | Costs of a $10,000 investmentFootnote Reference* | Costs paid as a percentage of a $10,000 investmentFootnote Reference† |
|---|
PSQO | $40 | 0.50% |
|---|
| Footnote | Description | Footnote* | Amount shown reflects the expenses of the Fund from inception date through June 30, 2025. Expenses would be higher if the Fund had been in operation for the full year. | Footnote† | Annualized. |
|
| Expenses Paid, Amount |
$ 40
|
| Expense Ratio, Percent |
0.50%
|
| Expenses Short Period Footnote [Text Block] |
Amount shown reflects the expenses of the Fund from inception date through June 30, 2025. Expenses would be higher if the Fund had been in operation for the full year.
|
| Factors Affecting Performance [Text Block] |
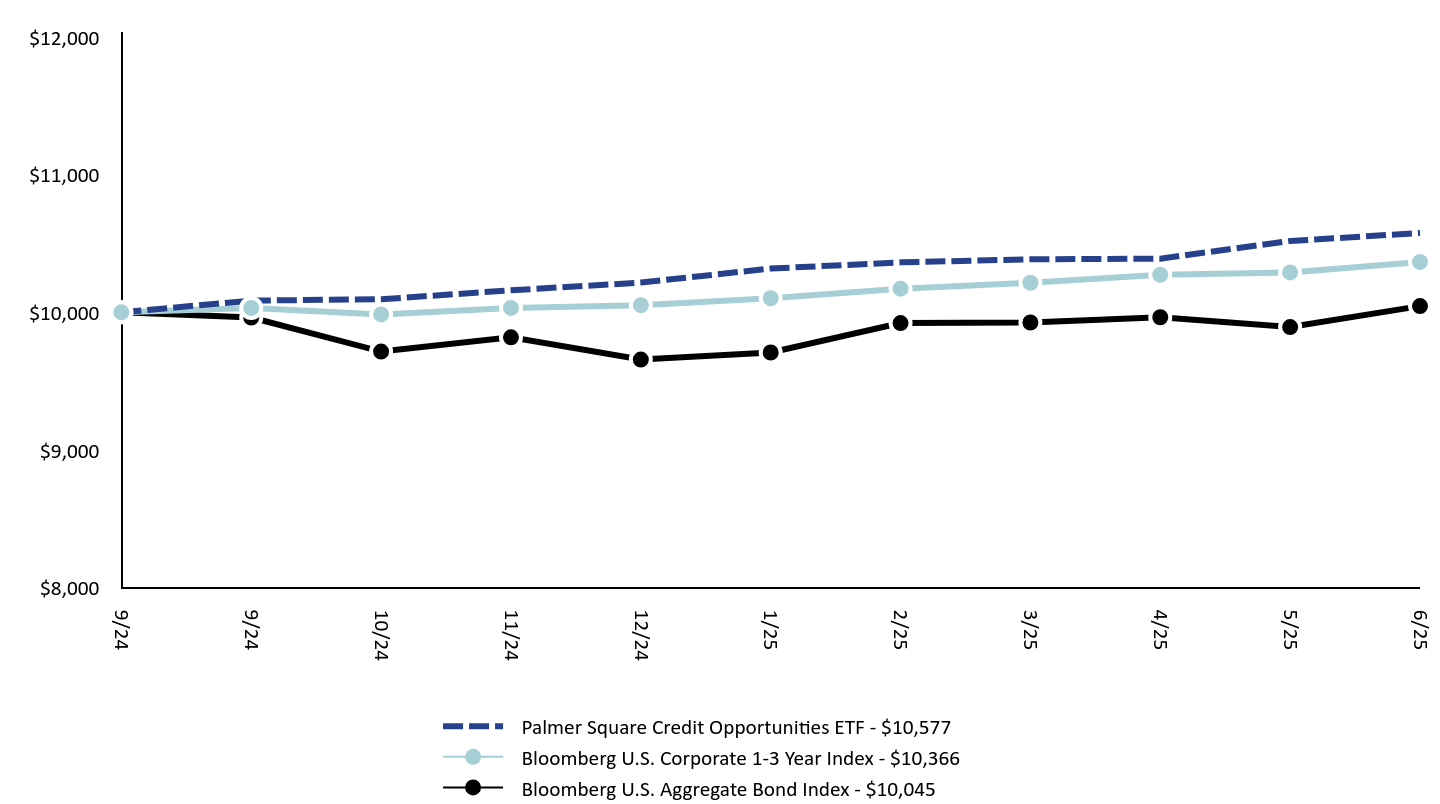
Management's Discussion of Fund Performance Summary of Results The investment objective of the Palmer Square Credit Opportunities ETF (“PSQO”) is to seek a high level of current income. PSQO also seeks long-term capital appreciation as a secondary objective. In seeking to achieve that investment objective, the Investment Team employs a flexible mandate that will be allocated across a diverse mix of relative value credit opportunities within CLOs, corporate credit, asset-backed securities, and bank loans. For the period ended on June 30, 2025, the Palmer Square Credit Opportunities ETF returned 5.77% (net of fees) (NAV). While the Bloomberg 1-3 Year U.S. Corporate Index, PSQO’s benchmark, returned 3.65%, and the broad based Bloomberg Aggregate Bond Index returned 0.45% over the same time period. Top Performance Contributors The positive absolute performance since inception was driven mostly by current income from floating rate securities with exposure to high base rates. Collateralized Loan Obligations ("CLO") Debt (specifically CLO AAA and CLO BBB holdings) provided the greatest positive contribution. The Fund’s corporate bonds exposure, both investment grade and high yield ("HY"), provided the second greatest positive contribution. U.S. Treasury, Asset-Backed Securities and Bank Loans holdings also provided positive contributions. Top Performance Detractors Each of PSQO’s sector allocations provided a positive contribution to performance. Current Positioning The Fund closed the fiscal year conservatively positioned. CLO debt remains the largest allocation and exposure in the capital stack is primarily split between AAA and BBB, with the remainder in BB. Investment Grade Corporate Debt is the second largest allocation and is concentrated in 2- and 3-year bonds. High yield ("HY") Corporate Debt is the next largest allocation and is likely to remain at or near current levels with a focus on idiosyncratic total return opportunities. ABS, Bank Loans and Treasury are the smallest allocations. In ABS, we continue to like prime consumer borrowers while subprime consumers continue to struggle with higher inflation. Finally, the Fund maintained our constructive stance on higher quality U.S. bank loans and expect to keep allocations near current levels in the near term. |
| Line Graph [Table Text Block] |
| Palmer Square Credit Opportunities ETF | Bloomberg U.S. Corporate 1-3 Year Index | Bloomberg U.S. Aggregate Bond Index |
|---|
9/24 | $10,000 | $10,000 | $10,000 |
|---|
9/24 | $10,085 | $10,032 | $9,962 |
|---|
10/24 | $10,095 | $9,985 | $9,715 |
|---|
11/24 | $10,160 | $10,032 | $9,818 |
|---|
12/24 | $10,216 | $10,052 | $9,657 |
|---|
1/25 | $10,318 | $10,102 | $9,708 |
|---|
2/25 | $10,363 | $10,172 | $9,922 |
|---|
3/25 | $10,385 | $10,215 | $9,926 |
|---|
4/25 | $10,390 | $10,273 | $9,964 |
|---|
5/25 | $10,518 | $10,290 | $9,893 |
|---|
6/25 | $10,577 | $10,366 | $10,045 |
|---|
|
| Average Annual Return [Table Text Block] |
Fund/Index Name | Since
Inception
(9/11/24) |
|---|
Palmer Square Credit Opportunities ETF | 5.77% |
|---|
Bloomberg U.S. Corporate 1-3 Year Index | 3.65% |
|---|
Bloomberg U.S. Aggregate Bond Index | 0.45% |
|---|
|
| Performance Inception Date |
Sep. 11, 2024
|
| AssetsNet |
$ 75,812,978
|
| Holdings Count | Holding |
282
|
| Advisory Fees Paid, Amount |
$ 140,290
|
| InvestmentCompanyPortfolioTurnover |
100.00%
|
| Additional Fund Statistics [Text Block] |
Net Assets | $75,812,978 |
|---|
Investment advisory fees paid | $140,290 |
|---|
Total Number of Portfolio Holdings | 282 |
|---|
Portfolio Turnover Rate | 100% |
|---|
|
| Holdings [Text Block] |
Investment Type (% of net assets) Collateralized Loan Obligations | 52.3% |
|---|
Corporate Bonds | 24.7% |
|---|
Asset-Backed Securities | 10.0% |
|---|
Bank Loans | 8.2% |
|---|
U.S. Government and Agency Securities | 1.8% |
|---|
Commercial Mortgage-Backed Securities | 0.3% |
|---|
Short term Investment | 14.2% |
|---|
|
| Largest Holdings [Text Block] |
Top 10 Issuers (% of net assets) Elmwood CLO Ltd. | 8.3% |
|---|
Golub Capital Partners Static Ltd. | 4.3% |
|---|
Neuberger Berman Loan Advisers CLO Ltd. | 3.6% |
|---|
Rad CLO Ltd. | 3.0% |
|---|
OCP CLO Ltd. | 2.7% |
|---|
Oaktree CLO Ltd. | 2.6% |
|---|
Shackleton CLO Ltd. | 2.2% |
|---|
Dryden Senior Loan Fund | 1.8% |
|---|
U.S. Treasury Notes | 1.8% |
|---|
Empower CLO Ltd. | 1.7% |
|---|
|
| Material Fund Change [Text Block] |
The Fund did not have any material changes that occurred since the beginning of the reporting period. |