Shareholder Report
Jun. 30, 2025
USD ($)
Holding
Shareholder Report |
6 Months Ended |
|---|---|
|
Jun. 30, 2025
USD ($)
Holding
| |
| Shareholder Report [Line Items] | |
| Document Type | N-CSRS |
| Amendment Flag | false |
| Registrant Name | Lazard Active ETF Trust |
| Entity Central Index Key | 0002051630 |
| Entity Investment Company Type | N-1A |
| Document Period End Date | Jun. 30, 2025 |
| C000259181 | |
| Shareholder Report [Line Items] | |
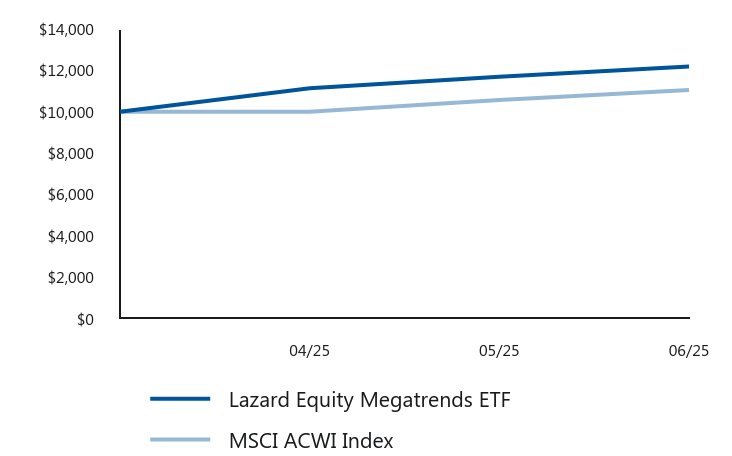
| Fund Name | Lazard Equity Megatrends ETF |
| Trading Symbol | THMZ |
| Security Exchange Name | NASDAQ |
| Annual or Semi-Annual Statement [Text Block] | This semi-annual shareholder report contains important information about the Lazard Equity Megatrends ETF for the period of April 7, 2025 to June 30, 2025. |
| Shareholder Report Annual or Semi-Annual | Semi-Annual Shareholder Report |
| Additional Information [Text Block] | You can find additional information about the Portfolio at https://www.lazardassetmanagement.com/us/en_us/investment-solutions/how-to-invest/etfs#tsr. You can also request this information by contacting us at Contact.US@Lazard.com or (800) 823-6300. |
| Additional Information Phone Number | (800) 823-6300 |
| Additional Information Email | <span style="box-sizing: border-box; color: rgb(0, 83, 154); display: inline; flex-wrap: nowrap; font-size: 10.6667px; font-weight: 400; grid-area: auto; line-height: 16px; margin: 0px; overflow: visible; text-align: left; text-align-last: auto; white-space-collapse: preserve-breaks;">Contact.US@Lazard.com</span> |
| Additional Information Website | <span style="box-sizing: border-box; color: rgb(0, 83, 154); display: inline; flex-wrap: nowrap; font-size: 10.6667px; font-weight: 400; grid-area: auto; line-height: 16px; margin: 0px; overflow: visible; text-align: left; text-align-last: auto; white-space-collapse: preserve-breaks;">https://www.lazardassetmanagement.com/us/en_us/investment-solutions/how-to-invest/etfs#tsr</span> |
| Expenses [Text Block] | |
| Expenses Paid, Amount | $ 13 |
| Expense Ratio, Percent | 0.50% |
| Performance Past Does Not Indicate Future [Text] | Past performance does not guarantee future results. |
| Line Graph [Table Text Block] | |
| Average Annual Return [Table Text Block] | |
| Performance Inception Date | Apr. 07, 2025 |
| AssetsNet | $ 36,296,951 |
| Holdings Count | Holding | 55 |
| Advisory Fees Paid, Amount | $ 39,600 |
| InvestmentCompanyPortfolioTurnover | 2.00% |
| Additional Fund Statistics [Text Block] | |
| Holdings [Text Block] | |
| Largest Holdings [Text Block] | |
| C000259182 | |
| Shareholder Report [Line Items] | |
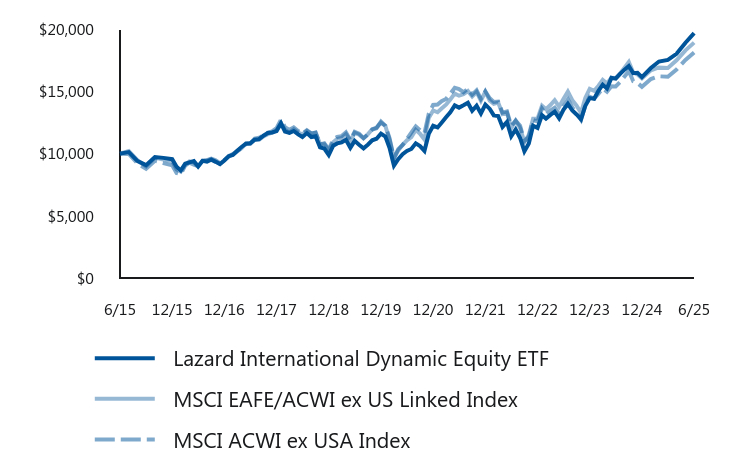
| Fund Name | Lazard International Dynamic Equity ETF |
| Trading Symbol | IEQ |
| Security Exchange Name | NYSEArca |
| Annual or Semi-Annual Statement [Text Block] | This semi-annual shareholder report contains important information about the Lazard International Dynamic Equity ETF for the period of January 1, 2025 to June 30, 2025. |
| Shareholder Report Annual or Semi-Annual | Semi-Annual Shareholder Report |
| Additional Information [Text Block] | You can find additional information about the Portfolio at https://www.lazardassetmanagement.com/us/en_us/investment-solutions/how-to-invest/etfs#tsr. You can also request this information by contacting us at Contact.US@Lazard.com or (800) 823-6300. |
| Additional Information Phone Number | (800) 823-6300 |
| Additional Information Email | <span style="box-sizing: border-box; color: rgb(0, 83, 154); display: inline; flex-wrap: nowrap; font-size: 10.6667px; font-weight: 400; grid-area: auto; line-height: 16px; margin: 0px; overflow: visible; text-align: left; text-align-last: auto; white-space-collapse: preserve-breaks;">Contact.US@Lazard.com</span> |
| Additional Information Website | <span style="box-sizing: border-box; color: rgb(0, 83, 154); display: inline; flex-wrap: nowrap; font-size: 10.6667px; font-weight: 400; grid-area: auto; line-height: 16px; margin: 0px; overflow: visible; text-align: left; text-align-last: auto; white-space-collapse: preserve-breaks;">https://www.lazardassetmanagement.com/us/en_us/investment-solutions/how-to-invest/etfs#tsr</span> |
| Expenses [Text Block] | |
| Expenses Paid, Amount | $ 65 |
| Expense Ratio, Percent | 1.18% |
| Performance Past Does Not Indicate Future [Text] | Past performance does not guarantee future results. |
| Line Graph [Table Text Block] | |
| Average Annual Return [Table Text Block] | |
| AssetsNet | $ 39,519,963 |
| Holdings Count | Holding | 260 |
| Advisory Fees Paid, Amount | $ 61,394 |
| InvestmentCompanyPortfolioTurnover | 61.00% |
| Additional Fund Statistics [Text Block] | |
| Holdings [Text Block] | |
| Largest Holdings [Text Block] | |
| C000259183 | |
| Shareholder Report [Line Items] | |
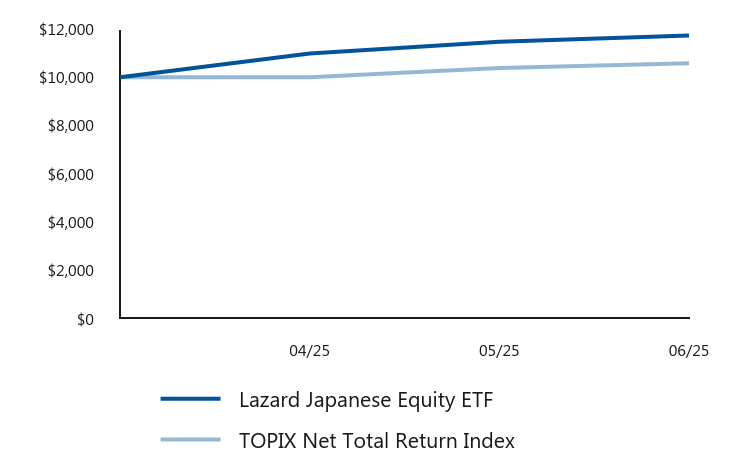
| Fund Name | Lazard Japanese Equity ETF |
| Trading Symbol | JPY |
| Security Exchange Name | NASDAQ |
| Annual or Semi-Annual Statement [Text Block] | This semi-annual shareholder report contains important information about the Lazard Japanese Equity ETF for the period of April 7, 2025 to June 30, 2025. |
| Shareholder Report Annual or Semi-Annual | Semi-Annual Shareholder Report |
| Additional Information [Text Block] | You can find additional information about the Portfolio at https://www.lazardassetmanagement.com/us/en_us/investment-solutions/how-to-invest/etfs#tsr. You can also request this information by contacting us at Contact.US@Lazard.com or (800) 823-6300. |
| Additional Information Phone Number | (800) 823-6300 |
| Additional Information Email | <span style="box-sizing: border-box; color: rgb(0, 83, 154); display: inline; flex-wrap: nowrap; font-size: 10.6667px; font-weight: 400; grid-area: auto; line-height: 16px; margin: 0px; overflow: visible; text-align: left; text-align-last: auto; white-space-collapse: preserve-breaks;">Contact.US@Lazard.com</span> |
| Additional Information Website | <span style="box-sizing: border-box; color: rgb(0, 83, 154); display: inline; flex-wrap: nowrap; font-size: 10.6667px; font-weight: 400; grid-area: auto; line-height: 16px; margin: 0px; overflow: visible; text-align: left; text-align-last: auto; white-space-collapse: preserve-breaks;">https://www.lazardassetmanagement.com/us/en_us/investment-solutions/how-to-invest/etfs#tsr</span> |
| Expenses [Text Block] | |
| Expenses Paid, Amount | $ 15 |
| Expense Ratio, Percent | 0.60% |
| Performance Past Does Not Indicate Future [Text] | Past performance does not guarantee future results. |
| Line Graph [Table Text Block] | |
| Average Annual Return [Table Text Block] | |
| Performance Inception Date | Apr. 07, 2025 |
| AssetsNet | $ 37,366,254 |
| Holdings Count | Holding | 59 |
| Advisory Fees Paid, Amount | $ 48,240 |
| InvestmentCompanyPortfolioTurnover | 3.00% |
| Additional Fund Statistics [Text Block] | |
| Holdings [Text Block] | |
| Largest Holdings [Text Block] | |
| C000259184 | |
| Shareholder Report [Line Items] | |
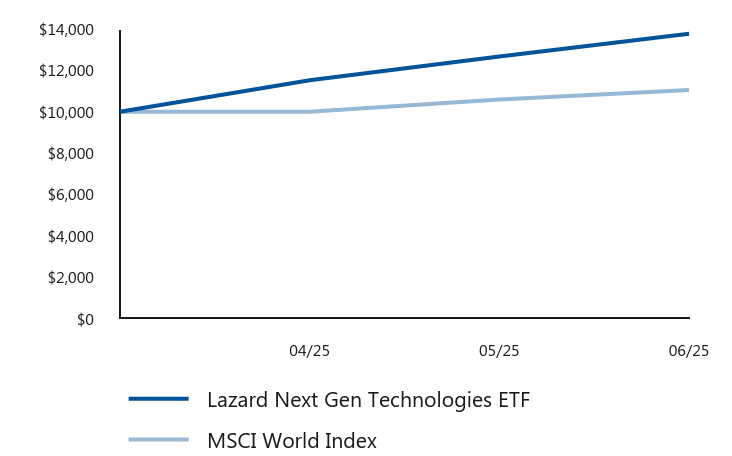
| Fund Name | Lazard Next Gen Technologies ETF |
| Trading Symbol | TEKY |
| Security Exchange Name | NASDAQ |
| Annual or Semi-Annual Statement [Text Block] | This semi-annual shareholder report contains important information about the Lazard Next Gen Technologies ETF for the period of April 7, 2025 to June 30, 2025. |
| Shareholder Report Annual or Semi-Annual | Semi-Annual Shareholder Report |
| Additional Information [Text Block] | You can find additional information about the Portfolio at https://www.lazardassetmanagement.com/us/en_us/investment-solutions/how-to-invest/etfs#tsr. You can also request this information by contacting us at Contact.US@Lazard.com or (800) 823-6300. |
| Additional Information Phone Number | (800) 823-6300 |
| Additional Information Email | <span style="box-sizing: border-box; color: rgb(0, 83, 154); display: inline; flex-wrap: nowrap; font-size: 10.6667px; font-weight: 400; grid-area: auto; line-height: 16px; margin: 0px; overflow: visible; text-align: left; text-align-last: auto; white-space-collapse: preserve-breaks;">Contact.US@Lazard.com</span> |
| Additional Information Website | <span style="box-sizing: border-box; color: rgb(0, 83, 154); display: inline; flex-wrap: nowrap; font-size: 10.6667px; font-weight: 400; grid-area: auto; line-height: 16px; margin: 0px; overflow: visible; text-align: left; text-align-last: auto; white-space-collapse: preserve-breaks;">https://www.lazardassetmanagement.com/us/en_us/investment-solutions/how-to-invest/etfs#tsr</span> |
| Expenses [Text Block] | |
| Expenses Paid, Amount | $ 14 |
| Expense Ratio, Percent | 0.50% |
| Performance Past Does Not Indicate Future [Text] | Past performance does not guarantee future results. |
| Line Graph [Table Text Block] | |
| Average Annual Return [Table Text Block] | |
| Performance Inception Date | Apr. 07, 2025 |
| AssetsNet | $ 43,697,172 |
| Holdings Count | Holding | 57 |
| Advisory Fees Paid, Amount | $ 42,815 |
| InvestmentCompanyPortfolioTurnover | 1.00% |
| Additional Fund Statistics [Text Block] | |
| Holdings [Text Block] | |
| Largest Holdings [Text Block] |