Shareholder Report
Jun. 30, 2025
USD ($)
Holding
WHAT WERE THE FUND COSTS FOR THE LAST SIX MONTHS?
(Based on a hypothetical $10,000 investment)
| Fund | Costs of a $10,000 investment | Costs paid as a percentage of a $10,000 investment |
| First Trust BuyWrite Income ETF | $38 | 0.75%(1) |
|
(1) |
Annualized. |
KEY FUND STATISTICS (As of June 30, 2025)
| Fund net assets | $1,372,041,383 |
| Total number of portfolio holdings | 223 |
| Portfolio turnover rate | 32% |
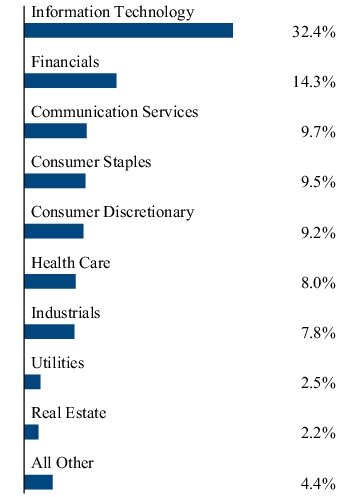
WHAT DID THE FUND INVEST IN? (As of June 30, 2025)
The tables below show the investment makeup of the Fund, representing the percentage of total investments of the Fund.
Top Ten Holdings
| Microsoft Corp. | 7.0% |
| NVIDIA Corp. | 6.6% |
| Apple, Inc. | 5.5% |
| Amazon.com, Inc. | 3.3% |
| Meta Platforms, Inc., Class A | 3.1% |
| Broadcom, Inc. | 2.6% |
| Alphabet, Inc., Class A | 1.7% |
| JPMorgan Chase & Co. | 1.6% |
| Alphabet, Inc., Class C | 1.4% |
| CME Group, Inc. | 1.2% |
Sector Allocation
Top Ten Holdings
| Microsoft Corp. | 7.0% |
| NVIDIA Corp. | 6.6% |
| Apple, Inc. | 5.5% |
| Amazon.com, Inc. | 3.3% |
| Meta Platforms, Inc., Class A | 3.1% |
| Broadcom, Inc. | 2.6% |
| Alphabet, Inc., Class A | 1.7% |
| JPMorgan Chase & Co. | 1.6% |
| Alphabet, Inc., Class C | 1.4% |
| CME Group, Inc. | 1.2% |
WHAT WERE THE FUND COSTS FOR THE LAST SIX MONTHS?
(Based on a hypothetical $10,000 investment)
| Fund | Costs of a $10,000 investment | Costs paid as a percentage of a $10,000 investment |
| First Trust Nasdaq BuyWrite Income ETF | $37 | 0.75%(1) |
|
(1) |
Annualized. |
KEY FUND STATISTICS (As of June 30, 2025)
| Fund net assets | $625,904,790 |
| Total number of portfolio holdings | 194 |
| Portfolio turnover rate | 38% |
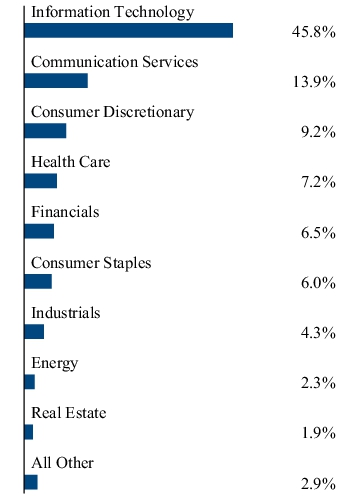
WHAT DID THE FUND INVEST IN? (As of June 30, 2025)
The tables below show the investment makeup of the Fund, representing the percentage of total investments of the Fund.
Top Ten Holdings
| Microsoft Corp. | 7.4% |
| NVIDIA Corp. | 7.1% |
| Apple, Inc. | 6.9% |
| Broadcom, Inc. | 4.5% |
| Meta Platforms, Inc., Class A | 4.3% |
| Amazon.com, Inc. | 4.1% |
| Netflix, Inc. | 3.4% |
| Advanced Micro Devices, Inc. | 2.9% |
| Tesla, Inc. | 2.9% |
| Costco Wholesale Corp. | 2.6% |
Sector Allocation
Top Ten Holdings
| Microsoft Corp. | 7.4% |
| NVIDIA Corp. | 7.1% |
| Apple, Inc. | 6.9% |
| Broadcom, Inc. | 4.5% |
| Meta Platforms, Inc., Class A | 4.3% |
| Amazon.com, Inc. | 4.1% |
| Netflix, Inc. | 3.4% |
| Advanced Micro Devices, Inc. | 2.9% |
| Tesla, Inc. | 2.9% |
| Costco Wholesale Corp. | 2.6% |
WHAT WERE THE FUND COSTS FOR THE LAST SIX MONTHS?
(Based on a hypothetical $10,000 investment)
| Fund | Costs of a $10,000 investment | Costs paid as a percentage of a $10,000 investment |
| First Trust Dorsey Wright DALI Equity ETF | $15(1) | 0.30%(1) (2) |
|
(1) |
Excludes any Acquired Fund Fees and Expenses of underlying investment companies in which the Fund invests. |
|
(2) |
Annualized. |
KEY FUND STATISTICS (As of June 30, 2025)
| Fund net assets | $111,144,010 |
| Total number of portfolio holdings | 8 |
| Portfolio turnover rate | 27% |
WHAT DID THE FUND INVEST IN? (As of June 30, 2025)
The table below shows the investment makeup of the Fund, representing the percentage of total investments of the Fund.
Top Ten Holdings
| First Trust Small Cap Growth AlphaDEX® Fund | 18.2% |
| First Trust Large Cap Growth AlphaDEX® Fund | 18.0% |
| First Trust Dow Jones Internet Index Fund | 14.1% |
| First Trust Financials AlphaDEX® Fund | 12.8% |
| First Trust Industrials/Producer Durables AlphaDEX® Fund | 12.8% |
| First Trust NASDAQ-100 Ex-Technology Sector Index Fund | 12.3% |
| First Trust Utilities AlphaDEX® Fund | 11.7% |
| Dreyfus Government Cash Management Fund, Institutional Shares, Class I | 0.1% |
WHAT WERE THE FUND COSTS FOR THE LAST SIX MONTHS?
(Based on a hypothetical $10,000 investment)
| Fund | Costs of a $10,000 investment | Costs paid as a percentage of a $10,000 investment |
| First Trust Small Cap BuyWrite Income ETF | $29(1) | 0.85%(2) |
|
(1) |
The Fund commenced investment operations on February 26, 2025. Had the Fund been in operation for a complete six months, the cost of a $10,000 investment would have been higher. |
|
(2) |
Annualized. |
KEY FUND STATISTICS (As of June 30, 2025)
| Fund net assets | $938,335 |
| Total number of portfolio holdings | 234 |
| Portfolio turnover rate | 63% |
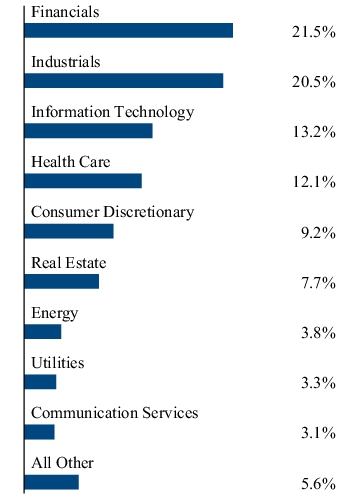
WHAT DID THE FUND INVEST IN? (As of June 30, 2025)
The tables below show the investment makeup of the Fund, representing the percentage of total investments of the Fund.
Top Ten Holdings
| Argan, Inc. | 1.2% |
| Integer Holdings Corp. | 1.2% |
| AGNC Investment Corp. | 1.2% |
| Bentley Systems, Inc., Class B | 1.1% |
| Agree Realty Corp. | 1.1% |
| Monarch Casino & Resort, Inc. | 1.1% |
| CareTrust REIT, Inc. | 1.0% |
| Graco, Inc. | 1.0% |
| AptarGroup, Inc. | 1.0% |
| Stride, Inc. | 1.0% |
Sector Allocation
Top Ten Holdings
| Argan, Inc. | 1.2% |
| Integer Holdings Corp. | 1.2% |
| AGNC Investment Corp. | 1.2% |
| Bentley Systems, Inc., Class B | 1.1% |
| Agree Realty Corp. | 1.1% |
| Monarch Casino & Resort, Inc. | 1.1% |
| CareTrust REIT, Inc. | 1.0% |
| Graco, Inc. | 1.0% |
| AptarGroup, Inc. | 1.0% |
| Stride, Inc. | 1.0% |
| [1] | Annualized. |
| [2] | Annualized. |
| [3] | Excludes any Acquired Fund Fees and Expenses of underlying investment companies in which the Fund invests. |
| [4] | Annualized. |
| [5] | The Fund commenced investment operations on February 26, 2025. Had the Fund been in operation for a complete six months, the cost of a $10,000 investment would have been higher. |
| [6] | Annualized. |