Shareholder Report
|
6 Months Ended |
|
Jun. 30, 2025
USD ($)
Holding
|
|---|
| Shareholder Report [Line Items] |
|
|
| Document Type |
N-CSRS
|
|
| Amendment Flag |
false
|
|
| Registrant Name |
First Trust Exchange-Traded Fund VII
|
|
| Entity Central Index Key |
0001561785
|
|
| Entity Investment Company Type |
N-1A
|
|
| Document Period End Date |
Jun. 30, 2025
|
|
| C000122820 [Member] |
|
|
| Shareholder Report [Line Items] |
|
|
| Fund Name |
First Trust Global Tactical Commodity Strategy Fund
|
|
| Class Name |
First Trust Global Tactical Commodity Strategy Fund
|
|
| Trading Symbol |
FTGC
|
|
| Security Exchange Name |
NASDAQ
|
|
| Annual or Semi-Annual Statement [Text Block] |
This semi-annual shareholder report contains important information about the First Trust Global Tactical Commodity Strategy Fund (the “Fund”) for the period of January 1, 2025 to June 30, 2025.
|
|
| Shareholder Report Annual or Semi-Annual |
semi-annual shareholder report
|
|
| Additional Information [Text Block] |
You can find additional information about the Fund at www.ftportfolios.com/fund-documents/etf/FTGC. You can also request this information by contacting us at 1-800-621-1675 or info@ftportfolios.com.
|
|
| Additional Information Phone Number |
1-800-621-1675
|
|
| Additional Information Email |
info@ftportfolios.com
|
|
| Additional Information Website |
www.ftportfolios.com/fund-documents/etf/FTGC
|
|
| Expenses [Text Block] |
WHAT WERE THE FUND COSTS FOR THE LAST SIX MONTHS? (Based on a hypothetical $10,000 investment)
| Fund |
Costs of a $10,000 investment |
Costs paid as a percentage
of a $10,000 investment |
| First Trust Global Tactical Commodity Strategy Fund |
$48 |
0.95%(1) |
|
|
| Expenses Paid, Amount |
$ 48
|
|
| Expense Ratio, Percent |
0.95%
|
[1] |
| Net Assets |
$ 2,388,110,131
|
|
| Holdings Count | Holding |
44
|
|
| Investment Company Portfolio Turnover |
14.00%
|
|
| Additional Fund Statistics [Text Block] |
KEY FUND STATISTICS (As of June 30, 2025)
| Fund net assets |
$2,388,110,131 |
| Total number of portfolio holdings |
44 |
| Portfolio turnover rate |
14% |
|
|
| Holdings [Text Block] |
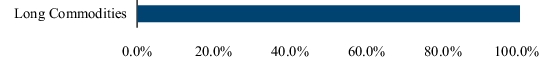
WHAT DID THE FUND INVEST IN? (As of June 30, 2025) The tables below show the investment makeup of the Fund, representing the percentage of net assets and percentage of total exposure of the Fund, respectively. Fund Allocation
| U.S. Government Bonds and Notes |
38.2% |
| U.S. Treasury Bills |
23.8% |
| Money Market Funds |
35.1% |
| Net Other Assets and Liabilities(1) |
2.9% |
| Total |
100.0% | FUTURES EXPOSURE (2) (1) Includes variation margin on futures contracts. (2) Futures exposure is calculated on the notional value as a percentage of total notional exposure.
|
|
| C000168150 [Member] |
|
|
| Shareholder Report [Line Items] |
|
|
| Fund Name |
First Trust Alternative Absolute Return Strategy ETF
|
|
| Class Name |
First Trust Alternative Absolute Return Strategy ETF
|
|
| Trading Symbol |
FAAR
|
|
| Security Exchange Name |
NASDAQ
|
|
| Annual or Semi-Annual Statement [Text Block] |
This semi-annual shareholder report contains important information about the First Trust Alternative Absolute Return Strategy ETF (the “Fund”) for the period of January 1, 2025 to June 30, 2025.
|
|
| Shareholder Report Annual or Semi-Annual |
semi-annual shareholder report
|
|
| Additional Information [Text Block] |
You can find additional information about the Fund at www.ftportfolios.com/fund-documents/etf/FAAR. You can also request this information by contacting us at 1-800-621-1675 or info@ftportfolios.com.
|
|
| Additional Information Phone Number |
1-800-621-1675
|
|
| Additional Information Email |
info@ftportfolios.com
|
|
| Additional Information Website |
www.ftportfolios.com/fund-documents/etf/FAAR
|
|
| Expenses [Text Block] |
WHAT WERE THE FUND COSTS FOR THE LAST SIX MONTHS? (Based on a hypothetical $10,000 investment)
| Fund |
Costs of a $10,000 investment |
Costs paid as a percentage
of a $10,000 investment |
| First Trust Alternative Absolute Return Strategy ETF |
$47 |
0.95%(1) |
|
|
| Expenses Paid, Amount |
$ 47
|
|
| Expense Ratio, Percent |
0.95%
|
[2] |
| Net Assets |
$ 98,354,468
|
|
| Holdings Count | Holding |
34
|
|
| Investment Company Portfolio Turnover |
0.00%
|
|
| Additional Fund Statistics [Text Block] |
KEY FUND STATISTICS (As of June 30, 2025)
| Fund net assets |
$98,354,468 |
| Total number of portfolio holdings |
34 |
| Portfolio turnover rate |
0% |
|
|
| Holdings [Text Block] |
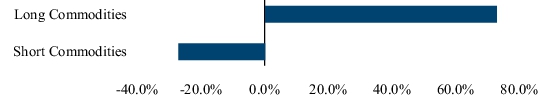
WHAT DID THE FUND INVEST IN? (As of June 30, 2025) The tables below show the investment makeup of the Fund, representing the percentage of net assets and percentage of total exposure of the Fund, respectively. Fund Allocation
| U.S. Government Bonds and Notes |
53.0% |
| U.S. Treasury Bills |
13.2% |
| Money Market Funds |
37.7% |
| Net Other Assets and Liabilities(1) |
(3.9%) |
| Total |
100.0% | FUTURES EXPOSURE (2) (1) Includes variation margin on futures contracts. (2) Futures exposure is calculated on the notional value as a percentage of total notional exposure.
|
|
|
|