Shareholder Report
|
12 Months Ended |
|
Jun. 30, 2025
USD ($)
Holding
|
|---|
| Shareholder Report [Line Items] |
|
| Document Type |
N-CSR
|
| Amendment Flag |
false
|
| Registrant Name |
Victory Portfolios
|
| Entity Central Index Key |
0000802716
|
| Entity Investment Company Type |
N-1A
|
| Document Period End Date |
Jun. 30, 2025
|
| C000145004 |
|
| Shareholder Report [Line Items] |
|
| Fund Name |
Victory Integrity Discovery Fund
|
| Class Name |
Class A
|
| Trading Symbol |
MMEAX
|
| Annual or Semi-Annual Statement [Text Block] |
Annual Shareholder Report
|
| Shareholder Report Annual or Semi-Annual |
annual shareholder report
|
| Additional Information [Text Block] |
You can find additional information about the Fund at advisor.vcm.com/literature/mutual-fund-prospectuses. You may also request more information by calling 800-539-3863 or visiting vcm.com/contact-us.
|
| Additional Information Phone Number |
800-539-3863
|
| Additional Information Website |
vcm.com
|
| Expenses [Text Block] |
What were the Fund's costs for the last year?(based on a hypothetical $10,000 investment) Class Name | Costs of a $10,000 Investment | Costs paid as a percentage of a $10,000 Investment |
|---|
Class A | $169 | 1.59% |
|---|
| | |
|---|
|
| Expenses Paid, Amount |
$ 169
|
| Expense Ratio, Percent |
1.59%
|
| Factors Affecting Performance [Text Block] |
What affected the Fund’s performance during the last year?For the fiscal year ended June 30, 2025, the Fund outperformed its benchmark, the Russell Microcap® Value Index (the “Index”). Over the last 12 months, U.S. equity market reactions to the Federal Reserve’s interest rate policy and President Trump’s tariff plans dominated headlines. Even though equities reached all-time highs in the fourth quarter of 2024, investor expectations for further rate cuts in 2025 began to cool. As the calendar turned to 2025, we believe market volatility increased due to concern and uncertainty regarding President Trump’s tariff agenda. As the fourth quarter of the Fund’s fiscal year end concluded, U.S. markets rallied once again to record highs. We believe that investor sentiment was boosted by hopes that the U.S. would reach trade agreements that could result in lower tariffs and optimism that the Federal Reserve could cut rates. For the one-year period ending June 30, 2025, microcap value stocks underperformed microcap growth stocks. Top contributors to performance: From a benchmark perspective, information technology, consumer staples, and financials were the top performing sectors. Security selection in the health care, financials, and consumer discretionary sectors were the largest positive contributors to the Fund’s relative performance. Sector weights contributed positively to the Fund’s performance relative to the Index largely due to the Fund’s underweight allocation to the health care sector and the Fund’s overweight allocation to the information technology sector.
Top detractors from performance: From a benchmark perspective, the materials, health care, and consumer discretionary sectors were the largest detractors from relative performance. The information technology sector was the largest detractor from the Fund’s performance. From a style perspective, the Fund’s holdings on average had lower volatility and a higher market capitalization relative to the benchmark and both were headwinds.
|
| Performance Past Does Not Indicate Future [Text] |
The investment return and principal value will fluctuate so that an investor's shares, when redeemed, may be worth more or less than the original cost. Past performance is not a good predictor of the Fund's future performance.
|
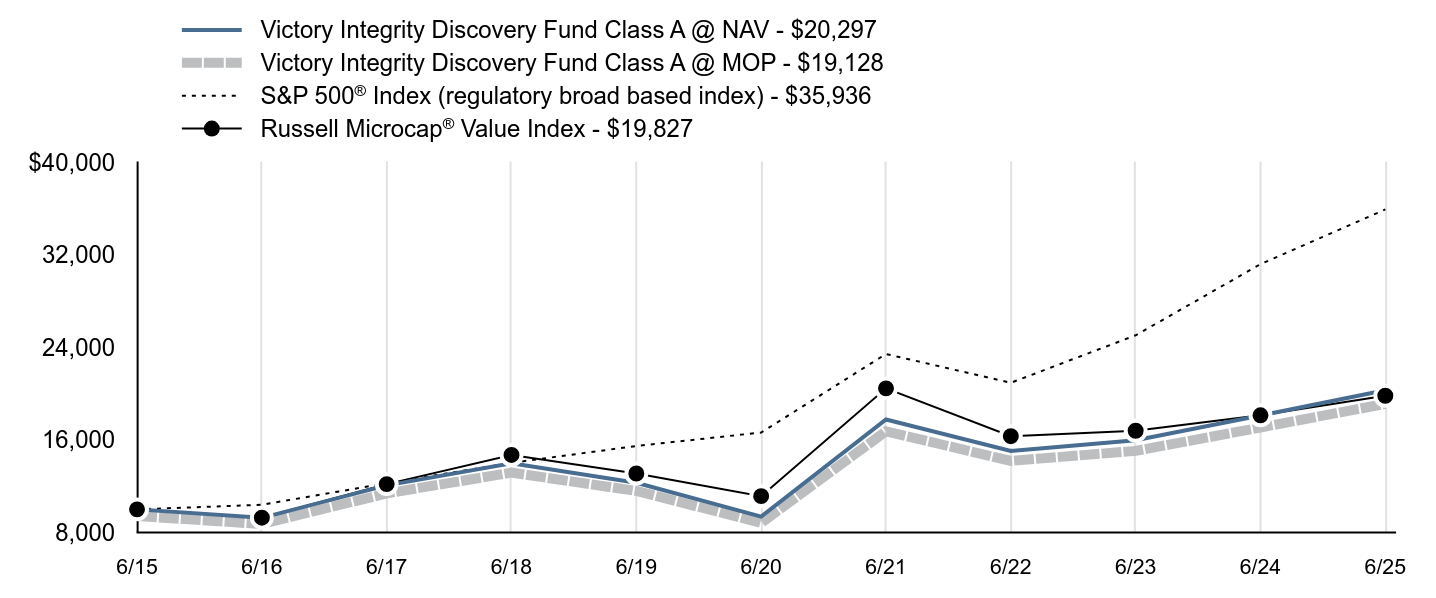
| Line Graph [Table Text Block] |
| Victory Integrity Discovery Fund Class A @ NAV - $20,297 | Victory Integrity Discovery Fund Class A @ MOP - $19,128 | S&P 500® Index (regulatory broad based index) - $35,936 | Russell Microcap® Value Index - $19,827 |
|---|
6/15 | $10,000 | $9,424 | $10,000 | $10,000 |
|---|
6/16 | $9,266 | $8,732 | $10,399 | $9,283 |
|---|
6/17 | $12,079 | $11,383 | $12,260 | $12,185 |
|---|
6/18 | $13,983 | $13,178 | $14,023 | $14,706 |
|---|
6/19 | $12,303 | $11,594 | $15,483 | $13,101 |
|---|
6/20 | $9,378 | $8,838 | $16,645 | $11,145 |
|---|
6/21 | $17,772 | $16,749 | $23,436 | $20,464 |
|---|
6/22 | $15,058 | $14,191 | $20,948 | $16,332 |
|---|
6/23 | $15,978 | $15,058 | $25,053 | $16,799 |
|---|
6/24 | $18,124 | $17,080 | $31,204 | $18,136 |
|---|
6/25 | $20,297 | $19,128 | $35,936 | $19,827 |
|---|
|
| Average Annual Return [Table Text Block] |
| 1 Year | 5 Year | 10 Year |
|---|
Class A @ NAV | 11.99% | 16.70%Footnote Reference | 7.34% |
|---|
Class A @ MOP | 5.55% | 15.32% | 6.70% |
|---|
S&P 500® Index | 15.16% | 16.64% | 13.65% |
|---|
Russell Microcap® Value Index | 9.32% | 12.21% | 7.08% |
|---|
|
| No Deduction of Taxes [Text Block] |
The graph and table total returns do not reflect the deduction of taxes that a shareholder would pay on Fund distributions, or redemption of shares.
|
| Previous Investment Adviser [Text Block] |
The maximum offering price (“MOP”) figures reflect a maximum sales charge of 5.75% for Class A. The Net Asset Value ("NAV") figures do not reflect sales charges.
|
| AssetsNet |
$ 58,122,000
|
| Holdings Count | Holding |
122
|
| Advisory Fees Paid, Amount |
$ 641,000
|
| InvestmentCompanyPortfolioTurnover |
33.00%
|
| Additional Fund Statistics [Text Block] |
FUND STATISTICS($ amounts in 000s)(as of June 30, 2025)Net Assets | $58,122 |
|---|
Number of Holdings | 122 |
|---|
Investment Advisory Fees | $641 |
|---|
Portfolio Turnover | 33% |
|---|
|
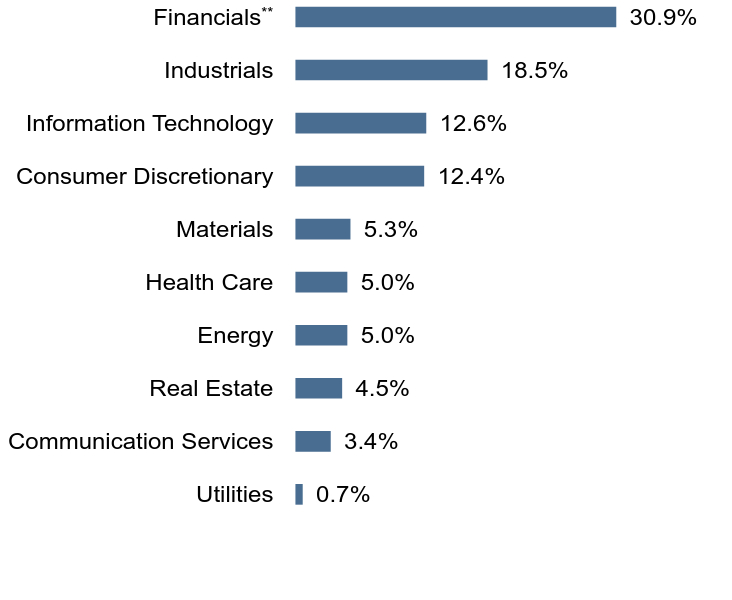
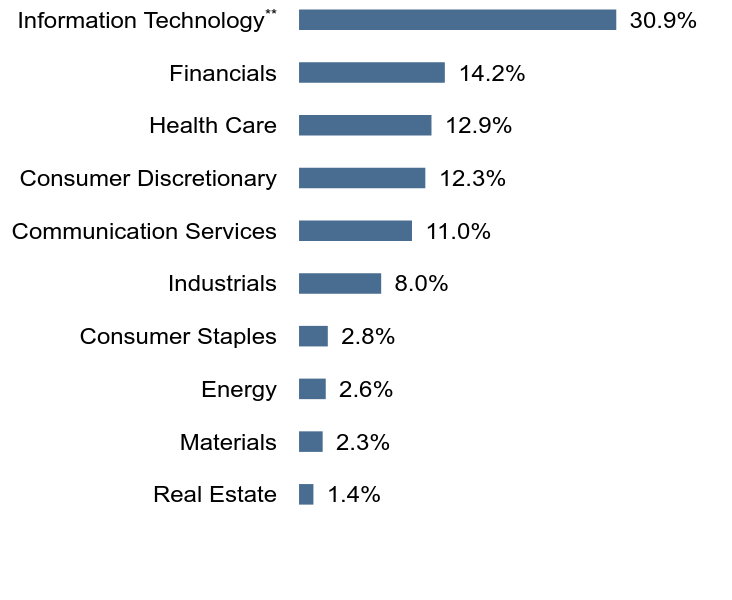
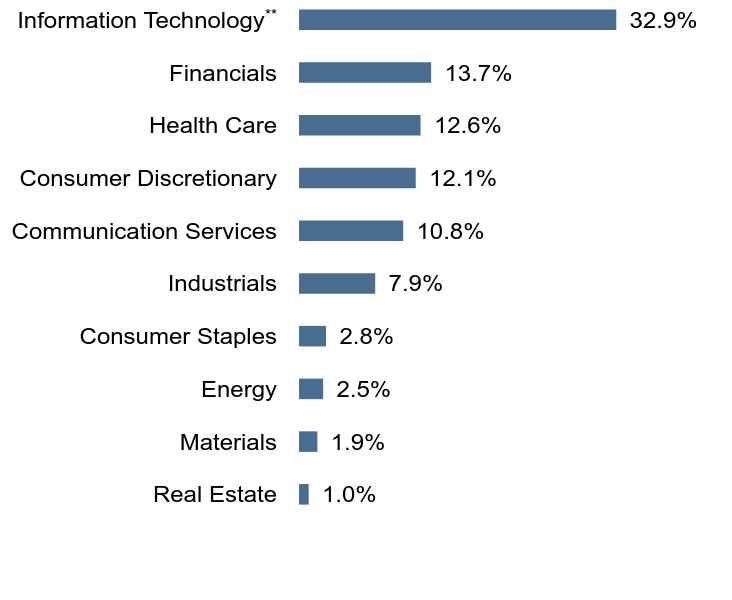
| Holdings [Text Block] |
Top SectorsFootnote Reference* (% of Net Assets)Footnote Reference(as of June 30, 2025)Value | Value |
|---|
Utilities | 0.7% | Communication Services | 3.4% | Real Estate | 4.5% | Energy | 5.0% | Health Care | 5.0% | Materials | 5.3% | Consumer Discretionary | 12.4% | Information Technology | 12.6% | Industrials | 18.5% | FinancialsFootnote Reference** | 30.9% |
Top 10 HoldingsFootnote Reference* (% of Net Assets)Footnote Reference(as of June 30, 2025)nLight, Inc. | 1.3% |
|---|
Digi International, Inc. | 1.2% |
|---|
Interface, Inc. | 1.2% |
|---|
Ducommun, Inc. | 1.2% |
|---|
Ribbon Communications, Inc. | 1.2% |
|---|
Artivion, Inc. | 1.2% |
|---|
First Mid Bancshares, Inc. | 1.2% |
|---|
Peoples Bancorp, Inc. | 1.2% |
|---|
Great Lakes Dredge & Dock Corp. | 1.1% |
|---|
ConnectOne Bancorp, Inc. | 1.1% |
|---|
|
| Material Fund Change [Text Block] |
|
| C000145005 |
|
| Shareholder Report [Line Items] |
|
| Fund Name |
Victory Integrity Discovery Fund
|
| Class Name |
Class C
|
| Trading Symbol |
MMECX
|
| Annual or Semi-Annual Statement [Text Block] |
Annual Shareholder Report
|
| Shareholder Report Annual or Semi-Annual |
annual shareholder report
|
| Additional Information [Text Block] |
You can find additional information about the Fund at advisor.vcm.com/literature/mutual-fund-prospectuses. You may also request more information by calling 800-539-3863 or visiting vcm.com/contact-us.
|
| Additional Information Phone Number |
800-539-3863
|
| Additional Information Website |
vcm.com
|
| Expenses [Text Block] |
What were the Fund's costs for the last year?(based on a hypothetical $10,000 investment) Class Name | Costs of a $10,000 Investment | Costs paid as a percentage of a $10,000 Investment |
|---|
Class C | $258 | 2.45% |
|---|
| | |
|---|
|
| Expenses Paid, Amount |
$ 258
|
| Expense Ratio, Percent |
2.45%
|
| Factors Affecting Performance [Text Block] |
What affected the Fund’s performance during the last year?For the fiscal year ended June 30, 2025, the Fund outperformed its benchmark, the Russell Microcap® Value Index (the “Index”). Over the last 12 months, U.S. equity market reactions to the Federal Reserve’s interest rate policy and President Trump’s tariff plans dominated headlines. Even though equities reached all-time highs in the fourth quarter of 2024, investor expectations for further rate cuts in 2025 began to cool. As the calendar turned to 2025, we believe market volatility increased due to concern and uncertainty regarding President Trump’s tariff agenda. As the fourth quarter of the Fund’s fiscal year end concluded, U.S. markets rallied once again to record highs. We believe that investor sentiment was boosted by hopes that the U.S. would reach trade agreements that could result in lower tariffs and optimism that the Federal Reserve could cut rates. For the one-year period ending June 30, 2025, microcap value stocks underperformed microcap growth stocks. Top contributors to performance: From a benchmark perspective, information technology, consumer staples, and financials were the top performing sectors. Security selection in the health care, financials, and consumer discretionary sectors were the largest positive contributors to the Fund’s relative performance. Sector weights contributed positively to the Fund’s performance relative to the Index largely due to the Fund’s underweight allocation to the health care sector and the Fund’s overweight allocation to the information technology sector.
Top detractors from performance: From a benchmark perspective, the materials, health care, and consumer discretionary sectors were the largest detractors from relative performance. The information technology sector was the largest detractor from the Fund’s performance. From a style perspective, the Fund’s holdings on average had lower volatility and a higher market capitalization relative to the benchmark and both were headwinds.
|
| Performance Past Does Not Indicate Future [Text] |
The investment return and principal value will fluctuate so that an investor's shares, when redeemed, may be worth more or less than the original cost. Past performance is not a good predictor of the Fund's future performance.
|
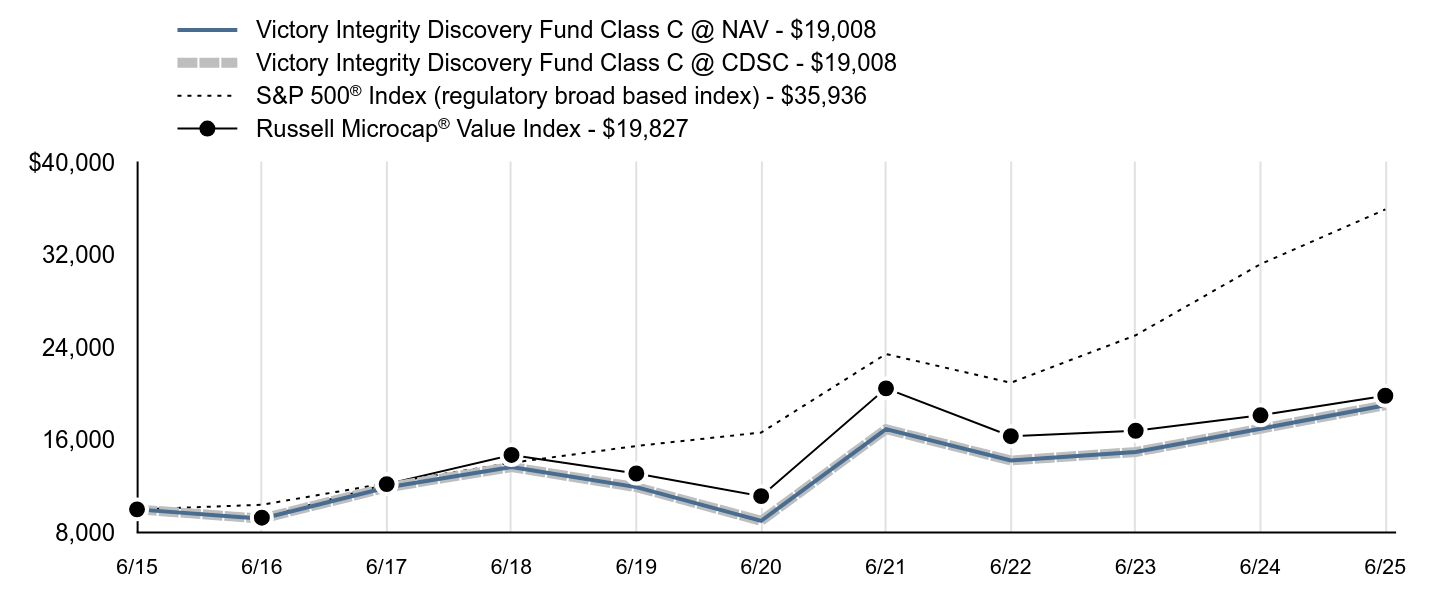
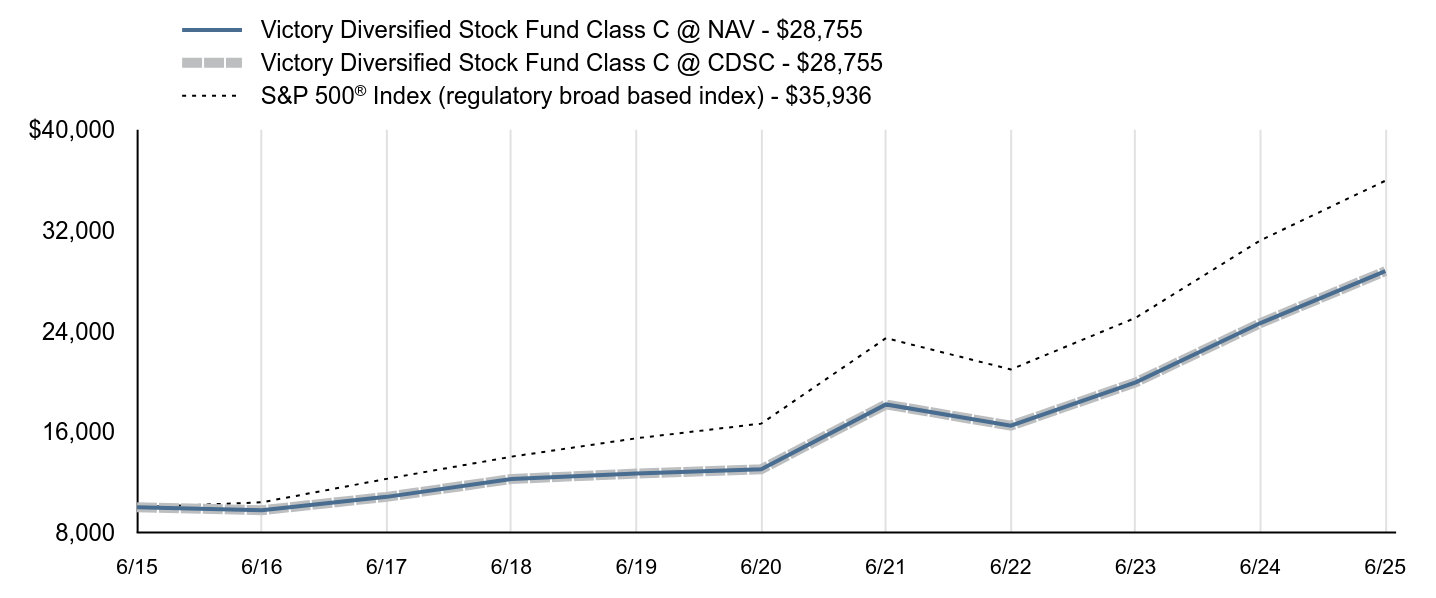
| Line Graph [Table Text Block] |
| Victory Integrity Discovery Fund Class C @ NAV - $19,008 | Victory Integrity Discovery Fund Class C @ CDSC - $19,008 | S&P 500® Index (regulatory broad based index) - $35,936 | Russell Microcap® Value Index - $19,827 |
|---|
6/15 | $10,000 | $10,000 | $10,000 | $10,000 |
|---|
6/16 | $9,196 | $9,196 | $10,399 | $9,283 |
|---|
6/17 | $11,893 | $11,893 | $12,260 | $12,185 |
|---|
6/18 | $13,663 | $13,663 | $14,023 | $14,706 |
|---|
6/19 | $11,922 | $11,922 | $15,483 | $13,101 |
|---|
6/20 | $9,011 | $9,011 | $16,645 | $11,145 |
|---|
6/21 | $16,934 | $16,934 | $23,436 | $20,464 |
|---|
6/22 | $14,228 | $14,228 | $20,948 | $16,332 |
|---|
6/23 | $14,963 | $14,963 | $25,053 | $16,799 |
|---|
6/24 | $16,973 | $16,973 | $31,204 | $18,136 |
|---|
6/25 | $19,008 | $19,008 | $35,936 | $19,827 |
|---|
|
| Average Annual Return [Table Text Block] |
| 1 Year | 5 Year | 10 Year |
|---|
Class C @ NAV | 11.01% | 15.71%Footnote Reference | 6.63% |
|---|
Class C @ CDSC | 10.05% | 15.71% | 6.63% |
|---|
S&P 500® Index | 15.16% | 16.64% | 13.65% |
|---|
Russell Microcap® Value Index | 9.32% | 12.21% | 7.08% |
|---|
|
| No Deduction of Taxes [Text Block] |
The graph and table total returns do not reflect the deduction of taxes that a shareholder would pay on Fund distributions, or redemption of shares.
|
| Previous Investment Adviser [Text Block] |
Class C is not subject to an initial sales charge, but is subject to Contingent Deferred Sales Charge (“CDSC”) of 1.00% on shares redeemed within one year of purchase. The Net Asset Value ("NAV") figures do not reflect sales charges.
|
| AssetsNet |
$ 58,122,000
|
| Holdings Count | Holding |
122
|
| Advisory Fees Paid, Amount |
$ 641,000
|
| InvestmentCompanyPortfolioTurnover |
33.00%
|
| Additional Fund Statistics [Text Block] |
FUND STATISTICS($ amounts in 000s)(as of June 30, 2025)Net Assets | $58,122 |
|---|
Number of Holdings | 122 |
|---|
Investment Advisory Fees | $641 |
|---|
Portfolio Turnover | 33% |
|---|
|
| Holdings [Text Block] |
Top SectorsFootnote Reference* (% of Net Assets)Footnote Reference(as of June 30, 2025)Value | Value |
|---|
Utilities | 0.7% | Communication Services | 3.4% | Real Estate | 4.5% | Energy | 5.0% | Health Care | 5.0% | Materials | 5.3% | Consumer Discretionary | 12.4% | Information Technology | 12.6% | Industrials | 18.5% | FinancialsFootnote Reference** | 30.9% |
Top 10 HoldingsFootnote Reference* (% of Net Assets)Footnote Reference(as of June 30, 2025)nLight, Inc. | 1.3% |
|---|
Digi International, Inc. | 1.2% |
|---|
Interface, Inc. | 1.2% |
|---|
Ducommun, Inc. | 1.2% |
|---|
Ribbon Communications, Inc. | 1.2% |
|---|
Artivion, Inc. | 1.2% |
|---|
First Mid Bancshares, Inc. | 1.2% |
|---|
Peoples Bancorp, Inc. | 1.2% |
|---|
Great Lakes Dredge & Dock Corp. | 1.1% |
|---|
ConnectOne Bancorp, Inc. | 1.1% |
|---|
|
| Material Fund Change [Text Block] |
|
| C000145007 |
|
| Shareholder Report [Line Items] |
|
| Fund Name |
Victory Integrity Discovery Fund
|
| Class Name |
Class Y
|
| Trading Symbol |
MMEYX
|
| Annual or Semi-Annual Statement [Text Block] |
Annual Shareholder Report
|
| Shareholder Report Annual or Semi-Annual |
annual shareholder report
|
| Additional Information [Text Block] |
You can find additional information about the Fund at advisor.vcm.com/literature/mutual-fund-prospectuses. You may also request more information by calling 800-539-3863 or visiting vcm.com/contact-us.
|
| Additional Information Phone Number |
800-539-3863
|
| Additional Information Website |
vcm.com
|
| Expenses [Text Block] |
What were the Fund's costs for the last year?(based on a hypothetical $10,000 investment) Class Name | Costs of a $10,000 Investment | Costs paid as a percentage of a $10,000 Investment |
|---|
Class Y | $150 | 1.41% |
|---|
| | |
|---|
|
| Expenses Paid, Amount |
$ 150
|
| Expense Ratio, Percent |
1.41%
|
| Factors Affecting Performance [Text Block] |
What affected the Fund’s performance during the last year?For the fiscal year ended June 30, 2025, the Fund outperformed its benchmark, the Russell Microcap® Value Index (the “Index”). Over the last 12 months, U.S. equity market reactions to the Federal Reserve’s interest rate policy and President Trump’s tariff plans dominated headlines. Even though equities reached all-time highs in the fourth quarter of 2024, investor expectations for further rate cuts in 2025 began to cool. As the calendar turned to 2025, we believe market volatility increased due to concern and uncertainty regarding President Trump’s tariff agenda. As the fourth quarter of the Fund’s fiscal year end concluded, U.S. markets rallied once again to record highs. We believe that investor sentiment was boosted by hopes that the U.S. would reach trade agreements that could result in lower tariffs and optimism that the Federal Reserve could cut rates. For the one-year period ending June 30, 2025, microcap value stocks underperformed microcap growth stocks. Top contributors to performance: From a benchmark perspective, information technology, consumer staples, and financials were the top performing sectors. Security selection in the health care, financials, and consumer discretionary sectors were the largest positive contributors to the Fund’s relative performance. Sector weights contributed positively to the Fund’s performance relative to the Index largely due to the Fund’s underweight allocation to the health care sector and the Fund’s overweight allocation to the information technology sector.
Top detractors from performance: From a benchmark perspective, the materials, health care, and consumer discretionary sectors were the largest detractors from relative performance. The information technology sector was the largest detractor from the Fund’s performance. From a style perspective, the Fund’s holdings on average had lower volatility and a higher market capitalization relative to the benchmark and both were headwinds.
|
| Performance Past Does Not Indicate Future [Text] |
The investment return and principal value will fluctuate so that an investor's shares, when redeemed, may be worth more or less than the original cost. Past performance is not a good predictor of the Fund's future performance.
|
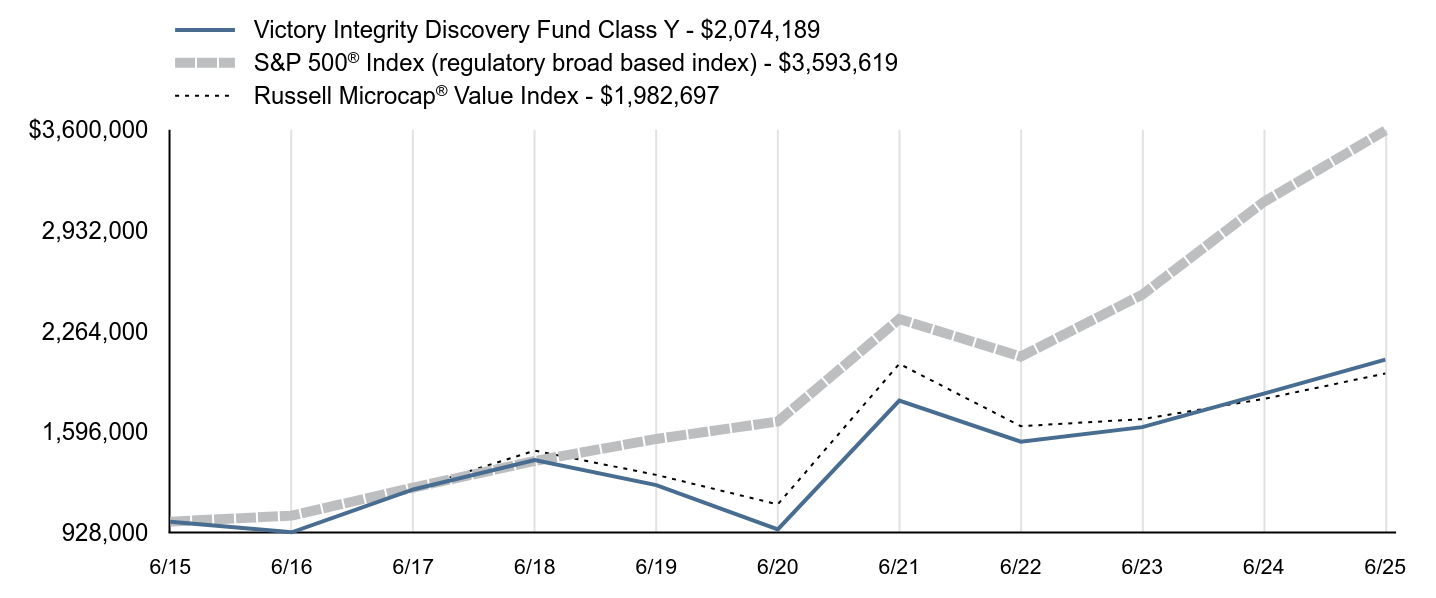
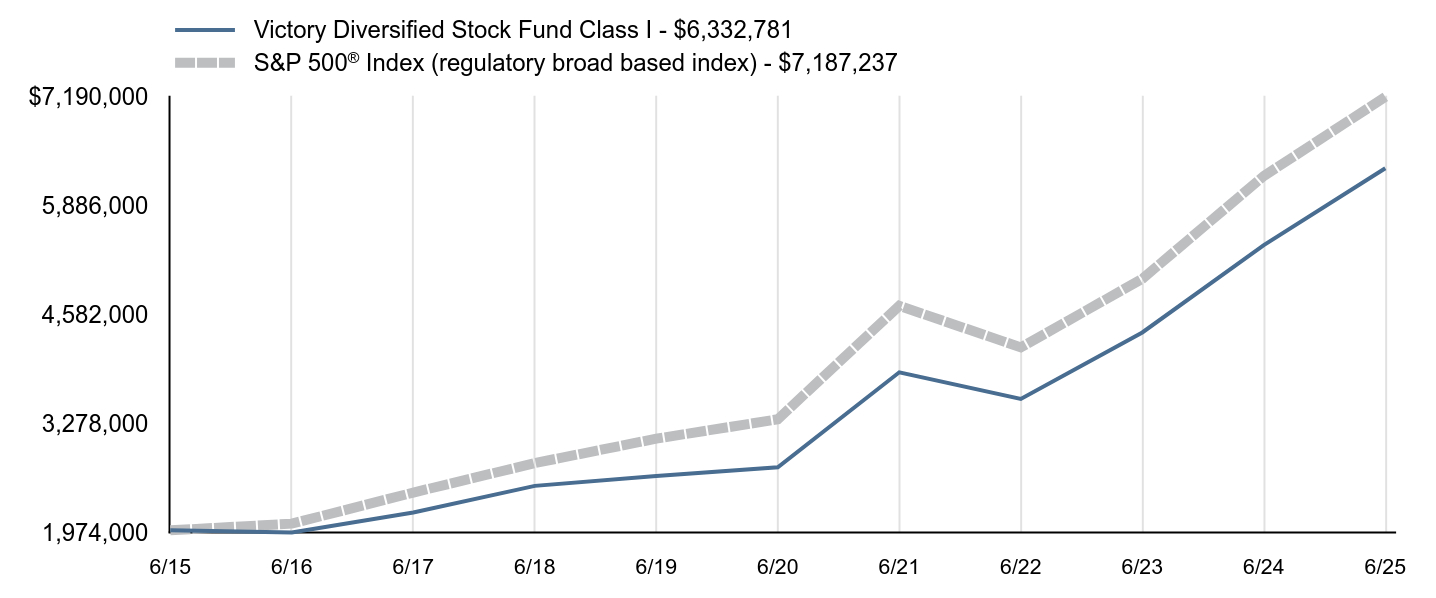
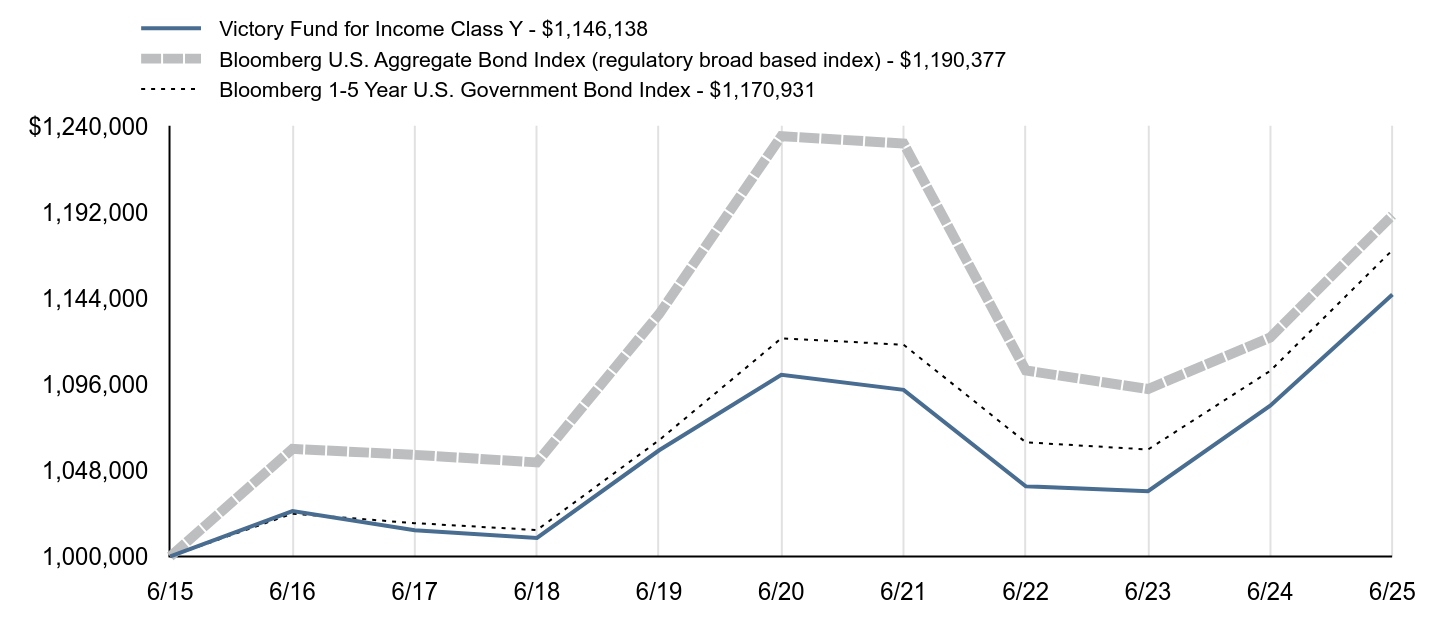
| Line Graph [Table Text Block] |
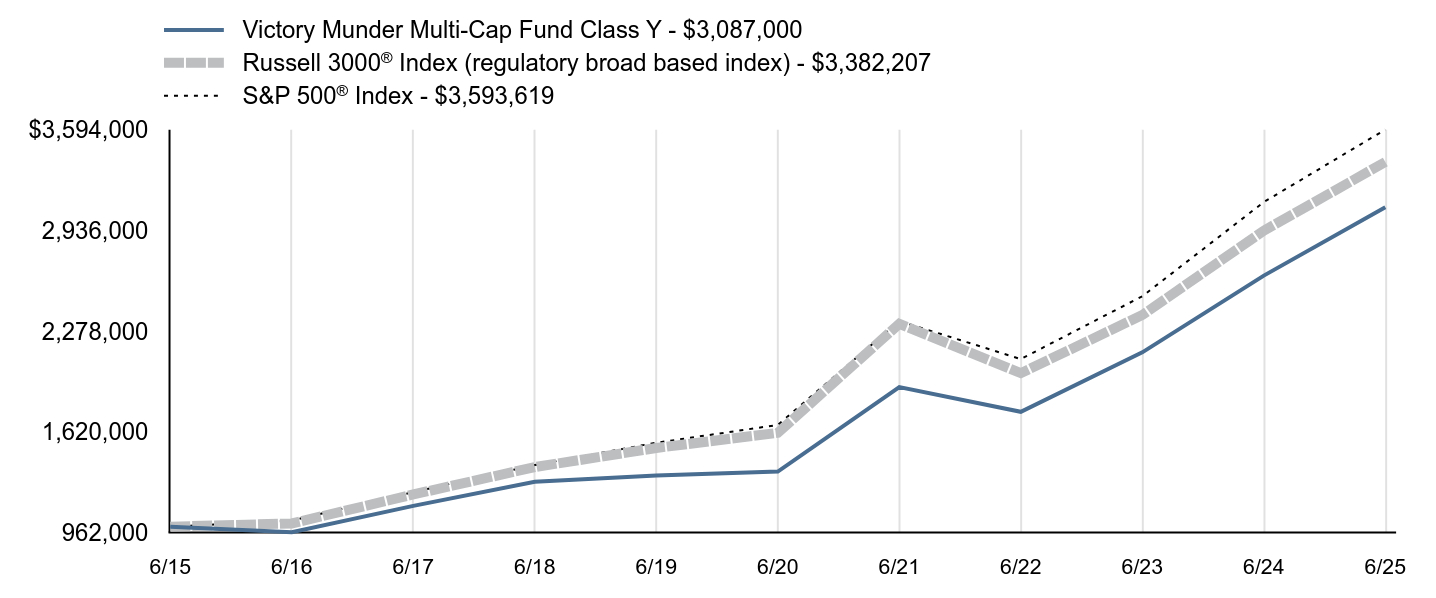
| Victory Integrity Discovery Fund Class Y - $2,074,189 | S&P 500® Index (regulatory broad based index) - $3,593,619 | Russell Microcap® Value Index - $1,982,697 |
|---|
6/15 | $1,000,000 | $1,000,000 | $1,000,000 |
|---|
6/16 | $928,992 | $1,039,928 | $928,271 |
|---|
6/17 | $1,213,433 | $1,226,034 | $1,218,471 |
|---|
6/18 | $1,408,513 | $1,402,264 | $1,470,620 |
|---|
6/19 | $1,242,096 | $1,548,344 | $1,310,123 |
|---|
6/20 | $948,498 | $1,664,549 | $1,114,500 |
|---|
6/21 | $1,803,001 | $2,343,588 | $2,046,409 |
|---|
6/22 | $1,530,551 | $2,094,797 | $1,633,197 |
|---|
6/23 | $1,626,788 | $2,505,253 | $1,679,921 |
|---|
6/24 | $1,849,108 | $3,120,445 | $1,813,643 |
|---|
6/25 | $2,074,189 | $3,593,619 | $1,982,697 |
|---|
|
| Average Annual Return [Table Text Block] |
| 1 Year | 5 Year | 10 Year |
|---|
Class Y | 12.17% | 16.94%Footnote Reference | 7.57% |
|---|
S&P 500® Index | 15.16% | 16.64% | 13.65% |
|---|
Russell Microcap® Value Index | 9.32% | 12.21% | 7.08% |
|---|
|
| No Deduction of Taxes [Text Block] |
The graph and table total returns do not reflect the deduction of taxes that a shareholder would pay on Fund distributions, or redemption of shares.
|
| AssetsNet |
$ 58,122,000
|
| Holdings Count | Holding |
122
|
| Advisory Fees Paid, Amount |
$ 641,000
|
| InvestmentCompanyPortfolioTurnover |
33.00%
|
| Additional Fund Statistics [Text Block] |
FUND STATISTICS($ amounts in 000s)(as of June 30, 2025)Net Assets | $58,122 |
|---|
Number of Holdings | 122 |
|---|
Investment Advisory Fees | $641 |
|---|
Portfolio Turnover | 33% |
|---|
|
| Holdings [Text Block] |
Top SectorsFootnote Reference* (% of Net Assets)Footnote Reference(as of June 30, 2025)Value | Value |
|---|
Utilities | 0.7% | Communication Services | 3.4% | Real Estate | 4.5% | Energy | 5.0% | Health Care | 5.0% | Materials | 5.3% | Consumer Discretionary | 12.4% | Information Technology | 12.6% | Industrials | 18.5% | FinancialsFootnote Reference** | 30.9% |
Top 10 HoldingsFootnote Reference* (% of Net Assets)Footnote Reference(as of June 30, 2025)nLight, Inc. | 1.3% |
|---|
Digi International, Inc. | 1.2% |
|---|
Interface, Inc. | 1.2% |
|---|
Ducommun, Inc. | 1.2% |
|---|
Ribbon Communications, Inc. | 1.2% |
|---|
Artivion, Inc. | 1.2% |
|---|
First Mid Bancshares, Inc. | 1.2% |
|---|
Peoples Bancorp, Inc. | 1.2% |
|---|
Great Lakes Dredge & Dock Corp. | 1.1% |
|---|
ConnectOne Bancorp, Inc. | 1.1% |
|---|
|
| Material Fund Change [Text Block] |
|
| C000219865 |
|
| Shareholder Report [Line Items] |
|
| Fund Name |
Victory Integrity Discovery Fund
|
| Class Name |
Member Class
|
| Trading Symbol |
MMMMX
|
| Annual or Semi-Annual Statement [Text Block] |
Annual Shareholder Report
|
| Shareholder Report Annual or Semi-Annual |
annual shareholder report
|
| Additional Information [Text Block] |
You can find additional information about the Fund at advisor.vcm.com/literature/mutual-fund-prospectuses. You may also request more information by calling 800-235-8396 or visiting vcm.com/contact-us.
|
| Additional Information Phone Number |
800-235-8396
|
| Additional Information Website |
vcm.com
|
| Expenses [Text Block] |
What were the Fund's costs for the last year?(based on a hypothetical $10,000 investment) Class Name | Costs of a $10,000 Investment | Costs paid as a percentage of a $10,000 Investment |
|---|
Member Class | $159 | 1.50% |
|---|
| | |
|---|
|
| Expenses Paid, Amount |
$ 159
|
| Expense Ratio, Percent |
1.50%
|
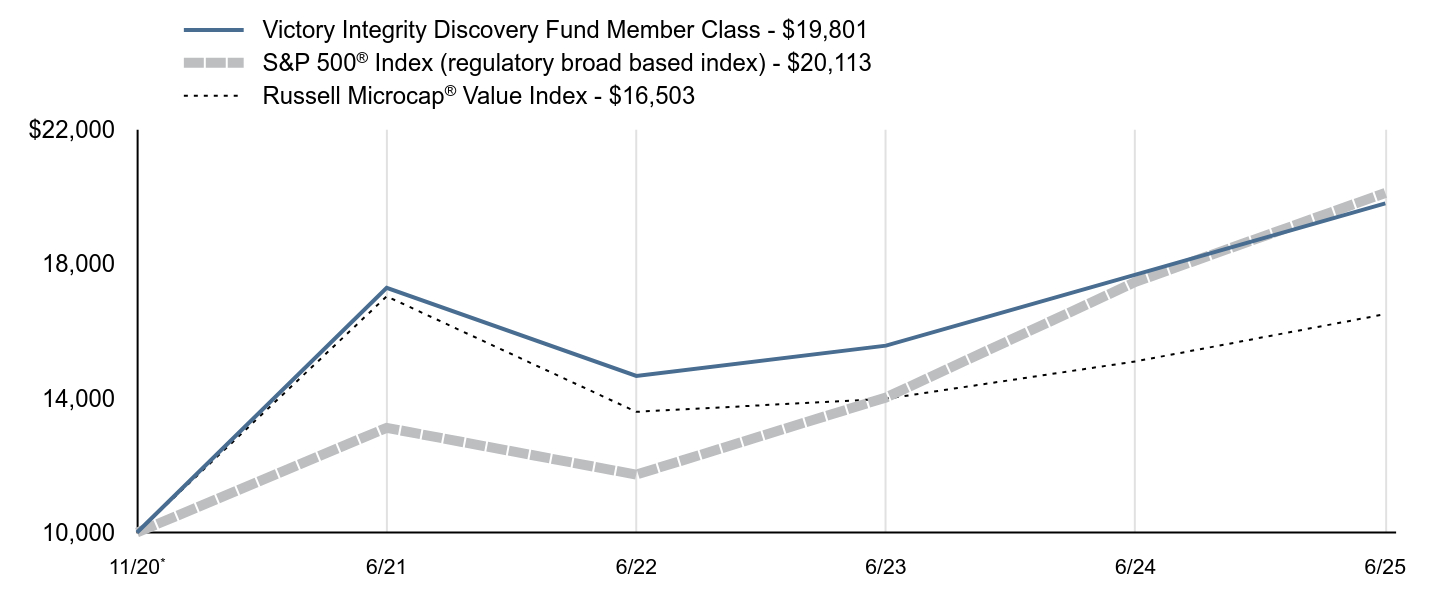
| Factors Affecting Performance [Text Block] |
What affected the Fund’s performance during the last year?For the fiscal year ended June 30, 2025, the Fund outperformed its benchmark, the Russell Microcap® Value Index (the “Index”). Over the last 12 months, U.S. equity market reactions to the Federal Reserve’s interest rate policy and President Trump’s tariff plans dominated headlines. Even though equities reached all-time highs in the fourth quarter of 2024, investor expectations for further rate cuts in 2025 began to cool. As the calendar turned to 2025, we believe market volatility increased due to concern and uncertainty regarding President Trump’s tariff agenda. As the fourth quarter of the Fund’s fiscal year end concluded, U.S. markets rallied once again to record highs. We believe that investor sentiment was boosted by hopes that the U.S. would reach trade agreements that could result in lower tariffs and optimism that the Federal Reserve could cut rates. For the one-year period ending June 30, 2025, microcap value stocks underperformed microcap growth stocks. Top contributors to performance: From a benchmark perspective, information technology, consumer staples, and financials were the top performing sectors. Security selection in the health care, financials, and consumer discretionary sectors were the largest positive contributors to the Fund’s relative performance. Sector weights contributed positively to the Fund’s performance relative to the Index largely due to the Fund’s underweight allocation to the health care sector and the Fund’s overweight allocation to the information technology sector.
Top detractors from performance: From a benchmark perspective, the materials, health care, and consumer discretionary sectors were the largest detractors from relative performance. The information technology sector was the largest detractor from the Fund’s performance. From a style perspective, the Fund’s holdings on average had lower volatility and a higher market capitalization relative to the benchmark and both were headwinds.
|
| Performance Past Does Not Indicate Future [Text] |
The investment return and principal value will fluctuate so that an investor's shares, when redeemed, may be worth more or less than the original cost. Past performance is not a good predictor of the Fund's future performance.
|
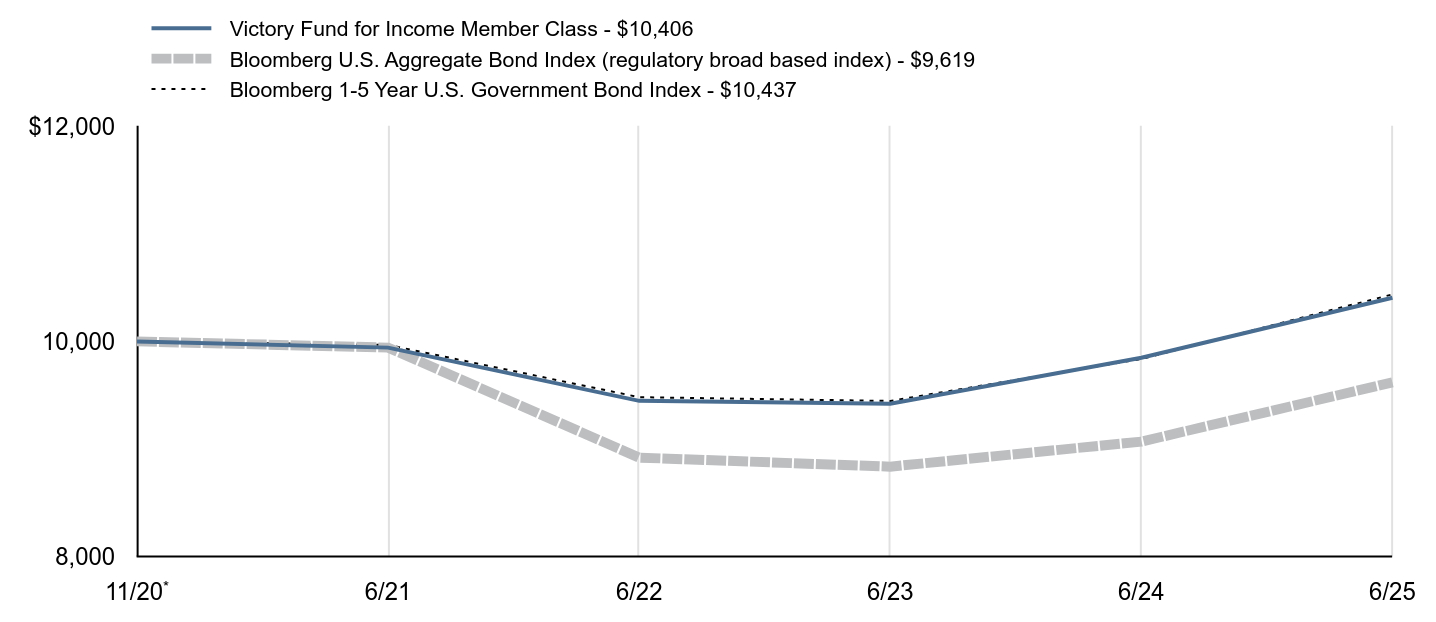
| Line Graph [Table Text Block] |
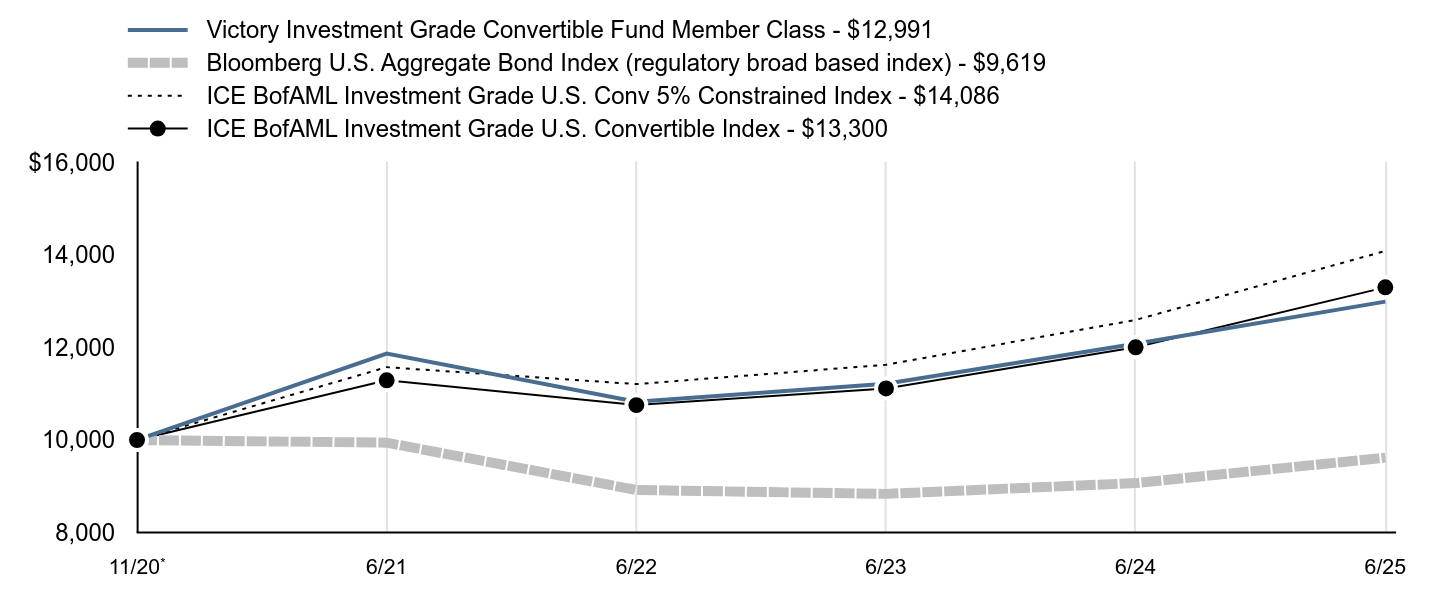
| Victory Integrity Discovery Fund Member Class - $19,801 | S&P 500® Index (regulatory broad based index) - $20,113 | Russell Microcap® Value Index - $16,503 |
|---|
11/20Footnote Reference* | $10,000 | $10,000 | $10,000 |
|---|
6/21 | $17,285 | $13,117 | $17,034 |
|---|
6/22 | $14,663 | $11,724 | $13,594 |
|---|
6/23 | $15,566 | $14,021 | $13,983 |
|---|
6/24 | $17,679 | $17,465 | $15,096 |
|---|
6/25 | $19,801 | $20,113 | $16,503 |
|---|
|
| Average Annual Return [Table Text Block] |
| 1 Year | Since Inception |
|---|
Member Class | 12.00% | 15.80%Footnote Reference |
|---|
S&P 500® Index | 15.16% | 16.19% |
|---|
Russell Microcap® Value Index | 9.32% | 11.36% |
|---|
|
| No Deduction of Taxes [Text Block] |
The graph and table total returns do not reflect the deduction of taxes that a shareholder would pay on Fund distributions, or redemption of shares.
|
| AssetsNet |
$ 58,122,000
|
| Holdings Count | Holding |
122
|
| Advisory Fees Paid, Amount |
$ 641,000
|
| InvestmentCompanyPortfolioTurnover |
33.00%
|
| Additional Fund Statistics [Text Block] |
FUND STATISTICS($ amounts in 000s)(as of June 30, 2025)Net Assets | $58,122 |
|---|
Number of Holdings | 122 |
|---|
Investment Advisory Fees | $641 |
|---|
Portfolio Turnover | 33% |
|---|
|
| Holdings [Text Block] |
Top SectorsFootnote Reference* (% of Net Assets)Footnote Reference(as of June 30, 2025)Value | Value |
|---|
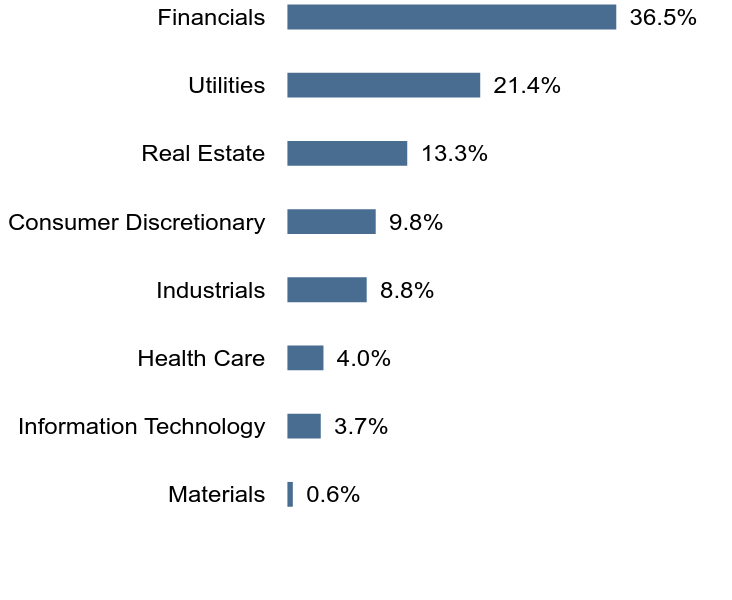
Utilities | 0.7% | Communication Services | 3.4% | Real Estate | 4.5% | Energy | 5.0% | Health Care | 5.0% | Materials | 5.3% | Consumer Discretionary | 12.4% | Information Technology | 12.6% | Industrials | 18.5% | FinancialsFootnote Reference** | 30.9% |
Top 10 HoldingsFootnote Reference* (% of Net Assets)Footnote Reference(as of June 30, 2025)nLight, Inc. | 1.3% |
|---|
Digi International, Inc. | 1.2% |
|---|
Interface, Inc. | 1.2% |
|---|
Ducommun, Inc. | 1.2% |
|---|
Ribbon Communications, Inc. | 1.2% |
|---|
Artivion, Inc. | 1.2% |
|---|
First Mid Bancshares, Inc. | 1.2% |
|---|
Peoples Bancorp, Inc. | 1.2% |
|---|
Great Lakes Dredge & Dock Corp. | 1.1% |
|---|
ConnectOne Bancorp, Inc. | 1.1% |
|---|
|
| Material Fund Change [Text Block] |
|
| C000144991 |
|
| Shareholder Report [Line Items] |
|
| Fund Name |
Victory Integrity Mid-Cap Value Fund
|
| Class Name |
Class A
|
| Trading Symbol |
MAIMX
|
| Annual or Semi-Annual Statement [Text Block] |
Annual Shareholder Report
|
| Shareholder Report Annual or Semi-Annual |
annual shareholder report
|
| Additional Information [Text Block] |
You can find additional information about the Fund at advisor.vcm.com/literature/mutual-fund-prospectuses. You may also request more information by calling 800-539-3863 or visiting vcm.com/contact-us.
|
| Additional Information Phone Number |
800-539-3863
|
| Additional Information Website |
vcm.com
|
| Expenses [Text Block] |
What were the Fund's costs for the last year?(based on a hypothetical $10,000 investment) Class Name | Costs of a $10,000 Investment | Costs paid as a percentage of a $10,000 Investment |
|---|
Class A | $104 | 1.00% |
|---|
| | |
|---|
|
| Expenses Paid, Amount |
$ 104
|
| Expense Ratio, Percent |
1.00%
|
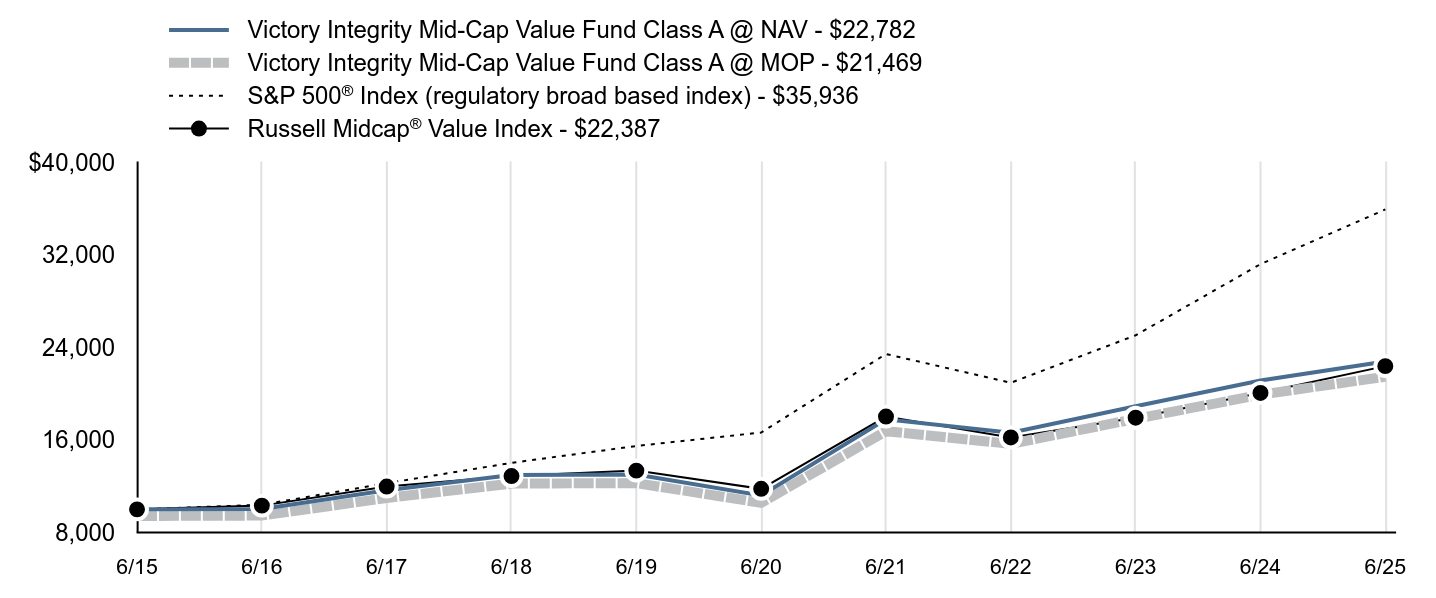
| Factors Affecting Performance [Text Block] |
What affected the Fund’s performance during the last year?For the fiscal year ended June 30, 2025, the Fund underperformed its benchmark, the Russell Midcap® Value Index (the “Index”). Over the last 12 months, U.S. equity market reactions to the Federal Reserve’s interest rate policy and President Trump’s tariff plans dominated headlines. Even though equities reached all-time highs in the fourth quarter of 2024, investor expectations for further rate cuts in 2025 began to cool. As the calendar turned to 2025, we believe market volatility increased due to concern and uncertainty regarding President Trump’s tariff agenda. As the fourth quarter of the Fund’s fiscal year end concluded, U.S. markets rallied once again to record highs. We believe that investor sentiment was boosted by hopes that the U.S. will reach trade agreements that could result in lower tariffs and optimism that the Federal Reserve could cut rates. For the one-year period ending June 30, 2025, mid-cap value stocks underperformed mid-cap growth stocks. Top contributors to performance: From a benchmark perspective, financials, communication services, and utilities were the top performing sectors. The consumer staples, health care, and utilities sectors were the largest positive contributors to the Fund’s relative performance.
Top detractors from performance: The health care and materials sectors were the largest detractors from relative performance. Security selection in the consumer discretionary, industrials, and energy sectors were the largest detractors from the Fund’s performance. Sector weights detracted from the Fund’s performance relative to the Index largely due to the Fund’s underweight allocation to the financials and communication services sectors. The Fund’s higher volatility and lower market capitalization relative to the Index were style headwinds.
|
| Performance Past Does Not Indicate Future [Text] |
The investment return and principal value will fluctuate so that an investor's shares, when redeemed, may be worth more or less than the original cost. Past performance is not a good predictor of the Fund's future performance.
|
| Line Graph [Table Text Block] |
| Victory Integrity Mid-Cap Value Fund Class A @ NAV - $22,782 | Victory Integrity Mid-Cap Value Fund Class A @ MOP - $21,469 | S&P 500® Index (regulatory broad based index) - $35,936 | Russell Midcap® Value Index - $22,387 |
|---|
6/15 | $10,000 | $9,424 | $10,000 | $10,000 |
|---|
6/16 | $10,041 | $9,463 | $10,399 | $10,325 |
|---|
6/17 | $11,655 | $10,984 | $12,260 | $11,969 |
|---|
6/18 | $12,975 | $12,227 | $14,023 | $12,878 |
|---|
6/19 | $13,022 | $12,272 | $15,483 | $13,352 |
|---|
6/20 | $11,212 | $10,566 | $16,645 | $11,775 |
|---|
6/21 | $17,788 | $16,763 | $23,436 | $18,023 |
|---|
6/22 | $16,622 | $15,664 | $20,948 | $16,221 |
|---|
6/23 | $18,920 | $17,830 | $25,053 | $17,925 |
|---|
6/24 | $21,137 | $19,919 | $31,204 | $20,072 |
|---|
6/25 | $22,782 | $21,469 | $35,936 | $22,387 |
|---|
|
| Average Annual Return [Table Text Block] |
| 1 Year | 5 Year | 10 Year |
|---|
Class A @ NAV | 7.78% | 15.23%Footnote Reference | 8.58% |
|---|
Class A @ MOP | 1.60% | 13.88% | 7.94% |
|---|
S&P 500® Index | 15.16% | 16.64% | 13.65% |
|---|
Russell Midcap® Value Index | 11.53% | 13.71% | 8.39% |
|---|
|
| No Deduction of Taxes [Text Block] |
The graph and table total returns do not reflect the deduction of taxes that a shareholder would pay on Fund distributions, or redemption of shares.
|
| Previous Investment Adviser [Text Block] |
The maximum offering price (“MOP”) figures reflect a maximum sales charge of 5.75% for Class A. The Net Asset Value ("NAV") figures do not reflect sales charges.
|
| AssetsNet |
$ 313,979,000
|
| Holdings Count | Holding |
112
|
| Advisory Fees Paid, Amount |
$ 2,350,000
|
| InvestmentCompanyPortfolioTurnover |
49.00%
|
| Additional Fund Statistics [Text Block] |
FUND STATISTICS($ amounts in 000s)(as of June 30, 2025)Net Assets | $313,979 |
|---|
Number of Holdings | 112 |
|---|
Investment Advisory Fees | $2,350 |
|---|
Portfolio Turnover | 49% |
|---|
|
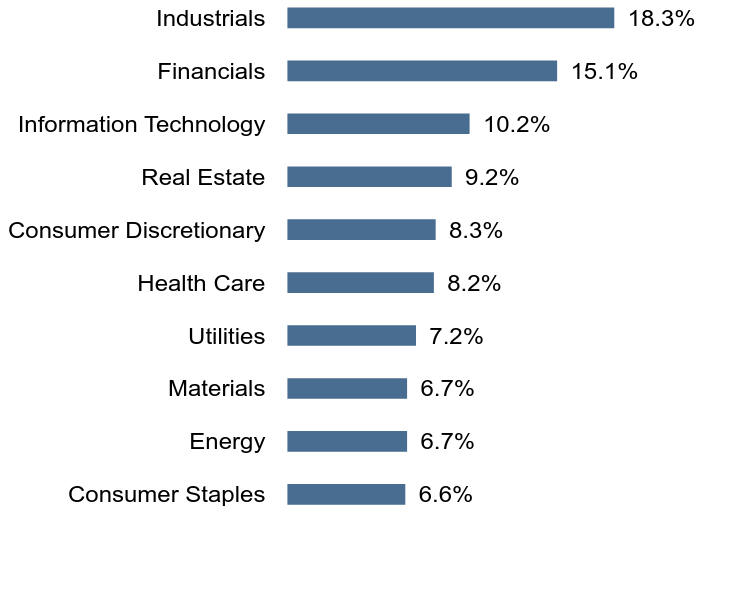
| Holdings [Text Block] |
Top SectorsFootnote Reference* (% of Net Assets)Footnote Reference(as of June 30, 2025)Value | Value |
|---|
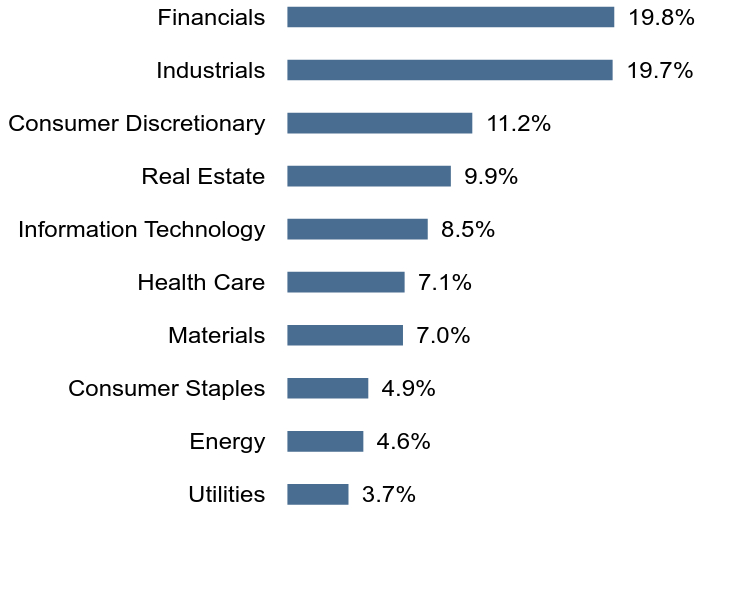
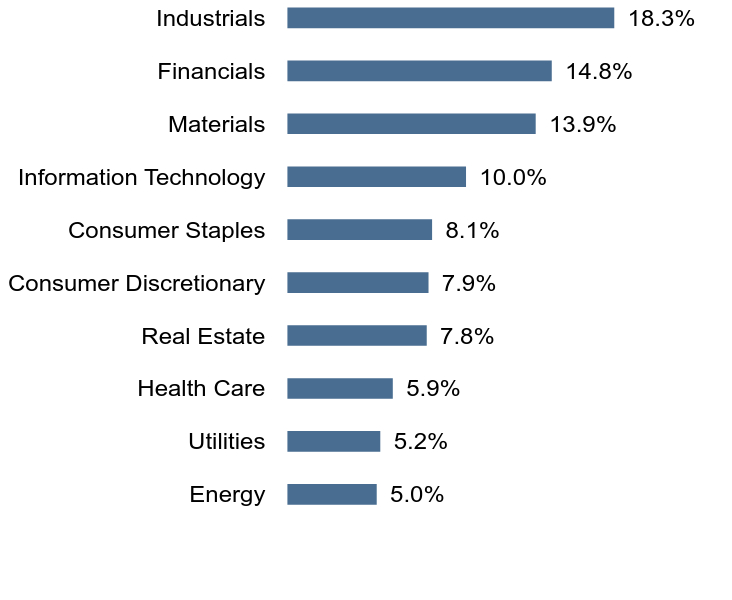
Consumer Staples | 6.6% | Energy | 6.7% | Materials | 6.7% | Utilities | 7.2% | Health Care | 8.2% | Consumer Discretionary | 8.3% | Real Estate | 9.2% | Information Technology | 10.2% | Financials | 15.1% | Industrials | 18.3% |
Top 10 HoldingsFootnote Reference* (% of Net Assets)Footnote Reference(as of June 30, 2025)Realty Income Corp. | 1.6% |
|---|
M&T Bank Corp. | 1.4% |
|---|
Raymond James Financial, Inc. | 1.4% |
|---|
Huntington Bancshares, Inc. | 1.4% |
|---|
Xcel Energy, Inc. | 1.3% |
|---|
VICI Properties, Inc. | 1.3% |
|---|
WP Carey, Inc. | 1.2% |
|---|
State Street Corp. | 1.2% |
|---|
STERIS PLC | 1.2% |
|---|
Nasdaq, Inc. | 1.2% |
|---|
|
| Material Fund Change [Text Block] |
|
| C000217047 |
|
| Shareholder Report [Line Items] |
|
| Fund Name |
Victory Integrity Mid-Cap Value Fund
|
| Class Name |
Class C
|
| Trading Symbol |
MCIMX
|
| Annual or Semi-Annual Statement [Text Block] |
Annual Shareholder Report
|
| Shareholder Report Annual or Semi-Annual |
annual shareholder report
|
| Additional Information [Text Block] |
You can find additional information about the Fund at advisor.vcm.com/literature/mutual-fund-prospectuses. You may also request more information by calling 800-539-3863 or visiting vcm.com/contact-us.
|
| Additional Information Phone Number |
800-539-3863
|
| Additional Information Website |
vcm.com
|
| Expenses [Text Block] |
What were the Fund's costs for the last year?(based on a hypothetical $10,000 investment) Class Name | Costs of a $10,000 Investment | Costs paid as a percentage of a $10,000 Investment |
|---|
Class C | $181 | 1.75% |
|---|
| | |
|---|
|
| Expenses Paid, Amount |
$ 181
|
| Expense Ratio, Percent |
1.75%
|
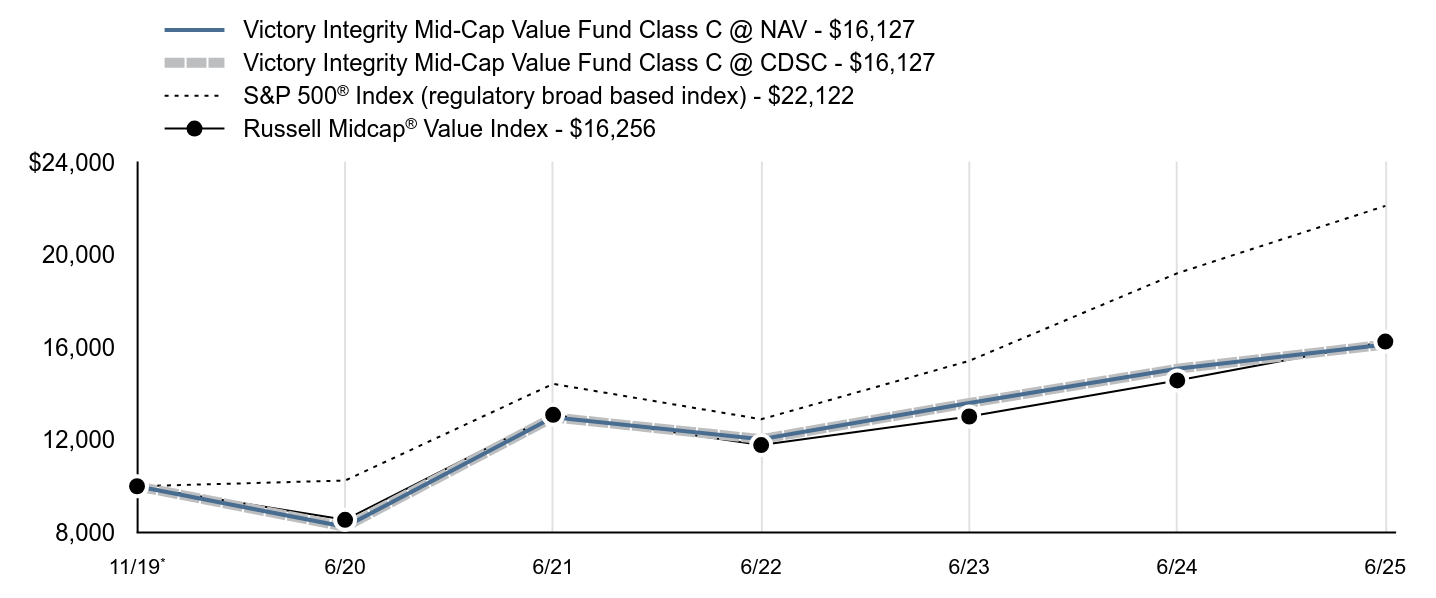
| Factors Affecting Performance [Text Block] |
What affected the Fund’s performance during the last year?For the fiscal year ended June 30, 2025, the Fund underperformed its benchmark, the Russell Midcap® Value Index (the “Index”). Over the last 12 months, U.S. equity market reactions to the Federal Reserve’s interest rate policy and President Trump’s tariff plans dominated headlines. Even though equities reached all-time highs in the fourth quarter of 2024, investor expectations for further rate cuts in 2025 began to cool. As the calendar turned to 2025, we believe market volatility increased due to concern and uncertainty regarding President Trump’s tariff agenda. As the fourth quarter of the Fund’s fiscal year end concluded, U.S. markets rallied once again to record highs. We believe that investor sentiment was boosted by hopes that the U.S. will reach trade agreements that could result in lower tariffs and optimism that the Federal Reserve could cut rates. For the one-year period ending June 30, 2025, mid-cap value stocks underperformed mid-cap growth stocks. Top contributors to performance: From a benchmark perspective, financials, communication services, and utilities were the top performing sectors. The consumer staples, health care, and utilities sectors were the largest positive contributors to the Fund’s relative performance.
Top detractors from performance: The health care and materials sectors were the largest detractors from relative performance. Security selection in the consumer discretionary, industrials, and energy sectors were the largest detractors from the Fund’s performance. Sector weights detracted from the Fund’s performance relative to the Index largely due to the Fund’s underweight allocation to the financials and communication services sectors. The Fund’s higher volatility and lower market capitalization relative to the Index were style headwinds.
|
| Performance Past Does Not Indicate Future [Text] |
The investment return and principal value will fluctuate so that an investor's shares, when redeemed, may be worth more or less than the original cost. Past performance is not a good predictor of the Fund's future performance.
|
| Line Graph [Table Text Block] |
| Victory Integrity Mid-Cap Value Fund Class C @ NAV - $16,127 | Victory Integrity Mid-Cap Value Fund Class C @ CDSC - $16,127 | S&P 500® Index (regulatory broad based index) - $22,122 | Russell Midcap® Value Index - $16,256 |
|---|
11/19Footnote Reference* | $10,000 | $10,000 | $10,000 | $10,000 |
|---|
6/20 | $8,245 | $8,245 | $10,247 | $8,550 |
|---|
6/21 | $12,979 | $12,979 | $14,427 | $13,088 |
|---|
6/22 | $12,036 | $12,036 | $12,896 | $11,779 |
|---|
6/23 | $13,599 | $13,599 | $15,422 | $13,016 |
|---|
6/24 | $15,081 | $15,081 | $19,209 | $14,575 |
|---|
6/25 | $16,127 | $16,127 | $22,122 | $16,256 |
|---|
|
| Average Annual Return [Table Text Block] |
| 1 Year | 5 Year | Since Inception |
|---|
Class C @ NAV | 6.94% | 14.36% | 8.81% |
|---|
Class C @ CDSC | 6.02% | 14.36% | 8.81% |
|---|
S&P 500® Index | 15.16% | 16.64% | 15.05% |
|---|
Russell Midcap® Value Index | 11.53% | 13.71% | 8.96% |
|---|
|
| No Deduction of Taxes [Text Block] |
The graph and table total returns do not reflect the deduction of taxes that a shareholder would pay on Fund distributions, or redemption of shares.
|
| Previous Investment Adviser [Text Block] |
Class C is not subject to an initial sales charge, but is subject to Contingent Deferred Sales Charge (“CDSC”) of 1.00% on shares redeemed within one year of purchase. The Net Asset Value ("NAV") figures do not reflect sales charges.
|
| AssetsNet |
$ 313,979,000
|
| Holdings Count | Holding |
112
|
| Advisory Fees Paid, Amount |
$ 2,350,000
|
| InvestmentCompanyPortfolioTurnover |
49.00%
|
| Additional Fund Statistics [Text Block] |
FUND STATISTICS($ amounts in 000s)(as of June 30, 2025)Net Assets | $313,979 |
|---|
Number of Holdings | 112 |
|---|
Investment Advisory Fees | $2,350 |
|---|
Portfolio Turnover | 49% |
|---|
|
| Holdings [Text Block] |
Top SectorsFootnote Reference* (% of Net Assets)Footnote Reference(as of June 30, 2025)Value | Value |
|---|
Consumer Staples | 6.6% | Energy | 6.7% | Materials | 6.7% | Utilities | 7.2% | Health Care | 8.2% | Consumer Discretionary | 8.3% | Real Estate | 9.2% | Information Technology | 10.2% | Financials | 15.1% | Industrials | 18.3% |
Top 10 HoldingsFootnote Reference* (% of Net Assets)Footnote Reference(as of June 30, 2025)Realty Income Corp. | 1.6% |
|---|
M&T Bank Corp. | 1.4% |
|---|
Raymond James Financial, Inc. | 1.4% |
|---|
Huntington Bancshares, Inc. | 1.4% |
|---|
Xcel Energy, Inc. | 1.3% |
|---|
VICI Properties, Inc. | 1.3% |
|---|
WP Carey, Inc. | 1.2% |
|---|
State Street Corp. | 1.2% |
|---|
STERIS PLC | 1.2% |
|---|
Nasdaq, Inc. | 1.2% |
|---|
|
| Material Fund Change [Text Block] |
|
| C000164741 |
|
| Shareholder Report [Line Items] |
|
| Fund Name |
Victory Integrity Mid-Cap Value Fund
|
| Class Name |
Class R6
|
| Trading Symbol |
MRIMX
|
| Annual or Semi-Annual Statement [Text Block] |
Annual Shareholder Report
|
| Shareholder Report Annual or Semi-Annual |
annual shareholder report
|
| Additional Information [Text Block] |
You can find additional information about the Fund at advisor.vcm.com/literature/mutual-fund-prospectuses. You may also request more information by calling 800-539-3863 or visiting vcm.com/contact-us.
|
| Additional Information Phone Number |
800-539-3863
|
| Additional Information Website |
vcm.com
|
| Expenses [Text Block] |
What were the Fund's costs for the last year?(based on a hypothetical $10,000 investment) Class Name | Costs of a $10,000 Investment | Costs paid as a percentage of a $10,000 Investment |
|---|
Class R6 | $62 | 0.60% |
|---|
| | |
|---|
|
| Expenses Paid, Amount |
$ 62
|
| Expense Ratio, Percent |
0.60%
|
| Factors Affecting Performance [Text Block] |
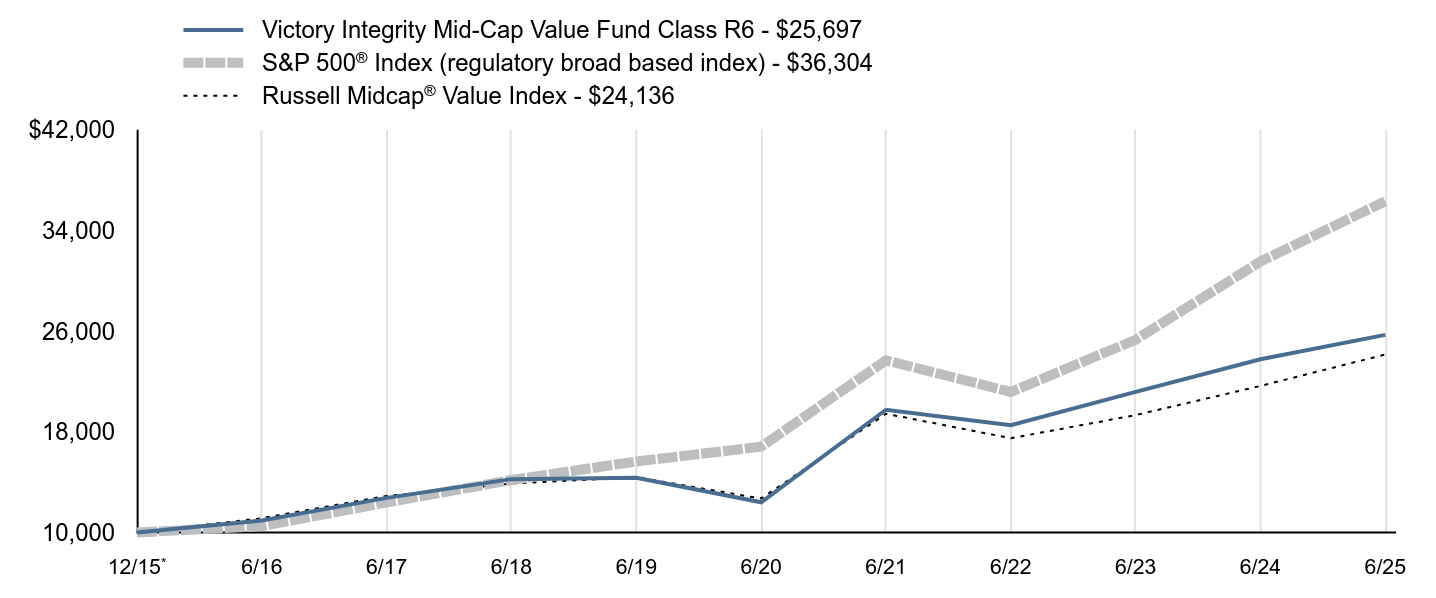
What affected the Fund’s performance during the last year?For the fiscal year ended June 30, 2025, the Fund underperformed its benchmark, the Russell Midcap® Value Index (the “Index”). Over the last 12 months, U.S. equity market reactions to the Federal Reserve’s interest rate policy and President Trump’s tariff plans dominated headlines. Even though equities reached all-time highs in the fourth quarter of 2024, investor expectations for further rate cuts in 2025 began to cool. As the calendar turned to 2025, we believe market volatility increased due to concern and uncertainty regarding President Trump’s tariff agenda. As the fourth quarter of the Fund’s fiscal year end concluded, U.S. markets rallied once again to record highs. We believe that investor sentiment was boosted by hopes that the U.S. will reach trade agreements that could result in lower tariffs and optimism that the Federal Reserve could cut rates. For the one-year period ending June 30, 2025, mid-cap value stocks underperformed mid-cap growth stocks. Top contributors to performance: From a benchmark perspective, financials, communication services, and utilities were the top performing sectors. The consumer staples, health care, and utilities sectors were the largest positive contributors to the Fund’s relative performance.
Top detractors from performance: The health care and materials sectors were the largest detractors from relative performance. Security selection in the consumer discretionary, industrials, and energy sectors were the largest detractors from the Fund’s performance. Sector weights detracted from the Fund’s performance relative to the Index largely due to the Fund’s underweight allocation to the financials and communication services sectors. The Fund’s higher volatility and lower market capitalization relative to the Index were style headwinds.
|
| Performance Past Does Not Indicate Future [Text] |
The investment return and principal value will fluctuate so that an investor's shares, when redeemed, may be worth more or less than the original cost. Past performance is not a good predictor of the Fund's future performance.
|
| Line Graph [Table Text Block] |
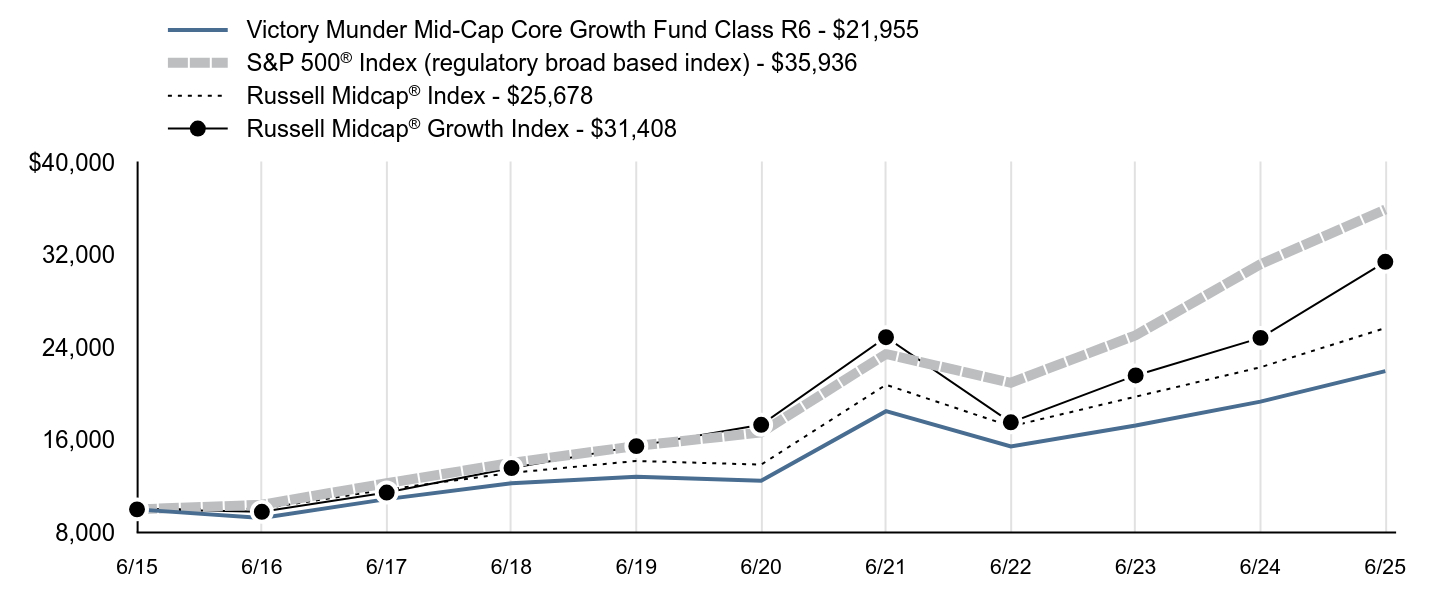
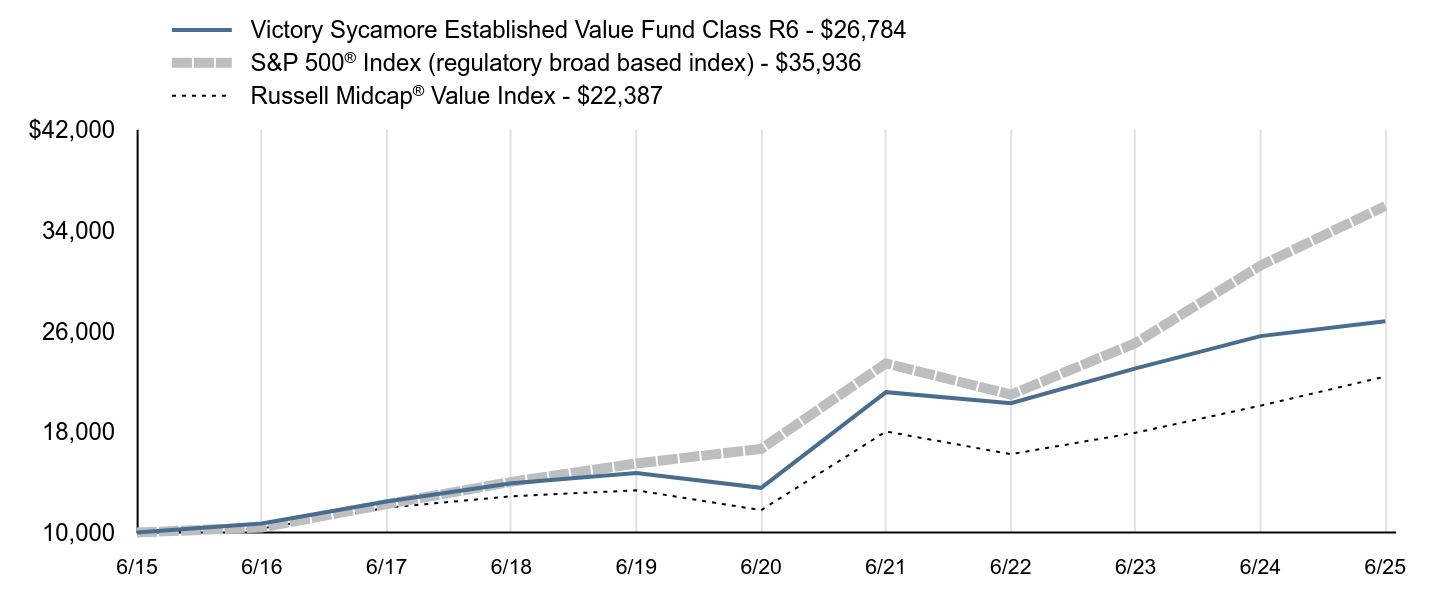
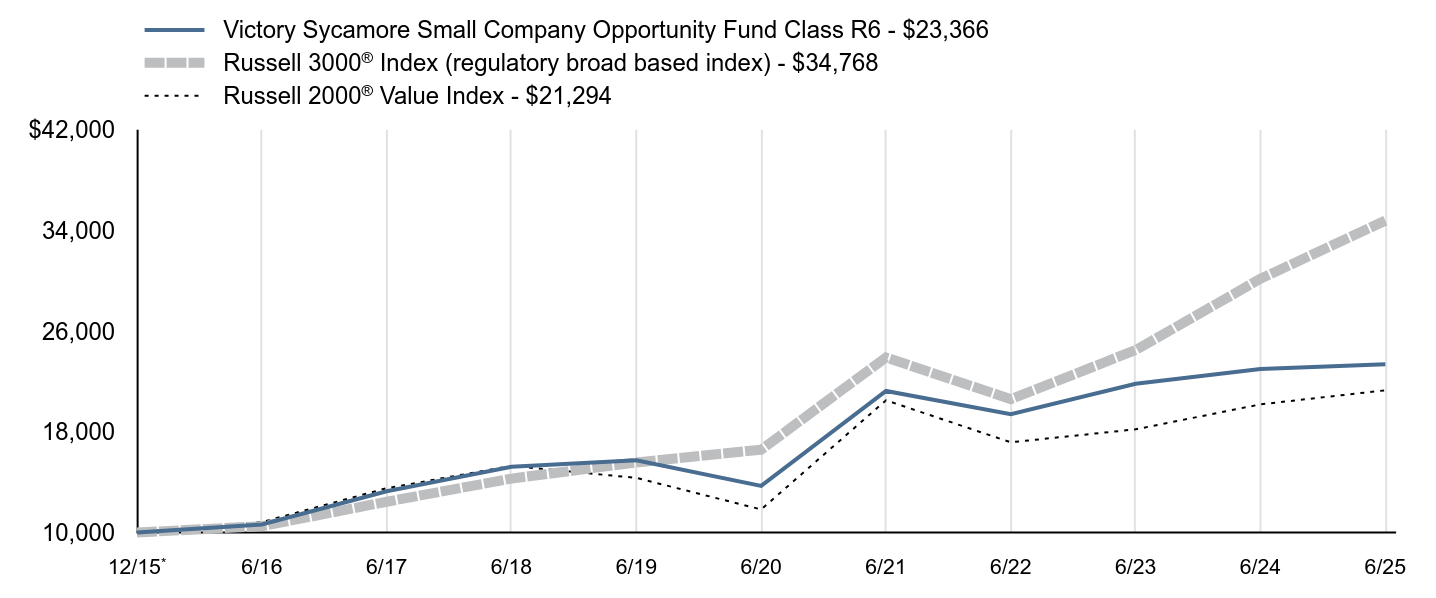
| Victory Integrity Mid-Cap Value Fund Class R6 - $25,697 | S&P 500® Index (regulatory broad based index) - $36,304 | Russell Midcap® Value Index - $24,136 |
|---|
12/15Footnote Reference* | $10,000 | $10,000 | $10,000 |
|---|
6/16 | $10,950 | $10,506 | $11,131 |
|---|
6/17 | $12,749 | $12,386 | $12,904 |
|---|
6/18 | $14,238 | $14,166 | $13,884 |
|---|
6/19 | $14,341 | $15,642 | $14,395 |
|---|
6/20 | $12,401 | $16,816 | $12,695 |
|---|
6/21 | $19,748 | $23,676 | $19,431 |
|---|
6/22 | $18,523 | $21,162 | $17,488 |
|---|
6/23 | $21,170 | $25,309 | $19,325 |
|---|
6/24 | $23,754 | $31,524 | $21,640 |
|---|
6/25 | $25,697 | $36,304 | $24,136 |
|---|
|
| Average Annual Return [Table Text Block] |
| 1 Year | 5 Year | Since Inception |
|---|
Class R6 | 8.18% | 15.69%Footnote Reference | 10.39% |
|---|
S&P 500® Index | 15.16% | 16.64% | 14.46% |
|---|
Russell Midcap® Value Index | 11.53% | 13.71% | 9.67% |
|---|
|
| No Deduction of Taxes [Text Block] |
The graph and table total returns do not reflect the deduction of taxes that a shareholder would pay on Fund distributions, or redemption of shares.
|
| AssetsNet |
$ 313,979,000
|
| Holdings Count | Holding |
112
|
| Advisory Fees Paid, Amount |
$ 2,350,000
|
| InvestmentCompanyPortfolioTurnover |
49.00%
|
| Additional Fund Statistics [Text Block] |
FUND STATISTICS($ amounts in 000s)(as of June 30, 2025)Net Assets | $313,979 |
|---|
Number of Holdings | 112 |
|---|
Investment Advisory Fees | $2,350 |
|---|
Portfolio Turnover | 49% |
|---|
|
| Holdings [Text Block] |
Top SectorsFootnote Reference* (% of Net Assets)Footnote Reference(as of June 30, 2025)Value | Value |
|---|
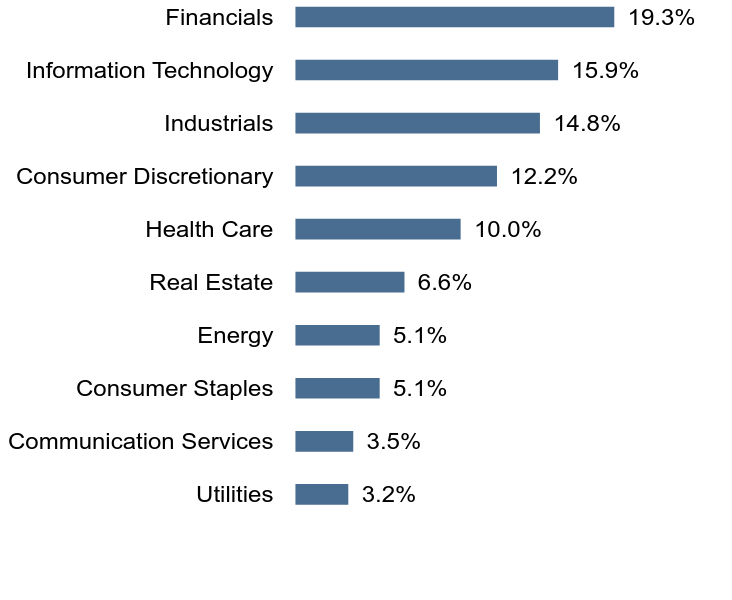
Consumer Staples | 6.6% | Energy | 6.7% | Materials | 6.7% | Utilities | 7.2% | Health Care | 8.2% | Consumer Discretionary | 8.3% | Real Estate | 9.2% | Information Technology | 10.2% | Financials | 15.1% | Industrials | 18.3% |
Top 10 HoldingsFootnote Reference* (% of Net Assets)Footnote Reference(as of June 30, 2025)Realty Income Corp. | 1.6% |
|---|
M&T Bank Corp. | 1.4% |
|---|
Raymond James Financial, Inc. | 1.4% |
|---|
Huntington Bancshares, Inc. | 1.4% |
|---|
Xcel Energy, Inc. | 1.3% |
|---|
VICI Properties, Inc. | 1.3% |
|---|
WP Carey, Inc. | 1.2% |
|---|
State Street Corp. | 1.2% |
|---|
STERIS PLC | 1.2% |
|---|
Nasdaq, Inc. | 1.2% |
|---|
|
| Material Fund Change [Text Block] |
|
| C000144992 |
|
| Shareholder Report [Line Items] |
|
| Fund Name |
Victory Integrity Mid-Cap Value Fund
|
| Class Name |
Class Y
|
| Trading Symbol |
MYIMX
|
| Annual or Semi-Annual Statement [Text Block] |
Annual Shareholder Report
|
| Shareholder Report Annual or Semi-Annual |
annual shareholder report
|
| Additional Information [Text Block] |
You can find additional information about the Fund at advisor.vcm.com/literature/mutual-fund-prospectuses. You may also request more information by calling 800-539-3863 or visiting vcm.com/contact-us.
|
| Additional Information Phone Number |
800-539-3863
|
| Additional Information Website |
vcm.com
|
| Expenses [Text Block] |
What were the Fund's costs for the last year?(based on a hypothetical $10,000 investment) Class Name | Costs of a $10,000 Investment | Costs paid as a percentage of a $10,000 Investment |
|---|
Class Y | $78 | 0.75% |
|---|
| | |
|---|
|
| Expenses Paid, Amount |
$ 78
|
| Expense Ratio, Percent |
0.75%
|
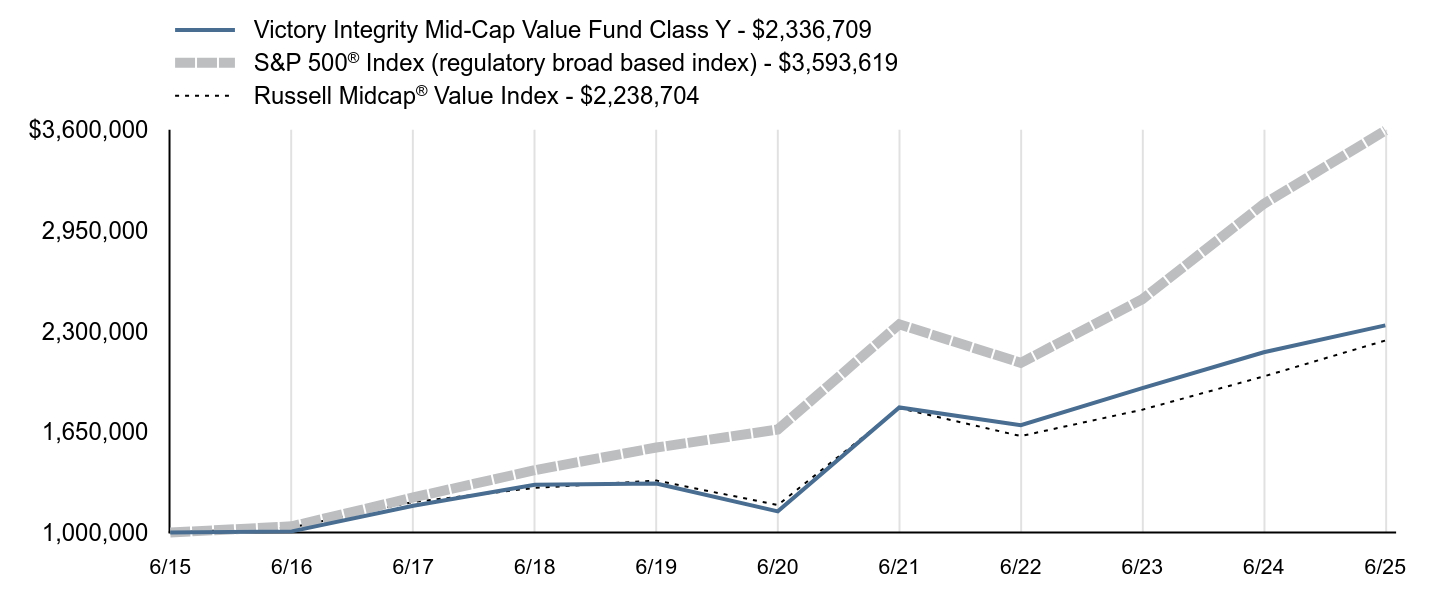
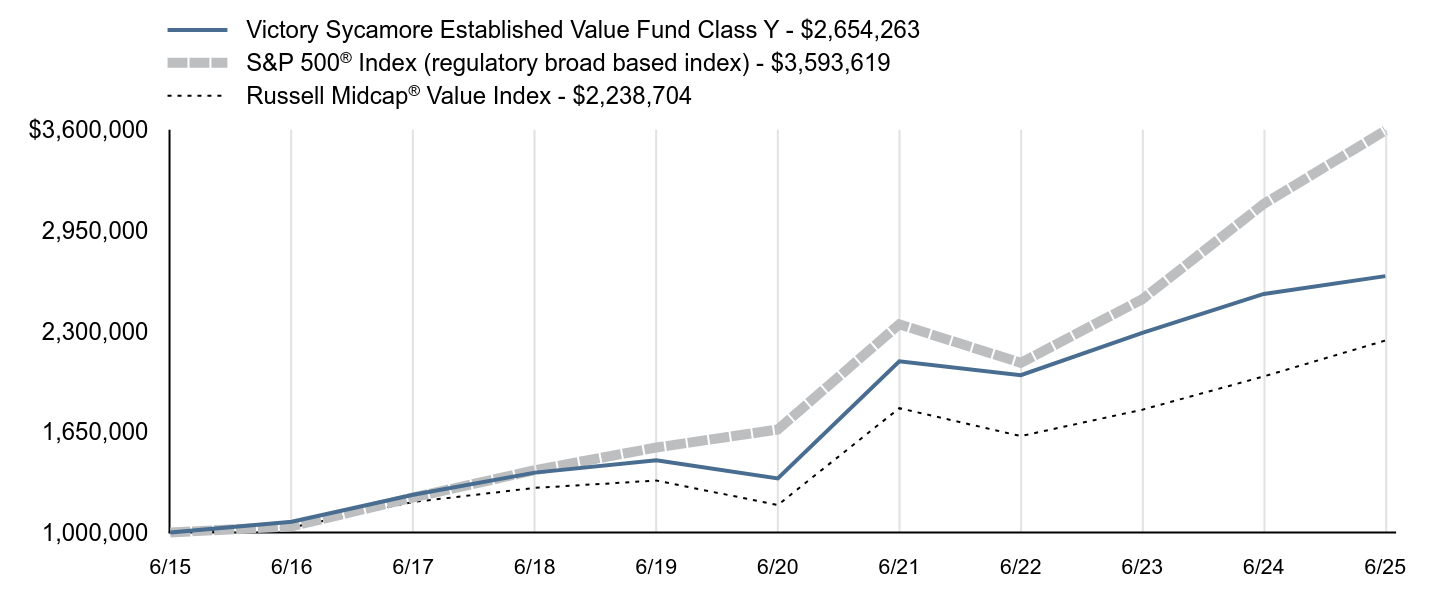
| Factors Affecting Performance [Text Block] |
What affected the Fund’s performance during the last year?For the fiscal year ended June 30, 2025, the Fund underperformed its benchmark, the Russell Midcap® Value Index (the “Index”). Over the last 12 months, U.S. equity market reactions to the Federal Reserve’s interest rate policy and President Trump’s tariff plans dominated headlines. Even though equities reached all-time highs in the fourth quarter of 2024, investor expectations for further rate cuts in 2025 began to cool. As the calendar turned to 2025, we believe market volatility increased due to concern and uncertainty regarding President Trump’s tariff agenda. As the fourth quarter of the Fund’s fiscal year end concluded, U.S. markets rallied once again to record highs. We believe that investor sentiment was boosted by hopes that the U.S. will reach trade agreements that could result in lower tariffs and optimism that the Federal Reserve could cut rates. For the one-year period ending June 30, 2025, mid-cap value stocks underperformed mid-cap growth stocks. Top contributors to performance: From a benchmark perspective, financials, communication services, and utilities were the top performing sectors. The consumer staples, health care, and utilities sectors were the largest positive contributors to the Fund’s relative performance.
Top detractors from performance: The health care and materials sectors were the largest detractors from relative performance. Security selection in the consumer discretionary, industrials, and energy sectors were the largest detractors from the Fund’s performance. Sector weights detracted from the Fund’s performance relative to the Index largely due to the Fund’s underweight allocation to the financials and communication services sectors. The Fund’s higher volatility and lower market capitalization relative to the Index were style headwinds.
|
| Performance Past Does Not Indicate Future [Text] |
The investment return and principal value will fluctuate so that an investor's shares, when redeemed, may be worth more or less than the original cost. Past performance is not a good predictor of the Fund's future performance.
|
| Line Graph [Table Text Block] |
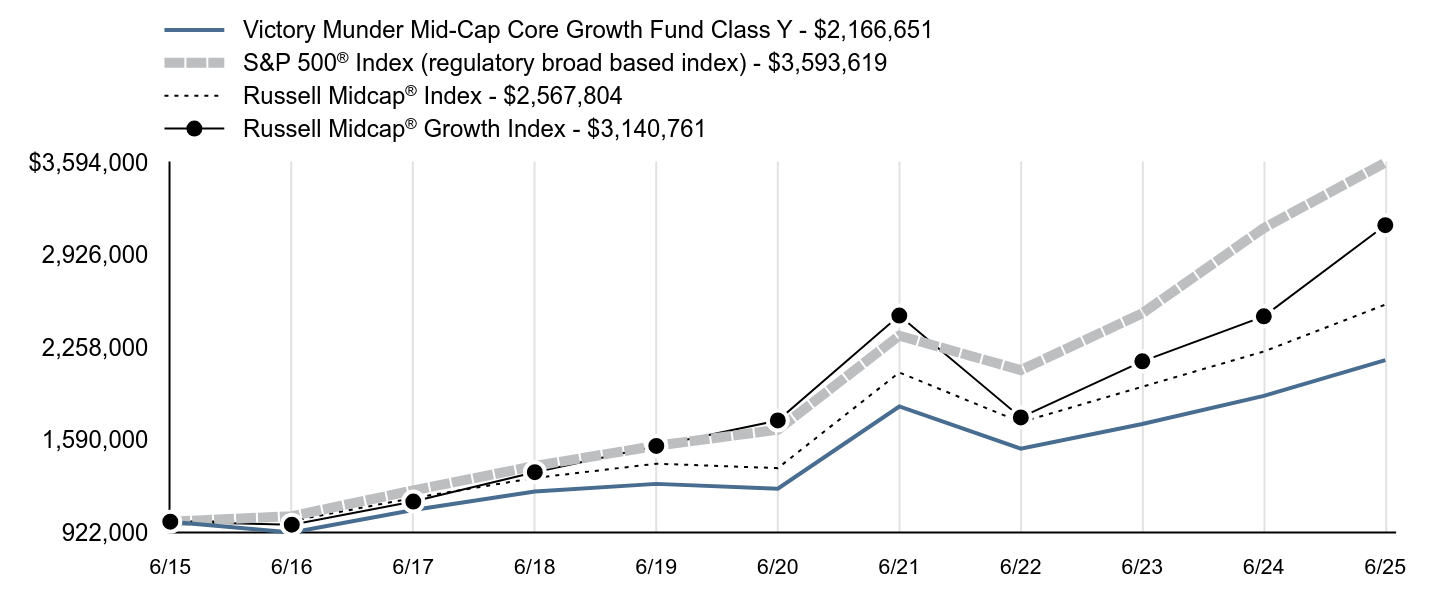
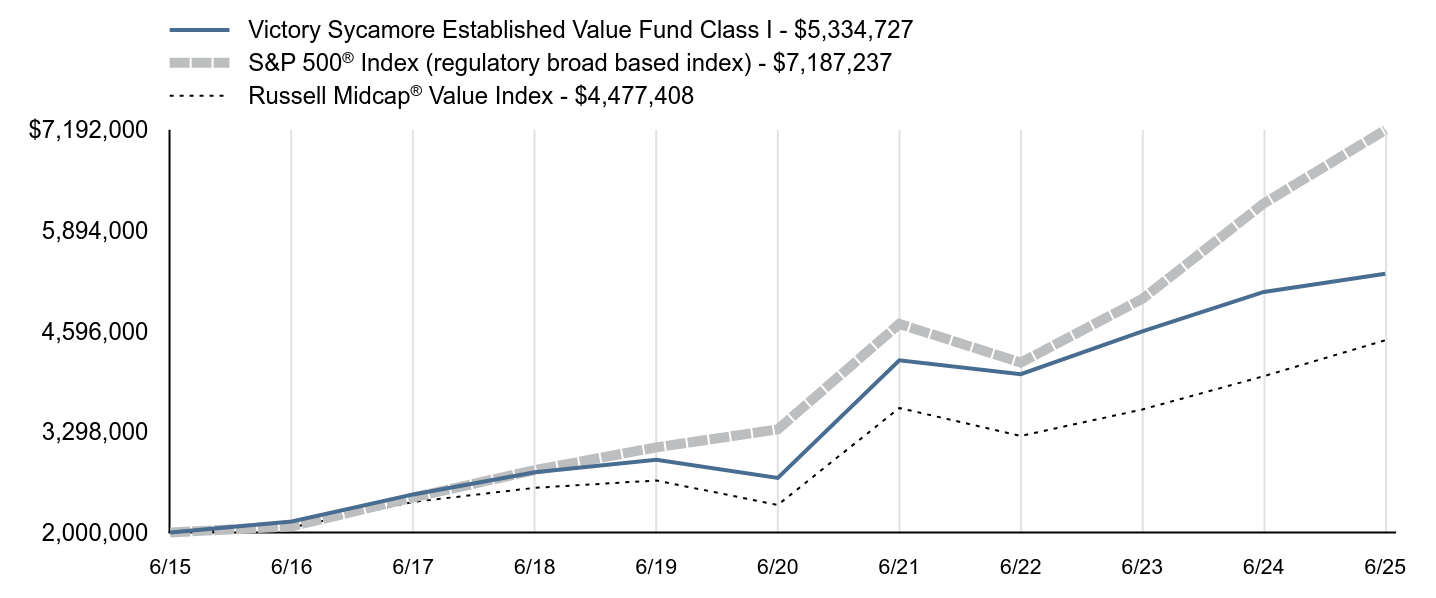
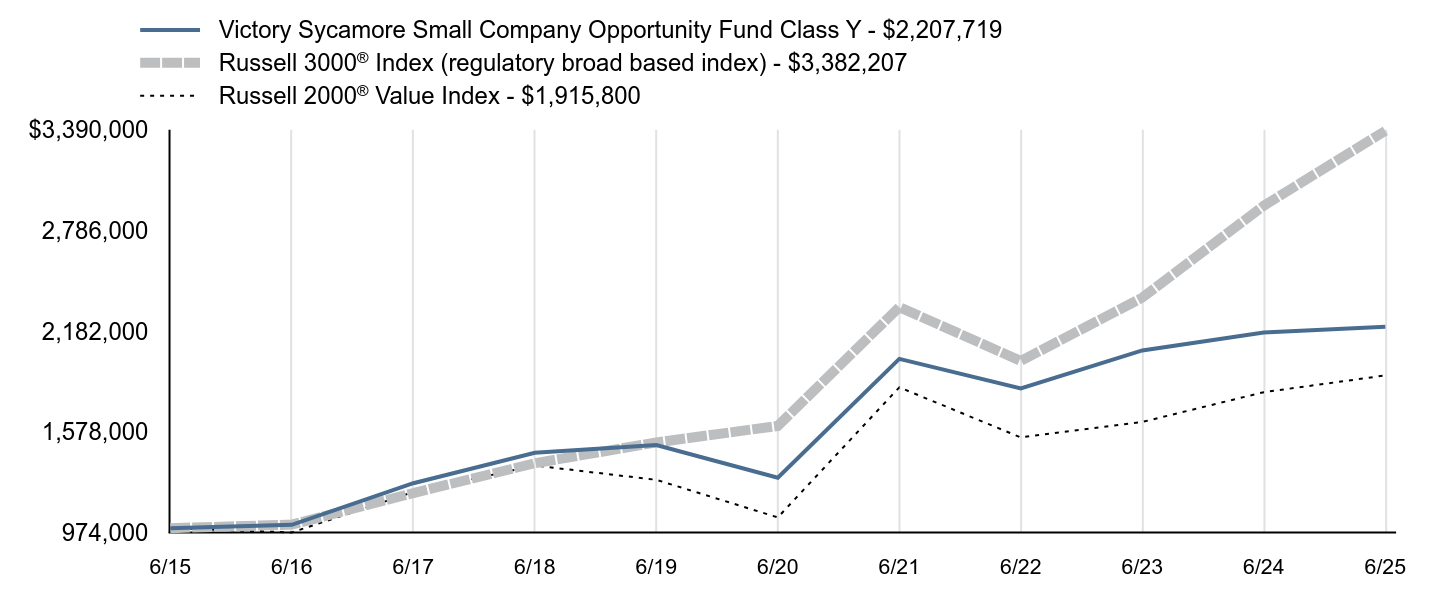
| Victory Integrity Mid-Cap Value Fund Class Y - $2,336,709 | S&P 500® Index (regulatory broad based index) - $3,593,619 | Russell Midcap® Value Index - $2,238,704 |
|---|
6/15 | $1,000,000 | $1,000,000 | $1,000,000 |
|---|
6/16 | $1,007,255 | $1,039,928 | $1,032,458 |
|---|
6/17 | $1,172,760 | $1,226,034 | $1,196,883 |
|---|
6/18 | $1,308,586 | $1,402,264 | $1,287,789 |
|---|
6/19 | $1,316,157 | $1,548,344 | $1,335,196 |
|---|
6/20 | $1,136,243 | $1,664,549 | $1,177,484 |
|---|
6/21 | $1,806,996 | $2,343,588 | $1,802,305 |
|---|
6/22 | $1,692,215 | $2,094,797 | $1,622,130 |
|---|
6/23 | $1,931,477 | $2,505,253 | $1,792,497 |
|---|
6/24 | $2,162,961 | $3,120,445 | $2,007,194 |
|---|
6/25 | $2,336,709 | $3,593,619 | $2,238,704 |
|---|
|
| Average Annual Return [Table Text Block] |
| 1 Year | 5 Year | 10 Year |
|---|
Class Y | 8.03% | 15.51%Footnote Reference | 8.86% |
|---|
S&P 500® Index | 15.16% | 16.64% | 13.65% |
|---|
Russell Midcap® Value Index | 11.53% | 13.71% | 8.39% |
|---|
|
| No Deduction of Taxes [Text Block] |
The graph and table total returns do not reflect the deduction of taxes that a shareholder would pay on Fund distributions, or redemption of shares.
|
| AssetsNet |
$ 313,979,000
|
| Holdings Count | Holding |
112
|
| Advisory Fees Paid, Amount |
$ 2,350,000
|
| InvestmentCompanyPortfolioTurnover |
49.00%
|
| Additional Fund Statistics [Text Block] |
FUND STATISTICS($ amounts in 000s)(as of June 30, 2025)Net Assets | $313,979 |
|---|
Number of Holdings | 112 |
|---|
Investment Advisory Fees | $2,350 |
|---|
Portfolio Turnover | 49% |
|---|
|
| Holdings [Text Block] |
Top SectorsFootnote Reference* (% of Net Assets)Footnote Reference(as of June 30, 2025)Value | Value |
|---|
Consumer Staples | 6.6% | Energy | 6.7% | Materials | 6.7% | Utilities | 7.2% | Health Care | 8.2% | Consumer Discretionary | 8.3% | Real Estate | 9.2% | Information Technology | 10.2% | Financials | 15.1% | Industrials | 18.3% |
Top 10 HoldingsFootnote Reference* (% of Net Assets)Footnote Reference(as of June 30, 2025)Realty Income Corp. | 1.6% |
|---|
M&T Bank Corp. | 1.4% |
|---|
Raymond James Financial, Inc. | 1.4% |
|---|
Huntington Bancshares, Inc. | 1.4% |
|---|
Xcel Energy, Inc. | 1.3% |
|---|
VICI Properties, Inc. | 1.3% |
|---|
WP Carey, Inc. | 1.2% |
|---|
State Street Corp. | 1.2% |
|---|
STERIS PLC | 1.2% |
|---|
Nasdaq, Inc. | 1.2% |
|---|
|
| Material Fund Change [Text Block] |
|
| C000219863 |
|
| Shareholder Report [Line Items] |
|
| Fund Name |
Victory Integrity Mid-Cap Value Fund
|
| Class Name |
Member Class
|
| Trading Symbol |
MMIJX
|
| Annual or Semi-Annual Statement [Text Block] |
Annual Shareholder Report
|
| Shareholder Report Annual or Semi-Annual |
annual shareholder report
|
| Additional Information [Text Block] |
You can find additional information about the Fund at advisor.vcm.com/literature/mutual-fund-prospectuses. You may also request more information by calling 800-235-8396 or visiting vcm.com/contact-us.
|
| Additional Information Phone Number |
800-235-8396
|
| Additional Information Website |
vcm.com
|
| Expenses [Text Block] |
What were the Fund's costs for the last year?(based on a hypothetical $10,000 investment) Class Name | Costs of a $10,000 Investment | Costs paid as a percentage of a $10,000 Investment |
|---|
Member Class | $88 | 0.85% |
|---|
| | |
|---|
|
| Expenses Paid, Amount |
$ 88
|
| Expense Ratio, Percent |
0.85%
|
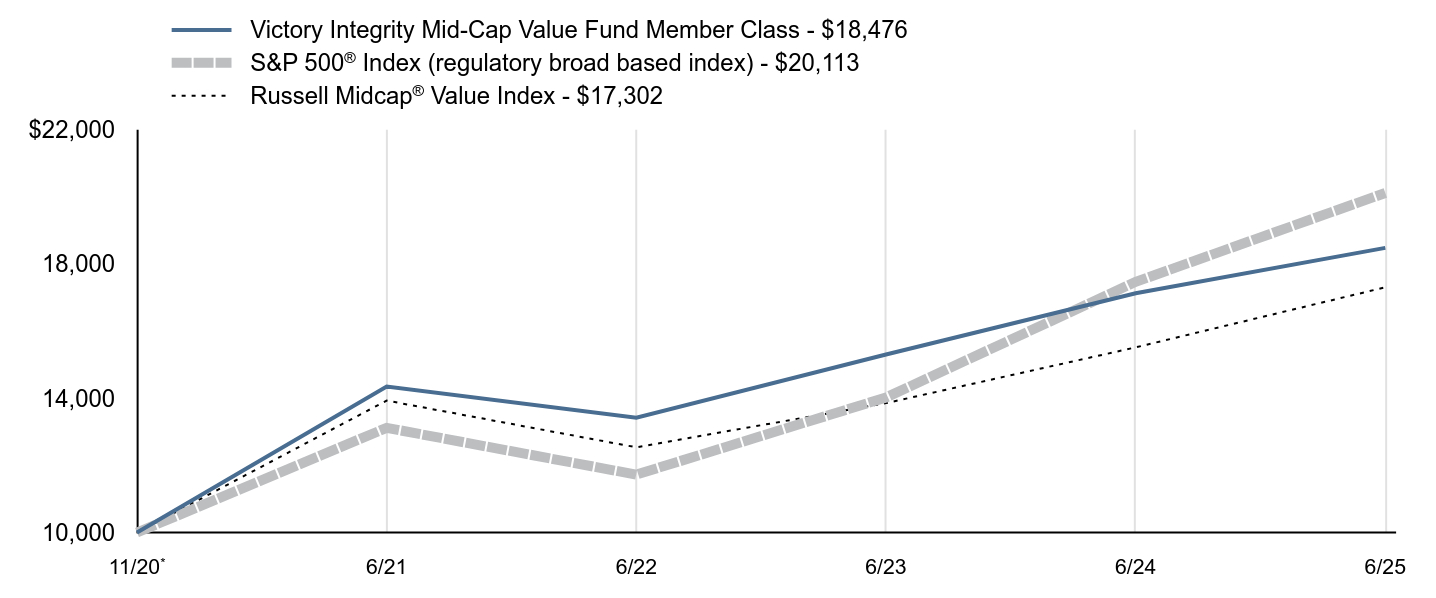
| Factors Affecting Performance [Text Block] |
What affected the Fund’s performance during the last year?For the fiscal year ended June 30, 2025, the Fund underperformed its benchmark, the Russell Midcap® Value Index (the “Index”). Over the last 12 months, U.S. equity market reactions to the Federal Reserve’s interest rate policy and President Trump’s tariff plans dominated headlines. Even though equities reached all-time highs in the fourth quarter of 2024, investor expectations for further rate cuts in 2025 began to cool. As the calendar turned to 2025, we believe market volatility increased due to concern and uncertainty regarding President Trump’s tariff agenda. As the fourth quarter of the Fund’s fiscal year end concluded, U.S. markets rallied once again to record highs. We believe that investor sentiment was boosted by hopes that the U.S. will reach trade agreements that could result in lower tariffs and optimism that the Federal Reserve could cut rates. For the one-year period ending June 30, 2025, mid-cap value stocks underperformed mid-cap growth stocks. Top contributors to performance: From a benchmark perspective, financials, communication services, and utilities were the top performing sectors. The consumer staples, health care, and utilities sectors were the largest positive contributors to the Fund’s relative performance.
Top detractors from performance: The health care and materials sectors were the largest detractors from relative performance. Security selection in the consumer discretionary, industrials, and energy sectors were the largest detractors from the Fund’s performance. Sector weights detracted from the Fund’s performance relative to the Index largely due to the Fund’s underweight allocation to the financials and communication services sectors. The Fund’s higher volatility and lower market capitalization relative to the Index were style headwinds.
|
| Performance Past Does Not Indicate Future [Text] |
The investment return and principal value will fluctuate so that an investor's shares, when redeemed, may be worth more or less than the original cost. Past performance is not a good predictor of the Fund's future performance.
|
| Line Graph [Table Text Block] |
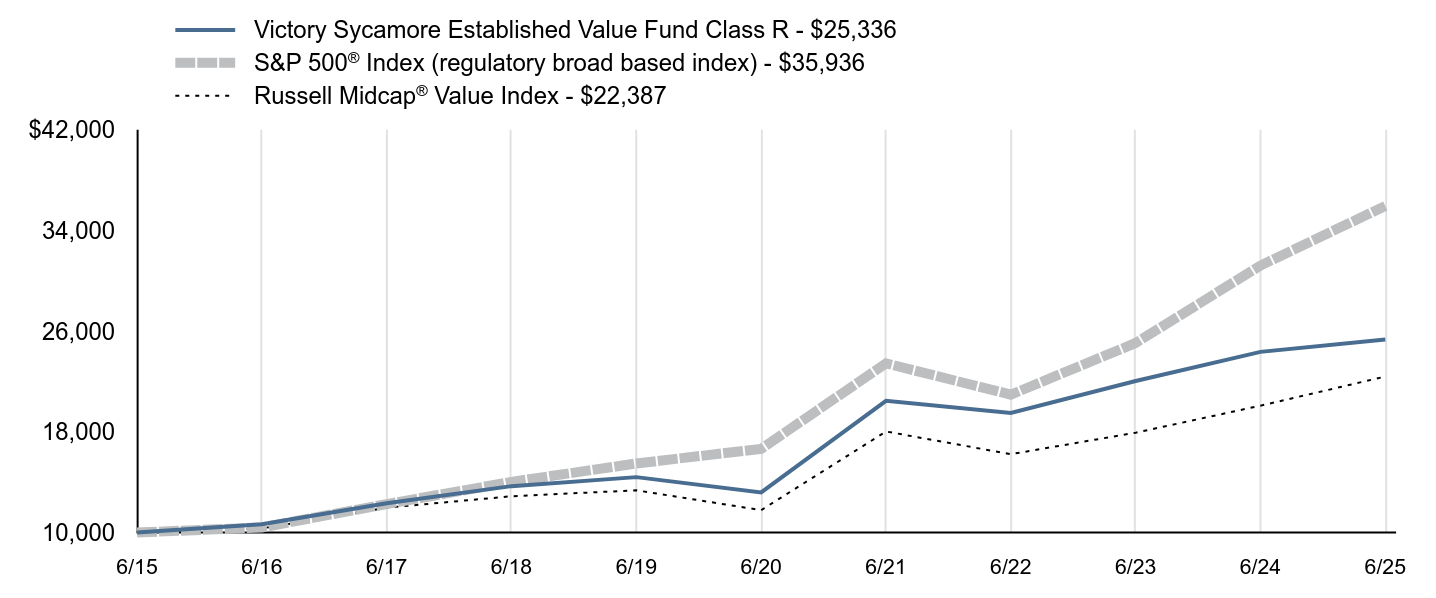
| Victory Integrity Mid-Cap Value Fund Member Class - $18,476 | S&P 500® Index (regulatory broad based index) - $20,113 | Russell Midcap® Value Index - $17,302 |
|---|
11/20Footnote Reference* | $10,000 | $10,000 | $10,000 |
|---|
6/21 | $14,346 | $13,117 | $13,929 |
|---|
6/22 | $13,420 | $11,724 | $12,537 |
|---|
6/23 | $15,301 | $14,021 | $13,853 |
|---|
6/24 | $17,124 | $17,465 | $15,513 |
|---|
6/25 | $18,476 | $20,113 | $17,302 |
|---|
|
| Average Annual Return [Table Text Block] |
| 1 Year | Since Inception |
|---|
Member Class | 7.89% | 14.09% |
|---|
S&P 500® Index | 15.16% | 16.19% |
|---|
Russell Midcap® Value Index | 11.53% | 12.49% |
|---|
|
| No Deduction of Taxes [Text Block] |
The graph and table total returns do not reflect the deduction of taxes that a shareholder would pay on Fund distributions, or redemption of shares.
|
| AssetsNet |
$ 313,979,000
|
| Holdings Count | Holding |
112
|
| Advisory Fees Paid, Amount |
$ 2,350,000
|
| InvestmentCompanyPortfolioTurnover |
49.00%
|
| Additional Fund Statistics [Text Block] |
FUND STATISTICS($ amounts in 000s)(as of June 30, 2025)Net Assets | $313,979 |
|---|
Number of Holdings | 112 |
|---|
Investment Advisory Fees | $2,350 |
|---|
Portfolio Turnover | 49% |
|---|
|
| Holdings [Text Block] |
Top SectorsFootnote Reference* (% of Net Assets)Footnote Reference(as of June 30, 2025)Value | Value |
|---|
Consumer Staples | 6.6% | Energy | 6.7% | Materials | 6.7% | Utilities | 7.2% | Health Care | 8.2% | Consumer Discretionary | 8.3% | Real Estate | 9.2% | Information Technology | 10.2% | Financials | 15.1% | Industrials | 18.3% |
Top 10 HoldingsFootnote Reference* (% of Net Assets)Footnote Reference(as of June 30, 2025)Realty Income Corp. | 1.6% |
|---|
M&T Bank Corp. | 1.4% |
|---|
Raymond James Financial, Inc. | 1.4% |
|---|
Huntington Bancshares, Inc. | 1.4% |
|---|
Xcel Energy, Inc. | 1.3% |
|---|
VICI Properties, Inc. | 1.3% |
|---|
WP Carey, Inc. | 1.2% |
|---|
State Street Corp. | 1.2% |
|---|
STERIS PLC | 1.2% |
|---|
Nasdaq, Inc. | 1.2% |
|---|
|
| Material Fund Change [Text Block] |
|
| C000144977 |
|
| Shareholder Report [Line Items] |
|
| Fund Name |
Victory Integrity Small-Cap Value Fund
|
| Class Name |
Class A
|
| Trading Symbol |
VSCVX
|
| Annual or Semi-Annual Statement [Text Block] |
Annual Shareholder Report
|
| Shareholder Report Annual or Semi-Annual |
annual shareholder report
|
| Additional Information [Text Block] |
You can find additional information about the Fund at advisor.vcm.com/literature/mutual-fund-prospectuses. You may also request more information by calling 800-539-3863 or visiting vcm.com/contact-us.
|
| Additional Information Phone Number |
800-539-3863
|
| Additional Information Website |
vcm.com
|
| Expenses [Text Block] |
What were the Fund's costs for the last year?(based on a hypothetical $10,000 investment) Class Name | Costs of a $10,000 Investment | Costs paid as a percentage of a $10,000 Investment |
|---|
Class A | $141 | 1.43% |
|---|
| | |
|---|
|
| Expenses Paid, Amount |
$ 141
|
| Expense Ratio, Percent |
1.43%
|
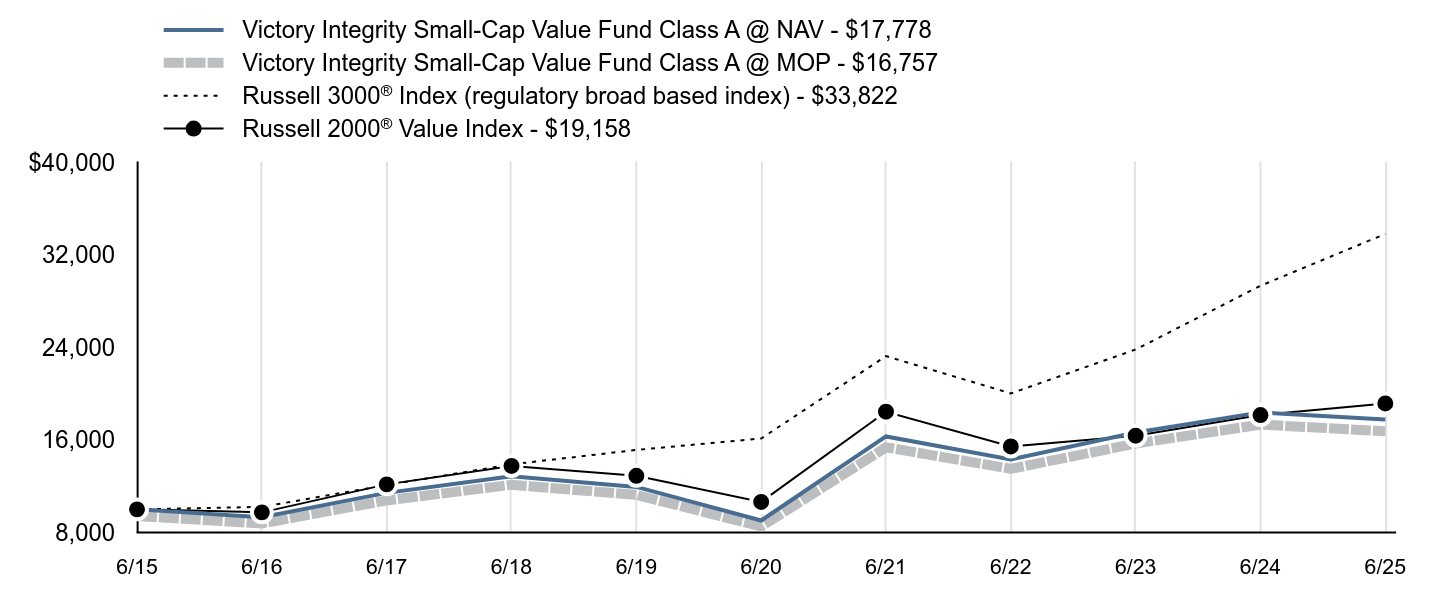
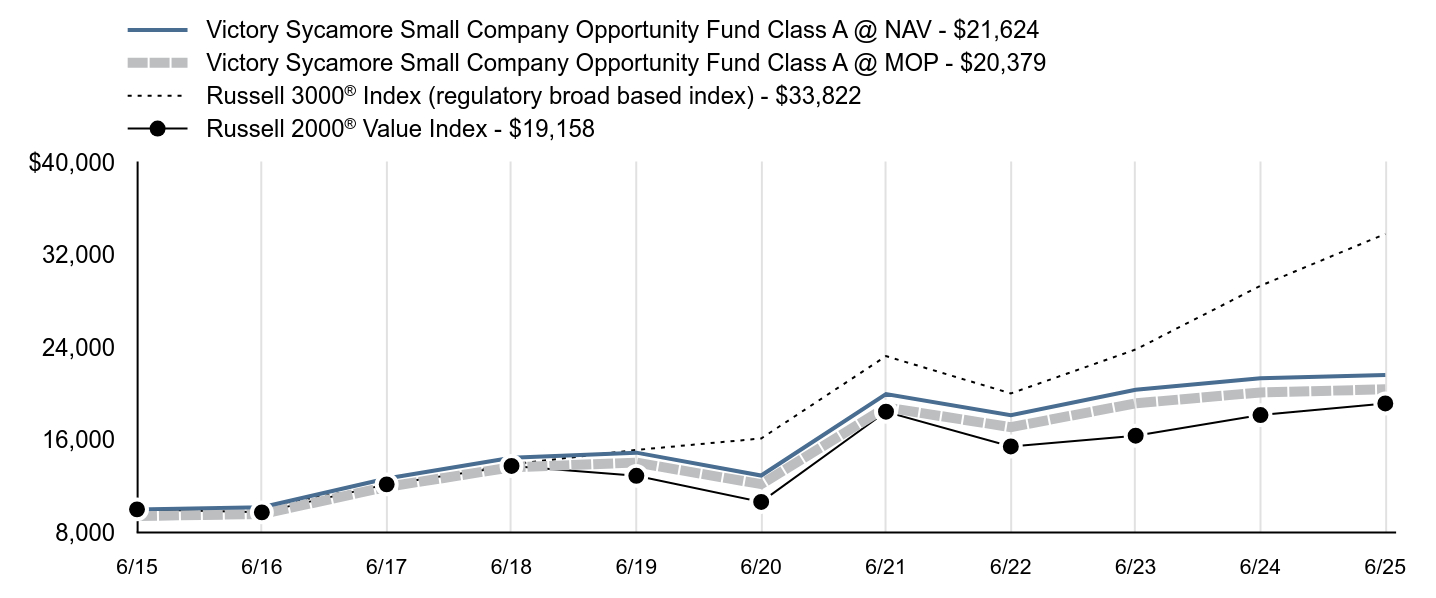
| Factors Affecting Performance [Text Block] |
What affected the Fund’s performance during the last year?For the fiscal year ended June 30, 2025, the Fund underperformed its benchmark, the Russell 2000® Value Index (the “Index”). Over the last 12 months, U.S. equity market reactions to the Federal Reserve’s interest rate policy and President Trump’s tariff plans dominated headlines. Even though equities reached all-time highs in the fourth quarter of 2024, investor expectations for further rate cuts in 2025 began to cool. As the calendar turned to 2025, we believe market volatility increased due to concern and uncertainty regarding President Trump’s tariff agenda. As the fourth quarter of the Fund’s fiscal year end concluded, U.S. markets rallied once again to record highs. We believe that investor sentiment was boosted by hopes that the U.S. will reach trade agreements that could result in lower tariffs and optimism that the Federal Reserve could cut rates. For the one-year period ending June 30, 2025, small value stocks underperformed small growth stocks. Top contributors to performance: From a benchmark perspective, communication services, information technology, and financials were the top performing sectors. The health care and utilities sectors were the largest positive contributors to the Fund’s performance. Sector weights contributed positively to the Fund’s performance relative to the Index largely due to the Fund’s underweight allocation to the health care sector and the Fund’s overweight allocations to the utilities and information technology sectors.
Top detractors from performance: The energy and health care sectors were the largest detractors from relative performance. Security selection in the industrials, materials, and consumer discretionary sectors were the largest detractors from the Fund’s performance. From a style perspective, the Fund’s holdings on average, had lower beta and higher volume relative to the Index and both were headwinds.
|
| Performance Past Does Not Indicate Future [Text] |
The investment return and principal value will fluctuate so that an investor's shares, when redeemed, may be worth more or less than the original cost. Past performance is not a good predictor of the Fund's future performance.
|
| Line Graph [Table Text Block] |
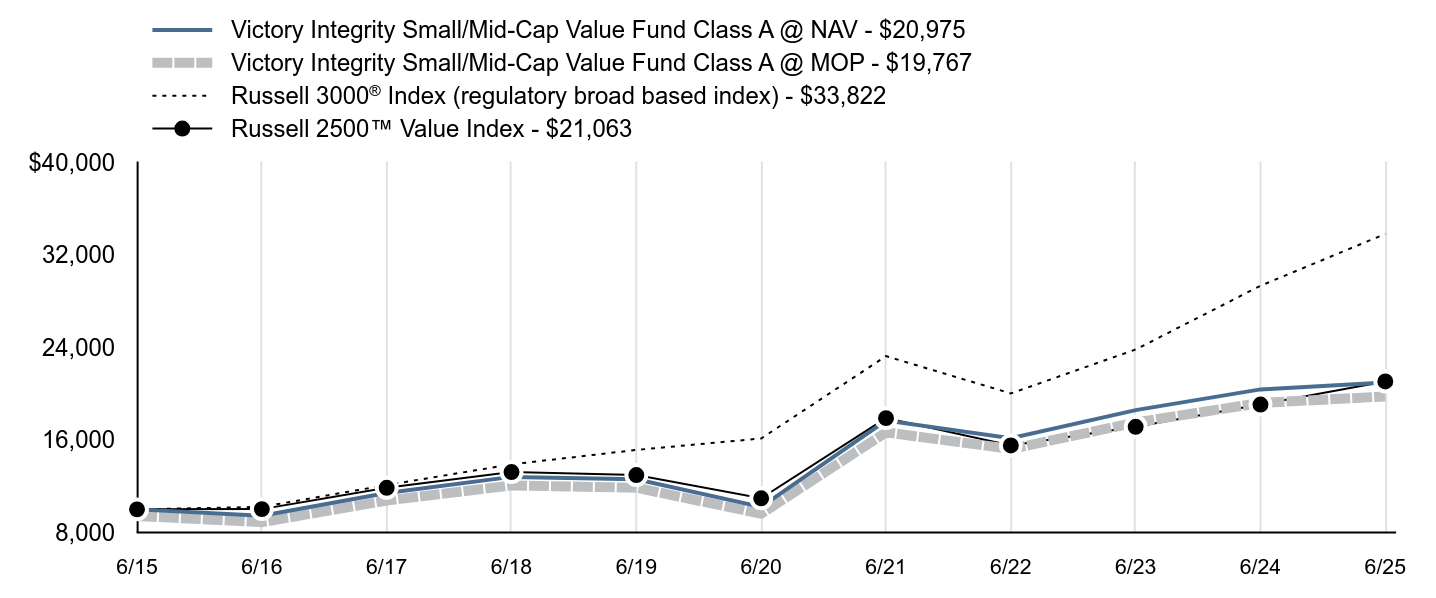
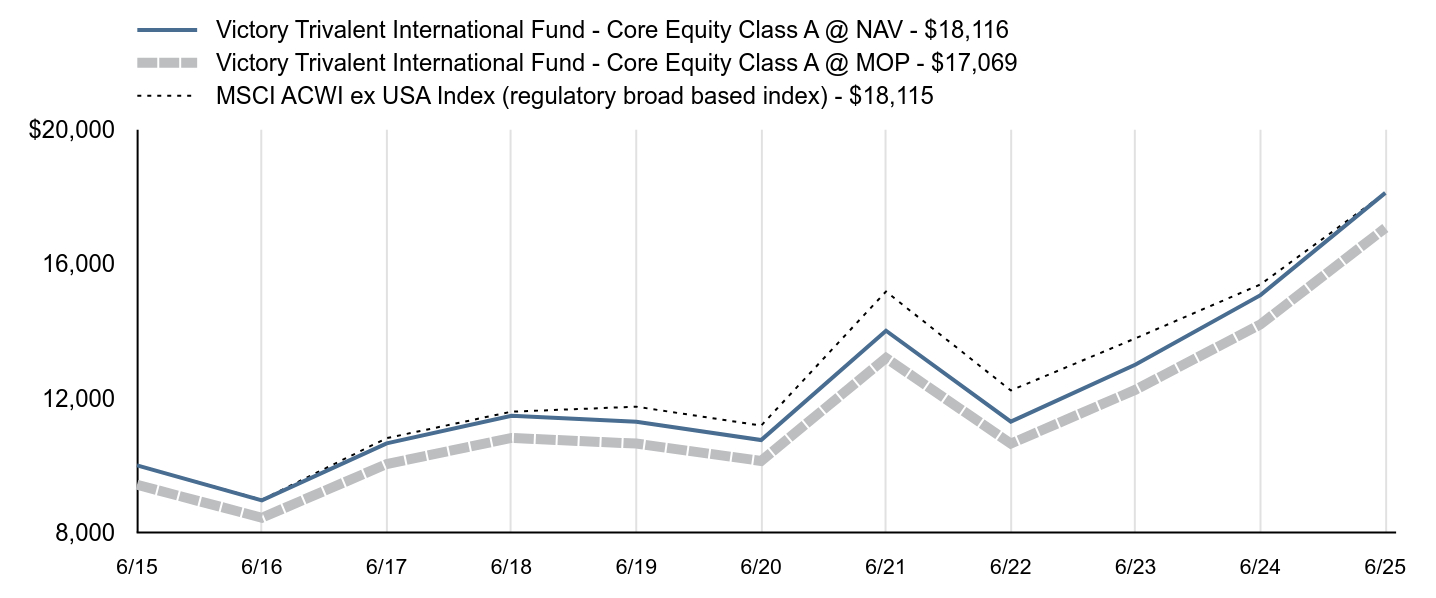
| Victory Integrity Small-Cap Value Fund Class A @ NAV - $17,778 | Victory Integrity Small-Cap Value Fund Class A @ MOP - $16,757 | Russell 3000® Index (regulatory broad based index) - $33,822 | Russell 2000® Value Index - $19,158 |
|---|
6/15 | $10,000 | $9,426 | $10,000 | $10,000 |
|---|
6/16 | $9,313 | $8,778 | $10,214 | $9,742 |
|---|
6/17 | $11,429 | $10,773 | $12,104 | $12,163 |
|---|
6/18 | $12,864 | $12,125 | $13,893 | $13,757 |
|---|
6/19 | $11,943 | $11,257 | $15,141 | $12,899 |
|---|
6/20 | $9,038 | $8,519 | $16,130 | $10,645 |
|---|
6/21 | $16,305 | $15,368 | $23,253 | $18,445 |
|---|
6/22 | $14,326 | $13,504 | $20,029 | $15,442 |
|---|
6/23 | $16,652 | $15,695 | $23,825 | $16,370 |
|---|
6/24 | $18,387 | $17,331 | $29,335 | $18,153 |
|---|
6/25 | $17,778 | $16,757 | $33,822 | $19,158 |
|---|
|
| Average Annual Return [Table Text Block] |
| 1 Year | 5 Year | 10 Year |
|---|
Class A @ NAV | -3.31% | 14.49% | 5.92% |
|---|
Class A @ MOP | -8.88% | 13.14% | 5.30% |
|---|
Russell 3000® Index | 15.30% | 15.96% | 12.96% |
|---|
Russell 2000® Value Index | 5.54% | 12.47% | 6.72% |
|---|
|
| No Deduction of Taxes [Text Block] |
The graph and table total returns do not reflect the deduction of taxes that a shareholder would pay on Fund distributions, or redemption of shares.
|
| Previous Investment Adviser [Text Block] |
The maximum offering price (“MOP”) figures reflect a maximum sales charge of 5.75% for Class A. The Net Asset Value ("NAV") figures do not reflect sales charges.
|
| AssetsNet |
$ 1,010,876,000
|
| Holdings Count | Holding |
127
|
| Advisory Fees Paid, Amount |
$ 9,956,000
|
| InvestmentCompanyPortfolioTurnover |
44.00%
|
| Additional Fund Statistics [Text Block] |
FUND STATISTICS($ amounts in 000s)(as of June 30, 2025)Net Assets | $1,010,876 |
|---|
Number of Holdings | 127 |
|---|
Investment Advisory Fees | $9,956 |
|---|
Portfolio Turnover | 44% |
|---|
|
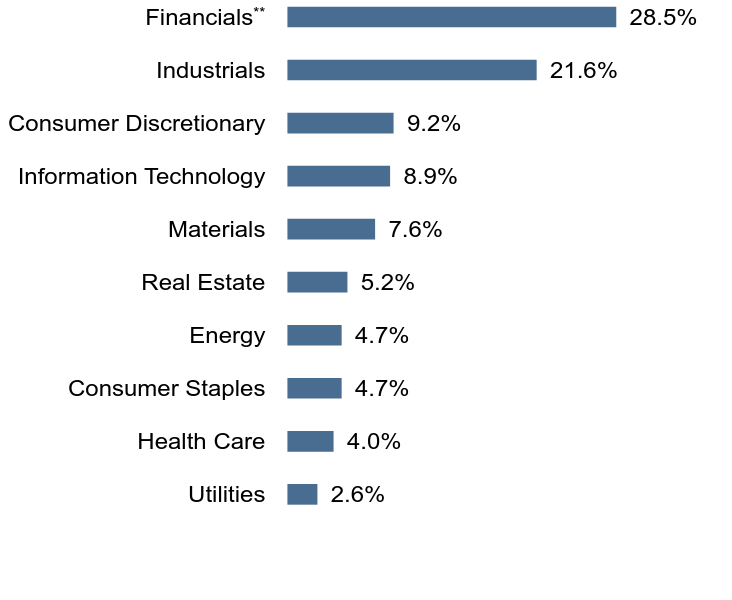
| Holdings [Text Block] |
Top SectorsFootnote Reference* (% of Net Assets)Footnote Reference(as of June 30, 2025)Value | Value |
|---|
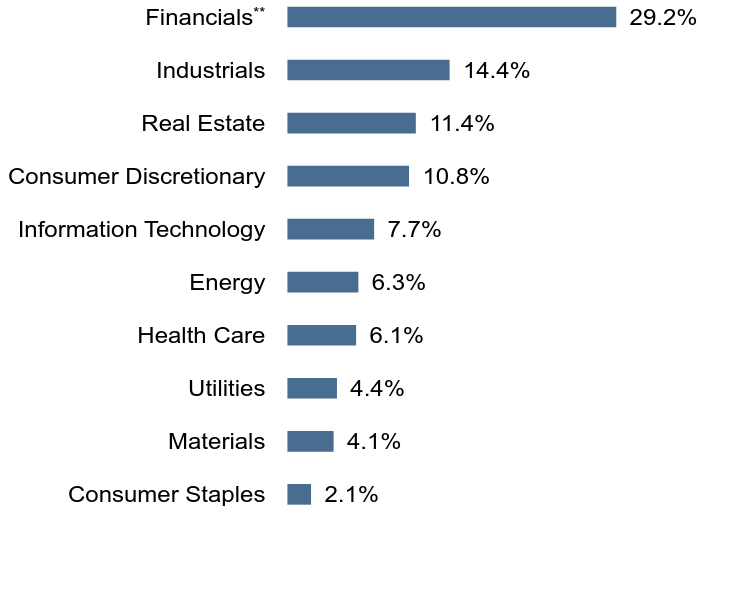
Consumer Staples | 2.1% | Materials | 4.1% | Utilities | 4.4% | Health Care | 6.1% | Energy | 6.3% | Information Technology | 7.7% | Consumer Discretionary | 10.8% | Real Estate | 11.4% | Industrials | 14.4% | FinancialsFootnote Reference** | 29.2% |
Top 10 HoldingsFootnote Reference* (% of Net Assets)Footnote Reference(as of June 30, 2025)Glacier Bancorp, Inc. | 1.3% |
|---|
Essent Group Ltd. | 1.3% |
|---|
Ameris Bancorp | 1.3% |
|---|
Hancock Whitney Corp. | 1.3% |
|---|
Valley National Bancorp | 1.2% |
|---|
Bank of Hawaii Corp. | 1.2% |
|---|
Taylor Morrison Home Corp. | 1.2% |
|---|
SouthState Corp. | 1.2% |
|---|
Flagstar Financial, Inc. | 1.2% |
|---|
The Chefs' Warehouse, Inc. | 1.1% |
|---|
|
| Material Fund Change [Text Block] |
|
| C000144978 |
|
| Shareholder Report [Line Items] |
|
| Fund Name |
Victory Integrity Small-Cap Value Fund
|
| Class Name |
Class C
|
| Trading Symbol |
MCVSX
|
| Annual or Semi-Annual Statement [Text Block] |
Annual Shareholder Report
|
| Shareholder Report Annual or Semi-Annual |
annual shareholder report
|
| Additional Information [Text Block] |
You can find additional information about the Fund at advisor.vcm.com/literature/mutual-fund-prospectuses. You may also request more information by calling 800-539-3863 or visiting vcm.com/contact-us.
|
| Additional Information Phone Number |
800-539-3863
|
| Additional Information Website |
vcm.com
|
| Expenses [Text Block] |
What were the Fund's costs for the last year?(based on a hypothetical $10,000 investment) Class Name | Costs of a $10,000 Investment | Costs paid as a percentage of a $10,000 Investment |
|---|
Class C | $230 | 2.35% |
|---|
| | |
|---|
|
| Expenses Paid, Amount |
$ 230
|
| Expense Ratio, Percent |
2.35%
|
| Factors Affecting Performance [Text Block] |
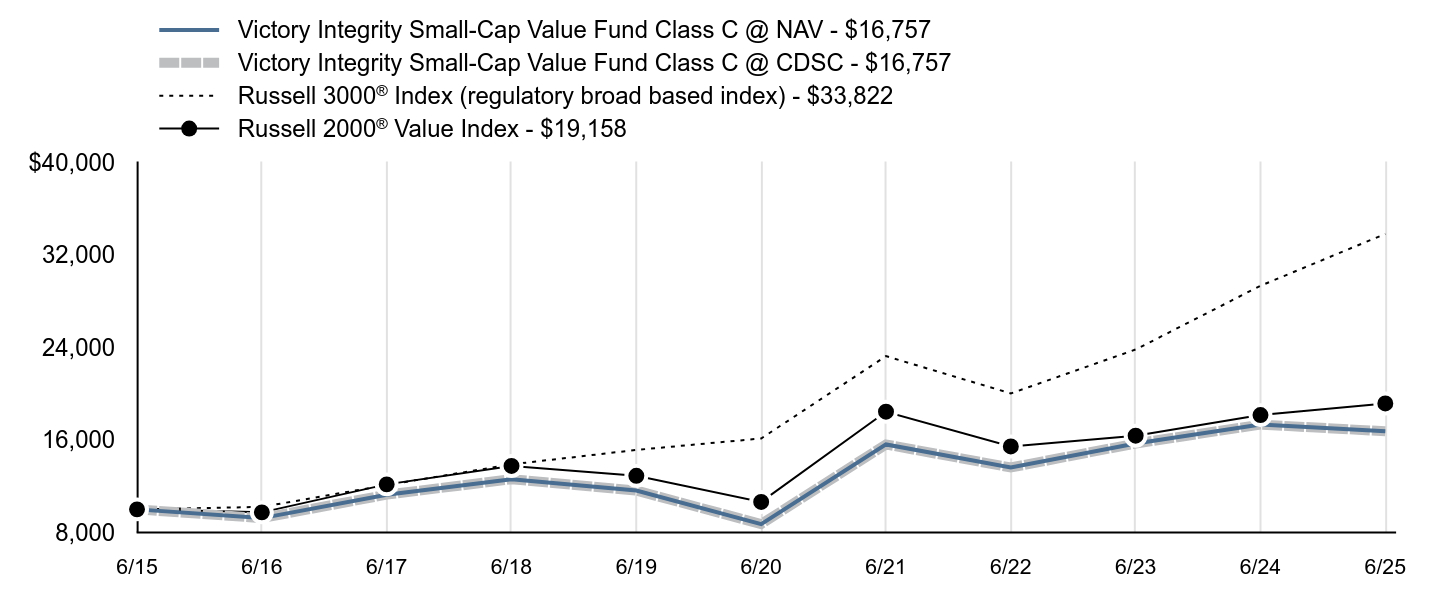
What affected the Fund’s performance during the last year?For the fiscal year ended June 30, 2025, the Fund underperformed its benchmark, the Russell 2000® Value Index (the “Index”). Over the last 12 months, U.S. equity market reactions to the Federal Reserve’s interest rate policy and President Trump’s tariff plans dominated headlines. Even though equities reached all-time highs in the fourth quarter of 2024, investor expectations for further rate cuts in 2025 began to cool. As the calendar turned to 2025, we believe market volatility increased due to concern and uncertainty regarding President Trump’s tariff agenda. As the fourth quarter of the Fund’s fiscal year end concluded, U.S. markets rallied once again to record highs. We believe that investor sentiment was boosted by hopes that the U.S. will reach trade agreements that could result in lower tariffs and optimism that the Federal Reserve could cut rates. For the one-year period ending June 30, 2025, small value stocks underperformed small growth stocks. Top contributors to performance: From a benchmark perspective, communication services, information technology, and financials were the top performing sectors. The health care and utilities sectors were the largest positive contributors to the Fund’s performance. Sector weights contributed positively to the Fund’s performance relative to the Index largely due to the Fund’s underweight allocation to the health care sector and the Fund’s overweight allocations to the utilities and information technology sectors.
Top detractors from performance: The energy and health care sectors were the largest detractors from relative performance. Security selection in the industrials, materials, and consumer discretionary sectors were the largest detractors from the Fund’s performance. From a style perspective, the Fund’s holdings on average, had lower beta and higher volume relative to the Index and both were headwinds.
|
| Performance Past Does Not Indicate Future [Text] |
The investment return and principal value will fluctuate so that an investor's shares, when redeemed, may be worth more or less than the original cost. Past performance is not a good predictor of the Fund's future performance.
|
| Line Graph [Table Text Block] |
| Victory Integrity Small-Cap Value Fund Class C @ NAV - $16,757 | Victory Integrity Small-Cap Value Fund Class C @ CDSC - $16,757 | Russell 3000® Index (regulatory broad based index) - $33,822 | Russell 2000® Value Index - $19,158 |
|---|
6/15 | $10,000 | $10,000 | $10,000 | $10,000 |
|---|
6/16 | $9,244 | $9,244 | $10,214 | $9,742 |
|---|
6/17 | $11,271 | $11,271 | $12,104 | $12,163 |
|---|
6/18 | $12,608 | $12,608 | $13,893 | $13,757 |
|---|
6/19 | $11,627 | $11,627 | $15,141 | $12,899 |
|---|
6/20 | $8,730 | $8,730 | $16,130 | $10,645 |
|---|
6/21 | $15,615 | $15,615 | $23,253 | $18,445 |
|---|
6/22 | $13,621 | $13,621 | $20,029 | $15,442 |
|---|
6/23 | $15,696 | $15,696 | $23,825 | $16,370 |
|---|
6/24 | $17,331 | $17,331 | $29,335 | $18,153 |
|---|
6/25 | $16,757 | $16,757 | $33,822 | $19,158 |
|---|
|
| Average Annual Return [Table Text Block] |
| 1 Year | 5 Year | 10 Year |
|---|
Class C @ NAV | -4.24% | 13.50% | 5.30% |
|---|
Class C @ CDSC | -5.01% | 13.50% | 5.30% |
|---|
Russell 3000® Index | 15.30% | 15.96% | 12.96% |
|---|
Russell 2000® Value Index | 5.54% | 12.47% | 6.72% |
|---|
|
| No Deduction of Taxes [Text Block] |
The graph and table total returns do not reflect the deduction of taxes that a shareholder would pay on Fund distributions, or redemption of shares.
|
| Previous Investment Adviser [Text Block] |
Class C is not subject to an initial sales charge, but is subject to Contingent Deferred Sales Charge (“CDSC”) of 1.00% on shares redeemed within one year of purchase. The Net Asset Value ("NAV") figures do not reflect sales charges.
|
| AssetsNet |
$ 1,010,876,000
|
| Holdings Count | Holding |
127
|
| Advisory Fees Paid, Amount |
$ 9,956,000
|
| InvestmentCompanyPortfolioTurnover |
44.00%
|
| Additional Fund Statistics [Text Block] |
FUND STATISTICS($ amounts in 000s)(as of June 30, 2025)Net Assets | $1,010,876 |
|---|
Number of Holdings | 127 |
|---|
Investment Advisory Fees | $9,956 |
|---|
Portfolio Turnover | 44% |
|---|
|
| Holdings [Text Block] |
Top SectorsFootnote Reference* (% of Net Assets)Footnote Reference(as of June 30, 2025)Value | Value |
|---|
Consumer Staples | 2.1% | Materials | 4.1% | Utilities | 4.4% | Health Care | 6.1% | Energy | 6.3% | Information Technology | 7.7% | Consumer Discretionary | 10.8% | Real Estate | 11.4% | Industrials | 14.4% | FinancialsFootnote Reference** | 29.2% |
Top 10 HoldingsFootnote Reference* (% of Net Assets)Footnote Reference(as of June 30, 2025)Glacier Bancorp, Inc. | 1.3% |
|---|
Essent Group Ltd. | 1.3% |
|---|
Ameris Bancorp | 1.3% |
|---|
Hancock Whitney Corp. | 1.3% |
|---|
Valley National Bancorp | 1.2% |
|---|
Bank of Hawaii Corp. | 1.2% |
|---|
Taylor Morrison Home Corp. | 1.2% |
|---|
SouthState Corp. | 1.2% |
|---|
Flagstar Financial, Inc. | 1.2% |
|---|
The Chefs' Warehouse, Inc. | 1.1% |
|---|
|
| Material Fund Change [Text Block] |
|
| C000144979 |
|
| Shareholder Report [Line Items] |
|
| Fund Name |
Victory Integrity Small-Cap Value Fund
|
| Class Name |
Class R
|
| Trading Symbol |
MRVSX
|
| Annual or Semi-Annual Statement [Text Block] |
Annual Shareholder Report
|
| Shareholder Report Annual or Semi-Annual |
annual shareholder report
|
| Additional Information [Text Block] |
You can find additional information about the Fund at advisor.vcm.com/literature/mutual-fund-prospectuses. You may also request more information by calling 800-539-3863 or visiting vcm.com/contact-us.
|
| Additional Information Phone Number |
800-539-3863
|
| Additional Information Website |
vcm.com
|
| Expenses [Text Block] |
What were the Fund's costs for the last year?(based on a hypothetical $10,000 investment) Class Name | Costs of a $10,000 Investment | Costs paid as a percentage of a $10,000 Investment |
|---|
Class R | $172 | 1.75% |
|---|
| | |
|---|
|
| Expenses Paid, Amount |
$ 172
|
| Expense Ratio, Percent |
1.75%
|
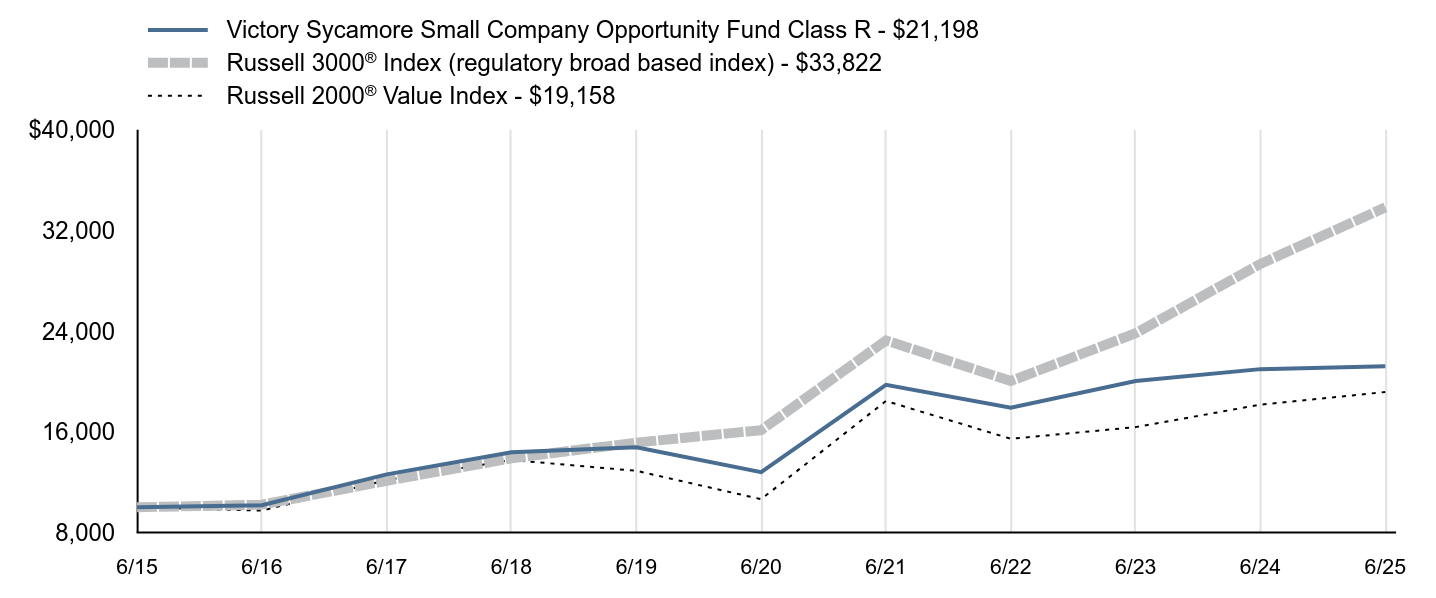
| Factors Affecting Performance [Text Block] |
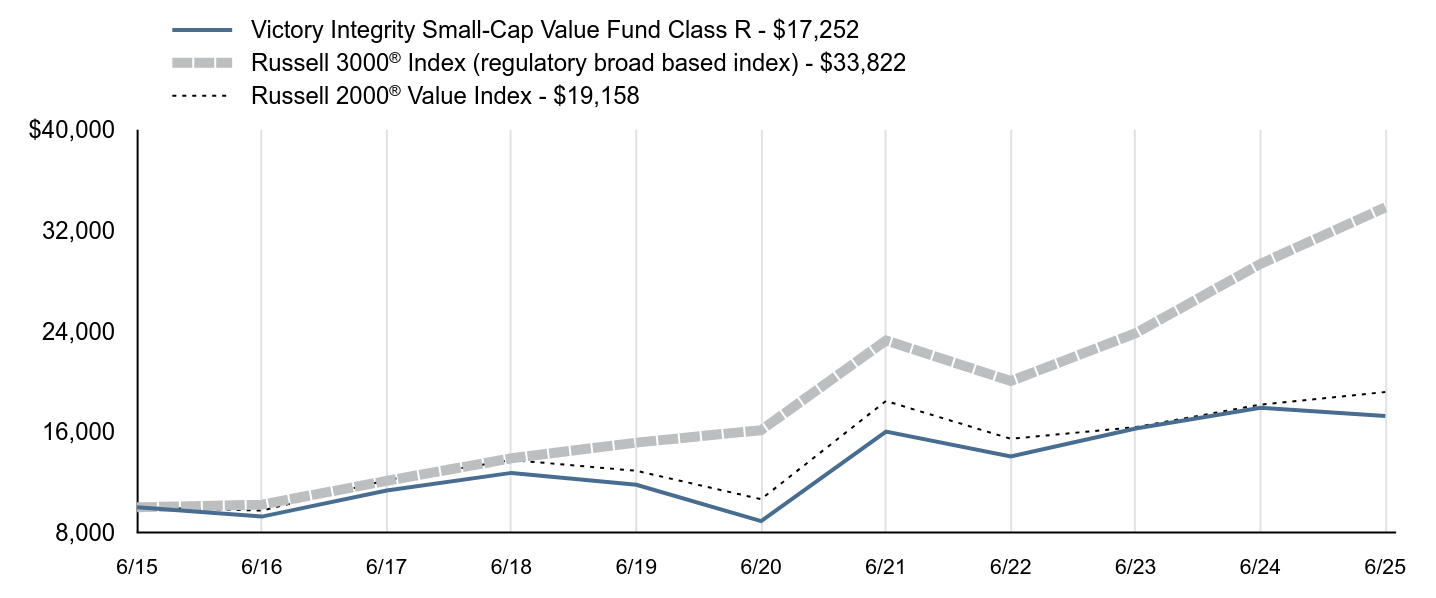
What affected the Fund’s performance during the last year?For the fiscal year ended June 30, 2025, the Fund underperformed its benchmark, the Russell 2000® Value Index (the “Index”). Over the last 12 months, U.S. equity market reactions to the Federal Reserve’s interest rate policy and President Trump’s tariff plans dominated headlines. Even though equities reached all-time highs in the fourth quarter of 2024, investor expectations for further rate cuts in 2025 began to cool. As the calendar turned to 2025, we believe market volatility increased due to concern and uncertainty regarding President Trump’s tariff agenda. As the fourth quarter of the Fund’s fiscal year end concluded, U.S. markets rallied once again to record highs. We believe that investor sentiment was boosted by hopes that the U.S. will reach trade agreements that could result in lower tariffs and optimism that the Federal Reserve could cut rates. For the one-year period ending June 30, 2025, small value stocks underperformed small growth stocks. Top contributors to performance: From a benchmark perspective, communication services, information technology, and financials were the top performing sectors. The health care and utilities sectors were the largest positive contributors to the Fund’s performance. Sector weights contributed positively to the Fund’s performance relative to the Index largely due to the Fund’s underweight allocation to the health care sector and the Fund’s overweight allocations to the utilities and information technology sectors.
Top detractors from performance: The energy and health care sectors were the largest detractors from relative performance. Security selection in the industrials, materials, and consumer discretionary sectors were the largest detractors from the Fund’s performance. From a style perspective, the Fund’s holdings on average, had lower beta and higher volume relative to the Index and both were headwinds.
|
| Performance Past Does Not Indicate Future [Text] |
The investment return and principal value will fluctuate so that an investor's shares, when redeemed, may be worth more or less than the original cost. Past performance is not a good predictor of the Fund's future performance.
|
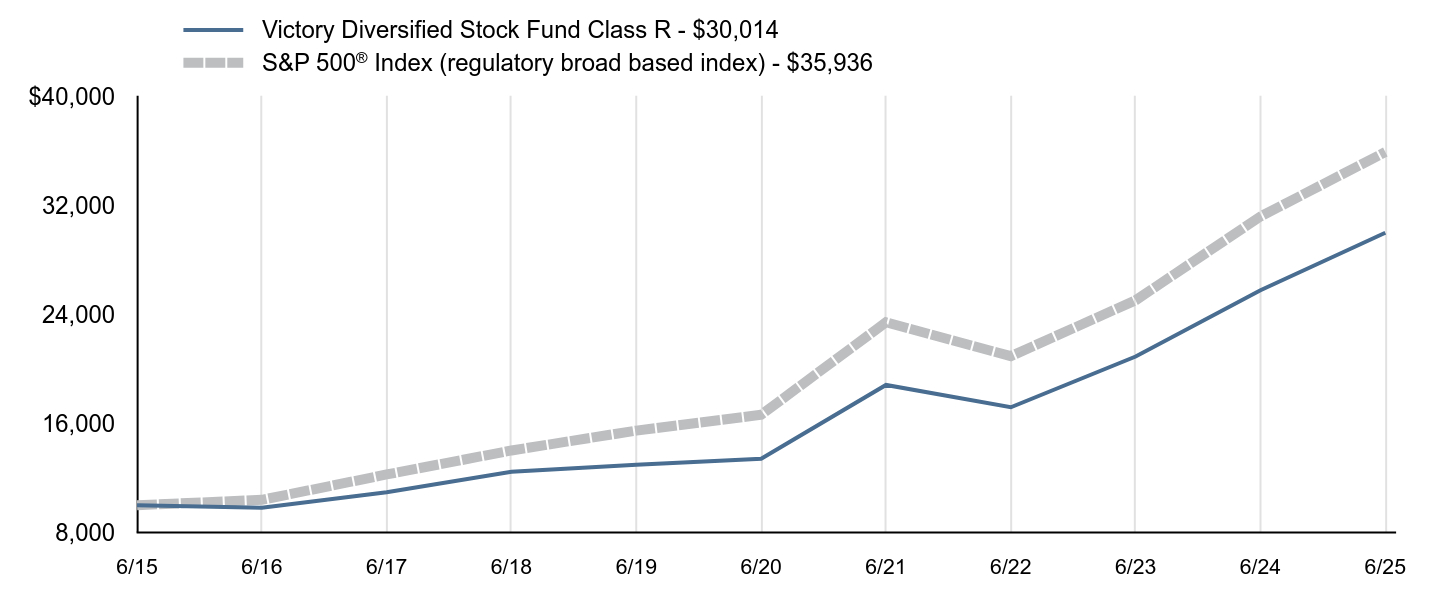
| Line Graph [Table Text Block] |
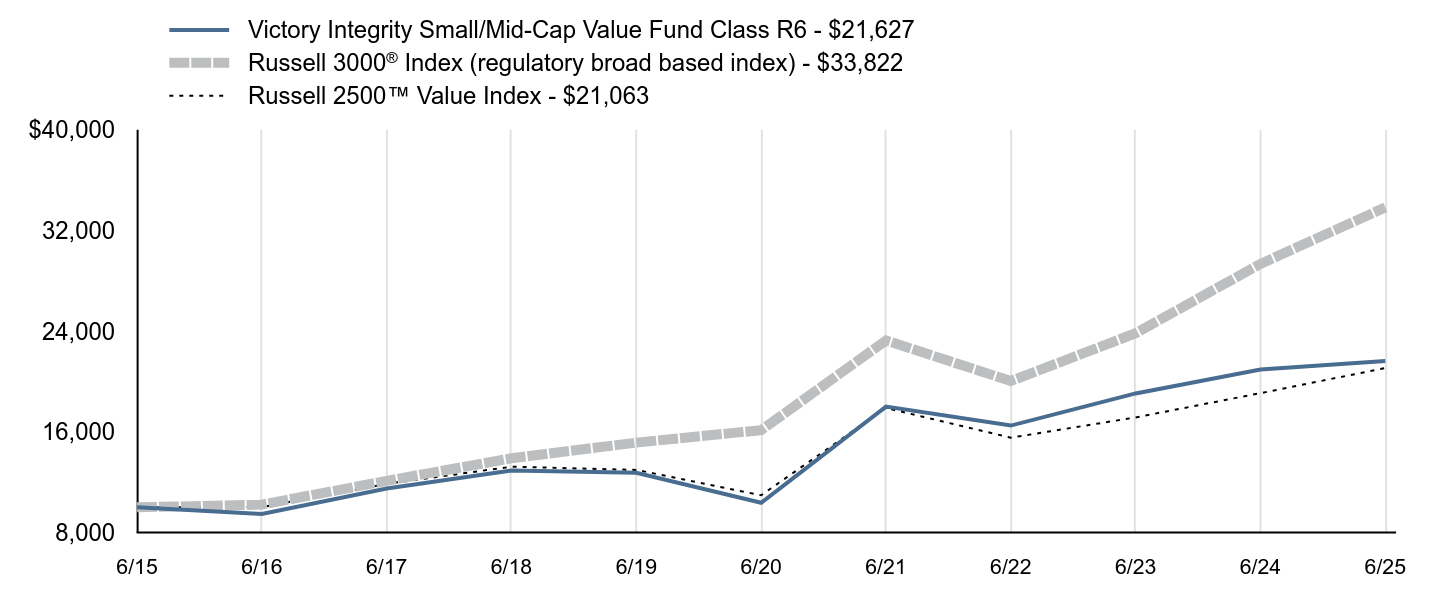
| Victory Integrity Small-Cap Value Fund Class R - $17,252 | Russell 3000® Index (regulatory broad based index) - $33,822 | Russell 2000® Value Index - $19,158 |
|---|
6/15 | $10,000 | $10,000 | $10,000 |
|---|
6/16 | $9,264 | $10,214 | $9,742 |
|---|
6/17 | $11,340 | $12,104 | $12,163 |
|---|
6/18 | $12,734 | $13,893 | $13,757 |
|---|
6/19 | $11,793 | $15,141 | $12,899 |
|---|
6/20 | $8,899 | $16,130 | $10,645 |
|---|
6/21 | $16,010 | $23,253 | $18,445 |
|---|
6/22 | $14,038 | $20,029 | $15,442 |
|---|
6/23 | $16,265 | $23,825 | $16,370 |
|---|
6/24 | $17,901 | $29,335 | $18,153 |
|---|
6/25 | $17,252 | $33,822 | $19,158 |
|---|
|
| Average Annual Return [Table Text Block] |
| 1 Year | 5 Year | 10 Year |
|---|
Class R | -3.63% | 14.16% | 5.60% |
|---|
Russell 3000® Index | 15.30% | 15.96% | 12.96% |
|---|
Russell 2000® Value Index | 5.54% | 12.47% | 6.72% |
|---|
|
| No Deduction of Taxes [Text Block] |
The graph and table total returns do not reflect the deduction of taxes that a shareholder would pay on Fund distributions, or redemption of shares.
|
| AssetsNet |
$ 1,010,876,000
|
| Holdings Count | Holding |
127
|
| Advisory Fees Paid, Amount |
$ 9,956,000
|
| InvestmentCompanyPortfolioTurnover |
44.00%
|
| Additional Fund Statistics [Text Block] |
FUND STATISTICS($ amounts in 000s)(as of June 30, 2025)Net Assets | $1,010,876 |
|---|
Number of Holdings | 127 |
|---|
Investment Advisory Fees | $9,956 |
|---|
Portfolio Turnover | 44% |
|---|
|
| Holdings [Text Block] |
Top SectorsFootnote Reference* (% of Net Assets)Footnote Reference(as of June 30, 2025)Value | Value |
|---|
Consumer Staples | 2.1% | Materials | 4.1% | Utilities | 4.4% | Health Care | 6.1% | Energy | 6.3% | Information Technology | 7.7% | Consumer Discretionary | 10.8% | Real Estate | 11.4% | Industrials | 14.4% | FinancialsFootnote Reference** | 29.2% |
Top 10 HoldingsFootnote Reference* (% of Net Assets)Footnote Reference(as of June 30, 2025)Glacier Bancorp, Inc. | 1.3% |
|---|
Essent Group Ltd. | 1.3% |
|---|
Ameris Bancorp | 1.3% |
|---|
Hancock Whitney Corp. | 1.3% |
|---|
Valley National Bancorp | 1.2% |
|---|
Bank of Hawaii Corp. | 1.2% |
|---|
Taylor Morrison Home Corp. | 1.2% |
|---|
SouthState Corp. | 1.2% |
|---|
Flagstar Financial, Inc. | 1.2% |
|---|
The Chefs' Warehouse, Inc. | 1.1% |
|---|
|
| Material Fund Change [Text Block] |
|
| C000144980 |
|
| Shareholder Report [Line Items] |
|
| Fund Name |
Victory Integrity Small-Cap Value Fund
|
| Class Name |
Class R6
|
| Trading Symbol |
MVSSX
|
| Annual or Semi-Annual Statement [Text Block] |
Annual Shareholder Report
|
| Shareholder Report Annual or Semi-Annual |
annual shareholder report
|
| Additional Information [Text Block] |
You can find additional information about the Fund at advisor.vcm.com/literature/mutual-fund-prospectuses. You may also request more information by calling 800-539-3863 or visiting vcm.com/contact-us.
|
| Additional Information Phone Number |
800-539-3863
|
| Additional Information Website |
vcm.com
|
| Expenses [Text Block] |
What were the Fund's costs for the last year?(based on a hypothetical $10,000 investment) Class Name | Costs of a $10,000 Investment | Costs paid as a percentage of a $10,000 Investment |
|---|
Class R6 | $95 | 0.96% |
|---|
| | |
|---|
|
| Expenses Paid, Amount |
$ 95
|
| Expense Ratio, Percent |
0.96%
|
| Factors Affecting Performance [Text Block] |
What affected the Fund’s performance during the last year?For the fiscal year ended June 30, 2025, the Fund underperformed its benchmark, the Russell 2000® Value Index (the “Index”). Over the last 12 months, U.S. equity market reactions to the Federal Reserve’s interest rate policy and President Trump’s tariff plans dominated headlines. Even though equities reached all-time highs in the fourth quarter of 2024, investor expectations for further rate cuts in 2025 began to cool. As the calendar turned to 2025, we believe market volatility increased due to concern and uncertainty regarding President Trump’s tariff agenda. As the fourth quarter of the Fund’s fiscal year end concluded, U.S. markets rallied once again to record highs. We believe that investor sentiment was boosted by hopes that the U.S. will reach trade agreements that could result in lower tariffs and optimism that the Federal Reserve could cut rates. For the one-year period ending June 30, 2025, small value stocks underperformed small growth stocks. Top contributors to performance: From a benchmark perspective, communication services, information technology, and financials were the top performing sectors. The health care and utilities sectors were the largest positive contributors to the Fund’s performance. Sector weights contributed positively to the Fund’s performance relative to the Index largely due to the Fund’s underweight allocation to the health care sector and the Fund’s overweight allocations to the utilities and information technology sectors.
Top detractors from performance: The energy and health care sectors were the largest detractors from relative performance. Security selection in the industrials, materials, and consumer discretionary sectors were the largest detractors from the Fund’s performance. From a style perspective, the Fund’s holdings on average, had lower beta and higher volume relative to the Index and both were headwinds.
|
| Performance Past Does Not Indicate Future [Text] |
The investment return and principal value will fluctuate so that an investor's shares, when redeemed, may be worth more or less than the original cost. Past performance is not a good predictor of the Fund's future performance.
|
| Line Graph [Table Text Block] |
| Victory Integrity Small-Cap Value Fund Class R6 - $18,719 | Russell 3000® Index (regulatory broad based index) - $33,822 | Russell 2000® Value Index - $19,158 |
|---|
6/15 | $10,000 | $10,000 | $10,000 |
|---|
6/16 | $9,359 | $10,214 | $9,742 |
|---|
6/17 | $11,549 | $12,104 | $12,163 |
|---|
6/18 | $13,071 | $13,893 | $13,757 |
|---|
6/19 | $12,199 | $15,141 | $12,899 |
|---|
6/20 | $9,278 | $16,130 | $10,645 |
|---|
6/21 | $16,831 | $23,253 | $18,445 |
|---|
6/22 | $14,874 | $20,029 | $15,442 |
|---|
6/23 | $17,369 | $23,825 | $16,370 |
|---|
6/24 | $19,270 | $29,335 | $18,153 |
|---|
6/25 | $18,719 | $33,822 | $19,158 |
|---|
|
| Average Annual Return [Table Text Block] |
| 1 Year | 5 Year | 10 Year |
|---|
Class R6 | -2.86% | 15.07%Footnote Reference | 6.47% |
|---|
Russell 3000® Index | 15.30% | 15.96% | 12.96% |
|---|
Russell 2000® Value Index | 5.54% | 12.47% | 6.72% |
|---|
|
| No Deduction of Taxes [Text Block] |
The graph and table total returns do not reflect the deduction of taxes that a shareholder would pay on Fund distributions, or redemption of shares.
|
| AssetsNet |
$ 1,010,876,000
|
| Holdings Count | Holding |
127
|
| Advisory Fees Paid, Amount |
$ 9,956,000
|
| InvestmentCompanyPortfolioTurnover |
44.00%
|
| Additional Fund Statistics [Text Block] |
FUND STATISTICS($ amounts in 000s)(as of June 30, 2025)Net Assets | $1,010,876 |
|---|
Number of Holdings | 127 |
|---|
Investment Advisory Fees | $9,956 |
|---|
Portfolio Turnover | 44% |
|---|
|
| Holdings [Text Block] |
Top SectorsFootnote Reference* (% of Net Assets)Footnote Reference(as of June 30, 2025)Value | Value |
|---|
Consumer Staples | 2.1% | Materials | 4.1% | Utilities | 4.4% | Health Care | 6.1% | Energy | 6.3% | Information Technology | 7.7% | Consumer Discretionary | 10.8% | Real Estate | 11.4% | Industrials | 14.4% | FinancialsFootnote Reference** | 29.2% |
Top 10 HoldingsFootnote Reference* (% of Net Assets)Footnote Reference(as of June 30, 2025)Glacier Bancorp, Inc. | 1.3% |
|---|
Essent Group Ltd. | 1.3% |
|---|
Ameris Bancorp | 1.3% |
|---|
Hancock Whitney Corp. | 1.3% |
|---|
Valley National Bancorp | 1.2% |
|---|
Bank of Hawaii Corp. | 1.2% |
|---|
Taylor Morrison Home Corp. | 1.2% |
|---|
SouthState Corp. | 1.2% |
|---|
Flagstar Financial, Inc. | 1.2% |
|---|
The Chefs' Warehouse, Inc. | 1.1% |
|---|
|
| Material Fund Change [Text Block] |
|
| C000144981 |
|
| Shareholder Report [Line Items] |
|
| Fund Name |
Victory Integrity Small-Cap Value Fund
|
| Class Name |
Class Y
|
| Trading Symbol |
VSVIX
|
| Annual or Semi-Annual Statement [Text Block] |
Annual Shareholder Report
|
| Shareholder Report Annual or Semi-Annual |
annual shareholder report
|
| Additional Information [Text Block] |
You can find additional information about the Fund at advisor.vcm.com/literature/mutual-fund-prospectuses. You may also request more information by calling 800-539-3863 or visiting vcm.com/contact-us.
|
| Additional Information Phone Number |
800-539-3863
|
| Additional Information Website |
vcm.com
|
| Expenses [Text Block] |
What were the Fund's costs for the last year?(based on a hypothetical $10,000 investment) Class Name | Costs of a $10,000 Investment | Costs paid as a percentage of a $10,000 Investment |
|---|
Class Y | $104 | 1.06% |
|---|
| | |
|---|
|
| Expenses Paid, Amount |
$ 104
|
| Expense Ratio, Percent |
1.06%
|
| Factors Affecting Performance [Text Block] |
What affected the Fund’s performance during the last year?For the fiscal year ended June 30, 2025, the Fund underperformed its benchmark, the Russell 2000® Value Index (the “Index”). Over the last 12 months, U.S. equity market reactions to the Federal Reserve’s interest rate policy and President Trump’s tariff plans dominated headlines. Even though equities reached all-time highs in the fourth quarter of 2024, investor expectations for further rate cuts in 2025 began to cool. As the calendar turned to 2025, we believe market volatility increased due to concern and uncertainty regarding President Trump’s tariff agenda. As the fourth quarter of the Fund’s fiscal year end concluded, U.S. markets rallied once again to record highs. We believe that investor sentiment was boosted by hopes that the U.S. will reach trade agreements that could result in lower tariffs and optimism that the Federal Reserve could cut rates. For the one-year period ending June 30, 2025, small value stocks underperformed small growth stocks. Top contributors to performance: From a benchmark perspective, communication services, information technology, and financials were the top performing sectors. The health care and utilities sectors were the largest positive contributors to the Fund’s performance. Sector weights contributed positively to the Fund’s performance relative to the Index largely due to the Fund’s underweight allocation to the health care sector and the Fund’s overweight allocations to the utilities and information technology sectors.
Top detractors from performance: The energy and health care sectors were the largest detractors from relative performance. Security selection in the industrials, materials, and consumer discretionary sectors were the largest detractors from the Fund’s performance. From a style perspective, the Fund’s holdings on average, had lower beta and higher volume relative to the Index and both were headwinds.
|
| Performance Past Does Not Indicate Future [Text] |
The investment return and principal value will fluctuate so that an investor's shares, when redeemed, may be worth more or less than the original cost. Past performance is not a good predictor of the Fund's future performance.
|
| Line Graph [Table Text Block] |
| Victory Integrity Small-Cap Value Fund Class Y - $1,846,551 | Russell 3000® Index (regulatory broad based index) - $3,382,207 | Russell 2000® Value Index - $1,915,800 |
|---|
6/15 | $1,000,000 | $1,000,000 | $1,000,000 |
|---|
6/16 | $934,593 | $1,021,383 | $974,182 |
|---|
6/17 | $1,150,836 | $1,210,436 | $1,216,334 |
|---|
6/18 | $1,300,512 | $1,389,315 | $1,375,664 |
|---|
6/19 | $1,211,634 | $1,514,111 | $1,289,885 |
|---|
6/20 | $920,355 | $1,612,975 | $1,064,452 |
|---|
6/21 | $1,667,045 | $2,325,337 | $1,844,479 |
|---|
6/22 | $1,471,631 | $2,002,914 | $1,544,189 |
|---|
6/23 | $1,716,686 | $2,382,540 | $1,636,957 |
|---|
6/24 | $1,902,827 | $2,933,505 | $1,815,316 |
|---|
6/25 | $1,846,551 | $3,382,207 | $1,915,800 |
|---|
|
| Average Annual Return [Table Text Block] |
| 1 Year | 5 Year | 10 Year |
|---|
Class Y | -2.96% | 14.94% | 6.33% |
|---|
Russell 3000® Index | 15.30% | 15.96% | 12.96% |
|---|
Russell 2000® Value Index | 5.54% | 12.47% | 6.72% |
|---|
|
| No Deduction of Taxes [Text Block] |
The graph and table total returns do not reflect the deduction of taxes that a shareholder would pay on Fund distributions, or redemption of shares.
|
| AssetsNet |
$ 1,010,876,000
|
| Holdings Count | Holding |
127
|
| Advisory Fees Paid, Amount |
$ 9,956,000
|
| InvestmentCompanyPortfolioTurnover |
44.00%
|
| Additional Fund Statistics [Text Block] |
FUND STATISTICS($ amounts in 000s)(as of June 30, 2025)Net Assets | $1,010,876 |
|---|
Number of Holdings | 127 |
|---|
Investment Advisory Fees | $9,956 |
|---|
Portfolio Turnover | 44% |
|---|
|
| Holdings [Text Block] |
Top SectorsFootnote Reference* (% of Net Assets)Footnote Reference(as of June 30, 2025)Value | Value |
|---|
Consumer Staples | 2.1% | Materials | 4.1% | Utilities | 4.4% | Health Care | 6.1% | Energy | 6.3% | Information Technology | 7.7% | Consumer Discretionary | 10.8% | Real Estate | 11.4% | Industrials | 14.4% | FinancialsFootnote Reference** | 29.2% |
Top 10 HoldingsFootnote Reference* (% of Net Assets)Footnote Reference(as of June 30, 2025)Glacier Bancorp, Inc. | 1.3% |
|---|
Essent Group Ltd. | 1.3% |
|---|
Ameris Bancorp | 1.3% |
|---|
Hancock Whitney Corp. | 1.3% |
|---|
Valley National Bancorp | 1.2% |
|---|
Bank of Hawaii Corp. | 1.2% |
|---|
Taylor Morrison Home Corp. | 1.2% |
|---|
SouthState Corp. | 1.2% |
|---|
Flagstar Financial, Inc. | 1.2% |
|---|
The Chefs' Warehouse, Inc. | 1.1% |
|---|
|
| Material Fund Change [Text Block] |
|
| C000144993 |
|
| Shareholder Report [Line Items] |
|
| Fund Name |
Victory Integrity Small/Mid-Cap Value Fund
|
| Class Name |
Class A
|
| Trading Symbol |
MAISX
|
| Annual or Semi-Annual Statement [Text Block] |
Annual Shareholder Report
|
| Shareholder Report Annual or Semi-Annual |
annual shareholder report
|
| Additional Information [Text Block] |
You can find additional information about the Fund at advisor.vcm.com/literature/mutual-fund-prospectuses. You may also request more information by calling 800-539-3863 or visiting vcm.com/contact-us.
|
| Additional Information Phone Number |
800-539-3863
|
| Additional Information Website |
vcm.com
|
| Expenses [Text Block] |
What were the Fund's costs for the last year?(based on a hypothetical $10,000 investment) Class Name | Costs of a $10,000 Investment | Costs paid as a percentage of a $10,000 Investment |
|---|
Class A | $115 | 1.13% |
|---|
| | |
|---|
|
| Expenses Paid, Amount |
$ 115
|
| Expense Ratio, Percent |
1.13%
|
| Factors Affecting Performance [Text Block] |
What affected the Fund’s performance during the last year?For the fiscal year ended June 30, 2025, the Fund underperformed its benchmark, the Russell 2500TM Value Index (the “Index”). Over the last 12 months, U.S. equity market reactions to the Federal Reserve’s interest rate policy and President Trump’s tariff plans dominated headlines. Even though equities reached all-time highs in the fourth quarter of 2024, investor expectations for further rate cuts in 2025 began to cool. As the calendar turned to 2025, we believe market volatility increased due to concern and uncertainty regarding President Trump’s tariff agenda. As the fourth quarter of the Fund’s fiscal year end concluded, U.S. markets rallied once again to record highs. We believe that investor sentiment was boosted by hopes that the U.S. will reach trade agreements that could result in lower tariffs and optimism that the Federal Reserve could cut rates. For the one-year period ending June 30, 2025, small/mid value stocks outperformed small/mid growth stocks. Top contributors to performance: From a benchmark perspective, utilities, financials and communication services were the top performing sectors. The health care and utilities sectors were the largest positive contributors to the Fund’s performance.
Top detractors from performance: The health care and energy sectors were the largest detractors from relative performance. Security selection in consumer discretionary, financials, and industrials sectors were the largest detractors from the Fund’s performance. Sector weights detracted from the Fund’s performance relative to the Index largely due to the Fund’s underweight allocation to the financials sector and overweight allocation to the industrials sector. From a style perspective, the Fund’s holdings on average had lower volatility and this was a style headwind.
|
| Performance Past Does Not Indicate Future [Text] |
The investment return and principal value will fluctuate so that an investor's shares, when redeemed, may be worth more or less than the original cost. Past performance is not a good predictor of the Fund's future performance.
|
| Line Graph [Table Text Block] |
| Victory Integrity Small/Mid-Cap Value Fund Class A @ NAV - $20,975 | Victory Integrity Small/Mid-Cap Value Fund Class A @ MOP - $19,767 | Russell 3000® Index (regulatory broad based index) - $33,822 | Russell 2500™ Value Index - $21,063 |
|---|
6/15 | $10,000 | $9,424 | $10,000 | $10,000 |
|---|
6/16 | $9,441 | $8,897 | $10,214 | $10,022 |
|---|
6/17 | $11,420 | $10,763 | $12,104 | $11,862 |
|---|
6/18 | $12,809 | $12,071 | $13,893 | $13,224 |
|---|
6/19 | $12,596 | $11,871 | $15,141 | $12,970 |
|---|
6/20 | $10,207 | $9,619 | $16,130 | $10,960 |
|---|
6/21 | $17,679 | $16,661 | $23,253 | $17,890 |
|---|
6/22 | $16,151 | $15,221 | $20,029 | $15,529 |
|---|
6/23 | $18,586 | $17,516 | $23,825 | $17,140 |
|---|
6/24 | $20,375 | $19,202 | $29,335 | $19,067 |
|---|
6/25 | $20,975 | $19,767 | $33,822 | $21,063 |
|---|
|
| Average Annual Return [Table Text Block] |
| 1 Year | 5 Year | 10 Year |
|---|
Class A @ NAV | 2.95% | 15.49%Footnote Reference | 7.69% |
|---|
Class A @ MOP | -2.97% | 14.14% | 7.05% |
|---|
Russell 3000® Index | 15.30% | 15.96% | 12.96% |
|---|
Russell 2500™ Value Index | 10.47% | 13.96% | 7.73% |
|---|
|
| No Deduction of Taxes [Text Block] |
The graph and table total returns do not reflect the deduction of taxes that a shareholder would pay on Fund distributions, or redemption of shares.
|
| Previous Investment Adviser [Text Block] |
The maximum offering price (“MOP”) figures reflect a maximum sales charge of 5.75% for Class A. The Net Asset Value ("NAV") figures do not reflect sales charges.
|
| AssetsNet |
$ 312,357,000
|
| Holdings Count | Holding |
113
|
| Advisory Fees Paid, Amount |
$ 2,546,000
|
| InvestmentCompanyPortfolioTurnover |
47.00%
|
| Additional Fund Statistics [Text Block] |
FUND STATISTICS($ amounts in 000s)(as of June 30, 2025)Net Assets | $312,357 |
|---|
Number of Holdings | 113 |
|---|
Investment Advisory Fees | $2,546 |
|---|
Portfolio Turnover | 47% |
|---|
|
| Holdings [Text Block] |
Top SectorsFootnote Reference* (% of Net Assets)Footnote Reference(as of June 30, 2025)Value | Value |
|---|
Utilities | 3.7% | Energy | 4.6% | Consumer Staples | 4.9% | Materials | 7.0% | Health Care | 7.1% | Information Technology | 8.5% | Real Estate | 9.9% | Consumer Discretionary | 11.2% | Industrials | 19.7% | Financials | 19.8% |
Top 10 HoldingsFootnote Reference* (% of Net Assets)Footnote Reference(as of June 30, 2025)Gaming and Leisure Properties, Inc. | 1.3% |
|---|
Textron, Inc. | 1.3% |
|---|
Camden Property Trust | 1.3% |
|---|
WP Carey, Inc. | 1.3% |
|---|
Amdocs Ltd. | 1.2% |
|---|
Flex Ltd. | 1.2% |
|---|
First Industrial Realty Trust, Inc. | 1.2% |
|---|
UGI Corp. | 1.1% |
|---|
Pentair PLC | 1.1% |
|---|
Federal Realty Investment Trust | 1.1% |
|---|
|
| Material Fund Change [Text Block] |
|
| C000155526 |
|
| Shareholder Report [Line Items] |
|
| Fund Name |
Victory Integrity Small/Mid-Cap Value Fund
|
| Class Name |
Class R6
|
| Trading Symbol |
MIRSX
|
| Annual or Semi-Annual Statement [Text Block] |
Annual Shareholder Report
|
| Shareholder Report Annual or Semi-Annual |
annual shareholder report
|
| Additional Information [Text Block] |
You can find additional information about the Fund at advisor.vcm.com/literature/mutual-fund-prospectuses. You may also request more information by calling 800-539-3863 or visiting vcm.com/contact-us.
|
| Additional Information Phone Number |
800-539-3863
|
| Additional Information Website |
vcm.com
|
| Expenses [Text Block] |
What were the Fund's costs for the last year?(based on a hypothetical $10,000 investment) Class Name | Costs of a $10,000 Investment | Costs paid as a percentage of a $10,000 Investment |
|---|
Class R6 | $84 | 0.83% |
|---|
| | |
|---|
|
| Expenses Paid, Amount |
$ 84
|
| Expense Ratio, Percent |
0.83%
|
| Factors Affecting Performance [Text Block] |
What affected the Fund’s performance during the last year?For the fiscal year ended June 30, 2025, the Fund underperformed its benchmark, the Russell 2500TM Value Index (the “Index”). Over the last 12 months, U.S. equity market reactions to the Federal Reserve’s interest rate policy and President Trump’s tariff plans dominated headlines. Even though equities reached all-time highs in the fourth quarter of 2024, investor expectations for further rate cuts in 2025 began to cool. As the calendar turned to 2025, we believe market volatility increased due to concern and uncertainty regarding President Trump’s tariff agenda. As the fourth quarter of the Fund’s fiscal year end concluded, U.S. markets rallied once again to record highs. We believe that investor sentiment was boosted by hopes that the U.S. will reach trade agreements that could result in lower tariffs and optimism that the Federal Reserve could cut rates. For the one-year period ending June 30, 2025, small/mid value stocks outperformed small/mid growth stocks. Top contributors to performance: From a benchmark perspective, utilities, financials and communication services were the top performing sectors. The health care and utilities sectors were the largest positive contributors to the Fund’s performance.
Top detractors from performance: The health care and energy sectors were the largest detractors from relative performance. Security selection in consumer discretionary, financials, and industrials sectors were the largest detractors from the Fund’s performance. Sector weights detracted from the Fund’s performance relative to the Index largely due to the Fund’s underweight allocation to the financials sector and overweight allocation to the industrials sector. From a style perspective, the Fund’s holdings on average had lower volatility and this was a style headwind.
|
| Performance Past Does Not Indicate Future [Text] |
The investment return and principal value will fluctuate so that an investor's shares, when redeemed, may be worth more or less than the original cost. Past performance is not a good predictor of the Fund's future performance.
|
| Line Graph [Table Text Block] |
| Victory Integrity Small/Mid-Cap Value Fund Class R6 - $21,627 | Russell 3000® Index (regulatory broad based index) - $33,822 | Russell 2500™ Value Index - $21,063 |
|---|
6/15 | $10,000 | $10,000 | $10,000 |
|---|
6/16 | $9,467 | $10,214 | $10,022 |
|---|
6/17 | $11,489 | $12,104 | $11,862 |
|---|
6/18 | $12,929 | $13,893 | $13,224 |
|---|
6/19 | $12,749 | $15,141 | $12,970 |
|---|
6/20 | $10,365 | $16,130 | $10,960 |
|---|
6/21 | $18,002 | $23,253 | $17,890 |
|---|
6/22 | $16,493 | $20,029 | $15,529 |
|---|
6/23 | $19,044 | $23,825 | $17,140 |
|---|
6/24 | $20,944 | $29,335 | $19,067 |
|---|
6/25 | $21,627 | $33,822 | $21,063 |
|---|
|
| Average Annual Return [Table Text Block] |
| 1 Year | 5 Year | 10 Year |
|---|
Class R6 | 3.26% | 15.85%Footnote Reference | 8.02% |
|---|
Russell 3000® Index | 15.30% | 15.96% | 12.96% |
|---|
Russell 2500™ Value Index | 10.47% | 13.96% | 7.73% |
|---|
|
| No Deduction of Taxes [Text Block] |
The graph and table total returns do not reflect the deduction of taxes that a shareholder would pay on Fund distributions, or redemption of shares.
|
| AssetsNet |
$ 312,357,000
|
| Holdings Count | Holding |
113
|
| Advisory Fees Paid, Amount |
$ 2,546,000
|
| InvestmentCompanyPortfolioTurnover |
47.00%
|
| Additional Fund Statistics [Text Block] |
FUND STATISTICS($ amounts in 000s)(as of June 30, 2025)Net Assets | $312,357 |
|---|
Number of Holdings | 113 |
|---|
Investment Advisory Fees | $2,546 |
|---|
Portfolio Turnover | 47% |
|---|
|
| Holdings [Text Block] |
Top SectorsFootnote Reference* (% of Net Assets)Footnote Reference(as of June 30, 2025)Value | Value |
|---|
Utilities | 3.7% | Energy | 4.6% | Consumer Staples | 4.9% | Materials | 7.0% | Health Care | 7.1% | Information Technology | 8.5% | Real Estate | 9.9% | Consumer Discretionary | 11.2% | Industrials | 19.7% | Financials | 19.8% |
Top 10 HoldingsFootnote Reference* (% of Net Assets)Footnote Reference(as of June 30, 2025)Gaming and Leisure Properties, Inc. | 1.3% |
|---|
Textron, Inc. | 1.3% |
|---|
Camden Property Trust | 1.3% |
|---|
WP Carey, Inc. | 1.3% |
|---|
Amdocs Ltd. | 1.2% |
|---|
Flex Ltd. | 1.2% |
|---|
First Industrial Realty Trust, Inc. | 1.2% |
|---|
UGI Corp. | 1.1% |
|---|
Pentair PLC | 1.1% |
|---|
Federal Realty Investment Trust | 1.1% |
|---|
|
| Material Fund Change [Text Block] |
|
| C000144994 |
|
| Shareholder Report [Line Items] |
|
| Fund Name |
Victory Integrity Small/Mid-Cap Value Fund
|
| Class Name |
Class Y
|
| Trading Symbol |
MYISX
|
| Annual or Semi-Annual Statement [Text Block] |
Annual Shareholder Report
|
| Shareholder Report Annual or Semi-Annual |
annual shareholder report
|
| Additional Information [Text Block] |
You can find additional information about the Fund at advisor.vcm.com/literature/mutual-fund-prospectuses. You may also request more information by calling 800-539-3863 or visiting vcm.com/contact-us.
|
| Additional Information Phone Number |
800-539-3863
|
| Additional Information Website |
vcm.com
|
| Expenses [Text Block] |
What were the Fund's costs for the last year?(based on a hypothetical $10,000 investment) Class Name | Costs of a $10,000 Investment | Costs paid as a percentage of a $10,000 Investment |
|---|
Class Y | $89 | 0.88% |
|---|
| | |
|---|
|
| Expenses Paid, Amount |
$ 89
|
| Expense Ratio, Percent |
0.88%
|
| Factors Affecting Performance [Text Block] |
What affected the Fund’s performance during the last year?For the fiscal year ended June 30, 2025, the Fund underperformed its benchmark, the Russell 2500TM Value Index (the “Index”). Over the last 12 months, U.S. equity market reactions to the Federal Reserve’s interest rate policy and President Trump’s tariff plans dominated headlines. Even though equities reached all-time highs in the fourth quarter of 2024, investor expectations for further rate cuts in 2025 began to cool. As the calendar turned to 2025, we believe market volatility increased due to concern and uncertainty regarding President Trump’s tariff agenda. As the fourth quarter of the Fund’s fiscal year end concluded, U.S. markets rallied once again to record highs. We believe that investor sentiment was boosted by hopes that the U.S. will reach trade agreements that could result in lower tariffs and optimism that the Federal Reserve could cut rates. For the one-year period ending June 30, 2025, small/mid value stocks outperformed small/mid growth stocks. Top contributors to performance: From a benchmark perspective, utilities, financials and communication services were the top performing sectors. The health care and utilities sectors were the largest positive contributors to the Fund’s performance.
Top detractors from performance: The health care and energy sectors were the largest detractors from relative performance. Security selection in consumer discretionary, financials, and industrials sectors were the largest detractors from the Fund’s performance. Sector weights detracted from the Fund’s performance relative to the Index largely due to the Fund’s underweight allocation to the financials sector and overweight allocation to the industrials sector. From a style perspective, the Fund’s holdings on average had lower volatility and this was a style headwind.
|
| Performance Past Does Not Indicate Future [Text] |
The investment return and principal value will fluctuate so that an investor's shares, when redeemed, may be worth more or less than the original cost. Past performance is not a good predictor of the Fund's future performance.
|
| Line Graph [Table Text Block] |
| Victory Integrity Small/Mid-Cap Value Fund Class Y - $2,151,217 | Russell 3000® Index (regulatory broad based index) - $3,382,207 | Russell 2500™ Value Index - $2,106,258 |
|---|
6/15 | $1,000,000 | $1,000,000 | $1,000,000 |
|---|
6/16 | $946,609 | $1,021,383 | $1,002,150 |
|---|
6/17 | $1,147,750 | $1,210,436 | $1,186,151 |
|---|
6/18 | $1,291,378 | $1,389,315 | $1,322,427 |
|---|
6/19 | $1,272,647 | $1,514,111 | $1,296,982 |
|---|
6/20 | $1,034,255 | $1,612,975 | $1,095,967 |
|---|
6/21 | $1,795,530 | $2,325,337 | $1,788,956 |
|---|
6/22 | $1,643,897 | $2,002,914 | $1,552,932 |
|---|
6/23 | $1,897,447 | $2,382,540 | $1,713,979 |
|---|
6/24 | $2,084,871 | $2,933,505 | $1,906,660 |
|---|
6/25 | $2,151,217 | $3,382,207 | $2,106,258 |
|---|
|
| Average Annual Return [Table Text Block] |
| 1 Year | 5 Year | 10 Year |
|---|
Class Y | 3.18% | 15.77%Footnote Reference | 7.96% |
|---|
Russell 3000® Index | 15.30% | 15.96% | 12.96% |
|---|
Russell 2500™ Value Index | 10.47% | 13.96% | 7.73% |
|---|
|
| No Deduction of Taxes [Text Block] |
The graph and table total returns do not reflect the deduction of taxes that a shareholder would pay on Fund distributions, or redemption of shares.
|
| AssetsNet |
$ 312,357,000
|
| Holdings Count | Holding |
113
|
| Advisory Fees Paid, Amount |
$ 2,546,000
|
| InvestmentCompanyPortfolioTurnover |
47.00%
|
| Additional Fund Statistics [Text Block] |
FUND STATISTICS($ amounts in 000s)(as of June 30, 2025)Net Assets | $312,357 |
|---|
Number of Holdings | 113 |
|---|
Investment Advisory Fees | $2,546 |
|---|
Portfolio Turnover | 47% |
|---|
|
| Holdings [Text Block] |
Top SectorsFootnote Reference* (% of Net Assets)Footnote Reference(as of June 30, 2025)Value | Value |
|---|
Utilities | 3.7% | Energy | 4.6% | Consumer Staples | 4.9% | Materials | 7.0% | Health Care | 7.1% | Information Technology | 8.5% | Real Estate | 9.9% | Consumer Discretionary | 11.2% | Industrials | 19.7% | Financials | 19.8% |
Top 10 HoldingsFootnote Reference* (% of Net Assets)Footnote Reference(as of June 30, 2025)Gaming and Leisure Properties, Inc. | 1.3% |
|---|
Textron, Inc. | 1.3% |
|---|
Camden Property Trust | 1.3% |
|---|
WP Carey, Inc. | 1.3% |
|---|
Amdocs Ltd. | 1.2% |
|---|
Flex Ltd. | 1.2% |
|---|
First Industrial Realty Trust, Inc. | 1.2% |
|---|
UGI Corp. | 1.1% |
|---|
Pentair PLC | 1.1% |
|---|
Federal Realty Investment Trust | 1.1% |
|---|
|
| Material Fund Change [Text Block] |
|
| C000219864 |
|
| Shareholder Report [Line Items] |
|
| Fund Name |
Victory Integrity Small/Mid-Cap Value Fund
|
| Class Name |
Member Class
|
| Trading Symbol |
MMMSX
|
| Annual or Semi-Annual Statement [Text Block] |
Annual Shareholder Report
|
| Shareholder Report Annual or Semi-Annual |
annual shareholder report
|
| Additional Information [Text Block] |
You can find additional information about the Fund at advisor.vcm.com/literature/mutual-fund-prospectuses. You may also request more information by calling 800-235-8396 or visiting vcm.com/contact-us.
|
| Additional Information Phone Number |
800-235-8396
|
| Additional Information Website |
vcm.com
|
| Expenses [Text Block] |
What were the Fund's costs for the last year?(based on a hypothetical $10,000 investment) Class Name | Costs of a $10,000 Investment | Costs paid as a percentage of a $10,000 Investment |
|---|
Member Class | $96 | 0.95% |
|---|
| | |
|---|
|
| Expenses Paid, Amount |
$ 96
|
| Expense Ratio, Percent |
0.95%
|
| Factors Affecting Performance [Text Block] |
What affected the Fund’s performance during the last year?For the fiscal year ended June 30, 2025, the Fund underperformed its benchmark, the Russell 2500TM Value Index (the “Index”). Over the last 12 months, U.S. equity market reactions to the Federal Reserve’s interest rate policy and President Trump’s tariff plans dominated headlines. Even though equities reached all-time highs in the fourth quarter of 2024, investor expectations for further rate cuts in 2025 began to cool. As the calendar turned to 2025, we believe market volatility increased due to concern and uncertainty regarding President Trump’s tariff agenda. As the fourth quarter of the Fund’s fiscal year end concluded, U.S. markets rallied once again to record highs. We believe that investor sentiment was boosted by hopes that the U.S. will reach trade agreements that could result in lower tariffs and optimism that the Federal Reserve could cut rates. For the one-year period ending June 30, 2025, small/mid value stocks outperformed small/mid growth stocks. Top contributors to performance: From a benchmark perspective, utilities, financials and communication services were the top performing sectors. The health care and utilities sectors were the largest positive contributors to the Fund’s performance.
Top detractors from performance: The health care and energy sectors were the largest detractors from relative performance. Security selection in consumer discretionary, financials, and industrials sectors were the largest detractors from the Fund’s performance. Sector weights detracted from the Fund’s performance relative to the Index largely due to the Fund’s underweight allocation to the financials sector and overweight allocation to the industrials sector. From a style perspective, the Fund’s holdings on average had lower volatility and this was a style headwind.
|
| Performance Past Does Not Indicate Future [Text] |
The investment return and principal value will fluctuate so that an investor's shares, when redeemed, may be worth more or less than the original cost. Past performance is not a good predictor of the Fund's future performance.
|
| Line Graph [Table Text Block] |
| Victory Integrity Small/Mid-Cap Value Fund Member Class - $18,779 | Russell 3000® Index (regulatory broad based index) - $19,383 | Russell 2500™ Value Index - $17,724 |
|---|
11/20Footnote Reference* | $10,000 | $10,000 | $10,000 |
|---|
6/21 | $15,717 | $13,326 | $15,054 |
|---|
6/22 | $14,373 | $11,478 | $13,068 |
|---|
6/23 | $16,578 | $13,654 | $14,423 |
|---|
6/24 | $18,209 | $16,812 | $16,045 |
|---|
6/25 | $18,779 | $19,383 | $17,724 |
|---|
|
| Average Annual Return [Table Text Block] |
| 1 Year | Since Inception |
|---|
Member Class | 3.13% | 14.49% |
|---|
Russell 3000® Index | 15.30% | 15.27% |
|---|
Russell 2500™ Value Index | 10.47% | 13.08% |
|---|
|
| No Deduction of Taxes [Text Block] |
The graph and table total returns do not reflect the deduction of taxes that a shareholder would pay on Fund distributions, or redemption of shares.
|
| AssetsNet |
$ 312,357,000
|
| Holdings Count | Holding |
113
|
| Advisory Fees Paid, Amount |
$ 2,546,000
|
| InvestmentCompanyPortfolioTurnover |
47.00%
|
| Additional Fund Statistics [Text Block] |
FUND STATISTICS($ amounts in 000s)(as of June 30, 2025)Net Assets | $312,357 |
|---|
Number of Holdings | 113 |
|---|
Investment Advisory Fees | $2,546 |
|---|
Portfolio Turnover | 47% |
|---|
|
| Holdings [Text Block] |
Top SectorsFootnote Reference* (% of Net Assets)Footnote Reference(as of June 30, 2025)Value | Value |
|---|
Utilities | 3.7% | Energy | 4.6% | Consumer Staples | 4.9% | Materials | 7.0% | Health Care | 7.1% | Information Technology | 8.5% | Real Estate | 9.9% | Consumer Discretionary | 11.2% | Industrials | 19.7% | Financials | 19.8% |
Top 10 HoldingsFootnote Reference* (% of Net Assets)Footnote Reference(as of June 30, 2025)Gaming and Leisure Properties, Inc. | 1.3% |
|---|
Textron, Inc. | 1.3% |
|---|
Camden Property Trust | 1.3% |
|---|
WP Carey, Inc. | 1.3% |
|---|
Amdocs Ltd. | 1.2% |
|---|
Flex Ltd. | 1.2% |
|---|
First Industrial Realty Trust, Inc. | 1.2% |
|---|
UGI Corp. | 1.1% |
|---|
Pentair PLC | 1.1% |
|---|
Federal Realty Investment Trust | 1.1% |
|---|
|
| Material Fund Change [Text Block] |
|
| C000144984 |
|
| Shareholder Report [Line Items] |
|
| Fund Name |
Victory Munder Multi-Cap Fund
|
| Class Name |
Class A
|
| Trading Symbol |
MNNAX
|
| Annual or Semi-Annual Statement [Text Block] |
Annual Shareholder Report
|
| Shareholder Report Annual or Semi-Annual |
annual shareholder report
|
| Additional Information [Text Block] |
You can find additional information about the Fund at advisor.vcm.com/literature/mutual-fund-prospectuses. You may also request more information by calling 800-539-3863 or visiting vcm.com/contact-us.
|
| Additional Information Phone Number |
800-539-3863
|
| Additional Information Website |
vcm.com
|
| Expenses [Text Block] |
What were the Fund's costs for the last year?(based on a hypothetical $10,000 investment) Class Name | Costs of a $10,000 Investment | Costs paid as a percentage of a $10,000 Investment |
|---|
Class A | $134 | 1.24% |
|---|
| | |
|---|
|
| Expenses Paid, Amount |
$ 134
|
| Expense Ratio, Percent |
1.24%
|
| Factors Affecting Performance [Text Block] |
What affected the Fund’s performance during the last year?Top contributors to performance: The Fund generated the strongest relative performance within the technology, communication services, and health care sectors. Stocks that contributed most positively to the Fund’s relative performance were Interactive Brokers Group, Inc. and Broadcom Inc.
Top detractors from performance: Stocks that contributed negatively to the Fund’s performance were NVIDIA Corp. (“NVIDIA”) and Novo Nordisk A/S, ADR (“Novo Nordisk”). The Fund was underweight NVIDIA compared to the Fund’s benchmark during much of the year while we believe investor excitement and demand for its high-end artificial intelligence chips led the stock to continually surpass market expectations. Novo Nordisk underperformed as the company’s flagship portfolio of GLP-1 drugs such as Wegovy lagged competitors in demand and efficacy for some health conditions.
|
| Performance Past Does Not Indicate Future [Text] |
The investment return and principal value will fluctuate so that an investor's shares, when redeemed, may be worth more or less than the original cost. Past performance is not a good predictor of the Fund's future performance.
|
| Line Graph [Table Text Block] |
| Victory Munder Multi-Cap Fund Class A @ NAV - $29,808 | Victory Munder Multi-Cap Fund Class A @ MOP - $28,094 | Russell 3000® Index (regulatory broad based index) - $33,822 | S&P 500® Index - $35,936 |
|---|
6/15 | $10,000 | $9,425 | $10,000 | $10,000 |
|---|
6/16 | $9,599 | $9,047 | $10,214 | $10,399 |
|---|
6/17 | $11,269 | $10,621 | $12,104 | $12,260 |
|---|
6/18 | $12,775 | $12,041 | $13,893 | $14,023 |
|---|
6/19 | $13,141 | $12,385 | $15,141 | $15,483 |
|---|
6/20 | $13,342 | $12,574 | $16,130 | $16,645 |
|---|
6/21 | $18,683 | $17,609 | $23,253 | $23,436 |
|---|
6/22 | $17,055 | $16,075 | $20,029 | $20,948 |
|---|
6/23 | $20,777 | $19,582 | $23,825 | $25,053 |
|---|
6/24 | $25,562 | $24,092 | $29,335 | $31,204 |
|---|
6/25 | $29,808 | $28,094 | $33,822 | $35,936 |
|---|
|
| Average Annual Return [Table Text Block] |
| 1 Year | 5 Year | 10 Year |
|---|
Class A @ NAV | 16.61%Footnote Reference | 17.44%Footnote Reference | 11.54% |
|---|
Class A @ MOP | 9.91% | 16.06% | 10.88% |
|---|
Russell 3000® Index | 15.30% | 15.96% | 12.96% |
|---|
S&P 500® Index | 15.16% | 16.64% | 13.65% |
|---|
|
| No Deduction of Taxes [Text Block] |
The graph and table total returns do not reflect the deduction of taxes that a shareholder would pay on Fund distributions, or redemption of shares.
|
| Previous Investment Adviser [Text Block] |
The maximum offering price (“MOP”) figures reflect a maximum sales charge of 5.75% for Class A. The Net Asset Value ("NAV") figures do not reflect sales charges.
|
| AssetsNet |
$ 496,726,000
|
| Holdings Count | Holding |
75
|
| Advisory Fees Paid, Amount |
$ 3,580,000
|
| InvestmentCompanyPortfolioTurnover |
88.00%
|
| Additional Fund Statistics [Text Block] |
FUND STATISTICS($ amounts in 000s)(as of June 30, 2025)Net Assets | $496,726 |
|---|
Number of Holdings | 75 |
|---|
Investment Advisory Fees | $3,580 |
|---|
Portfolio Turnover | 88% |
|---|
|
| Holdings [Text Block] |
Top SectorsFootnote Reference* (% of Net Assets)Footnote Reference(as of June 30, 2025)Value | Value |
|---|
Real Estate | 1.4% | Materials | 2.3% | Energy | 2.6% | Consumer Staples | 2.8% | Industrials | 8.0% | Communication Services | 11.0% | Consumer Discretionary | 12.3% | Health Care | 12.9% | Financials | 14.2% | Information TechnologyFootnote Reference** | 30.9% |
Top 10 HoldingsFootnote Reference* (% of Net Assets)Footnote Reference(as of June 30, 2025)Microsoft Corp. | 6.6% |
|---|
NVIDIA Corp. | 5.5% |
|---|
Apple, Inc. | 5.1% |
|---|
Alphabet, Inc., Class A | 3.8% |
|---|
Amazon.com, Inc. | 3.6% |
|---|
Meta Platforms, Inc., Class A | 3.3% |
|---|
Broadcom, Inc. | 3.2% |
|---|
Visa, Inc., Class A | 2.3% |
|---|
Eli Lilly & Co. | 2.0% |
|---|
Jabil, Inc. | 1.8% |
|---|
|
| Material Fund Change [Text Block] |
|
| C000144985 |
|
| Shareholder Report [Line Items] |
|
| Fund Name |
Victory Munder Multi-Cap Fund
|
| Class Name |
Class C
|
| Trading Symbol |
MNNCX
|
| Annual or Semi-Annual Statement [Text Block] |
Annual Shareholder Report
|
| Shareholder Report Annual or Semi-Annual |
annual shareholder report
|
| Additional Information [Text Block] |
You can find additional information about the Fund at advisor.vcm.com/literature/mutual-fund-prospectuses. You may also request more information by calling 800-539-3863 or visiting vcm.com/contact-us.
|
| Additional Information Phone Number |
800-539-3863
|
| Additional Information Website |
vcm.com
|
| Expenses [Text Block] |
What were the Fund's costs for the last year?(based on a hypothetical $10,000 investment) Class Name | Costs of a $10,000 Investment | Costs paid as a percentage of a $10,000 Investment |
|---|
Class C | $233 | 2.16% |
|---|
| | |
|---|
|
| Expenses Paid, Amount |
$ 233
|
| Expense Ratio, Percent |
2.16%
|
| Factors Affecting Performance [Text Block] |
What affected the Fund’s performance during the last year?Top contributors to performance: The Fund generated the strongest relative performance within the technology, communication services, and health care sectors. Stocks that contributed most positively to the Fund’s relative performance were Interactive Brokers Group, Inc. and Broadcom Inc.
Top detractors from performance: Stocks that contributed negatively to the Fund’s performance were NVIDIA Corp. (“NVIDIA”) and Novo Nordisk A/S, ADR (“Novo Nordisk”). The Fund was underweight NVIDIA compared to the Fund’s benchmark during much of the year while we believe investor excitement and demand for its high-end artificial intelligence chips led the stock to continually surpass market expectations. Novo Nordisk underperformed as the company’s flagship portfolio of GLP-1 drugs such as Wegovy lagged competitors in demand and efficacy for some health conditions.
|
| Performance Past Does Not Indicate Future [Text] |
The investment return and principal value will fluctuate so that an investor's shares, when redeemed, may be worth more or less than the original cost. Past performance is not a good predictor of the Fund's future performance.
|
| Line Graph [Table Text Block] |
| Victory Munder Multi-Cap Fund Class C @ NAV - $27,937 | Victory Munder Multi-Cap Fund Class C @ CDSC - $27,937 | Russell 3000® Index (regulatory broad based index) - $33,822 | S&P 500® Index - $35,936 |
|---|
6/15 | $10,000 | $10,000 | $10,000 | $10,000 |
|---|
6/16 | $9,518 | $9,518 | $10,214 | $10,399 |
|---|
6/17 | $11,084 | $11,084 | $12,104 | $12,260 |
|---|
6/18 | $12,468 | $12,468 | $13,893 | $14,023 |
|---|
6/19 | $12,744 | $12,744 | $15,141 | $15,483 |
|---|
6/20 | $12,832 | $12,832 | $16,130 | $16,645 |
|---|
6/21 | $17,820 | $17,820 | $23,253 | $23,436 |
|---|
6/22 | $16,123 | $16,123 | $20,029 | $20,948 |
|---|
6/23 | $19,473 | $19,473 | $23,825 | $25,053 |
|---|
6/24 | $23,958 | $23,958 | $29,335 | $31,204 |
|---|
6/25 | $27,937 | $27,937 | $33,822 | $35,936 |
|---|
|
| Average Annual Return [Table Text Block] |
| 1 Year | 5 Year | 10 Year |
|---|
Class C @ NAV | 15.53%Footnote Reference | 16.41%Footnote Reference | 10.82% |
|---|
Class C @ CDSC | 14.53% | 16.41% | 10.82% |
|---|
Russell 3000® Index | 15.30% | 15.96% | 12.96% |
|---|
S&P 500® Index | 15.16% | 16.64% | 13.65% |
|---|
|
| No Deduction of Taxes [Text Block] |
The graph and table total returns do not reflect the deduction of taxes that a shareholder would pay on Fund distributions, or redemption of shares.
|
| Previous Investment Adviser [Text Block] |
Class C is not subject to an initial sales charge, but is subject to Contingent Deferred Sales Charge (“CDSC”) of 1.00% on shares redeemed within one year of purchase. The Net Asset Value ("NAV") figures do not reflect sales charges.
|
| AssetsNet |
$ 496,726,000
|
| Holdings Count | Holding |
75
|
| Advisory Fees Paid, Amount |
$ 3,580,000
|
| InvestmentCompanyPortfolioTurnover |
88.00%
|
| Additional Fund Statistics [Text Block] |
FUND STATISTICS($ amounts in 000s)(as of June 30, 2025)Net Assets | $496,726 |
|---|
Number of Holdings | 75 |
|---|
Investment Advisory Fees | $3,580 |
|---|
Portfolio Turnover | 88% |
|---|
|
| Holdings [Text Block] |
Top SectorsFootnote Reference* (% of Net Assets)Footnote Reference(as of June 30, 2025)Value | Value |
|---|
Real Estate | 1.4% | Materials | 2.3% | Energy | 2.6% | Consumer Staples | 2.8% | Industrials | 8.0% | Communication Services | 11.0% | Consumer Discretionary | 12.3% | Health Care | 12.9% | Financials | 14.2% | Information TechnologyFootnote Reference** | 30.9% |
Top 10 HoldingsFootnote Reference* (% of Net Assets)Footnote Reference(as of June 30, 2025)Microsoft Corp. | 6.6% |
|---|
NVIDIA Corp. | 5.5% |
|---|
Apple, Inc. | 5.1% |
|---|
Alphabet, Inc., Class A | 3.8% |
|---|
Amazon.com, Inc. | 3.6% |
|---|
Meta Platforms, Inc., Class A | 3.3% |
|---|
Broadcom, Inc. | 3.2% |
|---|
Visa, Inc., Class A | 2.3% |
|---|
Eli Lilly & Co. | 2.0% |
|---|
Jabil, Inc. | 1.8% |
|---|
|
| Material Fund Change [Text Block] |
|
| C000144987 |
|
| Shareholder Report [Line Items] |
|
| Fund Name |
Victory Munder Multi-Cap Fund
|
| Class Name |
Class Y
|
| Trading Symbol |
MNNYX
|
| Annual or Semi-Annual Statement [Text Block] |
Annual Shareholder Report
|
| Shareholder Report Annual or Semi-Annual |
annual shareholder report
|
| Additional Information [Text Block] |
You can find additional information about the Fund at advisor.vcm.com/literature/mutual-fund-prospectuses. You may also request more information by calling 800-539-3863 or visiting vcm.com/contact-us.
|
| Additional Information Phone Number |
800-539-3863
|
| Additional Information Website |
vcm.com
|
| Expenses [Text Block] |
What were the Fund's costs for the last year?(based on a hypothetical $10,000 investment) Class Name | Costs of a $10,000 Investment | Costs paid as a percentage of a $10,000 Investment |
|---|
Class Y | $103 | 0.95% |
|---|
| | |
|---|
|
| Expenses Paid, Amount |
$ 103
|
| Expense Ratio, Percent |
0.95%
|
| Factors Affecting Performance [Text Block] |
What affected the Fund’s performance during the last year?Top contributors to performance: The Fund generated the strongest relative performance within the technology, communication services, and health care sectors. Stocks that contributed most positively to the Fund’s relative performance were Interactive Brokers Group, Inc. and Broadcom Inc.
Top detractors from performance: Stocks that contributed negatively to the Fund’s performance were NVIDIA Corp. (“NVIDIA”) and Novo Nordisk A/S, ADR (“Novo Nordisk”). The Fund was underweight NVIDIA compared to the Fund’s benchmark during much of the year while we believe investor excitement and demand for its high-end artificial intelligence chips led the stock to continually surpass market expectations. Novo Nordisk underperformed as the company’s flagship portfolio of GLP-1 drugs such as Wegovy lagged competitors in demand and efficacy for some health conditions.
|
| Performance Past Does Not Indicate Future [Text] |
The investment return and principal value will fluctuate so that an investor's shares, when redeemed, may be worth more or less than the original cost. Past performance is not a good predictor of the Fund's future performance.
|
| Line Graph [Table Text Block] |
| Victory Munder Multi-Cap Fund Class Y - $3,087,000 | Russell 3000® Index (regulatory broad based index) - $3,382,207 | S&P 500® Index - $3,593,619 |
|---|
6/15 | $1,000,000 | $1,000,000 | $1,000,000 |
|---|
6/16 | $963,935 | $1,021,383 | $1,039,928 |
|---|
6/17 | $1,136,048 | $1,210,436 | $1,226,034 |
|---|
6/18 | $1,292,897 | $1,389,315 | $1,402,264 |
|---|
6/19 | $1,334,361 | $1,514,111 | $1,548,344 |
|---|
6/20 | $1,360,051 | $1,612,975 | $1,664,549 |
|---|
6/21 | $1,911,385 | $2,325,337 | $2,343,588 |
|---|
6/22 | $1,750,402 | $2,002,914 | $2,094,797 |
|---|
6/23 | $2,138,980 | $2,382,540 | $2,505,253 |
|---|
6/24 | $2,639,925 | $2,933,505 | $3,120,445 |
|---|
6/25 | $3,087,000 | $3,382,207 | $3,593,619 |
|---|
|
| Average Annual Return [Table Text Block] |
| 1 Year | 5 Year | 10 Year |
|---|
Class Y | 16.94%Footnote Reference | 17.81%Footnote Reference | 11.93% |
|---|
Russell 3000® Index | 15.30% | 15.96% | 12.96% |
|---|
S&P 500® Index | 15.16% | 16.64% | 13.65% |
|---|
|
| No Deduction of Taxes [Text Block] |
The graph and table total returns do not reflect the deduction of taxes that a shareholder would pay on Fund distributions, or redemption of shares.
|
| AssetsNet |
$ 496,726,000
|
| Holdings Count | Holding |
75
|
| Advisory Fees Paid, Amount |
$ 3,580,000
|
| InvestmentCompanyPortfolioTurnover |
88.00%
|
| Additional Fund Statistics [Text Block] |
FUND STATISTICS($ amounts in 000s)(as of June 30, 2025)Net Assets | $496,726 |
|---|
Number of Holdings | 75 |
|---|
Investment Advisory Fees | $3,580 |
|---|
Portfolio Turnover | 88% |
|---|
|
| Holdings [Text Block] |
Top SectorsFootnote Reference* (% of Net Assets)Footnote Reference(as of June 30, 2025)Value | Value |
|---|
Real Estate | 1.4% | Materials | 2.3% | Energy | 2.6% | Consumer Staples | 2.8% | Industrials | 8.0% | Communication Services | 11.0% | Consumer Discretionary | 12.3% | Health Care | 12.9% | Financials | 14.2% | Information TechnologyFootnote Reference** | 30.9% |
Top 10 HoldingsFootnote Reference* (% of Net Assets)Footnote Reference(as of June 30, 2025)Microsoft Corp. | 6.6% |
|---|
NVIDIA Corp. | 5.5% |
|---|
Apple, Inc. | 5.1% |
|---|
Alphabet, Inc., Class A | 3.8% |
|---|
Amazon.com, Inc. | 3.6% |
|---|
Meta Platforms, Inc., Class A | 3.3% |
|---|
Broadcom, Inc. | 3.2% |
|---|
Visa, Inc., Class A | 2.3% |
|---|
Eli Lilly & Co. | 2.0% |
|---|
Jabil, Inc. | 1.8% |
|---|
|
| Material Fund Change [Text Block] |
|
| C000144988 |
|
| Shareholder Report [Line Items] |
|
| Fund Name |
Victory S&P 500 Index Fund
|
| Class Name |
Class A
|
| Trading Symbol |
MUXAX
|
| Annual or Semi-Annual Statement [Text Block] |
Annual Shareholder Report
|
| Shareholder Report Annual or Semi-Annual |
annual shareholder report
|
| Additional Information [Text Block] |
You can find additional information about the Fund at advisor.vcm.com/literature/mutual-fund-prospectuses. You may also request more information by calling 800-539-3863 or visiting vcm.com/contact-us.
|
| Additional Information Phone Number |
800-539-3863
|
| Additional Information Website |
vcm.com
|
| Expenses [Text Block] |
What were the Fund's costs for the last year?(based on a hypothetical $10,000 investment) Class Name | Costs of a $10,000 Investment | Costs paid as a percentage of a $10,000 Investment |
|---|
Class A | $57 | 0.53% |
|---|
| | |
|---|
|
| Expenses Paid, Amount |
$ 57
|
| Expense Ratio, Percent |
0.53%
|
| Factors Affecting Performance [Text Block] |
What affected the Fund’s performance during the last year?During the reporting period, the Fund had positive absolute returns. Top contributors to performance: During the reporting period, nine of the 11 sectors delivered positive absolute returns. The information technology sector was the best performing sector.
Top detractors from performance: The Fund had a small allocation to derivatives during the period that did not have a material impact on performance. |
| Performance Past Does Not Indicate Future [Text] |
The investment return and principal value will fluctuate so that an investor's shares, when redeemed, may be worth more or less than the original cost. Past performance is not a good predictor of the Fund's future performance.
|
| Line Graph [Table Text Block] |
| Victory S&P 500 Index Fund Class A @ NAV - $34,066 | Victory S&P 500 Index Fund Class A @ MOP - $33,303 | S&P 500® Index (regulatory broad based index) - $35,936 |
|---|
6/15 | $10,000 | $9,776 | $10,000 |
|---|
6/16 | $10,349 | $10,117 | $10,399 |
|---|
6/17 | $12,124 | $11,852 | $12,260 |
|---|
6/18 | $13,789 | $13,480 | $14,023 |
|---|
6/19 | $15,140 | $14,800 | $15,483 |
|---|
6/20 | $16,193 | $15,830 | $16,645 |
|---|
6/21 | $22,670 | $22,162 | $23,436 |
|---|
6/22 | $20,151 | $19,700 | $20,948 |
|---|
6/23 | $23,955 | $23,418 | $25,053 |
|---|
6/24 | $29,674 | $29,008 | $31,204 |
|---|
6/25 | $34,066 | $33,303 | $35,936 |
|---|
|
| Average Annual Return [Table Text Block] |
| 1 Year | 5 Year | 10 Year |
|---|
Class A @ NAV | 14.80% | 16.04%Footnote Reference | 13.04% |
|---|
Class A @ MOP | 12.22% | 15.51% | 12.78% |
|---|
S&P 500® Index | 15.16% | 16.64% | 13.65% |
|---|
|
| No Deduction of Taxes [Text Block] |
The graph and table total returns do not reflect the deduction of taxes that a shareholder would pay on Fund distributions, or redemption of shares.
|
| Previous Investment Adviser [Text Block] |
The maximum offering price (“MOP”) figures reflect a maximum sales charge of 2.25% for Class A. The Net Asset Value ("NAV") figures do not reflect sales charges.
|
| AssetsNet |
$ 266,140,000
|
| Holdings Count | Holding |
505
|
| Advisory Fees Paid, Amount |
$ 511,000
|
| InvestmentCompanyPortfolioTurnover |
4.00%
|
| Additional Fund Statistics [Text Block] |
FUND STATISTICS($ amounts in 000s)(as of June 30, 2025)Net Assets | $266,140 |
|---|
Number of Holdings | 505 |
|---|
Investment Advisory Fees | $511 |
|---|
Portfolio Turnover | 4% |
|---|
|
| Holdings [Text Block] |
Top SectorsFootnote Reference* (% of Net Assets)Footnote Reference(as of June 30, 2025)Value | Value |
|---|
Real Estate | 2.0% | Utilities | 2.4% | Energy | 3.0% | Consumer Staples | 5.5% | Industrials | 8.5% | Health Care | 9.3% | Communication Services | 9.8% | Consumer Discretionary | 10.3% | Financials | 13.9% | Information TechnologyFootnote Reference** | 32.9% |
Top 10 HoldingsFootnote Reference* (% of Net Assets)Footnote Reference(as of June 30, 2025)NVIDIA Corp. | 7.3% |
|---|
Microsoft Corp. | 7.0% |
|---|
Apple, Inc. | 5.8% |
|---|
Amazon.com, Inc. | 3.9% |
|---|
Meta Platforms, Inc., Class A | 3.0% |
|---|
Broadcom, Inc. | 2.5% |
|---|
Alphabet, Inc., Class A | 1.9% |
|---|
Berkshire Hathaway, Inc., Class B | 1.7% |
|---|
Tesla, Inc. | 1.7% |
|---|
Alphabet, Inc., Class C | 1.6% |
|---|
|
| Material Fund Change [Text Block] |
|
| C000144989 |
|
| Shareholder Report [Line Items] |
|
| Fund Name |
Victory S&P 500 Index Fund
|
| Class Name |
Class R
|
| Trading Symbol |
MUXRX
|
| Annual or Semi-Annual Statement [Text Block] |
Annual Shareholder Report
|
| Shareholder Report Annual or Semi-Annual |
annual shareholder report
|
| Additional Information [Text Block] |
You can find additional information about the Fund at advisor.vcm.com/literature/mutual-fund-prospectuses. You may also request more information by calling 800-539-3863 or visiting vcm.com/contact-us.
|
| Additional Information Phone Number |
800-539-3863
|
| Additional Information Website |
vcm.com
|
| Expenses [Text Block] |
What were the Fund's costs for the last year?(based on a hypothetical $10,000 investment) Class Name | Costs of a $10,000 Investment | Costs paid as a percentage of a $10,000 Investment |
|---|
Class R | $93 | 0.87% |
|---|
| | |
|---|
|
| Expenses Paid, Amount |
$ 93
|
| Expense Ratio, Percent |
0.87%
|
| Factors Affecting Performance [Text Block] |
What affected the Fund’s performance during the last year?During the reporting period, the Fund had positive absolute returns. Top contributors to performance: During the reporting period, nine of the 11 sectors delivered positive absolute returns. The information technology sector was the best performing sector.
Top detractors from performance: The Fund had a small allocation to derivatives during the period that did not have a material impact on performance. |
| Performance Past Does Not Indicate Future [Text] |
The investment return and principal value will fluctuate so that an investor's shares, when redeemed, may be worth more or less than the original cost. Past performance is not a good predictor of the Fund's future performance.
|
| Line Graph [Table Text Block] |
| Victory S&P 500 Index Fund Class R - $32,736 | S&P 500® Index (regulatory broad based index) - $35,936 |
|---|
6/15 | $10,000 | $10,000 |
|---|
6/16 | $10,303 | $10,399 |
|---|
6/17 | $12,012 | $12,260 |
|---|
6/18 | $13,611 | $14,023 |
|---|
6/19 | $14,879 | $15,483 |
|---|
6/20 | $15,856 | $16,645 |
|---|
6/21 | $22,108 | $23,436 |
|---|
6/22 | $19,574 | $20,948 |
|---|
6/23 | $23,175 | $25,053 |
|---|
6/24 | $28,617 | $31,204 |
|---|
6/25 | $32,736 | $35,936 |
|---|
|
| Average Annual Return [Table Text Block] |
| 1 Year | 5 Year | 10 Year |
|---|
Class R | 14.39% | 15.60%Footnote Reference | 12.59% |
|---|
S&P 500® Index | 15.16% | 16.64% | 13.65% |
|---|
|
| No Deduction of Taxes [Text Block] |
The graph and table total returns do not reflect the deduction of taxes that a shareholder would pay on Fund distributions, or redemption of shares.
|
| AssetsNet |
$ 266,140,000
|
| Holdings Count | Holding |
505
|
| Advisory Fees Paid, Amount |
$ 511,000
|
| InvestmentCompanyPortfolioTurnover |
4.00%
|
| Additional Fund Statistics [Text Block] |
FUND STATISTICS($ amounts in 000s)(as of June 30, 2025)Net Assets | $266,140 |
|---|
Number of Holdings | 505 |
|---|
Investment Advisory Fees | $511 |
|---|
Portfolio Turnover | 4% |
|---|
|
| Holdings [Text Block] |
Top SectorsFootnote Reference* (% of Net Assets)Footnote Reference(as of June 30, 2025)Value | Value |
|---|
Real Estate | 2.0% | Utilities | 2.4% | Energy | 3.0% | Consumer Staples | 5.5% | Industrials | 8.5% | Health Care | 9.3% | Communication Services | 9.8% | Consumer Discretionary | 10.3% | Financials | 13.9% | Information TechnologyFootnote Reference** | 32.9% |
Top 10 HoldingsFootnote Reference* (% of Net Assets)Footnote Reference(as of June 30, 2025)NVIDIA Corp. | 7.3% |
|---|
Microsoft Corp. | 7.0% |
|---|
Apple, Inc. | 5.8% |
|---|
Amazon.com, Inc. | 3.9% |
|---|
Meta Platforms, Inc., Class A | 3.0% |
|---|
Broadcom, Inc. | 2.5% |
|---|
Alphabet, Inc., Class A | 1.9% |
|---|
Berkshire Hathaway, Inc., Class B | 1.7% |
|---|
Tesla, Inc. | 1.7% |
|---|
Alphabet, Inc., Class C | 1.6% |
|---|
|
| Material Fund Change [Text Block] |
|
| C000144990 |
|
| Shareholder Report [Line Items] |
|
| Fund Name |
Victory S&P 500 Index Fund
|
| Class Name |
Class Y
|
| Trading Symbol |
MUXYX
|
| Annual or Semi-Annual Statement [Text Block] |
Annual Shareholder Report
|
| Shareholder Report Annual or Semi-Annual |
annual shareholder report
|
| Additional Information [Text Block] |
You can find additional information about the Fund at advisor.vcm.com/literature/mutual-fund-prospectuses. You may also request more information by calling 800-539-3863 or visiting vcm.com/contact-us.
|
| Additional Information Phone Number |
800-539-3863
|
| Additional Information Website |
vcm.com
|
| Expenses [Text Block] |
What were the Fund's costs for the last year?(based on a hypothetical $10,000 investment) Class Name | Costs of a $10,000 Investment | Costs paid as a percentage of a $10,000 Investment |
|---|
Class Y | $46 | 0.43% |
|---|
| | |
|---|
|
| Expenses Paid, Amount |
$ 46
|
| Expense Ratio, Percent |
0.43%
|
| Factors Affecting Performance [Text Block] |
What affected the Fund’s performance during the last year?During the reporting period, the Fund had positive absolute returns. Top contributors to performance: During the reporting period, nine of the 11 sectors delivered positive absolute returns. The information technology sector was the best performing sector.
Top detractors from performance: The Fund had a small allocation to derivatives during the period that did not have a material impact on performance. |
| Performance Past Does Not Indicate Future [Text] |
The investment return and principal value will fluctuate so that an investor's shares, when redeemed, may be worth more or less than the original cost. Past performance is not a good predictor of the Fund's future performance.
|
| Line Graph [Table Text Block] |
| Victory S&P 500 Index Fund Class Y - $3,448,981 | S&P 500® Index (regulatory broad based index) - $3,593,619 |
|---|
6/15 | $1,000,000 | $1,000,000 |
|---|
6/16 | $1,037,419 | $1,039,928 |
|---|
6/17 | $1,217,250 | $1,226,034 |
|---|
6/18 | $1,387,174 | $1,402,264 |
|---|
6/19 | $1,524,859 | $1,548,344 |
|---|
6/20 | $1,632,738 | $1,664,549 |
|---|
6/21 | $2,288,427 | $2,343,588 |
|---|
6/22 | $2,035,404 | $2,094,797 |
|---|
6/23 | $2,421,662 | $2,505,253 |
|---|
6/24 | $3,002,016 | $3,120,445 |
|---|
6/25 | $3,448,981 | $3,593,619 |
|---|
|
| Average Annual Return [Table Text Block] |
| 1 Year | 5 Year | 10 Year |
|---|
Class Y | 14.89% | 16.13%Footnote Reference | 13.18% |
|---|
S&P 500® Index | 15.16% | 16.64% | 13.65% |
|---|
|
| No Deduction of Taxes [Text Block] |
The graph and table total returns do not reflect the deduction of taxes that a shareholder would pay on Fund distributions, or redemption of shares.
|
| AssetsNet |
$ 266,140,000
|
| Holdings Count | Holding |
505
|
| Advisory Fees Paid, Amount |
$ 511,000
|
| InvestmentCompanyPortfolioTurnover |
4.00%
|
| Additional Fund Statistics [Text Block] |
FUND STATISTICS($ amounts in 000s)(as of June 30, 2025)Net Assets | $266,140 |
|---|
Number of Holdings | 505 |
|---|
Investment Advisory Fees | $511 |
|---|
Portfolio Turnover | 4% |
|---|
|
| Holdings [Text Block] |
Top SectorsFootnote Reference* (% of Net Assets)Footnote Reference(as of June 30, 2025)Value | Value |
|---|
Real Estate | 2.0% | Utilities | 2.4% | Energy | 3.0% | Consumer Staples | 5.5% | Industrials | 8.5% | Health Care | 9.3% | Communication Services | 9.8% | Consumer Discretionary | 10.3% | Financials | 13.9% | Information TechnologyFootnote Reference** | 32.9% |
Top 10 HoldingsFootnote Reference* (% of Net Assets)Footnote Reference(as of June 30, 2025)NVIDIA Corp. | 7.3% |
|---|
Microsoft Corp. | 7.0% |
|---|
Apple, Inc. | 5.8% |
|---|
Amazon.com, Inc. | 3.9% |
|---|
Meta Platforms, Inc., Class A | 3.0% |
|---|
Broadcom, Inc. | 2.5% |
|---|
Alphabet, Inc., Class A | 1.9% |
|---|
Berkshire Hathaway, Inc., Class B | 1.7% |
|---|
Tesla, Inc. | 1.7% |
|---|
Alphabet, Inc., Class C | 1.6% |
|---|
|
| Material Fund Change [Text Block] |
|
| C000144972 |
|
| Shareholder Report [Line Items] |
|
| Fund Name |
Victory Munder Mid-Cap Core Growth Fund
|
| Class Name |
Class A
|
| Trading Symbol |
MGOAX
|
| Annual or Semi-Annual Statement [Text Block] |
Annual Shareholder Report
|
| Shareholder Report Annual or Semi-Annual |
annual shareholder report
|
| Additional Information [Text Block] |
You can find additional information about the Fund at advisor.vcm.com/literature/mutual-fund-prospectuses. You may also request more information by calling 800-539-3863 or visiting vcm.com/contact-us.
|
| Additional Information Phone Number |
800-539-3863
|
| Additional Information Website |
vcm.com
|
| Expenses [Text Block] |
What were the Fund's costs for the last year?(based on a hypothetical $10,000 investment) Class Name | Costs of a $10,000 Investment | Costs paid as a percentage of a $10,000 Investment |
|---|
Class A | $137 | 1.28% |
|---|
| | |
|---|
|
| Expenses Paid, Amount |
$ 137
|
| Expense Ratio, Percent |
1.28%
|
| Factors Affecting Performance [Text Block] |
What affected the Fund’s performance during the last year?Top contributors to performance: The Fund’s best-performing sectors for the year on a relative basis were health care and real estate. On an individual stock basis, the Fund’s two best active-contributing stocks over the past year were Amphenol Corp., Class A (“Amphenol”) and CBRE Group, Inc., Class A. (“CBRE”). Amphenol provides electrical and fiber-optic connectors for use in a broad range of end markets. The company’s fastest growing end market by far has been IT datacom. This segment continues to benefit from robust connector demand in AI-related data center applications. CBRE, the provider of commercial real estate services, has seen a significant improvement in transaction volumes and leasing activity over the past year, especially in core office markets like New York City.
Top detractors from performance: The Fund’s worst-performing sectors were energy and industrials. The Fund’s two worst active-contributing stocks in the last two months were two benchmark names Palantir Technologies, Inc., Class A (“Palantir”) and AppLovin Corp., Class A (“AppLovin”), both of which are in the information technology sector. Palantir provides data analytics software that leverages AI. The company’s offering has gained significant traction in both government and commercial channels. While the Fund has been actively hedging its position over the last year, the Fund has been underweight the position mainly on valuation – Palantir consistently trades at more than 60 times forward revenues. AppLovin provides mobile gaming applications and related advertising platforms. The company’s AI-powered advertising offering has been a significant growth driver. Similar to Palantir, the Fund has been actively hedging its position in AppLovin over the last year, but has been underweight the position due to valuation.
|
| Performance Past Does Not Indicate Future [Text] |
The investment return and principal value will fluctuate so that an investor's shares, when redeemed, may be worth more or less than the original cost. Past performance is not a good predictor of the Fund's future performance.
|
| Line Graph [Table Text Block] |
| Victory Munder Mid-Cap Core Growth Fund Class A @ NAV - $21,077 | Victory Munder Mid-Cap Core Growth Fund Class A @ MOP - $19,866 | S&P 500® Index (regulatory broad based index) - $35,936 | Russell Midcap® Index - $25,678 | Russell Midcap® Growth Index - $31,408 |
|---|
6/15 | $10,000 | $9,425 | $10,000 | $10,000 | $10,000 |
|---|
6/16 | $9,206 | $8,677 | $10,399 | $10,056 | $9,786 |
|---|
6/17 | $10,787 | $10,167 | $12,260 | $11,713 | $11,454 |
|---|
6/18 | $12,090 | $11,395 | $14,023 | $13,157 | $13,576 |
|---|
6/19 | $12,596 | $11,872 | $15,483 | $14,187 | $15,468 |
|---|
6/20 | $12,213 | $11,511 | $16,645 | $13,869 | $17,311 |
|---|
6/21 | $18,016 | $16,981 | $23,436 | $20,776 | $24,888 |
|---|
6/22 | $14,982 | $14,121 | $20,948 | $17,182 | $17,527 |
|---|
6/23 | $16,679 | $15,721 | $25,053 | $19,746 | $21,582 |
|---|
6/24 | $18,602 | $17,533 | $31,204 | $22,289 | $24,830 |
|---|
6/25 | $21,077 | $19,866 | $35,936 | $25,678 | $31,408 |
|---|
|
| Average Annual Return [Table Text Block] |
| 1 Year | 5 Year | 10 Year |
|---|
Class A @ NAV | 13.31% | 11.53% | 7.74% |
|---|
Class A @ MOP | 6.83% | 10.21% | 7.11% |
|---|
S&P 500® Index | 15.16% | 16.64% | 13.65% |
|---|
Russell Midcap® Index | 15.21% | 13.11% | 9.89% |
|---|
Russell Midcap® Growth Index | 26.49% | 12.65% | 12.13% |
|---|
|
| No Deduction of Taxes [Text Block] |
The graph and table total returns do not reflect the deduction of taxes that a shareholder would pay on Fund distributions, or redemption of shares.
|
| Previous Investment Adviser [Text Block] |
The maximum offering price (“MOP”) figures reflect a maximum sales charge of 5.75% for Class A. The Net Asset Value ("NAV") figures do not reflect sales charges.
|
| AssetsNet |
$ 285,661,000
|
| Holdings Count | Holding |
94
|
| Advisory Fees Paid, Amount |
$ 2,240,000
|
| InvestmentCompanyPortfolioTurnover |
89.00%
|
| Additional Fund Statistics [Text Block] |
FUND STATISTICS($ amounts in 000s)(as of June 30, 2025)Net Assets | $285,661 |
|---|
Number of Holdings | 94 |
|---|
Investment Advisory Fees | $2,240 |
|---|
Portfolio Turnover | 89% |
|---|
|
| Holdings [Text Block] |
Top SectorsFootnote Reference* (% of Net Assets)Footnote Reference(as of June 30, 2025)Value | Value |
|---|
Utilities | 3.2% | Communication Services | 3.5% | Consumer Staples | 5.1% | Energy | 5.1% | Real Estate | 6.6% | Health Care | 10.0% | Consumer Discretionary | 12.2% | Industrials | 14.8% | Information Technology | 15.9% | Financials | 19.3% |
Top 10 HoldingsFootnote Reference* (% of Net Assets)Footnote Reference(as of June 30, 2025)Royal Caribbean Cruises Ltd. | 2.2% |
|---|
Quanta Services, Inc. | 2.2% |
|---|
Jabil, Inc. | 1.9% |
|---|
CBRE Group, Inc., Class A | 1.8% |
|---|
Interactive Brokers Group, Inc. | 1.8% |
|---|
Verisk Analytics, Inc. | 1.7% |
|---|
Federal Signal Corp. | 1.7% |
|---|
Cencora, Inc. | 1.7% |
|---|
HCA Healthcare, Inc. | 1.7% |
|---|
Cheniere Energy, Inc. | 1.7% |
|---|
|
| Material Fund Change [Text Block] |
|
| C000144973 |
|
| Shareholder Report [Line Items] |
|
| Fund Name |
Victory Munder Mid-Cap Core Growth Fund
|
| Class Name |
Class C
|
| Trading Symbol |
MGOTX
|
| Annual or Semi-Annual Statement [Text Block] |
Annual Shareholder Report
|
| Shareholder Report Annual or Semi-Annual |
annual shareholder report
|
| Additional Information [Text Block] |
You can find additional information about the Fund at advisor.vcm.com/literature/mutual-fund-prospectuses. You may also request more information by calling 800-539-3863 or visiting vcm.com/contact-us.
|
| Additional Information Phone Number |
800-539-3863
|
| Additional Information Website |
vcm.com
|
| Expenses [Text Block] |
What were the Fund's costs for the last year?(based on a hypothetical $10,000 investment) Class Name | Costs of a $10,000 Investment | Costs paid as a percentage of a $10,000 Investment |
|---|
Class C | $225 | 2.12% |
|---|
| | |
|---|
|
| Expenses Paid, Amount |
$ 225
|
| Expense Ratio, Percent |
2.12%
|
| Factors Affecting Performance [Text Block] |
What affected the Fund’s performance during the last year?Top contributors to performance: The Fund’s best-performing sectors for the year on a relative basis were health care and real estate. On an individual stock basis, the Fund’s two best active-contributing stocks over the past year were Amphenol Corp., Class A (“Amphenol”) and CBRE Group, Inc., Class A. (“CBRE”). Amphenol provides electrical and fiber-optic connectors for use in a broad range of end markets. The company’s fastest growing end market by far has been IT datacom. This segment continues to benefit from robust connector demand in AI-related data center applications. CBRE, the provider of commercial real estate services, has seen a significant improvement in transaction volumes and leasing activity over the past year, especially in core office markets like New York City.
Top detractors from performance: The Fund’s worst-performing sectors were energy and industrials. The Fund’s two worst active-contributing stocks in the last two months were two benchmark names Palantir Technologies, Inc., Class A (“Palantir”) and AppLovin Corp., Class A (“AppLovin”), both of which are in the information technology sector. Palantir provides data analytics software that leverages AI. The company’s offering has gained significant traction in both government and commercial channels. While the Fund has been actively hedging its position over the last year, the Fund has been underweight the position mainly on valuation – Palantir consistently trades at more than 60 times forward revenues. AppLovin provides mobile gaming applications and related advertising platforms. The company’s AI-powered advertising offering has been a significant growth driver. Similar to Palantir, the Fund has been actively hedging its position in AppLovin over the last year, but has been underweight the position due to valuation.
|
| Performance Past Does Not Indicate Future [Text] |
The investment return and principal value will fluctuate so that an investor's shares, when redeemed, may be worth more or less than the original cost. Past performance is not a good predictor of the Fund's future performance.
|
| Line Graph [Table Text Block] |
| Victory Munder Mid-Cap Core Growth Fund Class C @ NAV - $19,856 | Victory Munder Mid-Cap Core Growth Fund Class C @ CDSC - $19,856 | S&P 500® Index (regulatory broad based index) - $35,936 | Russell Midcap® Index - $25,678 | Russell Midcap® Growth Index - $31,408 |
|---|
6/15 | $10,000 | $10,000 | $10,000 | $10,000 | $10,000 |
|---|
6/16 | $9,142 | $9,142 | $10,399 | $10,056 | $9,786 |
|---|
6/17 | $10,644 | $10,644 | $12,260 | $11,713 | $11,454 |
|---|
6/18 | $11,844 | $11,844 | $14,023 | $13,157 | $13,576 |
|---|
6/19 | $12,259 | $12,259 | $15,483 | $14,187 | $15,468 |
|---|
6/20 | $11,791 | $11,791 | $16,645 | $13,869 | $17,311 |
|---|
6/21 | $17,274 | $17,274 | $23,436 | $20,776 | $24,888 |
|---|
6/22 | $14,246 | $14,246 | $20,948 | $17,182 | $17,527 |
|---|
6/23 | $15,713 | $15,713 | $25,053 | $19,746 | $21,582 |
|---|
6/24 | $17,524 | $17,524 | $31,204 | $22,289 | $24,830 |
|---|
6/25 | $19,856 | $19,856 | $35,936 | $25,678 | $31,408 |
|---|
|
| Average Annual Return [Table Text Block] |
| 1 Year | 5 Year | 10 Year |
|---|
Class C @ NAV | 12.15% | 10.60% | 7.10% |
|---|
Class C @ CDSC | 11.24% | 10.60% | 7.10% |
|---|
S&P 500® Index | 15.16% | 16.64% | 13.65% |
|---|
Russell Midcap® Index | 15.21% | 13.11% | 9.89% |
|---|
Russell Midcap® Growth Index | 26.49% | 12.65% | 12.13% |
|---|
|
| No Deduction of Taxes [Text Block] |
The graph and table total returns do not reflect the deduction of taxes that a shareholder would pay on Fund distributions, or redemption of shares.
|
| Previous Investment Adviser [Text Block] |
Class C is not subject to an initial sales charge, but is subject to Contingent Deferred Sales Charge (“CDSC”) of 1.00% on shares redeemed within one year of purchase. The Net Asset Value ("NAV") figures do not reflect sales charges.
|
| AssetsNet |
$ 285,661,000
|
| Holdings Count | Holding |
94
|
| Advisory Fees Paid, Amount |
$ 2,240,000
|
| InvestmentCompanyPortfolioTurnover |
89.00%
|
| Additional Fund Statistics [Text Block] |
FUND STATISTICS($ amounts in 000s)(as of June 30, 2025)Net Assets | $285,661 |
|---|
Number of Holdings | 94 |
|---|
Investment Advisory Fees | $2,240 |
|---|
Portfolio Turnover | 89% |
|---|
|
| Holdings [Text Block] |
Top SectorsFootnote Reference* (% of Net Assets)Footnote Reference(as of June 30, 2025)Value | Value |
|---|
Utilities | 3.2% | Communication Services | 3.5% | Consumer Staples | 5.1% | Energy | 5.1% | Real Estate | 6.6% | Health Care | 10.0% | Consumer Discretionary | 12.2% | Industrials | 14.8% | Information Technology | 15.9% | Financials | 19.3% |
Top 10 HoldingsFootnote Reference* (% of Net Assets)Footnote Reference(as of June 30, 2025)Royal Caribbean Cruises Ltd. | 2.2% |
|---|
Quanta Services, Inc. | 2.2% |
|---|
Jabil, Inc. | 1.9% |
|---|
CBRE Group, Inc., Class A | 1.8% |
|---|
Interactive Brokers Group, Inc. | 1.8% |
|---|
Verisk Analytics, Inc. | 1.7% |
|---|
Federal Signal Corp. | 1.7% |
|---|
Cencora, Inc. | 1.7% |
|---|
HCA Healthcare, Inc. | 1.7% |
|---|
Cheniere Energy, Inc. | 1.7% |
|---|
|
| Material Fund Change [Text Block] |
|
| C000144975 |
|
| Shareholder Report [Line Items] |
|
| Fund Name |
Victory Munder Mid-Cap Core Growth Fund
|
| Class Name |
Class R6
|
| Trading Symbol |
MGOSX
|
| Annual or Semi-Annual Statement [Text Block] |
Annual Shareholder Report
|
| Shareholder Report Annual or Semi-Annual |
annual shareholder report
|
| Additional Information [Text Block] |
You can find additional information about the Fund at advisor.vcm.com/literature/mutual-fund-prospectuses. You may also request more information by calling 800-539-3863 or visiting vcm.com/contact-us.
|
| Additional Information Phone Number |
800-539-3863
|
| Additional Information Website |
vcm.com
|
| Expenses [Text Block] |
What were the Fund's costs for the last year?(based on a hypothetical $10,000 investment) Class Name | Costs of a $10,000 Investment | Costs paid as a percentage of a $10,000 Investment |
|---|
Class R6 | $94 | 0.88% |
|---|
| | |
|---|
|
| Expenses Paid, Amount |
$ 94
|
| Expense Ratio, Percent |
0.88%
|
| Factors Affecting Performance [Text Block] |
What affected the Fund’s performance during the last year?Top contributors to performance: The Fund’s best-performing sectors for the year on a relative basis were health care and real estate. On an individual stock basis, the Fund’s two best active-contributing stocks over the past year were Amphenol Corp., Class A (“Amphenol”) and CBRE Group, Inc., Class A. (“CBRE”). Amphenol provides electrical and fiber-optic connectors for use in a broad range of end markets. The company’s fastest growing end market by far has been IT datacom. This segment continues to benefit from robust connector demand in AI-related data center applications. CBRE, the provider of commercial real estate services, has seen a significant improvement in transaction volumes and leasing activity over the past year, especially in core office markets like New York City.
Top detractors from performance: The Fund’s worst-performing sectors were energy and industrials. The Fund’s two worst active-contributing stocks in the last two months were two benchmark names Palantir Technologies, Inc., Class A (“Palantir”) and AppLovin Corp., Class A (“AppLovin”), both of which are in the information technology sector. Palantir provides data analytics software that leverages AI. The company’s offering has gained significant traction in both government and commercial channels. While the Fund has been actively hedging its position over the last year, the Fund has been underweight the position mainly on valuation – Palantir consistently trades at more than 60 times forward revenues. AppLovin provides mobile gaming applications and related advertising platforms. The company’s AI-powered advertising offering has been a significant growth driver. Similar to Palantir, the Fund has been actively hedging its position in AppLovin over the last year, but has been underweight the position due to valuation.
|
| Performance Past Does Not Indicate Future [Text] |
The investment return and principal value will fluctuate so that an investor's shares, when redeemed, may be worth more or less than the original cost. Past performance is not a good predictor of the Fund's future performance.
|
| Line Graph [Table Text Block] |
| Victory Munder Mid-Cap Core Growth Fund Class R6 - $21,955 | S&P 500® Index (regulatory broad based index) - $35,936 | Russell Midcap® Index - $25,678 | Russell Midcap® Growth Index - $31,408 |
|---|
6/15 | $10,000 | $10,000 | $10,000 | $10,000 |
|---|
6/16 | $9,246 | $10,399 | $10,056 | $9,786 |
|---|
6/17 | $10,885 | $12,260 | $11,713 | $11,454 |
|---|
6/18 | $12,253 | $14,023 | $13,157 | $13,576 |
|---|
6/19 | $12,812 | $15,483 | $14,187 | $15,468 |
|---|
6/20 | $12,479 | $16,645 | $13,869 | $17,311 |
|---|
6/21 | $18,494 | $23,436 | $20,776 | $24,888 |
|---|
6/22 | $15,436 | $20,948 | $17,182 | $17,527 |
|---|
6/23 | $17,250 | $25,053 | $19,746 | $21,582 |
|---|
6/24 | $19,316 | $31,204 | $22,289 | $24,830 |
|---|
6/25 | $21,955 | $35,936 | $25,678 | $31,408 |
|---|
|
| Average Annual Return [Table Text Block] |
| 1 Year | 5 Year | 10 Year |
|---|
Class R6 | 13.66% | 11.96% | 8.18% |
|---|
S&P 500® Index | 15.16% | 16.64% | 13.65% |
|---|
Russell Midcap® Index | 15.21% | 13.11% | 9.89% |
|---|
Russell Midcap® Growth Index | 26.49% | 12.65% | 12.13% |
|---|
|
| No Deduction of Taxes [Text Block] |
The graph and table total returns do not reflect the deduction of taxes that a shareholder would pay on Fund distributions, or redemption of shares.
|
| AssetsNet |
$ 285,661,000
|
| Holdings Count | Holding |
94
|
| Advisory Fees Paid, Amount |
$ 2,240,000
|
| InvestmentCompanyPortfolioTurnover |
89.00%
|
| Additional Fund Statistics [Text Block] |
FUND STATISTICS($ amounts in 000s)(as of June 30, 2025)Net Assets | $285,661 |
|---|
Number of Holdings | 94 |
|---|
Investment Advisory Fees | $2,240 |
|---|
Portfolio Turnover | 89% |
|---|
|
| Holdings [Text Block] |
Top SectorsFootnote Reference* (% of Net Assets)Footnote Reference(as of June 30, 2025)Value | Value |
|---|
Utilities | 3.2% | Communication Services | 3.5% | Consumer Staples | 5.1% | Energy | 5.1% | Real Estate | 6.6% | Health Care | 10.0% | Consumer Discretionary | 12.2% | Industrials | 14.8% | Information Technology | 15.9% | Financials | 19.3% |
Top 10 HoldingsFootnote Reference* (% of Net Assets)Footnote Reference(as of June 30, 2025)Royal Caribbean Cruises Ltd. | 2.2% |
|---|
Quanta Services, Inc. | 2.2% |
|---|
Jabil, Inc. | 1.9% |
|---|
CBRE Group, Inc., Class A | 1.8% |
|---|
Interactive Brokers Group, Inc. | 1.8% |
|---|
Verisk Analytics, Inc. | 1.7% |
|---|
Federal Signal Corp. | 1.7% |
|---|
Cencora, Inc. | 1.7% |
|---|
HCA Healthcare, Inc. | 1.7% |
|---|
Cheniere Energy, Inc. | 1.7% |
|---|
|
| Material Fund Change [Text Block] |
|
| C000144976 |
|
| Shareholder Report [Line Items] |
|
| Fund Name |
Victory Munder Mid-Cap Core Growth Fund
|
| Class Name |
Class Y
|
| Trading Symbol |
MGOYX
|
| Annual or Semi-Annual Statement [Text Block] |
Annual Shareholder Report
|
| Shareholder Report Annual or Semi-Annual |
annual shareholder report
|
| Additional Information [Text Block] |
You can find additional information about the Fund at advisor.vcm.com/literature/mutual-fund-prospectuses. You may also request more information by calling 800-539-3863 or visiting vcm.com/contact-us.
|
| Additional Information Phone Number |
800-539-3863
|
| Additional Information Website |
vcm.com
|
| Expenses [Text Block] |
What were the Fund's costs for the last year?(based on a hypothetical $10,000 investment) Class Name | Costs of a $10,000 Investment | Costs paid as a percentage of a $10,000 Investment |
|---|
Class Y | $107 | 1.00% |
|---|
| | |
|---|
|
| Expenses Paid, Amount |
$ 107
|
| Expense Ratio, Percent |
1.00%
|
| Factors Affecting Performance [Text Block] |
What affected the Fund’s performance during the last year?Top contributors to performance: The Fund’s best-performing sectors for the year on a relative basis were health care and real estate. On an individual stock basis, the Fund’s two best active-contributing stocks over the past year were Amphenol Corp., Class A (“Amphenol”) and CBRE Group, Inc., Class A. (“CBRE”). Amphenol provides electrical and fiber-optic connectors for use in a broad range of end markets. The company’s fastest growing end market by far has been IT datacom. This segment continues to benefit from robust connector demand in AI-related data center applications. CBRE, the provider of commercial real estate services, has seen a significant improvement in transaction volumes and leasing activity over the past year, especially in core office markets like New York City.
Top detractors from performance: The Fund’s worst-performing sectors were energy and industrials. The Fund’s two worst active-contributing stocks in the last two months were two benchmark names Palantir Technologies, Inc., Class A (“Palantir”) and AppLovin Corp., Class A (“AppLovin”), both of which are in the information technology sector. Palantir provides data analytics software that leverages AI. The company’s offering has gained significant traction in both government and commercial channels. While the Fund has been actively hedging its position over the last year, the Fund has been underweight the position mainly on valuation – Palantir consistently trades at more than 60 times forward revenues. AppLovin provides mobile gaming applications and related advertising platforms. The company’s AI-powered advertising offering has been a significant growth driver. Similar to Palantir, the Fund has been actively hedging its position in AppLovin over the last year, but has been underweight the position due to valuation.
|
| Performance Past Does Not Indicate Future [Text] |
The investment return and principal value will fluctuate so that an investor's shares, when redeemed, may be worth more or less than the original cost. Past performance is not a good predictor of the Fund's future performance.
|
| Line Graph [Table Text Block] |
| Victory Munder Mid-Cap Core Growth Fund Class Y - $2,166,651 | S&P 500® Index (regulatory broad based index) - $3,593,619 | Russell Midcap® Index - $2,567,804 | Russell Midcap® Growth Index - $3,140,761 |
|---|
6/15 | $1,000,000 | $1,000,000 | $1,000,000 | $1,000,000 |
|---|
6/16 | $922,946 | $1,039,928 | $1,005,579 | $978,598 |
|---|
6/17 | $1,084,344 | $1,226,034 | $1,171,337 | $1,145,417 |
|---|
6/18 | $1,218,642 | $1,402,264 | $1,315,714 | $1,357,568 |
|---|
6/19 | $1,273,052 | $1,548,344 | $1,418,672 | $1,546,808 |
|---|
6/20 | $1,237,862 | $1,664,549 | $1,386,895 | $1,731,051 |
|---|
6/21 | $1,832,007 | $2,343,588 | $2,077,551 | $2,488,756 |
|---|
6/22 | $1,527,211 | $2,094,797 | $1,718,214 | $1,752,722 |
|---|
6/23 | $1,705,009 | $2,505,253 | $1,974,648 | $2,158,159 |
|---|
6/24 | $1,908,172 | $3,120,445 | $2,228,892 | $2,483,009 |
|---|
6/25 | $2,166,651 | $3,593,619 | $2,567,804 | $3,140,761 |
|---|
|
| Average Annual Return [Table Text Block] |
| 1 Year | 5 Year | 10 Year |
|---|
Class Y | 13.55% | 11.85% | 8.04% |
|---|
S&P 500® Index | 15.16% | 16.64% | 13.65% |
|---|
Russell Midcap® Index | 15.21% | 13.11% | 9.89% |
|---|
Russell Midcap® Growth Index | 26.49% | 12.65% | 12.13% |
|---|
|
| No Deduction of Taxes [Text Block] |
The graph and table total returns do not reflect the deduction of taxes that a shareholder would pay on Fund distributions, or redemption of shares.
|
| AssetsNet |
$ 285,661,000
|
| Holdings Count | Holding |
94
|
| Advisory Fees Paid, Amount |
$ 2,240,000
|
| InvestmentCompanyPortfolioTurnover |
89.00%
|
| Additional Fund Statistics [Text Block] |
FUND STATISTICS($ amounts in 000s)(as of June 30, 2025)Net Assets | $285,661 |
|---|
Number of Holdings | 94 |
|---|
Investment Advisory Fees | $2,240 |
|---|
Portfolio Turnover | 89% |
|---|
|
| Holdings [Text Block] |
Top SectorsFootnote Reference* (% of Net Assets)Footnote Reference(as of June 30, 2025)Value | Value |
|---|
Utilities | 3.2% | Communication Services | 3.5% | Consumer Staples | 5.1% | Energy | 5.1% | Real Estate | 6.6% | Health Care | 10.0% | Consumer Discretionary | 12.2% | Industrials | 14.8% | Information Technology | 15.9% | Financials | 19.3% |
Top 10 HoldingsFootnote Reference* (% of Net Assets)Footnote Reference(as of June 30, 2025)Royal Caribbean Cruises Ltd. | 2.2% |
|---|
Quanta Services, Inc. | 2.2% |
|---|
Jabil, Inc. | 1.9% |
|---|
CBRE Group, Inc., Class A | 1.8% |
|---|
Interactive Brokers Group, Inc. | 1.8% |
|---|
Verisk Analytics, Inc. | 1.7% |
|---|
Federal Signal Corp. | 1.7% |
|---|
Cencora, Inc. | 1.7% |
|---|
HCA Healthcare, Inc. | 1.7% |
|---|
Cheniere Energy, Inc. | 1.7% |
|---|
|
| Material Fund Change [Text Block] |
|
| C000144995 |
|
| Shareholder Report [Line Items] |
|
| Fund Name |
Victory Trivalent International Fund - Core Equity
|
| Class Name |
Class A
|
| Trading Symbol |
MAICX
|
| Annual or Semi-Annual Statement [Text Block] |
Annual Shareholder Report
|
| Shareholder Report Annual or Semi-Annual |
annual shareholder report
|
| Additional Information [Text Block] |
You can find additional information about the Fund at advisor.vcm.com/literature/mutual-fund-prospectuses. You may also request more information by calling 800-539-3863 or visiting vcm.com/contact-us.
|
| Additional Information Phone Number |
800-539-3863
|
| Additional Information Website |
vcm.com
|
| Expenses [Text Block] |
What were the Fund's costs for the last year?(based on a hypothetical $10,000 investment) Class Name | Costs of a $10,000 Investment | Costs paid as a percentage of a $10,000 Investment |
|---|
Class A | $105 | 0.95% |
|---|
| | |
|---|
|
| Expenses Paid, Amount |
$ 105
|
| Expense Ratio, Percent |
0.95%
|
| Factors Affecting Performance [Text Block] |
What affected the Fund’s performance during the last year?International returns were supported by a decline in the U.S. dollar alongside weaker U.S. confidence and widespread tariff announcements. All six regions posted gains during the period. Ten of 11 sectors were up with industrials as the highest-performing sector. The health care sector trailed the broader MSCI ACWI ex USA Index (the “Index”). Top contributors to performance: Security selection was positive and yielded relative outperformances for the Fund. Four out of six regions outperformed the Index, and excess returns were generated in eight out of 11 sectors. The industrials sector exhibited outperformance relative to the Index. From a style perspective, exposure to value had the biggest impact on relative outperformance, with a moderate contribution from exposure to business momentum.
Top detractors from performance: Security selection was weakest in the consumer discretionary and health care sectors. Stylistically, exposure to quality was a minor headwind to relative performance.
|
| Performance Past Does Not Indicate Future [Text] |
The investment return and principal value will fluctuate so that an investor's shares, when redeemed, may be worth more or less than the original cost. Past performance is not a good predictor of the Fund's future performance.
|
| Line Graph [Table Text Block] |
| Victory Trivalent International Fund - Core Equity Class A @ NAV - $18,116 | Victory Trivalent International Fund - Core Equity Class A @ MOP - $17,069 | MSCI ACWI ex USA Index (regulatory broad based index) - $18,115 |
|---|
6/15 | $10,000 | $9,422 | $10,000 |
|---|
6/16 | $8,957 | $8,439 | $8,975 |
|---|
6/17 | $10,654 | $10,038 | $10,811 |
|---|
6/18 | $11,479 | $10,816 | $11,598 |
|---|
6/19 | $11,301 | $10,648 | $11,747 |
|---|
6/20 | $10,752 | $10,131 | $11,183 |
|---|
6/21 | $14,009 | $13,199 | $15,178 |
|---|
6/22 | $11,301 | $10,647 | $12,230 |
|---|
6/23 | $13,005 | $12,254 | $13,785 |
|---|
6/24 | $15,069 | $14,198 | $15,388 |
|---|
6/25 | $18,116 | $17,069 | $18,115 |
|---|
|
| Average Annual Return [Table Text Block] |
| 1 Year | 5 Year | 10 Year |
|---|
Class A @ NAV | 20.22%Footnote Reference | 11.00% | 6.12% |
|---|
Class A @ MOP | 13.31% | 9.68% | 5.49% |
|---|
MSCI ACWI ex USA Index | 17.72% | 10.13% | 6.12% |
|---|
|
| No Deduction of Taxes [Text Block] |
The graph and table total returns do not reflect the deduction of taxes that a shareholder would pay on Fund distributions, or redemption of shares.
|
| Previous Investment Adviser [Text Block] |
The maximum offering price (“MOP”) figures reflect a maximum sales charge of 5.75% for Class A. The Net Asset Value ("NAV") figures do not reflect sales charges.
|
| AssetsNet |
$ 238,689,000
|
| Holdings Count | Holding |
202
|
| Advisory Fees Paid, Amount |
$ 1,802,000
|
| InvestmentCompanyPortfolioTurnover |
44.00%
|
| Additional Fund Statistics [Text Block] |
FUND STATISTICS($ amounts in 000s)(as of June 30, 2025)Net Assets | $238,689 |
|---|
Number of Holdings | 202 |
|---|
Investment Advisory Fees | $1,802 |
|---|
Portfolio Turnover | 44% |
|---|
|
| Holdings [Text Block] |
Top SectorsFootnote Reference* (% of Net Assets)Footnote Reference(as of June 30, 2025)Value | Value |
|---|
Utilities | 3.6% | Energy | 4.7% | Communication Services | 5.8% | Materials | 5.9% | Consumer Staples | 6.6% | Health Care | 7.8% | Consumer Discretionary | 9.4% | Information Technology | 12.8% | Industrials | 14.4% | Financials | 23.7% |
Top 10 HoldingsFootnote Reference* (% of Net Assets)Footnote Reference(as of June 30, 2025)Taiwan Semiconductor Manufacturing Co. Ltd. | 3.0% |
|---|
Novartis AG, Registered Shares | 1.6% |
|---|
Siemens AG, Registered Shares | 1.5% |
|---|
Tencent Holdings Ltd. | 1.4% |
|---|
Alibaba Group Holding Ltd., Class W | 1.1% |
|---|
Banco Santander SA | 1.1% |
|---|
Deutsche Telekom AG | 1.1% |
|---|
NEC Corp. | 1.1% |
|---|
Schneider Electric SE | 1.0% |
|---|
Standard Chartered PLC | 1.0% |
|---|
|
| Material Fund Change [Text Block] |
|
| C000144997 |
|
| Shareholder Report [Line Items] |
|
| Fund Name |
Victory Trivalent International Fund - Core Equity
|
| Class Name |
Class I
|
| Trading Symbol |
MICIX
|
| Annual or Semi-Annual Statement [Text Block] |
Annual Shareholder Report
|
| Shareholder Report Annual or Semi-Annual |
annual shareholder report
|
| Additional Information [Text Block] |
You can find additional information about the Fund at advisor.vcm.com/literature/mutual-fund-prospectuses. You may also request more information by calling 800-539-3863 or visiting vcm.com/contact-us.
|
| Additional Information Phone Number |
800-539-3863
|
| Additional Information Website |
vcm.com
|
| Expenses [Text Block] |
What were the Fund's costs for the last year?(based on a hypothetical $10,000 investment) Class Name | Costs of a $10,000 Investment | Costs paid as a percentage of a $10,000 Investment |
|---|
Class I | $66 | 0.60% |
|---|
| | |
|---|
|
| Expenses Paid, Amount |
$ 66
|
| Expense Ratio, Percent |
0.60%
|
| Factors Affecting Performance [Text Block] |
What affected the Fund’s performance during the last year?International returns were supported by a decline in the U.S. dollar alongside weaker U.S. confidence and widespread tariff announcements. All six regions posted gains during the period. Ten of 11 sectors were up with industrials as the highest-performing sector. The health care sector trailed the broader MSCI ACWI ex USA Index (the “Index”). Top contributors to performance: Security selection was positive and yielded relative outperformances for the Fund. Four out of six regions outperformed the Index, and excess returns were generated in eight out of 11 sectors. The industrials sector exhibited outperformance relative to the Index. From a style perspective, exposure to value had the biggest impact on relative outperformance, with a moderate contribution from exposure to business momentum.
Top detractors from performance: Security selection was weakest in the consumer discretionary and health care sectors. Stylistically, exposure to quality was a minor headwind to relative performance.
|
| Performance Past Does Not Indicate Future [Text] |
The investment return and principal value will fluctuate so that an investor's shares, when redeemed, may be worth more or less than the original cost. Past performance is not a good predictor of the Fund's future performance.
|
| Line Graph [Table Text Block] |
| Victory Trivalent International Fund - Core Equity Class I - $3,762,101 | MSCI ACWI ex USA Index (regulatory broad based index) - $3,622,969 |
|---|
6/15 | $2,000,000 | $2,000,000 |
|---|
6/16 | $1,801,647 | $1,795,085 |
|---|
6/17 | $2,149,369 | $2,162,187 |
|---|
6/18 | $2,322,857 | $2,319,559 |
|---|
6/19 | $2,298,562 | $2,349,448 |
|---|
6/20 | $2,195,079 | $2,236,610 |
|---|
6/21 | $2,867,851 | $3,035,507 |
|---|
6/22 | $2,321,974 | $2,446,038 |
|---|
6/23 | $2,679,601 | $2,757,071 |
|---|
6/24 | $3,115,603 | $3,077,533 |
|---|
6/25 | $3,762,101 | $3,622,969 |
|---|
|
| Average Annual Return [Table Text Block] |
| 1 Year | 5 Year | 10 Year |
|---|
Class I | 20.75%Footnote Reference | 11.38% | 6.52% |
|---|
MSCI ACWI ex USA Index | 17.72% | 10.13% | 6.12% |
|---|
|
| No Deduction of Taxes [Text Block] |
The graph and table total returns do not reflect the deduction of taxes that a shareholder would pay on Fund distributions, or redemption of shares.
|
| AssetsNet |
$ 238,689,000
|
| Holdings Count | Holding |
202
|
| Advisory Fees Paid, Amount |
$ 1,802,000
|
| InvestmentCompanyPortfolioTurnover |
44.00%
|
| Additional Fund Statistics [Text Block] |
FUND STATISTICS($ amounts in 000s)(as of June 30, 2025)Net Assets | $238,689 |
|---|
Number of Holdings | 202 |
|---|
Investment Advisory Fees | $1,802 |
|---|
Portfolio Turnover | 44% |
|---|
|
| Holdings [Text Block] |
Top SectorsFootnote Reference* (% of Net Assets)Footnote Reference(as of June 30, 2025)Value | Value |
|---|
Utilities | 3.6% | Energy | 4.7% | Communication Services | 5.8% | Materials | 5.9% | Consumer Staples | 6.6% | Health Care | 7.8% | Consumer Discretionary | 9.4% | Information Technology | 12.8% | Industrials | 14.4% | Financials | 23.7% |
Top 10 HoldingsFootnote Reference* (% of Net Assets)Footnote Reference(as of June 30, 2025)Taiwan Semiconductor Manufacturing Co. Ltd. | 3.0% |
|---|
Novartis AG, Registered Shares | 1.6% |
|---|
Siemens AG, Registered Shares | 1.5% |
|---|
Tencent Holdings Ltd. | 1.4% |
|---|
Alibaba Group Holding Ltd., Class W | 1.1% |
|---|
Banco Santander SA | 1.1% |
|---|
Deutsche Telekom AG | 1.1% |
|---|
NEC Corp. | 1.1% |
|---|
Schneider Electric SE | 1.0% |
|---|
Standard Chartered PLC | 1.0% |
|---|
|
| Material Fund Change [Text Block] |
|
| C000155527 |
|
| Shareholder Report [Line Items] |
|
| Fund Name |
Victory Trivalent International Fund - Core Equity
|
| Class Name |
Class R6
|
| Trading Symbol |
MAIRX
|
| Annual or Semi-Annual Statement [Text Block] |
Annual Shareholder Report
|
| Shareholder Report Annual or Semi-Annual |
annual shareholder report
|
| Additional Information [Text Block] |
You can find additional information about the Fund at advisor.vcm.com/literature/mutual-fund-prospectuses. You may also request more information by calling 800-539-3863 or visiting vcm.com/contact-us.
|
| Additional Information Phone Number |
800-539-3863
|
| Additional Information Website |
vcm.com
|
| Expenses [Text Block] |
What were the Fund's costs for the last year?(based on a hypothetical $10,000 investment) Class Name | Costs of a $10,000 Investment | Costs paid as a percentage of a $10,000 Investment |
|---|
Class R6 | $61 | 0.55% |
|---|
| | |
|---|
|
| Expenses Paid, Amount |
$ 61
|
| Expense Ratio, Percent |
0.55%
|
| Factors Affecting Performance [Text Block] |
What affected the Fund’s performance during the last year?International returns were supported by a decline in the U.S. dollar alongside weaker U.S. confidence and widespread tariff announcements. All six regions posted gains during the period. Ten of 11 sectors were up with industrials as the highest-performing sector. The health care sector trailed the broader MSCI ACWI ex USA Index (the “Index”). Top contributors to performance: Security selection was positive and yielded relative outperformances for the Fund. Four out of six regions outperformed the Index, and excess returns were generated in eight out of 11 sectors. The industrials sector exhibited outperformance relative to the Index. From a style perspective, exposure to value had the biggest impact on relative outperformance, with a moderate contribution from exposure to business momentum.
Top detractors from performance: Security selection was weakest in the consumer discretionary and health care sectors. Stylistically, exposure to quality was a minor headwind to relative performance.
|
| Performance Past Does Not Indicate Future [Text] |
The investment return and principal value will fluctuate so that an investor's shares, when redeemed, may be worth more or less than the original cost. Past performance is not a good predictor of the Fund's future performance.
|
| Line Graph [Table Text Block] |
| Victory Trivalent International Fund - Core Equity Class R6 - $18,890 | MSCI ACWI ex USA Index (regulatory broad based index) - $18,115 |
|---|
6/15 | $10,000 | $10,000 |
|---|
6/16 | $9,014 | $8,975 |
|---|
6/17 | $10,761 | $10,811 |
|---|
6/18 | $11,637 | $11,598 |
|---|
6/19 | $11,507 | $11,747 |
|---|
6/20 | $11,008 | $11,183 |
|---|
6/21 | $14,373 | $15,178 |
|---|
6/22 | $11,653 | $12,230 |
|---|
6/23 | $13,459 | $13,785 |
|---|
6/24 | $15,641 | $15,388 |
|---|
6/25 | $18,890 | $18,115 |
|---|
|
| Average Annual Return [Table Text Block] |
| 1 Year | 5 Year | 10 Year |
|---|
Class R6 | 20.77%Footnote Reference | 11.41% | 6.57% |
|---|
MSCI ACWI ex USA Index | 17.72% | 10.13% | 6.12% |
|---|
|
| No Deduction of Taxes [Text Block] |
The graph and table total returns do not reflect the deduction of taxes that a shareholder would pay on Fund distributions, or redemption of shares.
|
| AssetsNet |
$ 238,689,000
|
| Holdings Count | Holding |
202
|
| Advisory Fees Paid, Amount |
$ 1,802,000
|
| InvestmentCompanyPortfolioTurnover |
44.00%
|
| Additional Fund Statistics [Text Block] |
FUND STATISTICS($ amounts in 000s)(as of June 30, 2025)Net Assets | $238,689 |
|---|
Number of Holdings | 202 |
|---|
Investment Advisory Fees | $1,802 |
|---|
Portfolio Turnover | 44% |
|---|
|
| Holdings [Text Block] |
Top SectorsFootnote Reference* (% of Net Assets)Footnote Reference(as of June 30, 2025)Value | Value |
|---|
Utilities | 3.6% | Energy | 4.7% | Communication Services | 5.8% | Materials | 5.9% | Consumer Staples | 6.6% | Health Care | 7.8% | Consumer Discretionary | 9.4% | Information Technology | 12.8% | Industrials | 14.4% | Financials | 23.7% |
Top 10 HoldingsFootnote Reference* (% of Net Assets)Footnote Reference(as of June 30, 2025)Taiwan Semiconductor Manufacturing Co. Ltd. | 3.0% |
|---|
Novartis AG, Registered Shares | 1.6% |
|---|
Siemens AG, Registered Shares | 1.5% |
|---|
Tencent Holdings Ltd. | 1.4% |
|---|
Alibaba Group Holding Ltd., Class W | 1.1% |
|---|
Banco Santander SA | 1.1% |
|---|
Deutsche Telekom AG | 1.1% |
|---|
NEC Corp. | 1.1% |
|---|
Schneider Electric SE | 1.0% |
|---|
Standard Chartered PLC | 1.0% |
|---|
|
| Material Fund Change [Text Block] |
|
| C000144998 |
|
| Shareholder Report [Line Items] |
|
| Fund Name |
Victory Trivalent International Fund - Core Equity
|
| Class Name |
Class Y
|
| Trading Symbol |
MICYX
|
| Annual or Semi-Annual Statement [Text Block] |
Annual Shareholder Report
|
| Shareholder Report Annual or Semi-Annual |
annual shareholder report
|
| Additional Information [Text Block] |
You can find additional information about the Fund at advisor.vcm.com/literature/mutual-fund-prospectuses. You may also request more information by calling 800-539-3863 or visiting vcm.com/contact-us.
|
| Additional Information Phone Number |
800-539-3863
|
| Additional Information Website |
vcm.com
|
| Expenses [Text Block] |
What were the Fund's costs for the last year?(based on a hypothetical $10,000 investment) Class Name | Costs of a $10,000 Investment | Costs paid as a percentage of a $10,000 Investment |
|---|
Class Y | $77 | 0.70% |
|---|
| | |
|---|
|
| Expenses Paid, Amount |
$ 77
|
| Expense Ratio, Percent |
0.70%
|
| Factors Affecting Performance [Text Block] |
What affected the Fund’s performance during the last year?International returns were supported by a decline in the U.S. dollar alongside weaker U.S. confidence and widespread tariff announcements. All six regions posted gains during the period. Ten of 11 sectors were up with industrials as the highest-performing sector. The health care sector trailed the broader MSCI ACWI ex USA Index (the “Index”). Top contributors to performance: Security selection was positive and yielded relative outperformances for the Fund. Four out of six regions outperformed the Index, and excess returns were generated in eight out of 11 sectors. The industrials sector exhibited outperformance relative to the Index. From a style perspective, exposure to value had the biggest impact on relative outperformance, with a moderate contribution from exposure to business momentum.
Top detractors from performance: Security selection was weakest in the consumer discretionary and health care sectors. Stylistically, exposure to quality was a minor headwind to relative performance.
|
| Performance Past Does Not Indicate Future [Text] |
The investment return and principal value will fluctuate so that an investor's shares, when redeemed, may be worth more or less than the original cost. Past performance is not a good predictor of the Fund's future performance.
|
| Line Graph [Table Text Block] |
| Victory Trivalent International Fund - Core Equity Class Y - $1,858,162 | MSCI ACWI ex USA Index (regulatory broad based index) - $1,811,484 |
|---|
6/15 | $1,000,000 | $1,000,000 |
|---|
6/16 | $898,121 | $897,543 |
|---|
6/17 | $1,071,294 | $1,081,093 |
|---|
6/18 | $1,157,077 | $1,159,779 |
|---|
6/19 | $1,141,621 | $1,174,724 |
|---|
6/20 | $1,089,123 | $1,118,305 |
|---|
6/21 | $1,422,646 | $1,517,753 |
|---|
6/22 | $1,151,805 | $1,223,019 |
|---|
6/23 | $1,327,150 | $1,378,536 |
|---|
6/24 | $1,541,608 | $1,538,766 |
|---|
6/25 | $1,858,162 | $1,811,484 |
|---|
|
| Average Annual Return [Table Text Block] |
| 1 Year | 5 Year | 10 Year |
|---|
Class Y | 20.53%Footnote Reference | 11.28% | 6.39% |
|---|
MSCI ACWI ex USA Index | 17.72% | 10.13% | 6.12% |
|---|
|
| No Deduction of Taxes [Text Block] |
The graph and table total returns do not reflect the deduction of taxes that a shareholder would pay on Fund distributions, or redemption of shares.
|
| AssetsNet |
$ 238,689,000
|
| Holdings Count | Holding |
202
|
| Advisory Fees Paid, Amount |
$ 1,802,000
|
| InvestmentCompanyPortfolioTurnover |
44.00%
|
| Additional Fund Statistics [Text Block] |
FUND STATISTICS($ amounts in 000s)(as of June 30, 2025)Net Assets | $238,689 |
|---|
Number of Holdings | 202 |
|---|
Investment Advisory Fees | $1,802 |
|---|
Portfolio Turnover | 44% |
|---|
|
| Holdings [Text Block] |
Top SectorsFootnote Reference* (% of Net Assets)Footnote Reference(as of June 30, 2025)Value | Value |
|---|
Utilities | 3.6% | Energy | 4.7% | Communication Services | 5.8% | Materials | 5.9% | Consumer Staples | 6.6% | Health Care | 7.8% | Consumer Discretionary | 9.4% | Information Technology | 12.8% | Industrials | 14.4% | Financials | 23.7% |
Top 10 HoldingsFootnote Reference* (% of Net Assets)Footnote Reference(as of June 30, 2025)Taiwan Semiconductor Manufacturing Co. Ltd. | 3.0% |
|---|
Novartis AG, Registered Shares | 1.6% |
|---|
Siemens AG, Registered Shares | 1.5% |
|---|
Tencent Holdings Ltd. | 1.4% |
|---|
Alibaba Group Holding Ltd., Class W | 1.1% |
|---|
Banco Santander SA | 1.1% |
|---|
Deutsche Telekom AG | 1.1% |
|---|
NEC Corp. | 1.1% |
|---|
Schneider Electric SE | 1.0% |
|---|
Standard Chartered PLC | 1.0% |
|---|
|
| Material Fund Change [Text Block] |
|
| C000144999 |
|
| Shareholder Report [Line Items] |
|
| Fund Name |
Victory Trivalent International Small-Cap Fund
|
| Class Name |
Class A
|
| Trading Symbol |
MISAX
|
| Annual or Semi-Annual Statement [Text Block] |
Annual Shareholder Report
|
| Shareholder Report Annual or Semi-Annual |
annual shareholder report
|
| Additional Information [Text Block] |
You can find additional information about the Fund at advisor.vcm.com/literature/mutual-fund-prospectuses. You may also request more information by calling 800-539-3863 or visiting vcm.com/contact-us.
|
| Additional Information Phone Number |
800-539-3863
|
| Additional Information Website |
vcm.com
|
| Expenses [Text Block] |
What were the Fund's costs for the last year?(based on a hypothetical $10,000 investment) Class Name | Costs of a $10,000 Investment | Costs paid as a percentage of a $10,000 Investment |
|---|
Class A | $153 | 1.35% |
|---|
| | |
|---|
|
| Expenses Paid, Amount |
$ 153
|
| Expense Ratio, Percent |
1.35%
|
| Factors Affecting Performance [Text Block] |
What affected the Fund’s performance during the last year?International returns were supported by a decline in the U.S. dollar alongside weaker U.S. confidence and widespread tariff announcements. All five regions were up during the period and all 11 economic sectors posted gains in the S&P® Developed Ex-U.S. SmallCap Index (the “Index”). Financials were the strongest performing sector while energy stocks detracted from performance relative to the broader Index. Top contributors to performance: Overall security selection was strongest and accounted for the Fund’s relative outperformance of the Index. Excess returns were generated in four of the five regions and eight of 11 sectors. Outperformance was generated within the industrials, information technology, and healthcare sectors. From a style perspective, the Fund’s overall exposure to value, business momentum and quality factors all contributed positively to its relative performance.
Top detractors from performance: Performance was weakest in the UK region and consumer staples sector. At the sector level, relative underperformance was centered in consumer staples and utilities.
|
| Performance Past Does Not Indicate Future [Text] |
The investment return and principal value will fluctuate so that an investor's shares, when redeemed, may be worth more or less than the original cost. Past performance is not a good predictor of the Fund's future performance.
|
| Line Graph [Table Text Block] |
| Victory Trivalent International Small-Cap Fund Class A @ NAV - $19,592 | Victory Trivalent International Small-Cap Fund Class A @ MOP - $18,470 | MSCI All Country World Index (regulatory broad based index) - $25,923 | S&P Developed Ex-U.S. SmallCap Index - $17,744 |
|---|
6/15 | $10,000 | $9,428 | $10,000 | $10,000 |
|---|
6/16 | $9,187 | $8,661 | $9,627 | $9,581 |
|---|
6/17 | $11,211 | $10,569 | $11,435 | $11,626 |
|---|
6/18 | $12,796 | $12,064 | $12,662 | $12,904 |
|---|
6/19 | $11,885 | $11,205 | $13,389 | $12,110 |
|---|
6/20 | $11,903 | $11,222 | $13,672 | $11,608 |
|---|
6/21 | $16,737 | $15,779 | $19,040 | $16,672 |
|---|
6/22 | $12,515 | $11,799 | $16,041 | $12,460 |
|---|
6/23 | $14,155 | $13,345 | $18,693 | $13,768 |
|---|
6/24 | $15,488 | $14,602 | $22,315 | $14,813 |
|---|
6/25 | $19,592 | $18,470 | $25,923 | $17,744 |
|---|
|
| Average Annual Return [Table Text Block] |
| 1 Year | 5 Year | 10 Year |
|---|
Class A @ NAV | 26.56%Footnote Reference | 10.48% | 6.96% |
|---|
Class A @ MOP | 19.20% | 9.18% | 6.33% |
|---|
MSCI All Country World Index | 16.17% | 13.65% | 9.99% |
|---|
S&P Developed Ex-U.S. SmallCap Index | 19.79% | 8.86% | 5.90% |
|---|
|
| No Deduction of Taxes [Text Block] |
The graph and table total returns do not reflect the deduction of taxes that a shareholder would pay on Fund distributions, or redemption of shares.
|
| Previous Investment Adviser [Text Block] |
The maximum offering price (“MOP”) figures reflect a maximum sales charge of 5.75% for Class A. The Net Asset Value ("NAV") figures do not reflect sales charges.
|
| AssetsNet |
$ 3,803,556,000
|
| Holdings Count | Holding |
224
|
| Advisory Fees Paid, Amount |
$ 32,102,000
|
| InvestmentCompanyPortfolioTurnover |
49.00%
|
| Additional Fund Statistics [Text Block] |
FUND STATISTICS($ amounts in 000s)(as of June 30, 2025)Net Assets | $3,803,556 |
|---|
Number of Holdings | 224 |
|---|
Investment Advisory Fees | $32,102 |
|---|
Portfolio Turnover | 49% |
|---|
|
| Holdings [Text Block] |
Top SectorsFootnote Reference* (% of Net Assets)Footnote Reference(as of June 30, 2025)Value | Value |
|---|
Energy | 3.4% | Communication Services | 4.0% | Consumer Staples | 4.0% | Health Care | 7.5% | Real Estate | 7.9% | Materials | 9.4% | Information Technology | 11.0% | Consumer Discretionary | 12.3% | Financials | 13.0% | Industrials | 23.5% |
Top 10 HoldingsFootnote Reference* (% of Net Assets)Footnote Reference(as of June 30, 2025)Celestica, Inc. | 1.7% |
|---|
Swissquote Group Holding SA, Registered Shares | 1.2% |
|---|
Bankinter SA | 1.0% |
|---|
Dundee Precious Metals, Inc. | 1.0% |
|---|
Sanwa Holdings Corp. | 1.0% |
|---|
Coca-Cola HBC AG, Class DI | 0.9% |
|---|
Indra Sistemas SA | 0.8% |
|---|
SPIE SA | 0.8% |
|---|
Buzzi SpA | 0.8% |
|---|
Euronext NV | 0.8% |
|---|
|
| Material Fund Change [Text Block] |
|
| C000145000 |
|
| Shareholder Report [Line Items] |
|
| Fund Name |
Victory Trivalent International Small-Cap Fund
|
| Class Name |
Class C
|
| Trading Symbol |
MCISX
|
| Annual or Semi-Annual Statement [Text Block] |
Annual Shareholder Report
|
| Shareholder Report Annual or Semi-Annual |
annual shareholder report
|
| Additional Information [Text Block] |
You can find additional information about the Fund at advisor.vcm.com/literature/mutual-fund-prospectuses. You may also request more information by calling 800-539-3863 or visiting vcm.com/contact-us.
|
| Additional Information Phone Number |
800-539-3863
|
| Additional Information Website |
vcm.com
|
| Expenses [Text Block] |
What were the Fund's costs for the last year?(based on a hypothetical $10,000 investment) Class Name | Costs of a $10,000 Investment | Costs paid as a percentage of a $10,000 Investment |
|---|
Class C | $237 | 2.10% |
|---|
| | |
|---|
|
| Expenses Paid, Amount |
$ 237
|
| Expense Ratio, Percent |
2.10%
|
| Factors Affecting Performance [Text Block] |
What affected the Fund’s performance during the last year?International returns were supported by a decline in the U.S. dollar alongside weaker U.S. confidence and widespread tariff announcements. All five regions were up during the period and all 11 economic sectors posted gains in the S&P® Developed Ex-U.S. SmallCap Index (the “Index”). Financials were the strongest performing sector while energy stocks detracted from performance relative to the broader Index. Top contributors to performance: Overall security selection was strongest and accounted for the Fund’s relative outperformance of the Index. Excess returns were generated in four of the five regions and eight of 11 sectors. Outperformance was generated within the industrials, information technology, and healthcare sectors. From a style perspective, the Fund’s overall exposure to value, business momentum and quality factors all contributed positively to its relative performance.
Top detractors from performance: Performance was weakest in the UK region and consumer staples sector. At the sector level, relative underperformance was centered in consumer staples and utilities.
|
| Performance Past Does Not Indicate Future [Text] |
The investment return and principal value will fluctuate so that an investor's shares, when redeemed, may be worth more or less than the original cost. Past performance is not a good predictor of the Fund's future performance.
|
| Line Graph [Table Text Block] |
| Victory Trivalent International Small-Cap Fund Class C @ NAV - $18,442 | Victory Trivalent International Small-Cap Fund Class C @ CDSC - $18,442 | MSCI All Country World Index (regulatory broad based index) - $25,923 | S&P Developed Ex-U.S. SmallCap Index - $17,744 |
|---|
6/15 | $10,000 | $10,000 | $10,000 | $10,000 |
|---|
6/16 | $9,113 | $9,113 | $9,627 | $9,581 |
|---|
6/17 | $11,040 | $11,040 | $11,435 | $11,626 |
|---|
6/18 | $12,505 | $12,505 | $12,662 | $12,904 |
|---|
6/19 | $11,533 | $11,533 | $13,389 | $12,110 |
|---|
6/20 | $11,458 | $11,458 | $13,672 | $11,608 |
|---|
6/21 | $15,991 | $15,991 | $19,040 | $16,672 |
|---|
6/22 | $11,859 | $11,859 | $16,041 | $12,460 |
|---|
6/23 | $13,325 | $13,325 | $18,693 | $13,768 |
|---|
6/24 | $14,579 | $14,579 | $22,315 | $14,813 |
|---|
6/25 | $18,442 | $18,442 | $25,923 | $17,744 |
|---|
|
| Average Annual Return [Table Text Block] |
| 1 Year | 5 Year | 10 Year |
|---|
Class C @ NAV | 25.63%Footnote Reference | 9.64% | 6.31% |
|---|
Class C @ CDSC | 24.56% | 9.64% | 6.31% |
|---|
MSCI All Country World Index | 16.17% | 13.65% | 9.99% |
|---|
S&P Developed Ex-U.S. SmallCap Index | 19.79% | 8.86% | 5.90% |
|---|
|
| No Deduction of Taxes [Text Block] |
The graph and table total returns do not reflect the deduction of taxes that a shareholder would pay on Fund distributions, or redemption of shares.
|
| Previous Investment Adviser [Text Block] |
Class C is not subject to an initial sales charge, but is subject to Contingent Deferred Sales Charge (“CDSC”) of 1.00% on shares redeemed within one year of purchase. The Net Asset Value ("NAV") figures do not reflect sales charges.
|
| AssetsNet |
$ 3,803,556,000
|
| Holdings Count | Holding |
224
|
| Advisory Fees Paid, Amount |
$ 32,102,000
|
| InvestmentCompanyPortfolioTurnover |
49.00%
|
| Additional Fund Statistics [Text Block] |
FUND STATISTICS($ amounts in 000s)(as of June 30, 2025)Net Assets | $3,803,556 |
|---|
Number of Holdings | 224 |
|---|
Investment Advisory Fees | $32,102 |
|---|
Portfolio Turnover | 49% |
|---|
|
| Holdings [Text Block] |
Top SectorsFootnote Reference* (% of Net Assets)Footnote Reference(as of June 30, 2025)Value | Value |
|---|
Energy | 3.4% | Communication Services | 4.0% | Consumer Staples | 4.0% | Health Care | 7.5% | Real Estate | 7.9% | Materials | 9.4% | Information Technology | 11.0% | Consumer Discretionary | 12.3% | Financials | 13.0% | Industrials | 23.5% |
Top 10 HoldingsFootnote Reference* (% of Net Assets)Footnote Reference(as of June 30, 2025)Celestica, Inc. | 1.7% |
|---|
Swissquote Group Holding SA, Registered Shares | 1.2% |
|---|
Bankinter SA | 1.0% |
|---|
Dundee Precious Metals, Inc. | 1.0% |
|---|
Sanwa Holdings Corp. | 1.0% |
|---|
Coca-Cola HBC AG, Class DI | 0.9% |
|---|
Indra Sistemas SA | 0.8% |
|---|
SPIE SA | 0.8% |
|---|
Buzzi SpA | 0.8% |
|---|
Euronext NV | 0.8% |
|---|
|
| Material Fund Change [Text Block] |
|
| C000145001 |
|
| Shareholder Report [Line Items] |
|
| Fund Name |
Victory Trivalent International Small-Cap Fund
|
| Class Name |
Class I
|
| Trading Symbol |
MISIX
|
| Annual or Semi-Annual Statement [Text Block] |
Annual Shareholder Report
|
| Shareholder Report Annual or Semi-Annual |
annual shareholder report
|
| Additional Information [Text Block] |
You can find additional information about the Fund at advisor.vcm.com/literature/mutual-fund-prospectuses. You may also request more information by calling 800-539-3863 or visiting vcm.com/contact-us.
|
| Additional Information Phone Number |
800-539-3863
|
| Additional Information Website |
vcm.com
|
| Expenses [Text Block] |
What were the Fund's costs for the last year?(based on a hypothetical $10,000 investment) Class Name | Costs of a $10,000 Investment | Costs paid as a percentage of a $10,000 Investment |
|---|
Class I | $109 | 0.96% |
|---|
| | |
|---|
|
| Expenses Paid, Amount |
$ 109
|
| Expense Ratio, Percent |
0.96%
|
| Factors Affecting Performance [Text Block] |
What affected the Fund’s performance during the last year?International returns were supported by a decline in the U.S. dollar alongside weaker U.S. confidence and widespread tariff announcements. All five regions were up during the period and all 11 economic sectors posted gains in the S&P® Developed Ex-U.S. SmallCap Index (the “Index”). Financials were the strongest performing sector while energy stocks detracted from performance relative to the broader Index. Top contributors to performance: Overall security selection was strongest and accounted for the Fund’s relative outperformance of the Index. Excess returns were generated in four of the five regions and eight of 11 sectors. Outperformance was generated within the industrials, information technology, and healthcare sectors. From a style perspective, the Fund’s overall exposure to value, business momentum and quality factors all contributed positively to its relative performance.
Top detractors from performance: Performance was weakest in the UK region and consumer staples sector. At the sector level, relative underperformance was centered in consumer staples and utilities.
|
| Performance Past Does Not Indicate Future [Text] |
The investment return and principal value will fluctuate so that an investor's shares, when redeemed, may be worth more or less than the original cost. Past performance is not a good predictor of the Fund's future performance.
|
| Line Graph [Table Text Block] |
| Victory Trivalent International Small-Cap Fund Class I - $4,077,835 | MSCI All Country World Index (regulatory broad based index) - $5,184,523 | S&P Developed Ex-U.S. SmallCap Index - $3,548,838 |
|---|
6/15 | $2,000,000 | $2,000,000 | $2,000,000 |
|---|
6/16 | $1,845,183 | $1,925,406 | $1,916,122 |
|---|
6/17 | $2,259,497 | $2,287,013 | $2,325,264 |
|---|
6/18 | $2,589,494 | $2,532,390 | $2,580,855 |
|---|
6/19 | $2,416,167 | $2,677,859 | $2,421,991 |
|---|
6/20 | $2,429,152 | $2,734,373 | $2,321,685 |
|---|
6/21 | $3,429,018 | $3,808,038 | $3,334,400 |
|---|
6/22 | $2,573,301 | $3,208,286 | $2,491,989 |
|---|
6/23 | $2,923,810 | $3,738,609 | $2,753,545 |
|---|
6/24 | $3,210,415 | $4,462,961 | $2,962,507 |
|---|
6/25 | $4,077,835 | $5,184,523 | $3,548,838 |
|---|
|
| Average Annual Return [Table Text Block] |
| 1 Year | 5 Year | 10 Year |
|---|
Class I | 27.02%Footnote Reference | 10.92% | 7.38% |
|---|
MSCI All Country World Index | 16.17% | 13.65% | 9.99% |
|---|
S&P Developed Ex-U.S. SmallCap Index | 19.79% | 8.86% | 5.90% |
|---|
|
| No Deduction of Taxes [Text Block] |
The graph and table total returns do not reflect the deduction of taxes that a shareholder would pay on Fund distributions, or redemption of shares.
|
| AssetsNet |
$ 3,803,556,000
|
| Holdings Count | Holding |
224
|
| Advisory Fees Paid, Amount |
$ 32,102,000
|
| InvestmentCompanyPortfolioTurnover |
49.00%
|
| Additional Fund Statistics [Text Block] |
FUND STATISTICS($ amounts in 000s)(as of June 30, 2025)Net Assets | $3,803,556 |
|---|
Number of Holdings | 224 |
|---|
Investment Advisory Fees | $32,102 |
|---|
Portfolio Turnover | 49% |
|---|
|
| Holdings [Text Block] |
Top SectorsFootnote Reference* (% of Net Assets)Footnote Reference(as of June 30, 2025)Value | Value |
|---|
Energy | 3.4% | Communication Services | 4.0% | Consumer Staples | 4.0% | Health Care | 7.5% | Real Estate | 7.9% | Materials | 9.4% | Information Technology | 11.0% | Consumer Discretionary | 12.3% | Financials | 13.0% | Industrials | 23.5% |
Top 10 HoldingsFootnote Reference* (% of Net Assets)Footnote Reference(as of June 30, 2025)Celestica, Inc. | 1.7% |
|---|
Swissquote Group Holding SA, Registered Shares | 1.2% |
|---|
Bankinter SA | 1.0% |
|---|
Dundee Precious Metals, Inc. | 1.0% |
|---|
Sanwa Holdings Corp. | 1.0% |
|---|
Coca-Cola HBC AG, Class DI | 0.9% |
|---|
Indra Sistemas SA | 0.8% |
|---|
SPIE SA | 0.8% |
|---|
Buzzi SpA | 0.8% |
|---|
Euronext NV | 0.8% |
|---|
|
| Material Fund Change [Text Block] |
|
| C000145002 |
|
| Shareholder Report [Line Items] |
|
| Fund Name |
Victory Trivalent International Small-Cap Fund
|
| Class Name |
Class R6
|
| Trading Symbol |
MSSIX
|
| Annual or Semi-Annual Statement [Text Block] |
Annual Shareholder Report
|
| Shareholder Report Annual or Semi-Annual |
annual shareholder report
|
| Additional Information [Text Block] |
You can find additional information about the Fund at advisor.vcm.com/literature/mutual-fund-prospectuses. You may also request more information by calling 800-539-3863 or visiting vcm.com/contact-us.
|
| Additional Information Phone Number |
800-539-3863
|
| Additional Information Website |
vcm.com
|
| Expenses [Text Block] |
What were the Fund's costs for the last year?(based on a hypothetical $10,000 investment) Class Name | Costs of a $10,000 Investment | Costs paid as a percentage of a $10,000 Investment |
|---|
Class R6 | $116 | 1.02% |
|---|
| | |
|---|
|
| Expenses Paid, Amount |
$ 116
|
| Expense Ratio, Percent |
1.02%
|
| Factors Affecting Performance [Text Block] |
What affected the Fund’s performance during the last year?International returns were supported by a decline in the U.S. dollar alongside weaker U.S. confidence and widespread tariff announcements. All five regions were up during the period and all 11 economic sectors posted gains in the S&P® Developed Ex-U.S. SmallCap Index (the “Index”). Financials were the strongest performing sector while energy stocks detracted from performance relative to the broader Index. Top contributors to performance: Overall security selection was strongest and accounted for the Fund’s relative outperformance of the Index. Excess returns were generated in four of the five regions and eight of 11 sectors. Outperformance was generated within the industrials, information technology, and healthcare sectors. From a style perspective, the Fund’s overall exposure to value, business momentum and quality factors all contributed positively to its relative performance.
Top detractors from performance: Performance was weakest in the UK region and consumer staples sector. At the sector level, relative underperformance was centered in consumer staples and utilities.
|
| Performance Past Does Not Indicate Future [Text] |
The investment return and principal value will fluctuate so that an investor's shares, when redeemed, may be worth more or less than the original cost. Past performance is not a good predictor of the Fund's future performance.
|
| Line Graph [Table Text Block] |
| Victory Trivalent International Small-Cap Fund Class R6 - $20,169 | MSCI All Country World Index (regulatory broad based index) - $25,923 | S&P Developed Ex-U.S. SmallCap Index - $17,744 |
|---|
6/15 | $10,000 | $10,000 | $10,000 |
|---|
6/16 | $9,210 | $9,627 | $9,581 |
|---|
6/17 | $11,262 | $11,435 | $11,626 |
|---|
6/18 | $12,894 | $12,662 | $12,904 |
|---|
6/19 | $12,010 | $13,389 | $12,110 |
|---|
6/20 | $12,053 | $13,672 | $11,608 |
|---|
6/21 | $17,011 | $19,040 | $16,672 |
|---|
6/22 | $12,749 | $16,041 | $12,460 |
|---|
6/23 | $14,476 | $18,693 | $13,768 |
|---|
6/24 | $15,889 | $22,315 | $14,813 |
|---|
6/25 | $20,169 | $25,923 | $17,744 |
|---|
|
| Average Annual Return [Table Text Block] |
| 1 Year | 5 Year | 10 Year |
|---|
Class R6 | 26.94%Footnote Reference | 10.85% | 7.27% |
|---|
MSCI All Country World Index | 16.17% | 13.65% | 9.99% |
|---|
S&P Developed Ex-U.S. SmallCap Index | 19.79% | 8.86% | 5.90% |
|---|
|
| No Deduction of Taxes [Text Block] |
The graph and table total returns do not reflect the deduction of taxes that a shareholder would pay on Fund distributions, or redemption of shares.
|
| AssetsNet |
$ 3,803,556,000
|
| Holdings Count | Holding |
224
|
| Advisory Fees Paid, Amount |
$ 32,102,000
|
| InvestmentCompanyPortfolioTurnover |
49.00%
|
| Additional Fund Statistics [Text Block] |
FUND STATISTICS($ amounts in 000s)(as of June 30, 2025)Net Assets | $3,803,556 |
|---|
Number of Holdings | 224 |
|---|
Investment Advisory Fees | $32,102 |
|---|
Portfolio Turnover | 49% |
|---|
|
| Holdings [Text Block] |
Top SectorsFootnote Reference* (% of Net Assets)Footnote Reference(as of June 30, 2025)Value | Value |
|---|
Energy | 3.4% | Communication Services | 4.0% | Consumer Staples | 4.0% | Health Care | 7.5% | Real Estate | 7.9% | Materials | 9.4% | Information Technology | 11.0% | Consumer Discretionary | 12.3% | Financials | 13.0% | Industrials | 23.5% |
Top 10 HoldingsFootnote Reference* (% of Net Assets)Footnote Reference(as of June 30, 2025)Celestica, Inc. | 1.7% |
|---|
Swissquote Group Holding SA, Registered Shares | 1.2% |
|---|
Bankinter SA | 1.0% |
|---|
Dundee Precious Metals, Inc. | 1.0% |
|---|
Sanwa Holdings Corp. | 1.0% |
|---|
Coca-Cola HBC AG, Class DI | 0.9% |
|---|
Indra Sistemas SA | 0.8% |
|---|
SPIE SA | 0.8% |
|---|
Buzzi SpA | 0.8% |
|---|
Euronext NV | 0.8% |
|---|
|
| Material Fund Change [Text Block] |
|
| C000145003 |
|
| Shareholder Report [Line Items] |
|
| Fund Name |
Victory Trivalent International Small-Cap Fund
|
| Class Name |
Class Y
|
| Trading Symbol |
MYSIX
|
| Annual or Semi-Annual Statement [Text Block] |
Annual Shareholder Report
|
| Shareholder Report Annual or Semi-Annual |
annual shareholder report
|
| Additional Information [Text Block] |
You can find additional information about the Fund at advisor.vcm.com/literature/mutual-fund-prospectuses. You may also request more information by calling 800-539-3863 or visiting vcm.com/contact-us.
|
| Additional Information Phone Number |
800-539-3863
|
| Additional Information Website |
vcm.com
|
| Expenses [Text Block] |
What were the Fund's costs for the last year?(based on a hypothetical $10,000 investment) Class Name | Costs of a $10,000 Investment | Costs paid as a percentage of a $10,000 Investment |
|---|
Class Y | $125 | 1.10% |
|---|
| | |
|---|
|
| Expenses Paid, Amount |
$ 125
|
| Expense Ratio, Percent |
1.10%
|
| Factors Affecting Performance [Text Block] |
What affected the Fund’s performance during the last year?International returns were supported by a decline in the U.S. dollar alongside weaker U.S. confidence and widespread tariff announcements. All five regions were up during the period and all 11 economic sectors posted gains in the S&P® Developed Ex-U.S. SmallCap Index (the “Index”). Financials were the strongest performing sector while energy stocks detracted from performance relative to the broader Index. Top contributors to performance: Overall security selection was strongest and accounted for the Fund’s relative outperformance of the Index. Excess returns were generated in four of the five regions and eight of 11 sectors. Outperformance was generated within the industrials, information technology, and healthcare sectors. From a style perspective, the Fund’s overall exposure to value, business momentum and quality factors all contributed positively to its relative performance.
Top detractors from performance: Performance was weakest in the UK region and consumer staples sector. At the sector level, relative underperformance was centered in consumer staples and utilities.
|
| Performance Past Does Not Indicate Future [Text] |
The investment return and principal value will fluctuate so that an investor's shares, when redeemed, may be worth more or less than the original cost. Past performance is not a good predictor of the Fund's future performance.
|
| Line Graph [Table Text Block] |
| Victory Trivalent International Small-Cap Fund Class Y - $2,008,738 | MSCI All Country World Index (regulatory broad based index) - $2,592,262 | S&P Developed Ex-U.S. SmallCap Index - $1,774,419 |
|---|
6/15 | $1,000,000 | $1,000,000 | $1,000,000 |
|---|
6/16 | $921,255 | $962,703 | $958,061 |
|---|
6/17 | $1,126,450 | $1,143,507 | $1,162,632 |
|---|
6/18 | $1,289,209 | $1,266,195 | $1,290,428 |
|---|
6/19 | $1,200,549 | $1,338,930 | $1,210,996 |
|---|
6/20 | $1,205,463 | $1,367,187 | $1,160,843 |
|---|
6/21 | $1,699,263 | $1,904,019 | $1,667,200 |
|---|
6/22 | $1,273,286 | $1,604,143 | $1,245,995 |
|---|
6/23 | $1,444,322 | $1,869,305 | $1,376,772 |
|---|
6/24 | $1,583,522 | $2,231,481 | $1,481,254 |
|---|
6/25 | $2,008,738 | $2,592,262 | $1,774,419 |
|---|
|
| Average Annual Return [Table Text Block] |
| 1 Year | 5 Year | 10 Year |
|---|
Class Y | 26.85%Footnote Reference | 10.75% | 7.22% |
|---|
MSCI All Country World Index | 16.17% | 13.65% | 9.99% |
|---|
S&P Developed Ex-U.S. SmallCap Index | 19.79% | 8.86% | 5.90% |
|---|
|
| No Deduction of Taxes [Text Block] |
The graph and table total returns do not reflect the deduction of taxes that a shareholder would pay on Fund distributions, or redemption of shares.
|
| AssetsNet |
$ 3,803,556,000
|
| Holdings Count | Holding |
224
|
| Advisory Fees Paid, Amount |
$ 32,102,000
|
| InvestmentCompanyPortfolioTurnover |
49.00%
|
| Additional Fund Statistics [Text Block] |
FUND STATISTICS($ amounts in 000s)(as of June 30, 2025)Net Assets | $3,803,556 |
|---|
Number of Holdings | 224 |
|---|
Investment Advisory Fees | $32,102 |
|---|
Portfolio Turnover | 49% |
|---|
|
| Holdings [Text Block] |
Top SectorsFootnote Reference* (% of Net Assets)Footnote Reference(as of June 30, 2025)Value | Value |
|---|
Energy | 3.4% | Communication Services | 4.0% | Consumer Staples | 4.0% | Health Care | 7.5% | Real Estate | 7.9% | Materials | 9.4% | Information Technology | 11.0% | Consumer Discretionary | 12.3% | Financials | 13.0% | Industrials | 23.5% |
Top 10 HoldingsFootnote Reference* (% of Net Assets)Footnote Reference(as of June 30, 2025)Celestica, Inc. | 1.7% |
|---|
Swissquote Group Holding SA, Registered Shares | 1.2% |
|---|
Bankinter SA | 1.0% |
|---|
Dundee Precious Metals, Inc. | 1.0% |
|---|
Sanwa Holdings Corp. | 1.0% |
|---|
Coca-Cola HBC AG, Class DI | 0.9% |
|---|
Indra Sistemas SA | 0.8% |
|---|
SPIE SA | 0.8% |
|---|
Buzzi SpA | 0.8% |
|---|
Euronext NV | 0.8% |
|---|
|
| Material Fund Change [Text Block] |
|
| C000144969 |
|
| Shareholder Report [Line Items] |
|
| Fund Name |
Victory Core Bond Fund
|
| Class Name |
Class A
|
| Trading Symbol |
MUCAX
|
| Annual or Semi-Annual Statement [Text Block] |
Annual Shareholder Report
|
| Shareholder Report Annual or Semi-Annual |
annual shareholder report
|
| Additional Information [Text Block] |
You can find additional information about the Fund at advisor.vcm.com/literature/mutual-fund-prospectuses. You may also request more information by calling 800-539-3863 or visiting vcm.com/contact-us.
|
| Additional Information Phone Number |
800-539-3863
|
| Additional Information Website |
vcm.com
|
| Expenses [Text Block] |
What were the Fund's costs for the last year?(based on a hypothetical $10,000 investment) Class Name | Costs of a $10,000 Investment | Costs paid as a percentage of a $10,000 Investment |
|---|
Class A | $87 | 0.85% |
|---|
| | |
|---|
|
| Expenses Paid, Amount |
$ 87
|
| Expense Ratio, Percent |
0.85%
|
| Factors Affecting Performance [Text Block] |
What affected the Fund’s performance during the last year?Top contributors to performance: Banking, utilities, transportation, and food & beverage were sub-sectors that contributed to relative performance. The Fund’s overweight allocation to, and security selection in, commercial mortgage-backed securities contributed to relative performance. The Fund’s overweight allocation to, and security selection in, BBB-rated securities were the largest credit rating factors that benefited performance.
Top detractors from performance: The Fund’s underweight allocation to agency mortgage-backed securities was the largest detractor from relative performance during the year. Cable & satellite and media & entertainment were sectors that detracted from performance.
|
| Performance Past Does Not Indicate Future [Text] |
The investment return and principal value will fluctuate so that an investor's shares, when redeemed, may be worth more or less than the original cost. Past performance is not a good predictor of the Fund's future performance.
|
| Line Graph [Table Text Block] |
| Victory Core Bond Fund Class A @ NAV - $11,459 | Victory Core Bond Fund Class A @ MOP - $11,196 | Bloomberg U.S. Aggregate Bond Index (regulatory broad based index) - $11,904 |
|---|
6/15 | $10,000 | $9,770 | $10,000 |
|---|
6/16 | $10,334 | $10,097 | $10,600 |
|---|
6/17 | $10,435 | $10,195 | $10,567 |
|---|
6/18 | $10,384 | $10,146 | $10,525 |
|---|
6/19 | $10,983 | $10,731 | $11,353 |
|---|
6/20 | $11,815 | $11,544 | $12,345 |
|---|
6/21 | $12,012 | $11,737 | $12,304 |
|---|
6/22 | $10,754 | $10,507 | $11,038 |
|---|
6/23 | $10,611 | $10,367 | $10,934 |
|---|
6/24 | $10,850 | $10,601 | $11,222 |
|---|
6/25 | $11,459 | $11,196 | $11,904 |
|---|
|
| Average Annual Return [Table Text Block] |
| 1 Year | 5 Year | 10 Year |
|---|
Class A @ NAV | 5.62% | -0.61% | 1.37% |
|---|
Class A @ MOP | 3.21% | -1.06% | 1.14% |
|---|
Bloomberg U.S. Aggregate Bond Index | 6.08% | -0.73% | 1.76% |
|---|
|
| No Deduction of Taxes [Text Block] |
The graph and table total returns do not reflect the deduction of taxes that a shareholder would pay on Fund distributions, or redemption of shares.
|
| Previous Investment Adviser [Text Block] |
The maximum offering price (“MOP”) figures reflect a maximum sales charge of 2.25% for Class A. The Net Asset Value ("NAV") figures do not reflect sales charges.
|
| AssetsNet |
$ 36,237,000
|
| Holdings Count | Holding |
318
|
| Advisory Fees Paid, Amount |
$ 179,000
|
| InvestmentCompanyPortfolioTurnover |
36.00%
|
| Additional Fund Statistics [Text Block] |
FUND STATISTICS($ amounts in 000s)(as of June 30, 2025)Net Assets | $36,237 |
|---|
Number of Holdings | 318 |
|---|
Investment Advisory Fees | $179 |
|---|
Portfolio Turnover | 36% |
|---|
|
| Holdings [Text Block] |
Asset AllocationFootnote Reference* ^ (% of Net Assets)(as of June 30, 2025)Value | Value |
|---|
U.S. Treasury Obligations | 39.3% | Corporate Bonds | 25.9% | U.S. Government Agency Mortgages | 14.4% | Asset-Backed Securities | 8.8% | Collateralized Mortgage Obligations | 6.1% | Yankee Dollars | 4.2% | OtherFootnote Reference** | 0.3% |
|
| Material Fund Change [Text Block] |
|
| C000144970 |
|
| Shareholder Report [Line Items] |
|
| Fund Name |
Victory Core Bond Fund
|
| Class Name |
Class C
|
| Trading Symbol |
MUCCX
|
| Annual or Semi-Annual Statement [Text Block] |
Annual Shareholder Report
|
| Shareholder Report Annual or Semi-Annual |
annual shareholder report
|
| Additional Information [Text Block] |
You can find additional information about the Fund at advisor.vcm.com/literature/mutual-fund-prospectuses. You may also request more information by calling 800-539-3863 or visiting vcm.com/contact-us.
|
| Additional Information Phone Number |
800-539-3863
|
| Additional Information Website |
vcm.com
|
| Expenses [Text Block] |
What were the Fund's costs for the last year?(based on a hypothetical $10,000 investment) Class Name | Costs of a $10,000 Investment | Costs paid as a percentage of a $10,000 Investment |
|---|
Class C | $164 | 1.60% |
|---|
| | |
|---|
|
| Expenses Paid, Amount |
$ 164
|
| Expense Ratio, Percent |
1.60%
|
| Factors Affecting Performance [Text Block] |
What affected the Fund’s performance during the last year?Top contributors to performance: Banking, utilities, transportation, and food & beverage were sub-sectors that contributed to relative performance. The Fund’s overweight allocation to, and security selection in, commercial mortgage-backed securities contributed to relative performance. The Fund’s overweight allocation to, and security selection in, BBB-rated securities were the largest credit rating factors that benefited performance.
Top detractors from performance: The Fund’s underweight allocation to agency mortgage-backed securities was the largest detractor from relative performance during the year. Cable & satellite and media & entertainment were sectors that detracted from performance.
|
| Performance Past Does Not Indicate Future [Text] |
The investment return and principal value will fluctuate so that an investor's shares, when redeemed, may be worth more or less than the original cost. Past performance is not a good predictor of the Fund's future performance.
|
| Line Graph [Table Text Block] |
| Victory Core Bond Fund Class C @ NAV - $10,793 | Victory Core Bond Fund Class C @ CDSC - $10,793 | Bloomberg U.S. Aggregate Bond Index (regulatory broad based index) - $11,904 |
|---|
6/15 | $10,000 | $10,000 | $10,000 |
|---|
6/16 | $10,256 | $10,256 | $10,600 |
|---|
6/17 | $10,269 | $10,269 | $10,567 |
|---|
6/18 | $10,154 | $10,154 | $10,525 |
|---|
6/19 | $10,666 | $10,666 | $11,353 |
|---|
6/20 | $11,387 | $11,387 | $12,345 |
|---|
6/21 | $11,491 | $11,491 | $12,304 |
|---|
6/22 | $10,201 | $10,201 | $11,038 |
|---|
6/23 | $9,994 | $9,994 | $10,934 |
|---|
6/24 | $10,219 | $10,219 | $11,222 |
|---|
6/25 | $10,793 | $10,793 | $11,904 |
|---|
|
| Average Annual Return [Table Text Block] |
| 1 Year | 5 Year | 10 Year |
|---|
Class C @ NAV | 4.71% | -1.37% | 0.77% |
|---|
Class C @ CDSC | 3.71% | -1.37% | 0.77% |
|---|
Bloomberg U.S. Aggregate Bond Index | 6.08% | -0.73% | 1.76% |
|---|
|
| No Deduction of Taxes [Text Block] |
The graph and table total returns do not reflect the deduction of taxes that a shareholder would pay on Fund distributions, or redemption of shares.
|
| Previous Investment Adviser [Text Block] |
Class C is not subject to an initial sales charge, but is subject to Contingent Deferred Sales Charge (“CDSC”) of 1.00% on shares redeemed within one year of purchase. The Net Asset Value ("NAV") figures do not reflect sales charges.
|
| AssetsNet |
$ 36,237,000
|
| Holdings Count | Holding |
318
|
| Advisory Fees Paid, Amount |
$ 179,000
|
| InvestmentCompanyPortfolioTurnover |
36.00%
|
| Additional Fund Statistics [Text Block] |
FUND STATISTICS($ amounts in 000s)(as of June 30, 2025)Net Assets | $36,237 |
|---|
Number of Holdings | 318 |
|---|
Investment Advisory Fees | $179 |
|---|
Portfolio Turnover | 36% |
|---|
|
| Holdings [Text Block] |
Asset AllocationFootnote Reference* ^ (% of Net Assets)(as of June 30, 2025)Value | Value |
|---|
U.S. Treasury Obligations | 39.3% | Corporate Bonds | 25.9% | U.S. Government Agency Mortgages | 14.4% | Asset-Backed Securities | 8.8% | Collateralized Mortgage Obligations | 6.1% | Yankee Dollars | 4.2% | OtherFootnote Reference** | 0.3% |
|
| Material Fund Change [Text Block] |
|
| C000155525 |
|
| Shareholder Report [Line Items] |
|
| Fund Name |
Victory Core Bond Fund
|
| Class Name |
Class R6
|
| Trading Symbol |
MUCRX
|
| Annual or Semi-Annual Statement [Text Block] |
Annual Shareholder Report
|
| Shareholder Report Annual or Semi-Annual |
annual shareholder report
|
| Additional Information [Text Block] |
You can find additional information about the Fund at advisor.vcm.com/literature/mutual-fund-prospectuses. You may also request more information by calling 800-539-3863 or visiting vcm.com/contact-us.
|
| Additional Information Phone Number |
800-539-3863
|
| Additional Information Website |
vcm.com
|
| Expenses [Text Block] |
What were the Fund's costs for the last year?(based on a hypothetical $10,000 investment) Class Name | Costs of a $10,000 Investment | Costs paid as a percentage of a $10,000 Investment |
|---|
Class R6 | $60 | 0.58% |
|---|
| | |
|---|
|
| Expenses Paid, Amount |
$ 60
|
| Expense Ratio, Percent |
0.58%
|
| Factors Affecting Performance [Text Block] |
What affected the Fund’s performance during the last year?Top contributors to performance: Banking, utilities, transportation, and food & beverage were sub-sectors that contributed to relative performance. The Fund’s overweight allocation to, and security selection in, commercial mortgage-backed securities contributed to relative performance. The Fund’s overweight allocation to, and security selection in, BBB-rated securities were the largest credit rating factors that benefited performance.
Top detractors from performance: The Fund’s underweight allocation to agency mortgage-backed securities was the largest detractor from relative performance during the year. Cable & satellite and media & entertainment were sectors that detracted from performance.
|
| Performance Past Does Not Indicate Future [Text] |
The investment return and principal value will fluctuate so that an investor's shares, when redeemed, may be worth more or less than the original cost. Past performance is not a good predictor of the Fund's future performance.
|
| Line Graph [Table Text Block] |
| Victory Core Bond Fund Class R6 - $11,782 | Bloomberg U.S. Aggregate Bond Index (regulatory broad based index) - $11,904 |
|---|
6/15 | $10,000 | $10,000 |
|---|
6/16 | $10,360 | $10,600 |
|---|
6/17 | $10,483 | $10,567 |
|---|
6/18 | $10,471 | $10,525 |
|---|
6/19 | $11,105 | $11,353 |
|---|
6/20 | $11,986 | $12,345 |
|---|
6/21 | $12,218 | $12,304 |
|---|
6/22 | $10,959 | $11,038 |
|---|
6/23 | $10,843 | $10,934 |
|---|
6/24 | $11,129 | $11,222 |
|---|
6/25 | $11,782 | $11,904 |
|---|
|
| Average Annual Return [Table Text Block] |
| 1 Year | 5 Year | 10 Year |
|---|
Class R6 | 5.87% | -0.34% | 1.65% |
|---|
Bloomberg U.S. Aggregate Bond Index | 6.08% | -0.73% | 1.76% |
|---|
|
| No Deduction of Taxes [Text Block] |
The graph and table total returns do not reflect the deduction of taxes that a shareholder would pay on Fund distributions, or redemption of shares.
|
| AssetsNet |
$ 36,237,000
|
| Holdings Count | Holding |
318
|
| Advisory Fees Paid, Amount |
$ 179,000
|
| InvestmentCompanyPortfolioTurnover |
36.00%
|
| Additional Fund Statistics [Text Block] |
FUND STATISTICS($ amounts in 000s)(as of June 30, 2025)Net Assets | $36,237 |
|---|
Number of Holdings | 318 |
|---|
Investment Advisory Fees | $179 |
|---|
Portfolio Turnover | 36% |
|---|
|
| Holdings [Text Block] |
Asset AllocationFootnote Reference* ^ (% of Net Assets)(as of June 30, 2025)Value | Value |
|---|
U.S. Treasury Obligations | 39.3% | Corporate Bonds | 25.9% | U.S. Government Agency Mortgages | 14.4% | Asset-Backed Securities | 8.8% | Collateralized Mortgage Obligations | 6.1% | Yankee Dollars | 4.2% | OtherFootnote Reference** | 0.3% |
|
| Material Fund Change [Text Block] |
|
| C000144971 |
|
| Shareholder Report [Line Items] |
|
| Fund Name |
Victory Core Bond Fund
|
| Class Name |
Class Y
|
| Trading Symbol |
MUCYX
|
| Annual or Semi-Annual Statement [Text Block] |
Annual Shareholder Report
|
| Shareholder Report Annual or Semi-Annual |
annual shareholder report
|
| Additional Information [Text Block] |
You can find additional information about the Fund at advisor.vcm.com/literature/mutual-fund-prospectuses. You may also request more information by calling 800-539-3863 or visiting vcm.com/contact-us.
|
| Additional Information Phone Number |
800-539-3863
|
| Additional Information Website |
vcm.com
|
| Expenses [Text Block] |
What were the Fund's costs for the last year?(based on a hypothetical $10,000 investment) Class Name | Costs of a $10,000 Investment | Costs paid as a percentage of a $10,000 Investment |
|---|
Class Y | $62 | 0.60% |
|---|
| | |
|---|
|
| Expenses Paid, Amount |
$ 62
|
| Expense Ratio, Percent |
0.60%
|
| Factors Affecting Performance [Text Block] |
What affected the Fund’s performance during the last year?Top contributors to performance: Banking, utilities, transportation, and food & beverage were sub-sectors that contributed to relative performance. The Fund’s overweight allocation to, and security selection in, commercial mortgage-backed securities contributed to relative performance. The Fund’s overweight allocation to, and security selection in, BBB-rated securities were the largest credit rating factors that benefited performance.
Top detractors from performance: The Fund’s underweight allocation to agency mortgage-backed securities was the largest detractor from relative performance during the year. Cable & satellite and media & entertainment were sectors that detracted from performance.
|
| Performance Past Does Not Indicate Future [Text] |
The investment return and principal value will fluctuate so that an investor's shares, when redeemed, may be worth more or less than the original cost. Past performance is not a good predictor of the Fund's future performance.
|
| Line Graph [Table Text Block] |
| Victory Core Bond Fund Class Y - $1,175,651 | Bloomberg U.S. Aggregate Bond Index (regulatory broad based index) - $1,190,377 |
|---|
6/15 | $1,000,000 | $1,000,000 |
|---|
6/16 | $1,035,856 | $1,060,014 |
|---|
6/17 | $1,048,027 | $1,056,679 |
|---|
6/18 | $1,046,662 | $1,052,481 |
|---|
6/19 | $1,109,322 | $1,135,303 |
|---|
6/20 | $1,197,216 | $1,234,525 |
|---|
6/21 | $1,220,132 | $1,230,411 |
|---|
6/22 | $1,094,196 | $1,103,775 |
|---|
6/23 | $1,082,425 | $1,093,424 |
|---|
6/24 | $1,110,739 | $1,122,192 |
|---|
6/25 | $1,175,651 | $1,190,377 |
|---|
|
| Average Annual Return [Table Text Block] |
| 1 Year | 5 Year | 10 Year |
|---|
Class Y | 5.84% | -0.36% | 1.63% |
|---|
Bloomberg U.S. Aggregate Bond Index | 6.08% | -0.73% | 1.76% |
|---|
|
| No Deduction of Taxes [Text Block] |
The graph and table total returns do not reflect the deduction of taxes that a shareholder would pay on Fund distributions, or redemption of shares.
|
| AssetsNet |
$ 36,237,000
|
| Holdings Count | Holding |
318
|
| Advisory Fees Paid, Amount |
$ 179,000
|
| InvestmentCompanyPortfolioTurnover |
36.00%
|
| Additional Fund Statistics [Text Block] |
FUND STATISTICS($ amounts in 000s)(as of June 30, 2025)Net Assets | $36,237 |
|---|
Number of Holdings | 318 |
|---|
Investment Advisory Fees | $179 |
|---|
Portfolio Turnover | 36% |
|---|
|
| Holdings [Text Block] |
Asset AllocationFootnote Reference* ^ (% of Net Assets)(as of June 30, 2025)Value | Value |
|---|
U.S. Treasury Obligations | 39.3% | Corporate Bonds | 25.9% | U.S. Government Agency Mortgages | 14.4% | Asset-Backed Securities | 8.8% | Collateralized Mortgage Obligations | 6.1% | Yankee Dollars | 4.2% | OtherFootnote Reference** | 0.3% |
|
| Material Fund Change [Text Block] |
|
| C000002333 |
|
| Shareholder Report [Line Items] |
|
| Fund Name |
Victory Diversified Stock Fund
|
| Class Name |
Class A
|
| Trading Symbol |
SRVEX
|
| Annual or Semi-Annual Statement [Text Block] |
Annual Shareholder Report
|
| Shareholder Report Annual or Semi-Annual |
annual shareholder report
|
| Additional Information [Text Block] |
You can find additional information about the Fund at advisor.vcm.com/literature/mutual-fund-prospectuses. You may also request more information by calling 800-539-3863 or visiting vcm.com/contact-us.
|
| Additional Information Phone Number |
800-539-3863
|
| Additional Information Website |
vcm.com
|
| Expenses [Text Block] |
What were the Fund's costs for the last year?(based on a hypothetical $10,000 investment) Class Name | Costs of a $10,000 Investment | Costs paid as a percentage of a $10,000 Investment |
|---|
Class A | $114 | 1.05% |
|---|
| | |
|---|
|
| Expenses Paid, Amount |
$ 114
|
| Expense Ratio, Percent |
1.05%
|
| Factors Affecting Performance [Text Block] |
What affected the Fund’s performance during the last year?Top contributors to performance: • The Fund generated the strongest relative performance within the technology, communication services, and health care sectors. • Stocks that contributed most positively to the Fund’s relative performance were Interactive Brokers Group, Inc. and Broadcom, Inc. Top detractors from performance: • Stocks that contributed negatively to the Fund’s relative performance were Tesla, Inc. (“Tesla”) and Novo Nordisk A/S, ADR (“Novo Nordisk”). • The Fund was underweight to Tesla stock compared to the Index and the company’s shares rebounded sharply after the presidential election. We believe the rebound in share price suggests a favorable policy outlook for the company and its autonomous driving ambitions. • Novo Nordisk underperformed as the company’s flagship portfolio of GLP-1 drugs such as Wegovy lagged competitors in demand and efficacy for some health conditions. |
| Performance Past Does Not Indicate Future [Text] |
The investment return and principal value will fluctuate so that an investor's shares, when redeemed, may be worth more or less than the original cost. Past performance is not a good predictor of the Fund's future performance.
|
| Line Graph [Table Text Block] |
| Victory Diversified Stock Fund Class A @ NAV - $30,893 | Victory Diversified Stock Fund Class A @ MOP - $29,118 | S&P 500® Index (regulatory broad based index) - $35,936 |
|---|
6/15 | $10,000 | $9,425 | $10,000 |
|---|
6/16 | $9,848 | $9,282 | $10,399 |
|---|
6/17 | $11,016 | $10,383 | $12,260 |
|---|
6/18 | $12,564 | $11,842 | $14,023 |
|---|
6/19 | $13,117 | $12,363 | $15,483 |
|---|
6/20 | $13,601 | $12,820 | $16,645 |
|---|
6/21 | $19,161 | $18,061 | $23,436 |
|---|
6/22 | $17,546 | $16,538 | $20,948 |
|---|
6/23 | $21,401 | $20,172 | $25,053 |
|---|
6/24 | $26,464 | $24,944 | $31,204 |
|---|
6/25 | $30,893 | $29,118 | $35,936 |
|---|
|
| Average Annual Return [Table Text Block] |
| 1 Year | 5 Year | 10 Year |
|---|
Class A @ NAV | 16.73%Footnote Reference | 17.83%Footnote Reference | 11.94% |
|---|
Class A @ MOP | 10.03% | 16.44% | 11.28% |
|---|
S&P 500® Index | 15.16% | 16.64% | 13.65% |
|---|
|
| No Deduction of Taxes [Text Block] |
The graph and table total returns do not reflect the deduction of taxes that a shareholder would pay on Fund distributions, or redemption of shares.
|
| Previous Investment Adviser [Text Block] |
The maximum offering price (“MOP”) figures reflect a maximum sales charge of 5.75% for Class A. The Net Asset Value ("NAV") figures do not reflect sales charges.
|
| AssetsNet |
$ 339,653,000
|
| Holdings Count | Holding |
74
|
| Advisory Fees Paid, Amount |
$ 2,101,000
|
| InvestmentCompanyPortfolioTurnover |
92.00%
|
| Additional Fund Statistics [Text Block] |
FUND STATISTICS($ amounts in 000s)(as of June 30, 2025)Net Assets | $339,653 |
|---|
Number of Holdings | 74 |
|---|
Investment Advisory Fees | $2,101 |
|---|
Portfolio Turnover | 92% |
|---|
|
| Holdings [Text Block] |
Top SectorsFootnote Reference* (% of Net Assets)Footnote Reference(as of June 30, 2025)Value | Value |
|---|
Real Estate | 1.0% | Materials | 1.9% | Energy | 2.5% | Consumer Staples | 2.8% | Industrials | 7.9% | Communication Services | 10.8% | Consumer Discretionary | 12.1% | Health Care | 12.6% | Financials | 13.7% | Information TechnologyFootnote Reference** | 32.9% |
Top 10 HoldingsFootnote Reference* (% of Net Assets)Footnote Reference(as of June 30, 2025)NVIDIA Corp. | 6.7% |
|---|
Microsoft Corp. | 6.7% |
|---|
Apple, Inc. | 5.9% |
|---|
Alphabet, Inc., Class C | 3.8% |
|---|
Amazon.com, Inc. | 3.6% |
|---|
Meta Platforms, Inc., Class A | 3.3% |
|---|
Broadcom, Inc. | 3.1% |
|---|
Visa, Inc., Class A | 2.2% |
|---|
Eli Lilly & Co. | 1.9% |
|---|
Jabil, Inc. | 1.8% |
|---|
|
| Material Fund Change [Text Block] |
|
| C000002336 |
|
| Shareholder Report [Line Items] |
|
| Fund Name |
Victory Diversified Stock Fund
|
| Class Name |
Class C
|
| Trading Symbol |
VDSCX
|
| Annual or Semi-Annual Statement [Text Block] |
Annual Shareholder Report
|
| Shareholder Report Annual or Semi-Annual |
annual shareholder report
|
| Additional Information [Text Block] |
You can find additional information about the Fund at advisor.vcm.com/literature/mutual-fund-prospectuses. You may also request more information by calling 800-539-3863 or visiting vcm.com/contact-us.
|
| Additional Information Phone Number |
800-539-3863
|
| Additional Information Website |
vcm.com
|
| Expenses [Text Block] |
What were the Fund's costs for the last year?(based on a hypothetical $10,000 investment) Class Name | Costs of a $10,000 Investment | Costs paid as a percentage of a $10,000 Investment |
|---|
Class C | $218 | 2.02% |
|---|
| | |
|---|
|
| Expenses Paid, Amount |
$ 218
|
| Expense Ratio, Percent |
2.02%
|
| Factors Affecting Performance [Text Block] |
What affected the Fund’s performance during the last year?Top contributors to performance: • The Fund generated the strongest relative performance within the technology, communication services, and health care sectors. • Stocks that contributed most positively to the Fund’s relative performance were Interactive Brokers Group, Inc. and Broadcom, Inc. Top detractors from performance: • Stocks that contributed negatively to the Fund’s relative performance were Tesla, Inc. (“Tesla”) and Novo Nordisk A/S, ADR (“Novo Nordisk”). • The Fund was underweight to Tesla stock compared to the Index and the company’s shares rebounded sharply after the presidential election. We believe the rebound in share price suggests a favorable policy outlook for the company and its autonomous driving ambitions. • Novo Nordisk underperformed as the company’s flagship portfolio of GLP-1 drugs such as Wegovy lagged competitors in demand and efficacy for some health conditions. |
| Performance Past Does Not Indicate Future [Text] |
The investment return and principal value will fluctuate so that an investor's shares, when redeemed, may be worth more or less than the original cost. Past performance is not a good predictor of the Fund's future performance.
|
| Line Graph [Table Text Block] |
| Victory Diversified Stock Fund Class C @ NAV - $28,755 | Victory Diversified Stock Fund Class C @ CDSC - $28,755 | S&P 500® Index (regulatory broad based index) - $35,936 |
|---|
6/15 | $10,000 | $10,000 | $10,000 |
|---|
6/16 | $9,768 | $9,768 | $10,399 |
|---|
6/17 | $10,831 | $10,831 | $12,260 |
|---|
6/18 | $12,251 | $12,251 | $14,023 |
|---|
6/19 | $12,678 | $12,678 | $15,483 |
|---|
6/20 | $13,023 | $13,023 | $16,645 |
|---|
6/21 | $18,170 | $18,170 | $23,436 |
|---|
6/22 | $16,482 | $16,482 | $20,948 |
|---|
6/23 | $19,921 | $19,921 | $25,053 |
|---|
6/24 | $24,633 | $24,633 | $31,204 |
|---|
6/25 | $28,755 | $28,755 | $35,936 |
|---|
|
| Average Annual Return [Table Text Block] |
| 1 Year | 5 Year | 10 Year |
|---|
Class C @ NAV | 15.59%Footnote Reference | 16.71%Footnote Reference | 11.14% |
|---|
Class C @ CDSC | 14.59% | 16.71% | 11.14% |
|---|
S&P 500® Index | 15.16% | 16.64% | 13.65% |
|---|
|
| No Deduction of Taxes [Text Block] |
The graph and table total returns do not reflect the deduction of taxes that a shareholder would pay on Fund distributions, or redemption of shares.
|
| Previous Investment Adviser [Text Block] |
Class C is not subject to an initial sales charge, but is subject to Contingent Deferred Sales Charge (“CDSC”) of 1.00% on shares redeemed within one year of purchase. The Net Asset Value ("NAV") figures do not reflect sales charges.
|
| AssetsNet |
$ 339,653,000
|
| Holdings Count | Holding |
74
|
| Advisory Fees Paid, Amount |
$ 2,101,000
|
| InvestmentCompanyPortfolioTurnover |
92.00%
|
| Additional Fund Statistics [Text Block] |
FUND STATISTICS($ amounts in 000s)(as of June 30, 2025)Net Assets | $339,653 |
|---|
Number of Holdings | 74 |
|---|
Investment Advisory Fees | $2,101 |
|---|
Portfolio Turnover | 92% |
|---|
|
| Holdings [Text Block] |
Top SectorsFootnote Reference* (% of Net Assets)Footnote Reference(as of June 30, 2025)Value | Value |
|---|
Real Estate | 1.0% | Materials | 1.9% | Energy | 2.5% | Consumer Staples | 2.8% | Industrials | 7.9% | Communication Services | 10.8% | Consumer Discretionary | 12.1% | Health Care | 12.6% | Financials | 13.7% | Information TechnologyFootnote Reference** | 32.9% |
Top 10 HoldingsFootnote Reference* (% of Net Assets)Footnote Reference(as of June 30, 2025)NVIDIA Corp. | 6.7% |
|---|
Microsoft Corp. | 6.7% |
|---|
Apple, Inc. | 5.9% |
|---|
Alphabet, Inc., Class C | 3.8% |
|---|
Amazon.com, Inc. | 3.6% |
|---|
Meta Platforms, Inc., Class A | 3.3% |
|---|
Broadcom, Inc. | 3.1% |
|---|
Visa, Inc., Class A | 2.2% |
|---|
Eli Lilly & Co. | 1.9% |
|---|
Jabil, Inc. | 1.8% |
|---|
|
| Material Fund Change [Text Block] |
|
| C000052113 |
|
| Shareholder Report [Line Items] |
|
| Fund Name |
Victory Diversified Stock Fund
|
| Class Name |
Class I
|
| Trading Symbol |
VDSIX
|
| Annual or Semi-Annual Statement [Text Block] |
Annual Shareholder Report
|
| Shareholder Report Annual or Semi-Annual |
annual shareholder report
|
| Additional Information [Text Block] |
You can find additional information about the Fund at advisor.vcm.com/literature/mutual-fund-prospectuses. You may also request more information by calling 800-539-3863 or visiting vcm.com/contact-us.
|
| Additional Information Phone Number |
800-539-3863
|
| Additional Information Website |
vcm.com
|
| Expenses [Text Block] |
What were the Fund's costs for the last year?(based on a hypothetical $10,000 investment) Class Name | Costs of a $10,000 Investment | Costs paid as a percentage of a $10,000 Investment |
|---|
Class I | $90 | 0.83% |
|---|
| | |
|---|
|
| Expenses Paid, Amount |
$ 90
|
| Expense Ratio, Percent |
0.83%
|
| Factors Affecting Performance [Text Block] |
What affected the Fund’s performance during the last year?Top contributors to performance: • The Fund generated the strongest relative performance within the technology, communication services, and health care sectors. • Stocks that contributed most positively to the Fund’s relative performance were Interactive Brokers Group, Inc. and Broadcom, Inc. Top detractors from performance: • Stocks that contributed negatively to the Fund’s relative performance were Tesla, Inc. (“Tesla”) and Novo Nordisk A/S, ADR (“Novo Nordisk”). • The Fund was underweight to Tesla stock compared to the Index and the company’s shares rebounded sharply after the presidential election. We believe the rebound in share price suggests a favorable policy outlook for the company and its autonomous driving ambitions. • Novo Nordisk underperformed as the company’s flagship portfolio of GLP-1 drugs such as Wegovy lagged competitors in demand and efficacy for some health conditions. |
| Performance Past Does Not Indicate Future [Text] |
The investment return and principal value will fluctuate so that an investor's shares, when redeemed, may be worth more or less than the original cost. Past performance is not a good predictor of the Fund's future performance.
|
| Line Graph [Table Text Block] |
| Victory Diversified Stock Fund Class I - $6,332,781 | S&P 500® Index (regulatory broad based index) - $7,187,237 |
|---|
6/15 | $2,000,000 | $2,000,000 |
|---|
6/16 | $1,975,297 | $2,079,856 |
|---|
6/17 | $2,214,305 | $2,452,067 |
|---|
6/18 | $2,532,159 | $2,804,528 |
|---|
6/19 | $2,650,488 | $3,096,689 |
|---|
6/20 | $2,755,420 | $3,329,098 |
|---|
6/21 | $3,891,308 | $4,687,176 |
|---|
6/22 | $3,572,361 | $4,189,593 |
|---|
6/23 | $4,368,459 | $5,010,506 |
|---|
6/24 | $5,412,735 | $6,240,890 |
|---|
6/25 | $6,332,781 | $7,187,237 |
|---|
|
| Average Annual Return [Table Text Block] |
| 1 Year | 5 Year | 10 Year |
|---|
Class I | 17.00%Footnote Reference | 18.11%Footnote Reference | 12.22% |
|---|
S&P 500® Index | 15.16% | 16.64% | 13.65% |
|---|
|
| No Deduction of Taxes [Text Block] |
The graph and table total returns do not reflect the deduction of taxes that a shareholder would pay on Fund distributions, or redemption of shares.
|
| AssetsNet |
$ 339,653,000
|
| Holdings Count | Holding |
74
|
| Advisory Fees Paid, Amount |
$ 2,101,000
|
| InvestmentCompanyPortfolioTurnover |
92.00%
|
| Additional Fund Statistics [Text Block] |
FUND STATISTICS($ amounts in 000s)(as of June 30, 2025)Net Assets | $339,653 |
|---|
Number of Holdings | 74 |
|---|
Investment Advisory Fees | $2,101 |
|---|
Portfolio Turnover | 92% |
|---|
|
| Holdings [Text Block] |
Top SectorsFootnote Reference* (% of Net Assets)Footnote Reference(as of June 30, 2025)Value | Value |
|---|
Real Estate | 1.0% | Materials | 1.9% | Energy | 2.5% | Consumer Staples | 2.8% | Industrials | 7.9% | Communication Services | 10.8% | Consumer Discretionary | 12.1% | Health Care | 12.6% | Financials | 13.7% | Information TechnologyFootnote Reference** | 32.9% |
Top 10 HoldingsFootnote Reference* (% of Net Assets)Footnote Reference(as of June 30, 2025)NVIDIA Corp. | 6.7% |
|---|
Microsoft Corp. | 6.7% |
|---|
Apple, Inc. | 5.9% |
|---|
Alphabet, Inc., Class C | 3.8% |
|---|
Amazon.com, Inc. | 3.6% |
|---|
Meta Platforms, Inc., Class A | 3.3% |
|---|
Broadcom, Inc. | 3.1% |
|---|
Visa, Inc., Class A | 2.2% |
|---|
Eli Lilly & Co. | 1.9% |
|---|
Jabil, Inc. | 1.8% |
|---|
|
| Material Fund Change [Text Block] |
|
| C000002337 |
|
| Shareholder Report [Line Items] |
|
| Fund Name |
Victory Diversified Stock Fund
|
| Class Name |
Class R
|
| Trading Symbol |
GRINX
|
| Annual or Semi-Annual Statement [Text Block] |
Annual Shareholder Report
|
| Shareholder Report Annual or Semi-Annual |
annual shareholder report
|
| Additional Information [Text Block] |
You can find additional information about the Fund at advisor.vcm.com/literature/mutual-fund-prospectuses. You may also request more information by calling 800-539-3863 or visiting vcm.com/contact-us.
|
| Additional Information Phone Number |
800-539-3863
|
| Additional Information Website |
vcm.com
|
| Expenses [Text Block] |
What were the Fund's costs for the last year?(based on a hypothetical $10,000 investment) Class Name | Costs of a $10,000 Investment | Costs paid as a percentage of a $10,000 Investment |
|---|
Class R | $146 | 1.35% |
|---|
| | |
|---|
|
| Expenses Paid, Amount |
$ 146
|
| Expense Ratio, Percent |
1.35%
|
| Factors Affecting Performance [Text Block] |
What affected the Fund’s performance during the last year?Top contributors to performance: • The Fund generated the strongest relative performance within the technology, communication services, and health care sectors. • Stocks that contributed most positively to the Fund’s relative performance were Interactive Brokers Group, Inc. and Broadcom, Inc. Top detractors from performance: • Stocks that contributed negatively to the Fund’s relative performance were Tesla, Inc. (“Tesla”) and Novo Nordisk A/S, ADR (“Novo Nordisk”). • The Fund was underweight to Tesla stock compared to the Index and the company’s shares rebounded sharply after the presidential election. We believe the rebound in share price suggests a favorable policy outlook for the company and its autonomous driving ambitions. • Novo Nordisk underperformed as the company’s flagship portfolio of GLP-1 drugs such as Wegovy lagged competitors in demand and efficacy for some health conditions. |
| Performance Past Does Not Indicate Future [Text] |
The investment return and principal value will fluctuate so that an investor's shares, when redeemed, may be worth more or less than the original cost. Past performance is not a good predictor of the Fund's future performance.
|
| Line Graph [Table Text Block] |
| Victory Diversified Stock Fund Class R - $30,014 | S&P 500® Index (regulatory broad based index) - $35,936 |
|---|
6/15 | $10,000 | $10,000 |
|---|
6/16 | $9,818 | $10,399 |
|---|
6/17 | $10,951 | $12,260 |
|---|
6/18 | $12,453 | $14,023 |
|---|
6/19 | $12,970 | $15,483 |
|---|
6/20 | $13,409 | $16,645 |
|---|
6/21 | $18,833 | $23,436 |
|---|
6/22 | $17,198 | $20,948 |
|---|
6/23 | $20,924 | $25,053 |
|---|
6/24 | $25,789 | $31,204 |
|---|
6/25 | $30,014 | $35,936 |
|---|
|
| Average Annual Return [Table Text Block] |
| 1 Year | 5 Year | 10 Year |
|---|
Class R | 16.38%Footnote Reference | 17.49%Footnote Reference | 11.62% |
|---|
S&P 500® Index | 15.16% | 16.64% | 13.65% |
|---|
|
| No Deduction of Taxes [Text Block] |
The graph and table total returns do not reflect the deduction of taxes that a shareholder would pay on Fund distributions, or redemption of shares.
|
| AssetsNet |
$ 339,653,000
|
| Holdings Count | Holding |
74
|
| Advisory Fees Paid, Amount |
$ 2,101,000
|
| InvestmentCompanyPortfolioTurnover |
92.00%
|
| Additional Fund Statistics [Text Block] |
FUND STATISTICS($ amounts in 000s)(as of June 30, 2025)Net Assets | $339,653 |
|---|
Number of Holdings | 74 |
|---|
Investment Advisory Fees | $2,101 |
|---|
Portfolio Turnover | 92% |
|---|
|
| Holdings [Text Block] |
Top SectorsFootnote Reference* (% of Net Assets)Footnote Reference(as of June 30, 2025)Value | Value |
|---|
Real Estate | 1.0% | Materials | 1.9% | Energy | 2.5% | Consumer Staples | 2.8% | Industrials | 7.9% | Communication Services | 10.8% | Consumer Discretionary | 12.1% | Health Care | 12.6% | Financials | 13.7% | Information TechnologyFootnote Reference** | 32.9% |
Top 10 HoldingsFootnote Reference* (% of Net Assets)Footnote Reference(as of June 30, 2025)NVIDIA Corp. | 6.7% |
|---|
Microsoft Corp. | 6.7% |
|---|
Apple, Inc. | 5.9% |
|---|
Alphabet, Inc., Class C | 3.8% |
|---|
Amazon.com, Inc. | 3.6% |
|---|
Meta Platforms, Inc., Class A | 3.3% |
|---|
Broadcom, Inc. | 3.1% |
|---|
Visa, Inc., Class A | 2.2% |
|---|
Eli Lilly & Co. | 1.9% |
|---|
Jabil, Inc. | 1.8% |
|---|
|
| Material Fund Change [Text Block] |
|
| C000138365 |
|
| Shareholder Report [Line Items] |
|
| Fund Name |
Victory Diversified Stock Fund
|
| Class Name |
Class R6
|
| Trading Symbol |
VDSRX
|
| Annual or Semi-Annual Statement [Text Block] |
Annual Shareholder Report
|
| Shareholder Report Annual or Semi-Annual |
annual shareholder report
|
| Additional Information [Text Block] |
You can find additional information about the Fund at advisor.vcm.com/literature/mutual-fund-prospectuses. You may also request more information by calling 800-539-3863 or visiting vcm.com/contact-us.
|
| Additional Information Phone Number |
800-539-3863
|
| Additional Information Website |
vcm.com
|
| Expenses [Text Block] |
What were the Fund's costs for the last year?(based on a hypothetical $10,000 investment) Class Name | Costs of a $10,000 Investment | Costs paid as a percentage of a $10,000 Investment |
|---|
Class R6 | $85 | 0.78% |
|---|
| | |
|---|
|
| Expenses Paid, Amount |
$ 85
|
| Expense Ratio, Percent |
0.78%
|
| Factors Affecting Performance [Text Block] |
What affected the Fund’s performance during the last year?Top contributors to performance: • The Fund generated the strongest relative performance within the technology, communication services, and health care sectors. • Stocks that contributed most positively to the Fund’s relative performance were Interactive Brokers Group, Inc. and Broadcom, Inc. Top detractors from performance: • Stocks that contributed negatively to the Fund’s relative performance were Tesla, Inc. (“Tesla”) and Novo Nordisk A/S, ADR (“Novo Nordisk”). • The Fund was underweight to Tesla stock compared to the Index and the company’s shares rebounded sharply after the presidential election. We believe the rebound in share price suggests a favorable policy outlook for the company and its autonomous driving ambitions. • Novo Nordisk underperformed as the company’s flagship portfolio of GLP-1 drugs such as Wegovy lagged competitors in demand and efficacy for some health conditions. |
| Performance Past Does Not Indicate Future [Text] |
The investment return and principal value will fluctuate so that an investor's shares, when redeemed, may be worth more or less than the original cost. Past performance is not a good predictor of the Fund's future performance.
|
| Line Graph [Table Text Block] |
| Victory Diversified Stock Fund Class R6 - $31,811 | S&P 500® Index (regulatory broad based index) - $35,936 |
|---|
6/15 | $10,000 | $10,000 |
|---|
6/16 | $9,880 | $10,399 |
|---|
6/17 | $11,079 | $12,260 |
|---|
6/18 | $12,677 | $14,023 |
|---|
6/19 | $13,275 | $15,483 |
|---|
6/20 | $13,808 | $16,645 |
|---|
6/21 | $19,510 | $23,436 |
|---|
6/22 | $17,917 | $20,948 |
|---|
6/23 | $21,927 | $25,053 |
|---|
6/24 | $27,174 | $31,204 |
|---|
6/25 | $31,811 | $35,936 |
|---|
|
| Average Annual Return [Table Text Block] |
| 1 Year | 5 Year | 10 Year |
|---|
Class R6 | 17.06%Footnote Reference | 18.17%Footnote Reference | 12.27% |
|---|
S&P 500® Index | 15.16% | 16.64% | 13.65% |
|---|
|
| No Deduction of Taxes [Text Block] |
The graph and table total returns do not reflect the deduction of taxes that a shareholder would pay on Fund distributions, or redemption of shares.
|
| AssetsNet |
$ 339,653,000
|
| Holdings Count | Holding |
74
|
| Advisory Fees Paid, Amount |
$ 2,101,000
|
| InvestmentCompanyPortfolioTurnover |
92.00%
|
| Additional Fund Statistics [Text Block] |
FUND STATISTICS($ amounts in 000s)(as of June 30, 2025)Net Assets | $339,653 |
|---|
Number of Holdings | 74 |
|---|
Investment Advisory Fees | $2,101 |
|---|
Portfolio Turnover | 92% |
|---|
|
| Holdings [Text Block] |
Top SectorsFootnote Reference* (% of Net Assets)Footnote Reference(as of June 30, 2025)Value | Value |
|---|
Real Estate | 1.0% | Materials | 1.9% | Energy | 2.5% | Consumer Staples | 2.8% | Industrials | 7.9% | Communication Services | 10.8% | Consumer Discretionary | 12.1% | Health Care | 12.6% | Financials | 13.7% | Information TechnologyFootnote Reference** | 32.9% |
Top 10 HoldingsFootnote Reference* (% of Net Assets)Footnote Reference(as of June 30, 2025)NVIDIA Corp. | 6.7% |
|---|
Microsoft Corp. | 6.7% |
|---|
Apple, Inc. | 5.9% |
|---|
Alphabet, Inc., Class C | 3.8% |
|---|
Amazon.com, Inc. | 3.6% |
|---|
Meta Platforms, Inc., Class A | 3.3% |
|---|
Broadcom, Inc. | 3.1% |
|---|
Visa, Inc., Class A | 2.2% |
|---|
Eli Lilly & Co. | 1.9% |
|---|
Jabil, Inc. | 1.8% |
|---|
|
| Material Fund Change [Text Block] |
|
| C000111270 |
|
| Shareholder Report [Line Items] |
|
| Fund Name |
Victory Diversified Stock Fund
|
| Class Name |
Class Y
|
| Trading Symbol |
VDSYX
|
| Annual or Semi-Annual Statement [Text Block] |
Annual Shareholder Report
|
| Shareholder Report Annual or Semi-Annual |
annual shareholder report
|
| Additional Information [Text Block] |
You can find additional information about the Fund at advisor.vcm.com/literature/mutual-fund-prospectuses. You may also request more information by calling 800-539-3863 or visiting vcm.com/contact-us.
|
| Additional Information Phone Number |
800-539-3863
|
| Additional Information Website |
vcm.com
|
| Expenses [Text Block] |
What were the Fund's costs for the last year?(based on a hypothetical $10,000 investment) Class Name | Costs of a $10,000 Investment | Costs paid as a percentage of a $10,000 Investment |
|---|
Class Y | $93 | 0.86% |
|---|
| | |
|---|
|
| Expenses Paid, Amount |
$ 93
|
| Expense Ratio, Percent |
0.86%
|
| Factors Affecting Performance [Text Block] |
What affected the Fund’s performance during the last year?Top contributors to performance: • The Fund generated the strongest relative performance within the technology, communication services, and health care sectors. • Stocks that contributed most positively to the Fund’s relative performance were Interactive Brokers Group, Inc. and Broadcom, Inc. Top detractors from performance: • Stocks that contributed negatively to the Fund’s relative performance were Tesla, Inc. (“Tesla”) and Novo Nordisk A/S, ADR (“Novo Nordisk”). • The Fund was underweight to Tesla stock compared to the Index and the company’s shares rebounded sharply after the presidential election. We believe the rebound in share price suggests a favorable policy outlook for the company and its autonomous driving ambitions. • Novo Nordisk underperformed as the company’s flagship portfolio of GLP-1 drugs such as Wegovy lagged competitors in demand and efficacy for some health conditions. |
| Performance Past Does Not Indicate Future [Text] |
The investment return and principal value will fluctuate so that an investor's shares, when redeemed, may be worth more or less than the original cost. Past performance is not a good predictor of the Fund's future performance.
|
| Line Graph [Table Text Block] |
| Victory Diversified Stock Fund Class Y - $3,153,035 | S&P 500® Index (regulatory broad based index) - $3,593,619 |
|---|
6/15 | $1,000,000 | $1,000,000 |
|---|
6/16 | $986,651 | $1,039,928 |
|---|
6/17 | $1,105,938 | $1,226,034 |
|---|
6/18 | $1,263,355 | $1,402,264 |
|---|
6/19 | $1,321,847 | $1,548,344 |
|---|
6/20 | $1,373,879 | $1,664,549 |
|---|
6/21 | $1,939,739 | $2,343,588 |
|---|
6/22 | $1,780,732 | $2,094,797 |
|---|
6/23 | $2,177,066 | $2,505,253 |
|---|
6/24 | $2,695,856 | $3,120,445 |
|---|
6/25 | $3,153,035 | $3,593,619 |
|---|
|
| Average Annual Return [Table Text Block] |
| 1 Year | 5 Year | 10 Year |
|---|
Class Y | 16.96%Footnote Reference | 18.07%Footnote Reference | 12.17% |
|---|
S&P 500® Index | 15.16% | 16.64% | 13.65% |
|---|
|
| No Deduction of Taxes [Text Block] |
The graph and table total returns do not reflect the deduction of taxes that a shareholder would pay on Fund distributions, or redemption of shares.
|
| AssetsNet |
$ 339,653,000
|
| Holdings Count | Holding |
74
|
| Advisory Fees Paid, Amount |
$ 2,101,000
|
| InvestmentCompanyPortfolioTurnover |
92.00%
|
| Additional Fund Statistics [Text Block] |
FUND STATISTICS($ amounts in 000s)(as of June 30, 2025)Net Assets | $339,653 |
|---|
Number of Holdings | 74 |
|---|
Investment Advisory Fees | $2,101 |
|---|
Portfolio Turnover | 92% |
|---|
|
| Holdings [Text Block] |
Top SectorsFootnote Reference* (% of Net Assets)Footnote Reference(as of June 30, 2025)Value | Value |
|---|
Real Estate | 1.0% | Materials | 1.9% | Energy | 2.5% | Consumer Staples | 2.8% | Industrials | 7.9% | Communication Services | 10.8% | Consumer Discretionary | 12.1% | Health Care | 12.6% | Financials | 13.7% | Information TechnologyFootnote Reference** | 32.9% |
Top 10 HoldingsFootnote Reference* (% of Net Assets)Footnote Reference(as of June 30, 2025)NVIDIA Corp. | 6.7% |
|---|
Microsoft Corp. | 6.7% |
|---|
Apple, Inc. | 5.9% |
|---|
Alphabet, Inc., Class C | 3.8% |
|---|
Amazon.com, Inc. | 3.6% |
|---|
Meta Platforms, Inc., Class A | 3.3% |
|---|
Broadcom, Inc. | 3.1% |
|---|
Visa, Inc., Class A | 2.2% |
|---|
Eli Lilly & Co. | 1.9% |
|---|
Jabil, Inc. | 1.8% |
|---|
|
| Material Fund Change [Text Block] |
|
| C000002344 |
|
| Shareholder Report [Line Items] |
|
| Fund Name |
Victory Fund for Income
|
| Class Name |
Class A
|
| Trading Symbol |
IPFIX
|
| Annual or Semi-Annual Statement [Text Block] |
Annual Shareholder Report
|
| Shareholder Report Annual or Semi-Annual |
annual shareholder report
|
| Additional Information [Text Block] |
You can find additional information about the Fund at advisor.vcm.com/literature/mutual-fund-prospectuses. You may also request more information by calling 800-539-3863 or visiting vcm.com/contact-us.
|
| Additional Information Phone Number |
800-539-3863
|
| Additional Information Website |
vcm.com
|
| Expenses [Text Block] |
What were the Fund's costs for the last year?(based on a hypothetical $10,000 investment) Class Name | Costs of a $10,000 Investment | Costs paid as a percentage of a $10,000 Investment |
|---|
Class A | $94 | 0.91% |
|---|
| | |
|---|
|
| Expenses Paid, Amount |
$ 94
|
| Expense Ratio, Percent |
0.91%
|
| Factors Affecting Performance [Text Block] |
What affected the Fund’s performance during the last year?The Federal Reserve cut rates three times from September to December 2024, leaving the Federal Funds rate 1% less than where it was at the end of June 2024. We believe that the U.S. economy remained strong as the market appreciated strong balance sheets and solid employment. In response, the U.S. yield curve steepened, with yields at the short end falling the most, as bond prices typically move in the opposite direction of yields. The Fund's benchmark, the Bloomberg 1-5 year U.S. Government Bond Index (the “Index”), had significant and direct exposure to the very short end of the yield curve. The Index outperformed the Fund’s strong Government National Mortgage Association (“GNMA”) performance. Top contributors to performance: Throughout the year, the Fund added its GNMA single family pools. The Fund maintained its allocation to GNMA structure at 3% allocation. This small allocation to GNMA collateralized mortgage obligations provided a strong total return. The Fund’s primary exposure, approximately 80% to older high coupon GNMA, contributed the most to its total return. The Fund’s 17.2% allocation to U.S. Treasury bonds contributed almost as much to performance as its GNMA single family pools.
Top detractors from performance: |
| Performance Past Does Not Indicate Future [Text] |
The investment return and principal value will fluctuate so that an investor's shares, when redeemed, may be worth more or less than the original cost. Past performance is not a good predictor of the Fund's future performance.
|
| Line Graph [Table Text Block] |
| Victory Fund for Income Class A @ NAV - $11,233 | Victory Fund for Income Class A @ MOP - $10,983 | Bloomberg U.S. Aggregate Bond Index (regulatory broad based index) - $11,904 | Bloomberg 1-5 Year U.S. Government Bond Index - $11,709 |
|---|
6/15 | $10,000 | $9,778 | $10,000 | $10,000 |
|---|
6/16 | $10,233 | $10,006 | $10,600 | $10,239 |
|---|
6/17 | $10,107 | $9,882 | $10,567 | $10,186 |
|---|
6/18 | $10,044 | $9,820 | $10,525 | $10,147 |
|---|
6/19 | $10,508 | $10,274 | $11,353 | $10,649 |
|---|
6/20 | $10,904 | $10,661 | $12,345 | $11,217 |
|---|
6/21 | $10,800 | $10,560 | $12,304 | $11,181 |
|---|
6/22 | $10,258 | $10,030 | $11,038 | $10,637 |
|---|
6/23 | $10,212 | $9,985 | $10,934 | $10,597 |
|---|
6/24 | $10,645 | $10,409 | $11,222 | $11,035 |
|---|
6/25 | $11,233 | $10,983 | $11,904 | $11,709 |
|---|
|
| Average Annual Return [Table Text Block] |
| 1 Year | 5 Year | 10 Year |
|---|
Class A @ NAV | 5.52% | 0.60% | 1.17% |
|---|
Class A @ MOP | 3.11% | 0.13% | 0.94% |
|---|
Bloomberg U.S. Aggregate Bond Index | 6.08% | -0.73% | 1.76% |
|---|
Bloomberg 1-5 Year U.S. Government Bond Index | 6.11% | 0.86% | 1.59% |
|---|
|
| No Deduction of Taxes [Text Block] |
The graph and table total returns do not reflect the deduction of taxes that a shareholder would pay on Fund distributions, or redemption of shares.
|
| Previous Investment Adviser [Text Block] |
The maximum offering price (“MOP”) figures reflect a maximum sales charge of 2.25% for Class A. The Net Asset Value ("NAV") figures do not reflect sales charges.
|
| AssetsNet |
$ 336,568,000
|
| Holdings Count | Holding |
491
|
| Advisory Fees Paid, Amount |
$ 1,654,000
|
| InvestmentCompanyPortfolioTurnover |
22.00%
|
| Additional Fund Statistics [Text Block] |
FUND STATISTICS($ amounts in 000s)(as of June 30, 2025)Net Assets | $336,568 |
|---|
Number of Holdings | 491 |
|---|
Investment Advisory Fees | $1,654 |
|---|
Portfolio Turnover | 22% |
|---|
|
| Holdings [Text Block] |
Asset AllocationFootnote Reference* ^ (% of Net Assets)(as of June 30, 2025)Value | Value |
|---|
U.S. Government Agency Mortgages | 70.0% | U.S. Treasury Obligations | 26.7% | Collateralized Mortgage Obligations | 2.4% |
|
| Material Fund Change [Text Block] |
|
| C000002345 |
|
| Shareholder Report [Line Items] |
|
| Fund Name |
Victory Fund for Income
|
| Class Name |
Class C
|
| Trading Symbol |
VFFCX
|
| Annual or Semi-Annual Statement [Text Block] |
Annual Shareholder Report
|
| Shareholder Report Annual or Semi-Annual |
annual shareholder report
|
| Additional Information [Text Block] |
You can find additional information about the Fund at advisor.vcm.com/literature/mutual-fund-prospectuses. You may also request more information by calling 800-539-3863 or visiting vcm.com/contact-us.
|
| Additional Information Phone Number |
800-539-3863
|
| Additional Information Website |
vcm.com
|
| Expenses [Text Block] |
What were the Fund's costs for the last year?(based on a hypothetical $10,000 investment) Class Name | Costs of a $10,000 Investment | Costs paid as a percentage of a $10,000 Investment |
|---|
Class C | $175 | 1.71% |
|---|
| | |
|---|
|
| Expenses Paid, Amount |
$ 175
|
| Expense Ratio, Percent |
1.71%
|
| Factors Affecting Performance [Text Block] |
What affected the Fund’s performance during the last year?The Federal Reserve cut rates three times from September to December 2024, leaving the Federal Funds rate 1% less than where it was at the end of June 2024. We believe that the U.S. economy remained strong as the market appreciated strong balance sheets and solid employment. In response, the U.S. yield curve steepened, with yields at the short end falling the most, as bond prices typically move in the opposite direction of yields. The Fund's benchmark, the Bloomberg 1-5 year U.S. Government Bond Index (the “Index”), had significant and direct exposure to the very short end of the yield curve. The Index outperformed the Fund’s strong Government National Mortgage Association (“GNMA”) performance. Top contributors to performance: Throughout the year, the Fund added its GNMA single family pools. The Fund maintained its allocation to GNMA structure at 3% allocation. This small allocation to GNMA collateralized mortgage obligations provided a strong total return. The Fund’s primary exposure, approximately 80% to older high coupon GNMA, contributed the most to its total return. The Fund’s 17.2% allocation to U.S. Treasury bonds contributed almost as much to performance as its GNMA single family pools.
Top detractors from performance: |
| Performance Past Does Not Indicate Future [Text] |
The investment return and principal value will fluctuate so that an investor's shares, when redeemed, may be worth more or less than the original cost. Past performance is not a good predictor of the Fund's future performance.
|
| Line Graph [Table Text Block] |
| Victory Fund for Income Class C @ NAV - $10,542 | Victory Fund for Income Class C @ CDSC - $10,542 | Bloomberg U.S. Aggregate Bond Index (regulatory broad based index) - $11,904 | Bloomberg 1-5 Year U.S. Government Bond Index - $11,709 |
|---|
6/15 | $10,000 | $10,000 | $10,000 | $10,000 |
|---|
6/16 | $10,148 | $10,148 | $10,600 | $10,239 |
|---|
6/17 | $9,953 | $9,953 | $10,567 | $10,186 |
|---|
6/18 | $9,803 | $9,803 | $10,525 | $10,147 |
|---|
6/19 | $10,180 | $10,180 | $11,353 | $10,649 |
|---|
6/20 | $10,473 | $10,473 | $12,345 | $11,217 |
|---|
6/21 | $10,290 | $10,290 | $12,304 | $11,181 |
|---|
6/22 | $9,691 | $9,691 | $11,038 | $10,637 |
|---|
6/23 | $9,583 | $9,583 | $10,934 | $10,597 |
|---|
6/24 | $9,990 | $9,990 | $11,222 | $11,035 |
|---|
6/25 | $10,542 | $10,542 | $11,904 | $11,709 |
|---|
|
| Average Annual Return [Table Text Block] |
| 1 Year | 5 Year | 10 Year |
|---|
Class C @ NAV | 4.65% | -0.18% | 0.53% |
|---|
Class C @ CDSC | 3.65% | -0.18% | 0.53% |
|---|
Bloomberg U.S. Aggregate Bond Index | 6.08% | -0.73% | 1.76% |
|---|
Bloomberg 1-5 Year U.S. Government Bond Index | 6.11% | 0.86% | 1.59% |
|---|
|
| No Deduction of Taxes [Text Block] |
The graph and table total returns do not reflect the deduction of taxes that a shareholder would pay on Fund distributions, or redemption of shares.
|
| Previous Investment Adviser [Text Block] |
Class C is not subject to an initial sales charge, but is subject to Contingent Deferred Sales Charge (“CDSC”) of 1.00% on shares redeemed within one year of purchase. The Net Asset Value ("NAV") figures do not reflect sales charges.
|
| AssetsNet |
$ 336,568,000
|
| Holdings Count | Holding |
491
|
| Advisory Fees Paid, Amount |
$ 1,654,000
|
| InvestmentCompanyPortfolioTurnover |
22.00%
|
| Additional Fund Statistics [Text Block] |
FUND STATISTICS($ amounts in 000s)(as of June 30, 2025)Net Assets | $336,568 |
|---|
Number of Holdings | 491 |
|---|
Investment Advisory Fees | $1,654 |
|---|
Portfolio Turnover | 22% |
|---|
|
| Holdings [Text Block] |
Asset AllocationFootnote Reference* ^ (% of Net Assets)(as of June 30, 2025)Value | Value |
|---|
U.S. Government Agency Mortgages | 70.0% | U.S. Treasury Obligations | 26.7% | Collateralized Mortgage Obligations | 2.4% |
|
| Material Fund Change [Text Block] |
|
| C000098399 |
|
| Shareholder Report [Line Items] |
|
| Fund Name |
Victory Fund for Income
|
| Class Name |
Class I
|
| Trading Symbol |
VFFIX
|
| Annual or Semi-Annual Statement [Text Block] |
Annual Shareholder Report
|
| Shareholder Report Annual or Semi-Annual |
annual shareholder report
|
| Additional Information [Text Block] |
You can find additional information about the Fund at advisor.vcm.com/literature/mutual-fund-prospectuses. You may also request more information by calling 800-539-3863 or visiting vcm.com/contact-us.
|
| Additional Information Phone Number |
800-539-3863
|
| Additional Information Website |
vcm.com
|
| Expenses [Text Block] |
What were the Fund's costs for the last year?(based on a hypothetical $10,000 investment) Class Name | Costs of a $10,000 Investment | Costs paid as a percentage of a $10,000 Investment |
|---|
Class I | $66 | 0.64% |
|---|
| | |
|---|
|
| Expenses Paid, Amount |
$ 66
|
| Expense Ratio, Percent |
0.64%
|
| Factors Affecting Performance [Text Block] |
What affected the Fund’s performance during the last year?The Federal Reserve cut rates three times from September to December 2024, leaving the Federal Funds rate 1% less than where it was at the end of June 2024. We believe that the U.S. economy remained strong as the market appreciated strong balance sheets and solid employment. In response, the U.S. yield curve steepened, with yields at the short end falling the most, as bond prices typically move in the opposite direction of yields. The Fund's benchmark, the Bloomberg 1-5 year U.S. Government Bond Index (the “Index”), had significant and direct exposure to the very short end of the yield curve. The Index outperformed the Fund’s strong Government National Mortgage Association (“GNMA”) performance. Top contributors to performance: Throughout the year, the Fund added its GNMA single family pools. The Fund maintained its allocation to GNMA structure at 3% allocation. This small allocation to GNMA collateralized mortgage obligations provided a strong total return. The Fund’s primary exposure, approximately 80% to older high coupon GNMA, contributed the most to its total return. The Fund’s 17.2% allocation to U.S. Treasury bonds contributed almost as much to performance as its GNMA single family pools.
Top detractors from performance: |
| Performance Past Does Not Indicate Future [Text] |
The investment return and principal value will fluctuate so that an investor's shares, when redeemed, may be worth more or less than the original cost. Past performance is not a good predictor of the Fund's future performance.
|
| Line Graph [Table Text Block] |
| Victory Fund for Income Class I - $2,309,661 | Bloomberg U.S. Aggregate Bond Index (regulatory broad based index) - $2,380,754 | Bloomberg 1-5 Year U.S. Government Bond Index - $2,341,862 |
|---|
6/15 | $2,000,000 | $2,000,000 | $2,000,000 |
|---|
6/16 | $2,051,919 | $2,120,028 | $2,047,747 |
|---|
6/17 | $2,034,553 | $2,113,357 | $2,037,158 |
|---|
6/18 | $2,025,039 | $2,104,962 | $2,029,463 |
|---|
6/19 | $2,124,646 | $2,270,606 | $2,129,789 |
|---|
6/20 | $2,210,424 | $2,469,049 | $2,243,475 |
|---|
6/21 | $2,197,528 | $2,460,821 | $2,236,249 |
|---|
6/22 | $2,089,829 | $2,207,550 | $2,127,365 |
|---|
6/23 | $2,088,864 | $2,186,848 | $2,119,321 |
|---|
6/24 | $2,183,287 | $2,244,384 | $2,207,089 |
|---|
6/25 | $2,309,661 | $2,380,754 | $2,341,862 |
|---|
|
| Average Annual Return [Table Text Block] |
| 1 Year | 5 Year | 10 Year |
|---|
Class I | 5.79% | 0.88% | 1.45% |
|---|
Bloomberg U.S. Aggregate Bond Index | 6.08% | -0.73% | 1.76% |
|---|
Bloomberg 1-5 Year U.S. Government Bond Index | 6.11% | 0.86% | 1.59% |
|---|
|
| No Deduction of Taxes [Text Block] |
The graph and table total returns do not reflect the deduction of taxes that a shareholder would pay on Fund distributions, or redemption of shares.
|
| AssetsNet |
$ 336,568,000
|
| Holdings Count | Holding |
491
|
| Advisory Fees Paid, Amount |
$ 1,654,000
|
| InvestmentCompanyPortfolioTurnover |
22.00%
|
| Additional Fund Statistics [Text Block] |
FUND STATISTICS($ amounts in 000s)(as of June 30, 2025)Net Assets | $336,568 |
|---|
Number of Holdings | 491 |
|---|
Investment Advisory Fees | $1,654 |
|---|
Portfolio Turnover | 22% |
|---|
|
| Holdings [Text Block] |
Asset AllocationFootnote Reference* ^ (% of Net Assets)(as of June 30, 2025)Value | Value |
|---|
U.S. Government Agency Mortgages | 70.0% | U.S. Treasury Obligations | 26.7% | Collateralized Mortgage Obligations | 2.4% |
|
| Material Fund Change [Text Block] |
|
| C000002346 |
|
| Shareholder Report [Line Items] |
|
| Fund Name |
Victory Fund for Income
|
| Class Name |
Class R
|
| Trading Symbol |
GGIFX
|
| Annual or Semi-Annual Statement [Text Block] |
Annual Shareholder Report
|
| Shareholder Report Annual or Semi-Annual |
annual shareholder report
|
| Additional Information [Text Block] |
You can find additional information about the Fund at advisor.vcm.com/literature/mutual-fund-prospectuses. You may also request more information by calling 800-539-3863 or visiting vcm.com/contact-us.
|
| Additional Information Phone Number |
800-539-3863
|
| Additional Information Website |
vcm.com
|
| Expenses [Text Block] |
What were the Fund's costs for the last year?(based on a hypothetical $10,000 investment) Class Name | Costs of a $10,000 Investment | Costs paid as a percentage of a $10,000 Investment |
|---|
Class R | $94 | 0.91% |
|---|
| | |
|---|
|
| Expenses Paid, Amount |
$ 94
|
| Expense Ratio, Percent |
0.91%
|
| Factors Affecting Performance [Text Block] |
What affected the Fund’s performance during the last year?The Federal Reserve cut rates three times from September to December 2024, leaving the Federal Funds rate 1% less than where it was at the end of June 2024. We believe that the U.S. economy remained strong as the market appreciated strong balance sheets and solid employment. In response, the U.S. yield curve steepened, with yields at the short end falling the most, as bond prices typically move in the opposite direction of yields. The Fund's benchmark, the Bloomberg 1-5 year U.S. Government Bond Index (the “Index”), had significant and direct exposure to the very short end of the yield curve. The Index outperformed the Fund’s strong Government National Mortgage Association (“GNMA”) performance. Top contributors to performance: Throughout the year, the Fund added its GNMA single family pools. The Fund maintained its allocation to GNMA structure at 3% allocation. This small allocation to GNMA collateralized mortgage obligations provided a strong total return. The Fund’s primary exposure, approximately 80% to older high coupon GNMA, contributed the most to its total return. The Fund’s 17.2% allocation to U.S. Treasury bonds contributed almost as much to performance as its GNMA single family pools.
Top detractors from performance: |
| Performance Past Does Not Indicate Future [Text] |
The investment return and principal value will fluctuate so that an investor's shares, when redeemed, may be worth more or less than the original cost. Past performance is not a good predictor of the Fund's future performance.
|
| Line Graph [Table Text Block] |
| Victory Fund for Income Class R - $11,231 | Bloomberg U.S. Aggregate Bond Index (regulatory broad based index) - $11,904 | Bloomberg 1-5 Year U.S. Government Bond Index - $11,709 |
|---|
6/15 | $10,000 | $10,000 | $10,000 |
|---|
6/16 | $10,221 | $10,600 | $10,239 |
|---|
6/17 | $10,106 | $10,567 | $10,186 |
|---|
6/18 | $10,044 | $10,525 | $10,147 |
|---|
6/19 | $10,508 | $11,353 | $10,649 |
|---|
6/20 | $10,891 | $12,345 | $11,217 |
|---|
6/21 | $10,799 | $12,304 | $11,181 |
|---|
6/22 | $10,257 | $11,038 | $10,637 |
|---|
6/23 | $10,212 | $10,934 | $10,597 |
|---|
6/24 | $10,644 | $11,222 | $11,035 |
|---|
6/25 | $11,231 | $11,904 | $11,709 |
|---|
|
| Average Annual Return [Table Text Block] |
| 1 Year | 5 Year | 10 Year |
|---|
Class R | 5.51% | 0.62% | 1.17% |
|---|
Bloomberg U.S. Aggregate Bond Index | 6.08% | -0.73% | 1.76% |
|---|
Bloomberg 1-5 Year U.S. Government Bond Index | 6.11% | 0.86% | 1.59% |
|---|
|
| No Deduction of Taxes [Text Block] |
The graph and table total returns do not reflect the deduction of taxes that a shareholder would pay on Fund distributions, or redemption of shares.
|
| AssetsNet |
$ 336,568,000
|
| Holdings Count | Holding |
491
|
| Advisory Fees Paid, Amount |
$ 1,654,000
|
| InvestmentCompanyPortfolioTurnover |
22.00%
|
| Additional Fund Statistics [Text Block] |
FUND STATISTICS($ amounts in 000s)(as of June 30, 2025)Net Assets | $336,568 |
|---|
Number of Holdings | 491 |
|---|
Investment Advisory Fees | $1,654 |
|---|
Portfolio Turnover | 22% |
|---|
|
| Holdings [Text Block] |
Asset AllocationFootnote Reference* ^ (% of Net Assets)(as of June 30, 2025)Value | Value |
|---|
U.S. Government Agency Mortgages | 70.0% | U.S. Treasury Obligations | 26.7% | Collateralized Mortgage Obligations | 2.4% |
|
| Material Fund Change [Text Block] |
|
| C000155524 |
|
| Shareholder Report [Line Items] |
|
| Fund Name |
Victory Fund for Income
|
| Class Name |
Class R6
|
| Trading Symbol |
VFFRX
|
| Annual or Semi-Annual Statement [Text Block] |
Annual Shareholder Report
|
| Shareholder Report Annual or Semi-Annual |
annual shareholder report
|
| Additional Information [Text Block] |
You can find additional information about the Fund at advisor.vcm.com/literature/mutual-fund-prospectuses. You may also request more information by calling 800-539-3863 or visiting vcm.com/contact-us.
|
| Additional Information Phone Number |
800-539-3863
|
| Additional Information Website |
vcm.com
|
| Expenses [Text Block] |
What were the Fund's costs for the last year?(based on a hypothetical $10,000 investment) Class Name | Costs of a $10,000 Investment | Costs paid as a percentage of a $10,000 Investment |
|---|
Class R6 | $65 | 0.63% |
|---|
| | |
|---|
|
| Expenses Paid, Amount |
$ 65
|
| Expense Ratio, Percent |
0.63%
|
| Factors Affecting Performance [Text Block] |
What affected the Fund’s performance during the last year?The Federal Reserve cut rates three times from September to December 2024, leaving the Federal Funds rate 1% less than where it was at the end of June 2024. We believe that the U.S. economy remained strong as the market appreciated strong balance sheets and solid employment. In response, the U.S. yield curve steepened, with yields at the short end falling the most, as bond prices typically move in the opposite direction of yields. The Fund's benchmark, the Bloomberg 1-5 year U.S. Government Bond Index (the “Index”), had significant and direct exposure to the very short end of the yield curve. The Index outperformed the Fund’s strong Government National Mortgage Association (“GNMA”) performance. Top contributors to performance: Throughout the year, the Fund added its GNMA single family pools. The Fund maintained its allocation to GNMA structure at 3% allocation. This small allocation to GNMA collateralized mortgage obligations provided a strong total return. The Fund’s primary exposure, approximately 80% to older high coupon GNMA, contributed the most to its total return. The Fund’s 17.2% allocation to U.S. Treasury bonds contributed almost as much to performance as its GNMA single family pools.
Top detractors from performance: |
| Performance Past Does Not Indicate Future [Text] |
The investment return and principal value will fluctuate so that an investor's shares, when redeemed, may be worth more or less than the original cost. Past performance is not a good predictor of the Fund's future performance.
|
| Line Graph [Table Text Block] |
| Victory Fund for Income Class R6 - $11,548 | Bloomberg U.S. Aggregate Bond Index (regulatory broad based index) - $11,904 | Bloomberg 1-5 Year U.S. Government Bond Index - $11,709 |
|---|
6/15 | $10,000 | $10,000 | $10,000 |
|---|
6/16 | $10,251 | $10,600 | $10,239 |
|---|
6/17 | $10,162 | $10,567 | $10,186 |
|---|
6/18 | $10,127 | $10,525 | $10,147 |
|---|
6/19 | $10,626 | $11,353 | $10,649 |
|---|
6/20 | $11,045 | $12,345 | $11,217 |
|---|
6/21 | $10,983 | $12,304 | $11,181 |
|---|
6/22 | $10,444 | $11,038 | $10,637 |
|---|
6/23 | $10,426 | $10,934 | $10,597 |
|---|
6/24 | $10,930 | $11,222 | $11,035 |
|---|
6/25 | $11,548 | $11,904 | $11,709 |
|---|
|
| Average Annual Return [Table Text Block] |
| 1 Year | 5 Year | 10 Year |
|---|
Class R6 | 5.65% | 0.89% | 1.45% |
|---|
Bloomberg U.S. Aggregate Bond Index | 6.08% | -0.73% | 1.76% |
|---|
Bloomberg 1-5 Year U.S. Government Bond Index | 6.11% | 0.86% | 1.59% |
|---|
|
| No Deduction of Taxes [Text Block] |
The graph and table total returns do not reflect the deduction of taxes that a shareholder would pay on Fund distributions, or redemption of shares.
|
| AssetsNet |
$ 336,568,000
|
| Holdings Count | Holding |
491
|
| Advisory Fees Paid, Amount |
$ 1,654,000
|
| InvestmentCompanyPortfolioTurnover |
22.00%
|
| Additional Fund Statistics [Text Block] |
FUND STATISTICS($ amounts in 000s)(as of June 30, 2025)Net Assets | $336,568 |
|---|
Number of Holdings | 491 |
|---|
Investment Advisory Fees | $1,654 |
|---|
Portfolio Turnover | 22% |
|---|
|
| Holdings [Text Block] |
Asset AllocationFootnote Reference* ^ (% of Net Assets)(as of June 30, 2025)Value | Value |
|---|
U.S. Government Agency Mortgages | 70.0% | U.S. Treasury Obligations | 26.7% | Collateralized Mortgage Obligations | 2.4% |
|
| Material Fund Change [Text Block] |
|
| C000111273 |
|
| Shareholder Report [Line Items] |
|
| Fund Name |
Victory Fund for Income
|
| Class Name |
Class Y
|
| Trading Symbol |
VFFYX
|
| Annual or Semi-Annual Statement [Text Block] |
Annual Shareholder Report
|
| Shareholder Report Annual or Semi-Annual |
annual shareholder report
|
| Additional Information [Text Block] |
You can find additional information about the Fund at advisor.vcm.com/literature/mutual-fund-prospectuses. You may also request more information by calling 800-539-3863 or visiting vcm.com/contact-us.
|
| Additional Information Phone Number |
800-539-3863
|
| Additional Information Website |
vcm.com
|
| Expenses [Text Block] |
What were the Fund's costs for the last year?(based on a hypothetical $10,000 investment) Class Name | Costs of a $10,000 Investment | Costs paid as a percentage of a $10,000 Investment |
|---|
Class Y | $73 | 0.71% |
|---|
| | |
|---|
|
| Expenses Paid, Amount |
$ 73
|
| Expense Ratio, Percent |
0.71%
|
| Factors Affecting Performance [Text Block] |
What affected the Fund’s performance during the last year?The Federal Reserve cut rates three times from September to December 2024, leaving the Federal Funds rate 1% less than where it was at the end of June 2024. We believe that the U.S. economy remained strong as the market appreciated strong balance sheets and solid employment. In response, the U.S. yield curve steepened, with yields at the short end falling the most, as bond prices typically move in the opposite direction of yields. The Fund's benchmark, the Bloomberg 1-5 year U.S. Government Bond Index (the “Index”), had significant and direct exposure to the very short end of the yield curve. The Index outperformed the Fund’s strong Government National Mortgage Association (“GNMA”) performance. Top contributors to performance: Throughout the year, the Fund added its GNMA single family pools. The Fund maintained its allocation to GNMA structure at 3% allocation. This small allocation to GNMA collateralized mortgage obligations provided a strong total return. The Fund’s primary exposure, approximately 80% to older high coupon GNMA, contributed the most to its total return. The Fund’s 17.2% allocation to U.S. Treasury bonds contributed almost as much to performance as its GNMA single family pools.
Top detractors from performance: |
| Performance Past Does Not Indicate Future [Text] |
The investment return and principal value will fluctuate so that an investor's shares, when redeemed, may be worth more or less than the original cost. Past performance is not a good predictor of the Fund's future performance.
|
| Line Graph [Table Text Block] |
| Victory Fund for Income Class Y - $1,146,138 | Bloomberg U.S. Aggregate Bond Index (regulatory broad based index) - $1,190,377 | Bloomberg 1-5 Year U.S. Government Bond Index - $1,170,931 |
|---|
6/15 | $1,000,000 | $1,000,000 | $1,000,000 |
|---|
6/16 | $1,025,313 | $1,060,014 | $1,023,873 |
|---|
6/17 | $1,014,626 | $1,056,679 | $1,018,579 |
|---|
6/18 | $1,010,315 | $1,052,481 | $1,014,732 |
|---|
6/19 | $1,059,247 | $1,135,303 | $1,064,894 |
|---|
6/20 | $1,101,313 | $1,234,525 | $1,121,737 |
|---|
6/21 | $1,092,958 | $1,230,411 | $1,118,125 |
|---|
6/22 | $1,039,115 | $1,103,775 | $1,063,682 |
|---|
6/23 | $1,036,414 | $1,093,424 | $1,059,661 |
|---|
6/24 | $1,084,119 | $1,122,192 | $1,103,545 |
|---|
6/25 | $1,146,138 | $1,190,377 | $1,170,931 |
|---|
|
| Average Annual Return [Table Text Block] |
| 1 Year | 5 Year | 10 Year |
|---|
Class Y | 5.72% | 0.80% | 1.37% |
|---|
Bloomberg U.S. Aggregate Bond Index | 6.08% | -0.73% | 1.76% |
|---|
Bloomberg 1-5 Year U.S. Government Bond Index | 6.11% | 0.86% | 1.59% |
|---|
|
| No Deduction of Taxes [Text Block] |
The graph and table total returns do not reflect the deduction of taxes that a shareholder would pay on Fund distributions, or redemption of shares.
|
| AssetsNet |
$ 336,568,000
|
| Holdings Count | Holding |
491
|
| Advisory Fees Paid, Amount |
$ 1,654,000
|
| InvestmentCompanyPortfolioTurnover |
22.00%
|
| Additional Fund Statistics [Text Block] |
FUND STATISTICS($ amounts in 000s)(as of June 30, 2025)Net Assets | $336,568 |
|---|
Number of Holdings | 491 |
|---|
Investment Advisory Fees | $1,654 |
|---|
Portfolio Turnover | 22% |
|---|
|
| Holdings [Text Block] |
Asset AllocationFootnote Reference* ^ (% of Net Assets)(as of June 30, 2025)Value | Value |
|---|
U.S. Government Agency Mortgages | 70.0% | U.S. Treasury Obligations | 26.7% | Collateralized Mortgage Obligations | 2.4% |
|
| Material Fund Change [Text Block] |
|
| C000219862 |
|
| Shareholder Report [Line Items] |
|
| Fund Name |
Victory Fund for Income
|
| Class Name |
Member Class
|
| Trading Symbol |
VFFMX
|
| Annual or Semi-Annual Statement [Text Block] |
Annual Shareholder Report
|
| Shareholder Report Annual or Semi-Annual |
annual shareholder report
|
| Additional Information [Text Block] |
You can find additional information about the Fund at advisor.vcm.com/literature/mutual-fund-prospectuses. You may also request more information by calling 800-235-8396 or visiting vcm.com/contact-us.
|
| Additional Information Phone Number |
800-235-8396
|
| Additional Information Website |
vcm.com
|
| Expenses [Text Block] |
What were the Fund's costs for the last year?(based on a hypothetical $10,000 investment) Class Name | Costs of a $10,000 Investment | Costs paid as a percentage of a $10,000 Investment |
|---|
Member Class | $77 | 0.75% |
|---|
| | |
|---|
|
| Expenses Paid, Amount |
$ 77
|
| Expense Ratio, Percent |
0.75%
|
| Factors Affecting Performance [Text Block] |
What affected the Fund’s performance during the last year?The Federal Reserve cut rates three times from September to December 2024, leaving the Federal Funds rate 1% less than where it was at the end of June 2024. We believe that the U.S. economy remained strong as the market appreciated strong balance sheets and solid employment. In response, the U.S. yield curve steepened, with yields at the short end falling the most, as bond prices typically move in the opposite direction of yields. The Fund's benchmark, the Bloomberg 1-5 year U.S. Government Bond Index (the “Index”), had significant and direct exposure to the very short end of the yield curve. The Index outperformed the Fund’s strong Government National Mortgage Association (“GNMA”) performance. Top contributors to performance: Throughout the year, the Fund added its GNMA single family pools. The Fund maintained its allocation to GNMA structure at 3% allocation. This small allocation to GNMA collateralized mortgage obligations provided a strong total return. The Fund’s primary exposure, approximately 80% to older high coupon GNMA, contributed the most to its total return. The Fund’s 17.2% allocation to U.S. Treasury bonds contributed almost as much to performance as its GNMA single family pools.
Top detractors from performance: |
| Performance Past Does Not Indicate Future [Text] |
The investment return and principal value will fluctuate so that an investor's shares, when redeemed, may be worth more or less than the original cost. Past performance is not a good predictor of the Fund's future performance.
|
| Line Graph [Table Text Block] |
| Victory Fund for Income Member Class - $10,406 | Bloomberg U.S. Aggregate Bond Index (regulatory broad based index) - $9,619 | Bloomberg 1-5 Year U.S. Government Bond Index - $10,437 |
|---|
11/20Footnote Reference* | $10,000 | $10,000 | $10,000 |
|---|
6/21 | $9,942 | $9,942 | $9,967 |
|---|
6/22 | $9,447 | $8,919 | $9,481 |
|---|
6/23 | $9,420 | $8,835 | $9,446 |
|---|
6/24 | $9,848 | $9,068 | $9,837 |
|---|
6/25 | $10,406 | $9,619 | $10,437 |
|---|
|
| Average Annual Return [Table Text Block] |
| 1 Year | Since Inception |
|---|
Member Class | 5.66% | 0.86% |
|---|
Bloomberg U.S. Aggregate Bond Index | 6.08% | -0.83% |
|---|
Bloomberg 1-5 Year U.S. Government Bond Index | 6.11% | 0.92% |
|---|
|
| No Deduction of Taxes [Text Block] |
The graph and table total returns do not reflect the deduction of taxes that a shareholder would pay on Fund distributions, or redemption of shares.
|
| AssetsNet |
$ 336,568,000
|
| Holdings Count | Holding |
491
|
| Advisory Fees Paid, Amount |
$ 1,654,000
|
| InvestmentCompanyPortfolioTurnover |
22.00%
|
| Additional Fund Statistics [Text Block] |
FUND STATISTICS($ amounts in 000s)(as of June 30, 2025)Net Assets | $336,568 |
|---|
Number of Holdings | 491 |
|---|
Investment Advisory Fees | $1,654 |
|---|
Portfolio Turnover | 22% |
|---|
|
| Holdings [Text Block] |
Asset AllocationFootnote Reference* ^ (% of Net Assets)(as of June 30, 2025)Value | Value |
|---|
U.S. Government Agency Mortgages | 70.0% | U.S. Treasury Obligations | 26.7% | Collateralized Mortgage Obligations | 2.4% |
|
| Material Fund Change [Text Block] |
|
| C000002332 |
|
| Shareholder Report [Line Items] |
|
| Fund Name |
Victory Investment Grade Convertible Fund
|
| Class Name |
Class A
|
| Trading Symbol |
SBFCX
|
| Annual or Semi-Annual Statement [Text Block] |
Annual Shareholder Report
|
| Shareholder Report Annual or Semi-Annual |
annual shareholder report
|
| Additional Information [Text Block] |
You can find additional information about the Fund at advisor.vcm.com/literature/mutual-fund-prospectuses. You may also request more information by calling 800-539-3863 or visiting vcm.com/contact-us.
|
| Additional Information Phone Number |
800-539-3863
|
| Additional Information Website |
vcm.com
|
| Expenses [Text Block] |
What were the Fund's costs for the last year?(based on a hypothetical $10,000 investment) Class Name | Costs of a $10,000 Investment | Costs paid as a percentage of a $10,000 Investment |
|---|
Class A | $132 | 1.27% |
|---|
| | |
|---|
|
| Expenses Paid, Amount |
$ 132
|
| Expense Ratio, Percent |
1.27%
|
| Factors Affecting Performance [Text Block] |
What affected the Fund’s performance during the last year?The Fund invests in convertible bonds and convertible preferred stocks that are influenced by both the stock market and bond market. Stock market returns were positive over the last year, and this led to positive convertible returns as well. Furthermore, the fixed coupons and/or preferred dividends of the convertible holdings provided income to the Fund. As of June 30, 2025, the Fund is overweight compared to its benchmark in the health care, industrials, and information technology sectors. It is underweight compared to its benchmark in the real estate and utilities sectors. Otherwise, it is approximately equal weighted to other sectors. The Fund is broadly diversified across individual issues, economic sectors, credits, and convertible types. Top contributors to performance: Absolute performance of the Fund during the fiscal year ending June 30, 2025, was led by the financial sector, followed by the utilities and real estate sectors. Relative performance was helped by overweight positions in the health care and industrials sectors.
Top detractors from performance: |
| Performance Past Does Not Indicate Future [Text] |
The investment return and principal value will fluctuate so that an investor's shares, when redeemed, may be worth more or less than the original cost. Past performance is not a good predictor of the Fund's future performance.
|
| Line Graph [Table Text Block] |
| Victory Investment Grade Convertible Fund Class A @ NAV - $19,050 | Victory Investment Grade Convertible Fund Class A @ MOP - $18,615 | Bloomberg U.S. Aggregate Bond Index (regulatory broad based index) - $11,904 | ICE BofAML Investment Grade U.S. Conv 5% Constrained Index - $22,295 | ICE BofAML Investment Grade U.S. Convertible Index - $22,718 |
|---|
6/15 | $10,000 | $9,772 | $10,000 | $10,000 | $10,000 |
|---|
6/16 | $9,925 | $9,699 | $10,600 | $10,183 | $10,334 |
|---|
6/17 | $11,257 | $11,000 | $10,567 | $11,871 | $12,442 |
|---|
6/18 | $12,480 | $12,195 | $10,525 | $13,182 | $14,289 |
|---|
6/19 | $13,433 | $13,126 | $11,353 | $14,697 | $15,790 |
|---|
6/20 | $13,925 | $13,607 | $12,345 | $14,972 | $15,973 |
|---|
6/21 | $17,504 | $17,104 | $12,304 | $18,320 | $19,284 |
|---|
6/22 | $15,943 | $15,579 | $11,038 | $17,740 | $18,369 |
|---|
6/23 | $16,502 | $16,125 | $10,934 | $18,402 | $18,984 |
|---|
6/24 | $17,740 | $17,334 | $11,222 | $19,938 | $20,503 |
|---|
6/25 | $19,050 | $18,615 | $11,904 | $22,295 | $22,718 |
|---|
|
| Average Annual Return [Table Text Block] |
| 1 Year | 5 Year | 10 Year |
|---|
Class A @ NAV | 7.39% | 6.47% | 6.66% |
|---|
Class A @ MOP | 5.00% | 5.98% | 6.41% |
|---|
Bloomberg U.S. Aggregate Bond Index | 6.08% | -0.73% | 1.76% |
|---|
ICE BofAML Investment Grade U.S. Conv 5% Constrained Index | 11.83% | 8.29% | 8.35% |
|---|
ICE BofAML Investment Grade U.S. Convertible Index | 10.80% | 7.30% | 8.55% |
|---|
|
| No Deduction of Taxes [Text Block] |
The graph and table total returns do not reflect the deduction of taxes that a shareholder would pay on Fund distributions, or redemption of shares.
|
| Previous Investment Adviser [Text Block] |
The maximum offering price (“MOP”) figures reflect a maximum sales charge of 2.25% for Class A. The Net Asset Value ("NAV") figures do not reflect sales charges.
|
| AssetsNet |
$ 252,577,000
|
| Holdings Count | Holding |
55
|
| Advisory Fees Paid, Amount |
$ 2,034,000
|
| InvestmentCompanyPortfolioTurnover |
24.00%
|
| Additional Fund Statistics [Text Block] |
FUND STATISTICS($ amounts in 000s)(as of June 30, 2025)Net Assets | $252,577 |
|---|
Number of Holdings | 55 |
|---|
Investment Advisory Fees | $2,034 |
|---|
Portfolio Turnover | 24% |
|---|
|
| Holdings [Text Block] |
Top SectorsFootnote Reference* (% of Net Assets)Footnote Reference(as of June 30, 2025)Value | Value |
|---|
Materials | 0.6% | Information Technology | 3.7% | Health Care | 4.0% | Industrials | 8.8% | Consumer Discretionary | 9.8% | Real Estate | 13.3% | Utilities | 21.4% | Financials | 36.5% |
Top 10 HoldingsFootnote Reference* (% of Net Assets)Footnote Reference(as of June 30, 2025)Bank of America Corp., Series L, 7.25% | 5.5% |
|---|
Wells Fargo & Co., Series L, 7.50% | 5.3% |
|---|
Uber Technologies, Inc., 0.88%, 12/1/28 | 5.1% |
|---|
Apollo Global Management, Inc., 6.75%, 7/31/26 | 4.7% |
|---|
Ford Motor Credit Co. LLC, 0.00%, 3/15/26 | 4.0% |
|---|
Barclays Bank PLC, 1.00%, 2/16/29 | 3.9% |
|---|
Ares Management Corp., Series B, 6.75%, 10/1/27 | 3.5% |
|---|
Envista Holdings Corp., 1.75%, 8/15/28 | 3.3% |
|---|
American Water Capital Corp., 3.63%, 6/15/26 | 3.2% |
|---|
Welltower OP LLC, 2.75%, 5/15/28 | 3.2% |
|---|
|
| Material Fund Change [Text Block] |
|
| C000052112 |
|
| Shareholder Report [Line Items] |
|
| Fund Name |
Victory Investment Grade Convertible Fund
|
| Class Name |
Class I
|
| Trading Symbol |
VICIX
|
| Annual or Semi-Annual Statement [Text Block] |
Annual Shareholder Report
|
| Shareholder Report Annual or Semi-Annual |
annual shareholder report
|
| Additional Information [Text Block] |
You can find additional information about the Fund at advisor.vcm.com/literature/mutual-fund-prospectuses. You may also request more information by calling 800-539-3863 or visiting vcm.com/contact-us.
|
| Additional Information Phone Number |
800-539-3863
|
| Additional Information Website |
vcm.com
|
| Expenses [Text Block] |
What were the Fund's costs for the last year?(based on a hypothetical $10,000 investment) Class Name | Costs of a $10,000 Investment | Costs paid as a percentage of a $10,000 Investment |
|---|
Class I | $99 | 0.95% |
|---|
| | |
|---|
|
| Expenses Paid, Amount |
$ 99
|
| Expense Ratio, Percent |
0.95%
|
| Factors Affecting Performance [Text Block] |
What affected the Fund’s performance during the last year?The Fund invests in convertible bonds and convertible preferred stocks that are influenced by both the stock market and bond market. Stock market returns were positive over the last year, and this led to positive convertible returns as well. Furthermore, the fixed coupons and/or preferred dividends of the convertible holdings provided income to the Fund. As of June 30, 2025, the Fund is overweight compared to its benchmark in the health care, industrials, and information technology sectors. It is underweight compared to its benchmark in the real estate and utilities sectors. Otherwise, it is approximately equal weighted to other sectors. The Fund is broadly diversified across individual issues, economic sectors, credits, and convertible types. Top contributors to performance: Absolute performance of the Fund during the fiscal year ending June 30, 2025, was led by the financial sector, followed by the utilities and real estate sectors. Relative performance was helped by overweight positions in the health care and industrials sectors.
Top detractors from performance: |
| Performance Past Does Not Indicate Future [Text] |
The investment return and principal value will fluctuate so that an investor's shares, when redeemed, may be worth more or less than the original cost. Past performance is not a good predictor of the Fund's future performance.
|
| Line Graph [Table Text Block] |
| Victory Investment Grade Convertible Fund Class I - $3,959,054 | Bloomberg U.S. Aggregate Bond Index (regulatory broad based index) - $2,380,754 | ICE BofAML Investment Grade U.S. Conv 5% Constrained Index - $4,459,070 | ICE BofAML Investment Grade U.S. Convertible Index - $4,543,579 |
|---|
6/15 | $2,000,000 | $2,000,000 | $2,000,000 | $2,000,000 |
|---|
6/16 | $1,991,237 | $2,120,028 | $2,036,642 | $2,066,767 |
|---|
6/17 | $2,269,646 | $2,113,357 | $2,374,220 | $2,488,442 |
|---|
6/18 | $2,525,374 | $2,104,962 | $2,636,305 | $2,857,706 |
|---|
6/19 | $2,730,404 | $2,270,606 | $2,939,319 | $3,158,013 |
|---|
6/20 | $2,844,359 | $2,469,049 | $2,994,413 | $3,194,511 |
|---|
6/21 | $3,592,005 | $2,460,821 | $3,663,981 | $3,856,830 |
|---|
6/22 | $3,283,832 | $2,207,550 | $3,548,077 | $3,673,853 |
|---|
6/23 | $3,405,990 | $2,186,848 | $3,680,353 | $3,796,876 |
|---|
6/24 | $3,675,758 | $2,244,384 | $3,987,526 | $4,100,540 |
|---|
6/25 | $3,959,054 | $2,380,754 | $4,459,070 | $4,543,579 |
|---|
|
| Average Annual Return [Table Text Block] |
| 1 Year | 5 Year | 10 Year |
|---|
Class I | 7.71% | 6.84% | 7.07% |
|---|
Bloomberg U.S. Aggregate Bond Index | 6.08% | -0.73% | 1.76% |
|---|
ICE BofAML Investment Grade U.S. Conv 5% Constrained Index | 11.83% | 8.29% | 8.35% |
|---|
ICE BofAML Investment Grade U.S. Convertible Index | 10.80% | 7.30% | 8.55% |
|---|
|
| No Deduction of Taxes [Text Block] |
The graph and table total returns do not reflect the deduction of taxes that a shareholder would pay on Fund distributions, or redemption of shares.
|
| AssetsNet |
$ 252,577,000
|
| Holdings Count | Holding |
55
|
| Advisory Fees Paid, Amount |
$ 2,034,000
|
| InvestmentCompanyPortfolioTurnover |
24.00%
|
| Additional Fund Statistics [Text Block] |
FUND STATISTICS($ amounts in 000s)(as of June 30, 2025)Net Assets | $252,577 |
|---|
Number of Holdings | 55 |
|---|
Investment Advisory Fees | $2,034 |
|---|
Portfolio Turnover | 24% |
|---|
|
| Holdings [Text Block] |
Top SectorsFootnote Reference* (% of Net Assets)Footnote Reference(as of June 30, 2025)Value | Value |
|---|
Materials | 0.6% | Information Technology | 3.7% | Health Care | 4.0% | Industrials | 8.8% | Consumer Discretionary | 9.8% | Real Estate | 13.3% | Utilities | 21.4% | Financials | 36.5% |
Top 10 HoldingsFootnote Reference* (% of Net Assets)Footnote Reference(as of June 30, 2025)Bank of America Corp., Series L, 7.25% | 5.5% |
|---|
Wells Fargo & Co., Series L, 7.50% | 5.3% |
|---|
Uber Technologies, Inc., 0.88%, 12/1/28 | 5.1% |
|---|
Apollo Global Management, Inc., 6.75%, 7/31/26 | 4.7% |
|---|
Ford Motor Credit Co. LLC, 0.00%, 3/15/26 | 4.0% |
|---|
Barclays Bank PLC, 1.00%, 2/16/29 | 3.9% |
|---|
Ares Management Corp., Series B, 6.75%, 10/1/27 | 3.5% |
|---|
Envista Holdings Corp., 1.75%, 8/15/28 | 3.3% |
|---|
American Water Capital Corp., 3.63%, 6/15/26 | 3.2% |
|---|
Welltower OP LLC, 2.75%, 5/15/28 | 3.2% |
|---|
|
| Material Fund Change [Text Block] |
|
| C000219861 |
|
| Shareholder Report [Line Items] |
|
| Fund Name |
Victory Investment Grade Convertible Fund
|
| Class Name |
Member Class
|
| Trading Symbol |
SBFMX
|
| Annual or Semi-Annual Statement [Text Block] |
Annual Shareholder Report
|
| Shareholder Report Annual or Semi-Annual |
annual shareholder report
|
| Additional Information [Text Block] |
You can find additional information about the Fund at advisor.vcm.com/literature/mutual-fund-prospectuses. You may also request more information by calling 800-235-8396 or visiting vcm.com/contact-us.
|
| Additional Information Phone Number |
800-235-8396
|
| Additional Information Website |
vcm.com
|
| Expenses [Text Block] |
What were the Fund's costs for the last year?(based on a hypothetical $10,000 investment) Class Name | Costs of a $10,000 Investment | Costs paid as a percentage of a $10,000 Investment |
|---|
Member Class | $114 | 1.10% |
|---|
| | |
|---|
|
| Expenses Paid, Amount |
$ 114
|
| Expense Ratio, Percent |
1.10%
|
| Factors Affecting Performance [Text Block] |
What affected the Fund’s performance during the last year?The Fund invests in convertible bonds and convertible preferred stocks that are influenced by both the stock market and bond market. Stock market returns were positive over the last year, and this led to positive convertible returns as well. Furthermore, the fixed coupons and/or preferred dividends of the convertible holdings provided income to the Fund. As of June 30, 2025, the Fund is overweight compared to its benchmark in the health care, industrials, and information technology sectors. It is underweight compared to its benchmark in the real estate and utilities sectors. Otherwise, it is approximately equal weighted to other sectors. The Fund is broadly diversified across individual issues, economic sectors, credits, and convertible types. Top contributors to performance: Absolute performance of the Fund during the fiscal year ending June 30, 2025, was led by the financial sector, followed by the utilities and real estate sectors. Relative performance was helped by overweight positions in the health care and industrials sectors.
Top detractors from performance: |
| Performance Past Does Not Indicate Future [Text] |
The investment return and principal value will fluctuate so that an investor's shares, when redeemed, may be worth more or less than the original cost. Past performance is not a good predictor of the Fund's future performance.
|
| Line Graph [Table Text Block] |
| Victory Investment Grade Convertible Fund Member Class - $12,991 | Bloomberg U.S. Aggregate Bond Index (regulatory broad based index) - $9,619 | ICE BofAML Investment Grade U.S. Conv 5% Constrained Index - $14,086 | ICE BofAML Investment Grade U.S. Convertible Index - $13,300 |
|---|
11/20Footnote Reference* | $10,000 | $10,000 | $10,000 | $10,000 |
|---|
6/21 | $11,869 | $9,942 | $11,574 | $11,290 |
|---|
6/22 | $10,829 | $8,919 | $11,208 | $10,754 |
|---|
6/23 | $11,215 | $8,835 | $11,626 | $11,114 |
|---|
6/24 | $12,082 | $9,068 | $12,596 | $12,003 |
|---|
6/25 | $12,991 | $9,619 | $14,086 | $13,300 |
|---|
|
| Average Annual Return [Table Text Block] |
| 1 Year | Since Inception |
|---|
Member Class | 7.53% | 5.78% |
|---|
Bloomberg U.S. Aggregate Bond Index | 6.08% | -0.83% |
|---|
ICE BofAML Investment Grade U.S. Conv 5% Constrained Index | 11.83% | 7.63% |
|---|
ICE BofAML Investment Grade U.S. Convertible Index | 10.80% | 6.31% |
|---|
|
| No Deduction of Taxes [Text Block] |
The graph and table total returns do not reflect the deduction of taxes that a shareholder would pay on Fund distributions, or redemption of shares.
|
| AssetsNet |
$ 252,577,000
|
| Holdings Count | Holding |
55
|
| Advisory Fees Paid, Amount |
$ 2,034,000
|
| InvestmentCompanyPortfolioTurnover |
24.00%
|
| Additional Fund Statistics [Text Block] |
FUND STATISTICS($ amounts in 000s)(as of June 30, 2025)Net Assets | $252,577 |
|---|
Number of Holdings | 55 |
|---|
Investment Advisory Fees | $2,034 |
|---|
Portfolio Turnover | 24% |
|---|
|
| Holdings [Text Block] |
Top SectorsFootnote Reference* (% of Net Assets)Footnote Reference(as of June 30, 2025)Value | Value |
|---|
Materials | 0.6% | Information Technology | 3.7% | Health Care | 4.0% | Industrials | 8.8% | Consumer Discretionary | 9.8% | Real Estate | 13.3% | Utilities | 21.4% | Financials | 36.5% |
Top 10 HoldingsFootnote Reference* (% of Net Assets)Footnote Reference(as of June 30, 2025)Bank of America Corp., Series L, 7.25% | 5.5% |
|---|
Wells Fargo & Co., Series L, 7.50% | 5.3% |
|---|
Uber Technologies, Inc., 0.88%, 12/1/28 | 5.1% |
|---|
Apollo Global Management, Inc., 6.75%, 7/31/26 | 4.7% |
|---|
Ford Motor Credit Co. LLC, 0.00%, 3/15/26 | 4.0% |
|---|
Barclays Bank PLC, 1.00%, 2/16/29 | 3.9% |
|---|
Ares Management Corp., Series B, 6.75%, 10/1/27 | 3.5% |
|---|
Envista Holdings Corp., 1.75%, 8/15/28 | 3.3% |
|---|
American Water Capital Corp., 3.63%, 6/15/26 | 3.2% |
|---|
Welltower OP LLC, 2.75%, 5/15/28 | 3.2% |
|---|
|
| Material Fund Change [Text Block] |
|
| C000002334 |
|
| Shareholder Report [Line Items] |
|
| Fund Name |
Victory Sycamore Established Value Fund
|
| Class Name |
Class A
|
| Trading Symbol |
VETAX
|
| Annual or Semi-Annual Statement [Text Block] |
Annual Shareholder Report
|
| Shareholder Report Annual or Semi-Annual |
annual shareholder report
|
| Additional Information [Text Block] |
You can find additional information about the Fund at advisor.vcm.com/literature/mutual-fund-prospectuses. You may also request more information by calling 800-539-3863 or visiting vcm.com/contact-us.
|
| Additional Information Phone Number |
800-539-3863
|
| Additional Information Website |
vcm.com
|
| Expenses [Text Block] |
What were the Fund's costs for the last year?(based on a hypothetical $10,000 investment) Class Name | Costs of a $10,000 Investment | Costs paid as a percentage of a $10,000 Investment |
|---|
Class A | $91 | 0.89% |
|---|
| | |
|---|
|
| Expenses Paid, Amount |
$ 91
|
| Expense Ratio, Percent |
0.89%
|
| Factors Affecting Performance [Text Block] |
What affected the Fund’s performance during the last year?The Fund underperformed the Russell Midcap® Value Index (the “Index”) for the trailing 12-month period ended June 30, 2025. The Fund’s returns were positive across nine of the 11 major economic sectors, with only four sectors outpacing the Index. Financials was the top-performing sector, posting a return of 28.37%. By contrast, health care was the worst-performing sector, returning -7.17%. Top contributors to performance: • Stock selection in the consumer staples and materials sectors contributed positively to relative performance. However, the Fund’s overweight allocation to the materials sector almost entirely offset the positive relative performance of stock selection in the sector. Top detractors from performance: • For the trailing 12-month period ended June 30, 2025, stock selection and sector allocation both detracted from relative performance, with stock selection having a larger impact on relative underperformance for the period. • Stock selection in the industrials, information technology, energy, financials, and real estate sectors detracted for the relative performance for the period. • The Fund did not have exposure to the communication services sector, which we believe detracted from relative performance. • The Fund’s underweight allocation to the financials sector (the top-performing sector) also detracted from the Fund’s relative performance. |
| Performance Past Does Not Indicate Future [Text] |
The investment return and principal value will fluctuate so that an investor's shares, when redeemed, may be worth more or less than the original cost. Past performance is not a good predictor of the Fund's future performance.
|
| Line Graph [Table Text Block] |
| Victory Sycamore Established Value Fund Class A @ NAV - $25,860 | Victory Sycamore Established Value Fund Class A @ MOP - $24,376 | S&P 500® Index (regulatory broad based index) - $35,936 | Russell Midcap® Value Index - $22,387 |
|---|
6/15 | $10,000 | $9,426 | $10,000 | $10,000 |
|---|
6/16 | $10,676 | $10,063 | $10,399 | $10,325 |
|---|
6/17 | $12,378 | $11,667 | $12,260 | $11,969 |
|---|
6/18 | $13,761 | $12,971 | $14,023 | $12,878 |
|---|
6/19 | $14,511 | $13,678 | $15,483 | $13,352 |
|---|
6/20 | $13,313 | $12,549 | $16,645 | $11,775 |
|---|
6/21 | $20,703 | $19,515 | $23,436 | $18,023 |
|---|
6/22 | $19,770 | $18,636 | $20,948 | $16,221 |
|---|
6/23 | $22,394 | $21,109 | $25,053 | $17,925 |
|---|
6/24 | $24,793 | $23,370 | $31,204 | $20,072 |
|---|
6/25 | $25,860 | $24,376 | $35,936 | $22,387 |
|---|
|
| Average Annual Return [Table Text Block] |
| 1 Year | 5 Year | 10 Year |
|---|
Class A @ NAV | 4.31% | 14.20% | 9.97% |
|---|
Class A @ MOP | -1.69% | 12.86% | 9.32% |
|---|
S&P 500® Index | 15.16% | 16.64% | 13.65% |
|---|
Russell Midcap® Value Index | 11.53% | 13.71% | 8.39% |
|---|
|
| No Deduction of Taxes [Text Block] |
The graph and table total returns do not reflect the deduction of taxes that a shareholder would pay on Fund distributions, or redemption of shares.
|
| Previous Investment Adviser [Text Block] |
The maximum offering price (“MOP”) figures reflect a maximum sales charge of 5.75% for Class A. The Net Asset Value ("NAV") figures do not reflect sales charges.
|
| AssetsNet |
$ 17,290,915,000
|
| Holdings Count | Holding |
78
|
| Advisory Fees Paid, Amount |
$ 82,496,000
|
| InvestmentCompanyPortfolioTurnover |
45.00%
|
| Additional Fund Statistics [Text Block] |
FUND STATISTICS($ amounts in 000s)(as of June 30, 2025)Net Assets | $17,290,915 |
|---|
Number of Holdings | 78 |
|---|
Investment Advisory Fees | $82,496 |
|---|
Portfolio Turnover | 45% |
|---|
|
| Holdings [Text Block] |
Top SectorsFootnote Reference* (% of Net Assets)Footnote Reference(as of June 30, 2025)Value | Value |
|---|
Energy | 5.0% | Utilities | 5.2% | Health Care | 5.9% | Real Estate | 7.8% | Consumer Discretionary | 7.9% | Consumer Staples | 8.1% | Information Technology | 10.0% | Materials | 13.9% | Financials | 14.8% | Industrials | 18.3% |
Top 10 HoldingsFootnote Reference* (% of Net Assets)Footnote Reference(as of June 30, 2025)U.S. Foods Holding Corp. | 2.5% |
|---|
Alliant Energy Corp. | 2.4% |
|---|
Quest Diagnostics, Inc. | 2.0% |
|---|
Crown Holdings, Inc. | 2.0% |
|---|
Fidelity National Financial, Inc. | 1.9% |
|---|
Performance Food Group Co. | 1.9% |
|---|
Willis Towers Watson PLC | 1.9% |
|---|
Genpact Ltd. | 1.8% |
|---|
Expedia Group, Inc. | 1.8% |
|---|
American Water Works Co., Inc. | 1.8% |
|---|
|
| Material Fund Change [Text Block] |
|
| C000169232 |
|
| Shareholder Report [Line Items] |
|
| Fund Name |
Victory Sycamore Established Value Fund
|
| Class Name |
Class C
|
| Trading Symbol |
VEVCX
|
| Annual or Semi-Annual Statement [Text Block] |
Annual Shareholder Report
|
| Shareholder Report Annual or Semi-Annual |
annual shareholder report
|
| Additional Information [Text Block] |
You can find additional information about the Fund at advisor.vcm.com/literature/mutual-fund-prospectuses. You may also request more information by calling 800-539-3863 or visiting vcm.com/contact-us.
|
| Additional Information Phone Number |
800-539-3863
|
| Additional Information Website |
vcm.com
|
| Expenses [Text Block] |
What were the Fund's costs for the last year?(based on a hypothetical $10,000 investment) Class Name | Costs of a $10,000 Investment | Costs paid as a percentage of a $10,000 Investment |
|---|
Class C | $173 | 1.70% |
|---|
| | |
|---|
|
| Expenses Paid, Amount |
$ 173
|
| Expense Ratio, Percent |
1.70%
|
| Factors Affecting Performance [Text Block] |
What affected the Fund’s performance during the last year?The Fund underperformed the Russell Midcap® Value Index (the “Index”) for the trailing 12-month period ended June 30, 2025. The Fund’s returns were positive across nine of the 11 major economic sectors, with only four sectors outpacing the Index. Financials was the top-performing sector, posting a return of 28.37%. By contrast, health care was the worst-performing sector, returning -7.17%. Top contributors to performance: • Stock selection in the consumer staples and materials sectors contributed positively to relative performance. However, the Fund’s overweight allocation to the materials sector almost entirely offset the positive relative performance of stock selection in the sector. Top detractors from performance: • For the trailing 12-month period ended June 30, 2025, stock selection and sector allocation both detracted from relative performance, with stock selection having a larger impact on relative underperformance for the period. • Stock selection in the industrials, information technology, energy, financials, and real estate sectors detracted for the relative performance for the period. • The Fund did not have exposure to the communication services sector, which we believe detracted from relative performance. • The Fund’s underweight allocation to the financials sector (the top-performing sector) also detracted from the Fund’s relative performance. |
| Performance Past Does Not Indicate Future [Text] |
The investment return and principal value will fluctuate so that an investor's shares, when redeemed, may be worth more or less than the original cost. Past performance is not a good predictor of the Fund's future performance.
|
| Line Graph [Table Text Block] |
| Victory Sycamore Established Value Fund Class C @ NAV - $25,806 | Victory Sycamore Established Value Fund Class C @ CDSC - $25,806 | S&P 500® Index (regulatory broad based index) - $37,807 | Russell Midcap® Value Index - $24,814 |
|---|
2/16Footnote Reference* | $10,000 | $10,000 | $10,000 | $10,000 |
|---|
6/16 | $11,303 | $11,303 | $10,941 | $11,444 |
|---|
6/17 | $13,002 | $13,002 | $12,898 | $13,266 |
|---|
6/18 | $14,341 | $14,341 | $14,753 | $14,274 |
|---|
6/19 | $15,009 | $15,009 | $16,289 | $14,799 |
|---|
6/20 | $13,666 | $13,666 | $17,512 | $13,051 |
|---|
6/21 | $21,088 | $21,088 | $24,656 | $19,977 |
|---|
6/22 | $19,987 | $19,987 | $22,038 | $17,980 |
|---|
6/23 | $22,465 | $22,465 | $26,357 | $19,868 |
|---|
6/24 | $24,741 | $24,741 | $32,829 | $22,248 |
|---|
6/25 | $25,806 | $25,806 | $37,807 | $24,814 |
|---|
|
| Average Annual Return [Table Text Block] |
| 1 Year | 5 Year | Since Inception |
|---|
Class C @ NAV | 3.40% | 13.31% | 10.69% |
|---|
Class C @ CDSC | 2.46% | 13.31% | 10.69% |
|---|
S&P 500® Index | 15.16% | 16.64% | 15.31% |
|---|
Russell Midcap® Value Index | 11.53% | 13.71% | 10.23% |
|---|
|
| No Deduction of Taxes [Text Block] |
The graph and table total returns do not reflect the deduction of taxes that a shareholder would pay on Fund distributions, or redemption of shares.
|
| Previous Investment Adviser [Text Block] |
Class C is not subject to an initial sales charge, but is subject to Contingent Deferred Sales Charge (“CDSC”) of 1.00% on shares redeemed within one year of purchase. The Net Asset Value ("NAV") figures do not reflect sales charges.
|
| AssetsNet |
$ 17,290,915,000
|
| Holdings Count | Holding |
78
|
| Advisory Fees Paid, Amount |
$ 82,496,000
|
| InvestmentCompanyPortfolioTurnover |
45.00%
|
| Additional Fund Statistics [Text Block] |
FUND STATISTICS($ amounts in 000s)(as of June 30, 2025)Net Assets | $17,290,915 |
|---|
Number of Holdings | 78 |
|---|
Investment Advisory Fees | $82,496 |
|---|
Portfolio Turnover | 45% |
|---|
|
| Holdings [Text Block] |
Top SectorsFootnote Reference* (% of Net Assets)Footnote Reference(as of June 30, 2025)Value | Value |
|---|
Energy | 5.0% | Utilities | 5.2% | Health Care | 5.9% | Real Estate | 7.8% | Consumer Discretionary | 7.9% | Consumer Staples | 8.1% | Information Technology | 10.0% | Materials | 13.9% | Financials | 14.8% | Industrials | 18.3% |
Top 10 HoldingsFootnote Reference* (% of Net Assets)Footnote Reference(as of June 30, 2025)U.S. Foods Holding Corp. | 2.5% |
|---|
Alliant Energy Corp. | 2.4% |
|---|
Quest Diagnostics, Inc. | 2.0% |
|---|
Crown Holdings, Inc. | 2.0% |
|---|
Fidelity National Financial, Inc. | 1.9% |
|---|
Performance Food Group Co. | 1.9% |
|---|
Willis Towers Watson PLC | 1.9% |
|---|
Genpact Ltd. | 1.8% |
|---|
Expedia Group, Inc. | 1.8% |
|---|
American Water Works Co., Inc. | 1.8% |
|---|
|
| Material Fund Change [Text Block] |
|
| C000052114 |
|
| Shareholder Report [Line Items] |
|
| Fund Name |
Victory Sycamore Established Value Fund
|
| Class Name |
Class I
|
| Trading Symbol |
VEVIX
|
| Annual or Semi-Annual Statement [Text Block] |
Annual Shareholder Report
|
| Shareholder Report Annual or Semi-Annual |
annual shareholder report
|
| Additional Information [Text Block] |
You can find additional information about the Fund at advisor.vcm.com/literature/mutual-fund-prospectuses. You may also request more information by calling 800-539-3863 or visiting vcm.com/contact-us.
|
| Additional Information Phone Number |
800-539-3863
|
| Additional Information Website |
vcm.com
|
| Expenses [Text Block] |
What were the Fund's costs for the last year?(based on a hypothetical $10,000 investment) Class Name | Costs of a $10,000 Investment | Costs paid as a percentage of a $10,000 Investment |
|---|
Class I | $59 | 0.58% |
|---|
| | |
|---|
|
| Expenses Paid, Amount |
$ 59
|
| Expense Ratio, Percent |
0.58%
|
| Factors Affecting Performance [Text Block] |
What affected the Fund’s performance during the last year?The Fund underperformed the Russell Midcap® Value Index (the “Index”) for the trailing 12-month period ended June 30, 2025. The Fund’s returns were positive across nine of the 11 major economic sectors, with only four sectors outpacing the Index. Financials was the top-performing sector, posting a return of 28.37%. By contrast, health care was the worst-performing sector, returning -7.17%. Top contributors to performance: • Stock selection in the consumer staples and materials sectors contributed positively to relative performance. However, the Fund’s overweight allocation to the materials sector almost entirely offset the positive relative performance of stock selection in the sector. Top detractors from performance: • For the trailing 12-month period ended June 30, 2025, stock selection and sector allocation both detracted from relative performance, with stock selection having a larger impact on relative underperformance for the period. • Stock selection in the industrials, information technology, energy, financials, and real estate sectors detracted for the relative performance for the period. • The Fund did not have exposure to the communication services sector, which we believe detracted from relative performance. • The Fund’s underweight allocation to the financials sector (the top-performing sector) also detracted from the Fund’s relative performance. |
| Performance Past Does Not Indicate Future [Text] |
The investment return and principal value will fluctuate so that an investor's shares, when redeemed, may be worth more or less than the original cost. Past performance is not a good predictor of the Fund's future performance.
|
| Line Graph [Table Text Block] |
| Victory Sycamore Established Value Fund Class I - $5,334,727 | S&P 500® Index (regulatory broad based index) - $7,187,237 | Russell Midcap® Value Index - $4,477,408 |
|---|
6/15 | $2,000,000 | $2,000,000 | $2,000,000 |
|---|
6/16 | $2,142,987 | $2,079,856 | $2,064,917 |
|---|
6/17 | $2,490,618 | $2,452,067 | $2,393,765 |
|---|
6/18 | $2,777,083 | $2,804,528 | $2,575,578 |
|---|
6/19 | $2,938,050 | $3,096,689 | $2,670,393 |
|---|
6/20 | $2,703,938 | $3,329,098 | $2,354,969 |
|---|
6/21 | $4,218,241 | $4,687,176 | $3,604,610 |
|---|
6/22 | $4,040,859 | $4,189,593 | $3,244,260 |
|---|
6/23 | $4,592,034 | $5,010,506 | $3,584,995 |
|---|
6/24 | $5,099,867 | $6,240,890 | $4,014,387 |
|---|
6/25 | $5,334,727 | $7,187,237 | $4,477,408 |
|---|
|
| Average Annual Return [Table Text Block] |
| 1 Year | 5 Year | 10 Year |
|---|
Class I | 4.61% | 14.56% | 10.31% |
|---|
S&P 500® Index | 15.16% | 16.64% | 13.65% |
|---|
Russell Midcap® Value Index | 11.53% | 13.71% | 8.39% |
|---|
|
| No Deduction of Taxes [Text Block] |
The graph and table total returns do not reflect the deduction of taxes that a shareholder would pay on Fund distributions, or redemption of shares.
|
| AssetsNet |
$ 17,290,915,000
|
| Holdings Count | Holding |
78
|
| Advisory Fees Paid, Amount |
$ 82,496,000
|
| InvestmentCompanyPortfolioTurnover |
45.00%
|
| Additional Fund Statistics [Text Block] |
FUND STATISTICS($ amounts in 000s)(as of June 30, 2025)Net Assets | $17,290,915 |
|---|
Number of Holdings | 78 |
|---|
Investment Advisory Fees | $82,496 |
|---|
Portfolio Turnover | 45% |
|---|
|
| Holdings [Text Block] |
Top SectorsFootnote Reference* (% of Net Assets)Footnote Reference(as of June 30, 2025)Value | Value |
|---|
Energy | 5.0% | Utilities | 5.2% | Health Care | 5.9% | Real Estate | 7.8% | Consumer Discretionary | 7.9% | Consumer Staples | 8.1% | Information Technology | 10.0% | Materials | 13.9% | Financials | 14.8% | Industrials | 18.3% |
Top 10 HoldingsFootnote Reference* (% of Net Assets)Footnote Reference(as of June 30, 2025)U.S. Foods Holding Corp. | 2.5% |
|---|
Alliant Energy Corp. | 2.4% |
|---|
Quest Diagnostics, Inc. | 2.0% |
|---|
Crown Holdings, Inc. | 2.0% |
|---|
Fidelity National Financial, Inc. | 1.9% |
|---|
Performance Food Group Co. | 1.9% |
|---|
Willis Towers Watson PLC | 1.9% |
|---|
Genpact Ltd. | 1.8% |
|---|
Expedia Group, Inc. | 1.8% |
|---|
American Water Works Co., Inc. | 1.8% |
|---|
|
| Material Fund Change [Text Block] |
|
| C000002335 |
|
| Shareholder Report [Line Items] |
|
| Fund Name |
Victory Sycamore Established Value Fund
|
| Class Name |
Class R
|
| Trading Symbol |
GETGX
|
| Annual or Semi-Annual Statement [Text Block] |
Annual Shareholder Report
|
| Shareholder Report Annual or Semi-Annual |
annual shareholder report
|
| Additional Information [Text Block] |
You can find additional information about the Fund at advisor.vcm.com/literature/mutual-fund-prospectuses. You may also request more information by calling 800-539-3863 or visiting vcm.com/contact-us.
|
| Additional Information Phone Number |
800-539-3863
|
| Additional Information Website |
vcm.com
|
| Expenses [Text Block] |
What were the Fund's costs for the last year?(based on a hypothetical $10,000 investment) Class Name | Costs of a $10,000 Investment | Costs paid as a percentage of a $10,000 Investment |
|---|
Class R | $111 | 1.09% |
|---|
| | |
|---|
|
| Expenses Paid, Amount |
$ 111
|
| Expense Ratio, Percent |
1.09%
|
| Factors Affecting Performance [Text Block] |
What affected the Fund’s performance during the last year?The Fund underperformed the Russell Midcap® Value Index (the “Index”) for the trailing 12-month period ended June 30, 2025. The Fund’s returns were positive across nine of the 11 major economic sectors, with only four sectors outpacing the Index. Financials was the top-performing sector, posting a return of 28.37%. By contrast, health care was the worst-performing sector, returning -7.17%. Top contributors to performance: • Stock selection in the consumer staples and materials sectors contributed positively to relative performance. However, the Fund’s overweight allocation to the materials sector almost entirely offset the positive relative performance of stock selection in the sector. Top detractors from performance: • For the trailing 12-month period ended June 30, 2025, stock selection and sector allocation both detracted from relative performance, with stock selection having a larger impact on relative underperformance for the period. • Stock selection in the industrials, information technology, energy, financials, and real estate sectors detracted for the relative performance for the period. • The Fund did not have exposure to the communication services sector, which we believe detracted from relative performance. • The Fund’s underweight allocation to the financials sector (the top-performing sector) also detracted from the Fund’s relative performance. |
| Performance Past Does Not Indicate Future [Text] |
The investment return and principal value will fluctuate so that an investor's shares, when redeemed, may be worth more or less than the original cost. Past performance is not a good predictor of the Fund's future performance.
|
| Line Graph [Table Text Block] |
| Victory Sycamore Established Value Fund Class R - $25,336 | S&P 500® Index (regulatory broad based index) - $35,936 | Russell Midcap® Value Index - $22,387 |
|---|
6/15 | $10,000 | $10,000 | $10,000 |
|---|
6/16 | $10,656 | $10,399 | $10,325 |
|---|
6/17 | $12,327 | $12,260 | $11,969 |
|---|
6/18 | $13,682 | $14,023 | $12,878 |
|---|
6/19 | $14,397 | $15,483 | $13,352 |
|---|
6/20 | $13,183 | $16,645 | $11,775 |
|---|
6/21 | $20,458 | $23,436 | $18,023 |
|---|
6/22 | $19,495 | $20,948 | $16,221 |
|---|
6/23 | $22,034 | $25,053 | $17,925 |
|---|
6/24 | $24,347 | $31,204 | $20,072 |
|---|
6/25 | $25,336 | $35,936 | $22,387 |
|---|
|
| Average Annual Return [Table Text Block] |
| 1 Year | 5 Year | 10 Year |
|---|
Class R | 4.06% | 13.96% | 9.74% |
|---|
S&P 500® Index | 15.16% | 16.64% | 13.65% |
|---|
Russell Midcap® Value Index | 11.53% | 13.71% | 8.39% |
|---|
|
| No Deduction of Taxes [Text Block] |
The graph and table total returns do not reflect the deduction of taxes that a shareholder would pay on Fund distributions, or redemption of shares.
|
| AssetsNet |
$ 17,290,915,000
|
| Holdings Count | Holding |
78
|
| Advisory Fees Paid, Amount |
$ 82,496,000
|
| InvestmentCompanyPortfolioTurnover |
45.00%
|
| Additional Fund Statistics [Text Block] |
FUND STATISTICS($ amounts in 000s)(as of June 30, 2025)Net Assets | $17,290,915 |
|---|
Number of Holdings | 78 |
|---|
Investment Advisory Fees | $82,496 |
|---|
Portfolio Turnover | 45% |
|---|
|
| Holdings [Text Block] |
Top SectorsFootnote Reference* (% of Net Assets)Footnote Reference(as of June 30, 2025)Value | Value |
|---|
Energy | 5.0% | Utilities | 5.2% | Health Care | 5.9% | Real Estate | 7.8% | Consumer Discretionary | 7.9% | Consumer Staples | 8.1% | Information Technology | 10.0% | Materials | 13.9% | Financials | 14.8% | Industrials | 18.3% |
Top 10 HoldingsFootnote Reference* (% of Net Assets)Footnote Reference(as of June 30, 2025)U.S. Foods Holding Corp. | 2.5% |
|---|
Alliant Energy Corp. | 2.4% |
|---|
Quest Diagnostics, Inc. | 2.0% |
|---|
Crown Holdings, Inc. | 2.0% |
|---|
Fidelity National Financial, Inc. | 1.9% |
|---|
Performance Food Group Co. | 1.9% |
|---|
Willis Towers Watson PLC | 1.9% |
|---|
Genpact Ltd. | 1.8% |
|---|
Expedia Group, Inc. | 1.8% |
|---|
American Water Works Co., Inc. | 1.8% |
|---|
|
| Material Fund Change [Text Block] |
|
| C000138366 |
|
| Shareholder Report [Line Items] |
|
| Fund Name |
Victory Sycamore Established Value Fund
|
| Class Name |
Class R6
|
| Trading Symbol |
VEVRX
|
| Annual or Semi-Annual Statement [Text Block] |
Annual Shareholder Report
|
| Shareholder Report Annual or Semi-Annual |
annual shareholder report
|
| Additional Information [Text Block] |
You can find additional information about the Fund at advisor.vcm.com/literature/mutual-fund-prospectuses. You may also request more information by calling 800-539-3863 or visiting vcm.com/contact-us.
|
| Additional Information Phone Number |
800-539-3863
|
| Additional Information Website |
vcm.com
|
| Expenses [Text Block] |
What were the Fund's costs for the last year?(based on a hypothetical $10,000 investment) Class Name | Costs of a $10,000 Investment | Costs paid as a percentage of a $10,000 Investment |
|---|
Class R6 | $55 | 0.54% |
|---|
| | |
|---|
|
| Expenses Paid, Amount |
$ 55
|
| Expense Ratio, Percent |
0.54%
|
| Factors Affecting Performance [Text Block] |
What affected the Fund’s performance during the last year?The Fund underperformed the Russell Midcap® Value Index (the “Index”) for the trailing 12-month period ended June 30, 2025. The Fund’s returns were positive across nine of the 11 major economic sectors, with only four sectors outpacing the Index. Financials was the top-performing sector, posting a return of 28.37%. By contrast, health care was the worst-performing sector, returning -7.17%. Top contributors to performance: • Stock selection in the consumer staples and materials sectors contributed positively to relative performance. However, the Fund’s overweight allocation to the materials sector almost entirely offset the positive relative performance of stock selection in the sector. Top detractors from performance: • For the trailing 12-month period ended June 30, 2025, stock selection and sector allocation both detracted from relative performance, with stock selection having a larger impact on relative underperformance for the period. • Stock selection in the industrials, information technology, energy, financials, and real estate sectors detracted for the relative performance for the period. • The Fund did not have exposure to the communication services sector, which we believe detracted from relative performance. • The Fund’s underweight allocation to the financials sector (the top-performing sector) also detracted from the Fund’s relative performance. |
| Performance Past Does Not Indicate Future [Text] |
The investment return and principal value will fluctuate so that an investor's shares, when redeemed, may be worth more or less than the original cost. Past performance is not a good predictor of the Fund's future performance.
|
| Line Graph [Table Text Block] |
| Victory Sycamore Established Value Fund Class R6 - $26,784 | S&P 500® Index (regulatory broad based index) - $35,936 | Russell Midcap® Value Index - $22,387 |
|---|
6/15 | $10,000 | $10,000 | $10,000 |
|---|
6/16 | $10,714 | $10,399 | $10,325 |
|---|
6/17 | $12,465 | $12,260 | $11,969 |
|---|
6/18 | $13,911 | $14,023 | $12,878 |
|---|
6/19 | $14,717 | $15,483 | $13,352 |
|---|
6/20 | $13,547 | $16,645 | $11,775 |
|---|
6/21 | $21,144 | $23,436 | $18,023 |
|---|
6/22 | $20,264 | $20,948 | $16,221 |
|---|
6/23 | $23,035 | $25,053 | $17,925 |
|---|
6/24 | $25,597 | $31,204 | $20,072 |
|---|
6/25 | $26,784 | $35,936 | $22,387 |
|---|
|
| Average Annual Return [Table Text Block] |
| 1 Year | 5 Year | 10 Year |
|---|
Class R6 | 4.64% | 14.61% | 10.35% |
|---|
S&P 500® Index | 15.16% | 16.64% | 13.65% |
|---|
Russell Midcap® Value Index | 11.53% | 13.71% | 8.39% |
|---|
|
| No Deduction of Taxes [Text Block] |
The graph and table total returns do not reflect the deduction of taxes that a shareholder would pay on Fund distributions, or redemption of shares.
|
| AssetsNet |
$ 17,290,915,000
|
| Holdings Count | Holding |
78
|
| Advisory Fees Paid, Amount |
$ 82,496,000
|
| InvestmentCompanyPortfolioTurnover |
45.00%
|
| Additional Fund Statistics [Text Block] |
FUND STATISTICS($ amounts in 000s)(as of June 30, 2025)Net Assets | $17,290,915 |
|---|
Number of Holdings | 78 |
|---|
Investment Advisory Fees | $82,496 |
|---|
Portfolio Turnover | 45% |
|---|
|
| Holdings [Text Block] |
Top SectorsFootnote Reference* (% of Net Assets)Footnote Reference(as of June 30, 2025)Value | Value |
|---|
Energy | 5.0% | Utilities | 5.2% | Health Care | 5.9% | Real Estate | 7.8% | Consumer Discretionary | 7.9% | Consumer Staples | 8.1% | Information Technology | 10.0% | Materials | 13.9% | Financials | 14.8% | Industrials | 18.3% |
Top 10 HoldingsFootnote Reference* (% of Net Assets)Footnote Reference(as of June 30, 2025)U.S. Foods Holding Corp. | 2.5% |
|---|
Alliant Energy Corp. | 2.4% |
|---|
Quest Diagnostics, Inc. | 2.0% |
|---|
Crown Holdings, Inc. | 2.0% |
|---|
Fidelity National Financial, Inc. | 1.9% |
|---|
Performance Food Group Co. | 1.9% |
|---|
Willis Towers Watson PLC | 1.9% |
|---|
Genpact Ltd. | 1.8% |
|---|
Expedia Group, Inc. | 1.8% |
|---|
American Water Works Co., Inc. | 1.8% |
|---|
|
| Material Fund Change [Text Block] |
|
| C000111271 |
|
| Shareholder Report [Line Items] |
|
| Fund Name |
Victory Sycamore Established Value Fund
|
| Class Name |
Class Y
|
| Trading Symbol |
VEVYX
|
| Annual or Semi-Annual Statement [Text Block] |
Annual Shareholder Report
|
| Shareholder Report Annual or Semi-Annual |
annual shareholder report
|
| Additional Information [Text Block] |
You can find additional information about the Fund at advisor.vcm.com/literature/mutual-fund-prospectuses. You may also request more information by calling 800-539-3863 or visiting vcm.com/contact-us.
|
| Additional Information Phone Number |
800-539-3863
|
| Additional Information Website |
vcm.com
|
| Expenses [Text Block] |
What were the Fund's costs for the last year?(based on a hypothetical $10,000 investment) Class Name | Costs of a $10,000 Investment | Costs paid as a percentage of a $10,000 Investment |
|---|
Class Y | $67 | 0.66% |
|---|
| | |
|---|
|
| Expenses Paid, Amount |
$ 67
|
| Expense Ratio, Percent |
0.66%
|
| Factors Affecting Performance [Text Block] |
What affected the Fund’s performance during the last year?The Fund underperformed the Russell Midcap® Value Index (the “Index”) for the trailing 12-month period ended June 30, 2025. The Fund’s returns were positive across nine of the 11 major economic sectors, with only four sectors outpacing the Index. Financials was the top-performing sector, posting a return of 28.37%. By contrast, health care was the worst-performing sector, returning -7.17%. Top contributors to performance: • Stock selection in the consumer staples and materials sectors contributed positively to relative performance. However, the Fund’s overweight allocation to the materials sector almost entirely offset the positive relative performance of stock selection in the sector. Top detractors from performance: • For the trailing 12-month period ended June 30, 2025, stock selection and sector allocation both detracted from relative performance, with stock selection having a larger impact on relative underperformance for the period. • Stock selection in the industrials, information technology, energy, financials, and real estate sectors detracted for the relative performance for the period. • The Fund did not have exposure to the communication services sector, which we believe detracted from relative performance. • The Fund’s underweight allocation to the financials sector (the top-performing sector) also detracted from the Fund’s relative performance. |
| Performance Past Does Not Indicate Future [Text] |
The investment return and principal value will fluctuate so that an investor's shares, when redeemed, may be worth more or less than the original cost. Past performance is not a good predictor of the Fund's future performance.
|
| Line Graph [Table Text Block] |
| Victory Sycamore Established Value Fund Class Y - $2,654,263 | S&P 500® Index (regulatory broad based index) - $3,593,619 | Russell Midcap® Value Index - $2,238,704 |
|---|
6/15 | $1,000,000 | $1,000,000 | $1,000,000 |
|---|
6/16 | $1,069,656 | $1,039,928 | $1,032,458 |
|---|
6/17 | $1,243,340 | $1,226,034 | $1,196,883 |
|---|
6/18 | $1,386,503 | $1,402,264 | $1,287,789 |
|---|
6/19 | $1,466,550 | $1,548,344 | $1,335,196 |
|---|
6/20 | $1,349,192 | $1,664,549 | $1,177,484 |
|---|
6/21 | $2,104,541 | $2,343,588 | $1,802,305 |
|---|
6/22 | $2,015,229 | $2,094,797 | $1,622,130 |
|---|
6/23 | $2,288,174 | $2,505,253 | $1,792,497 |
|---|
6/24 | $2,539,244 | $3,120,445 | $2,007,194 |
|---|
6/25 | $2,654,263 | $3,593,619 | $2,238,704 |
|---|
|
| Average Annual Return [Table Text Block] |
| 1 Year | 5 Year | 10 Year |
|---|
Class Y | 4.53% | 14.49% | 10.25% |
|---|
S&P 500® Index | 15.16% | 16.64% | 13.65% |
|---|
Russell Midcap® Value Index | 11.53% | 13.71% | 8.39% |
|---|
|
| No Deduction of Taxes [Text Block] |
The graph and table total returns do not reflect the deduction of taxes that a shareholder would pay on Fund distributions, or redemption of shares.
|
| AssetsNet |
$ 17,290,915,000
|
| Holdings Count | Holding |
78
|
| Advisory Fees Paid, Amount |
$ 82,496,000
|
| InvestmentCompanyPortfolioTurnover |
45.00%
|
| Additional Fund Statistics [Text Block] |
FUND STATISTICS($ amounts in 000s)(as of June 30, 2025)Net Assets | $17,290,915 |
|---|
Number of Holdings | 78 |
|---|
Investment Advisory Fees | $82,496 |
|---|
Portfolio Turnover | 45% |
|---|
|
| Holdings [Text Block] |
Top SectorsFootnote Reference* (% of Net Assets)Footnote Reference(as of June 30, 2025)Value | Value |
|---|
Energy | 5.0% | Utilities | 5.2% | Health Care | 5.9% | Real Estate | 7.8% | Consumer Discretionary | 7.9% | Consumer Staples | 8.1% | Information Technology | 10.0% | Materials | 13.9% | Financials | 14.8% | Industrials | 18.3% |
Top 10 HoldingsFootnote Reference* (% of Net Assets)Footnote Reference(as of June 30, 2025)U.S. Foods Holding Corp. | 2.5% |
|---|
Alliant Energy Corp. | 2.4% |
|---|
Quest Diagnostics, Inc. | 2.0% |
|---|
Crown Holdings, Inc. | 2.0% |
|---|
Fidelity National Financial, Inc. | 1.9% |
|---|
Performance Food Group Co. | 1.9% |
|---|
Willis Towers Watson PLC | 1.9% |
|---|
Genpact Ltd. | 1.8% |
|---|
Expedia Group, Inc. | 1.8% |
|---|
American Water Works Co., Inc. | 1.8% |
|---|
|
| Material Fund Change [Text Block] |
|
| C000002356 |
|
| Shareholder Report [Line Items] |
|
| Fund Name |
Victory Sycamore Small Company Opportunity Fund
|
| Class Name |
Class A
|
| Trading Symbol |
SSGSX
|
| Annual or Semi-Annual Statement [Text Block] |
Annual Shareholder Report
|
| Shareholder Report Annual or Semi-Annual |
annual shareholder report
|
| Additional Information [Text Block] |
You can find additional information about the Fund at advisor.vcm.com/literature/mutual-fund-prospectuses. You may also request more information by calling 800-539-3863 or visiting vcm.com/contact-us.
|
| Additional Information Phone Number |
800-539-3863
|
| Additional Information Website |
vcm.com
|
| Expenses [Text Block] |
What were the Fund's costs for the last year?(based on a hypothetical $10,000 investment) Class Name | Costs of a $10,000 Investment | Costs paid as a percentage of a $10,000 Investment |
|---|
Class A | $124 | 1.23% |
|---|
| | |
|---|
|
| Expenses Paid, Amount |
$ 124
|
| Expense Ratio, Percent |
1.23%
|
| Factors Affecting Performance [Text Block] |
What affected the Fund’s performance during the last year?The Fund underperformed the Russell 2000® Value Index (the “Index”) for the trailing 12-month period ended June 30, 2025. The Fund’s returns were positive across eight of the 11 major economic sectors, with only seven sectors outpacing the Index. Communication services was the top-performing sector, posting a return of 21.38%. By contrast, energy was the worst-performing sector for the period, returning -24.98%. Top contributors to performance: • The Fund’s underweight position in the health care sector was a positive contributor to performance relative to the Index; and • Stock selection in the consumer discretionary, health care and utilities sectors contributed positively to performance. Top detractors from performance: • For the trailing 12-month period ended June 30, 2025, stock selection was the primary driver of relative underperformance, while sector allocation partially offset the negative relative performance from stock selection for the period. • Stock selection in the information technology sector detracted most from the Fund relative performance. However, the Fund’s overweight position in the information technology sector partially offset the unfavorable impact of stock selection. • Stock selection in the materials and energy sectors also detracted from relative performance. However, the Fund’s underweight position in the energy sector (the worst-performing sector) partially offset the negative relative performance of stock selection in the sector. • The Fund’s underweight positions in the financials and communication services (the top-performing sector) sectors detracted from relative performance. |
| Performance Past Does Not Indicate Future [Text] |
The investment return and principal value will fluctuate so that an investor's shares, when redeemed, may be worth more or less than the original cost. Past performance is not a good predictor of the Fund's future performance.
|
| Line Graph [Table Text Block] |
| Victory Sycamore Small Company Opportunity Fund Class A @ NAV - $21,624 | Victory Sycamore Small Company Opportunity Fund Class A @ MOP - $20,379 | Russell 3000® Index (regulatory broad based index) - $33,822 | Russell 2000® Value Index - $19,158 |
|---|
6/15 | $10,000 | $9,424 | $10,000 | $10,000 |
|---|
6/16 | $10,185 | $9,599 | $10,214 | $9,742 |
|---|
6/17 | $12,670 | $11,940 | $12,104 | $12,163 |
|---|
6/18 | $14,472 | $13,639 | $13,893 | $13,757 |
|---|
6/19 | $14,904 | $14,046 | $15,141 | $12,899 |
|---|
6/20 | $12,927 | $12,183 | $16,130 | $10,645 |
|---|
6/21 | $19,968 | $18,819 | $23,253 | $18,445 |
|---|
6/22 | $18,150 | $17,106 | $20,029 | $15,442 |
|---|
6/23 | $20,343 | $19,172 | $23,825 | $16,370 |
|---|
6/24 | $21,343 | $20,114 | $29,335 | $18,153 |
|---|
6/25 | $21,624 | $20,379 | $33,822 | $19,158 |
|---|
|
| Average Annual Return [Table Text Block] |
| 1 Year | 5 Year | 10 Year |
|---|
Class A @ NAV | 1.32% | 10.84% | 8.02% |
|---|
Class A @ MOP | -4.50% | 9.53% | 7.38% |
|---|
Russell 3000® Index | 15.30% | 15.96% | 12.96% |
|---|
Russell 2000® Value Index | 5.54% | 12.47% | 6.72% |
|---|
|
| No Deduction of Taxes [Text Block] |
The graph and table total returns do not reflect the deduction of taxes that a shareholder would pay on Fund distributions, or redemption of shares.
|
| Previous Investment Adviser [Text Block] |
The maximum offering price (“MOP”) figures reflect a maximum sales charge of 5.75% for Class A. The Net Asset Value ("NAV") figures do not reflect sales charges.
|
| AssetsNet |
$ 5,605,590,000
|
| Holdings Count | Holding |
113
|
| Advisory Fees Paid, Amount |
$ 48,162,000
|
| InvestmentCompanyPortfolioTurnover |
50.00%
|
| Additional Fund Statistics [Text Block] |
FUND STATISTICS($ amounts in 000s)(as of June 30, 2025)Net Assets | $5,605,590 |
|---|
Number of Holdings | 113 |
|---|
Investment Advisory Fees | $48,162 |
|---|
Portfolio Turnover | 50% |
|---|
|
| Holdings [Text Block] |
Top SectorsFootnote Reference* (% of Net Assets)Footnote Reference(as of June 30, 2025)Value | Value |
|---|
Utilities | 2.6% | Health Care | 4.0% | Consumer Staples | 4.7% | Energy | 4.7% | Real Estate | 5.2% | Materials | 7.6% | Information Technology | 8.9% | Consumer Discretionary | 9.2% | Industrials | 21.6% | FinancialsFootnote Reference** | 28.5% |
Top 10 HoldingsFootnote Reference* (% of Net Assets)Footnote Reference(as of June 30, 2025)Renasant Corp. | 1.6% |
|---|
Old National Bancorp | 1.6% |
|---|
United Bankshares, Inc. | 1.6% |
|---|
National Bank Holdings Corp., Class A | 1.4% |
|---|
Stock Yards Bancorp, Inc. | 1.4% |
|---|
Commercial Metals Co. | 1.3% |
|---|
The Hanover Insurance Group, Inc. | 1.3% |
|---|
UMB Financial Corp. | 1.3% |
|---|
SouthState Corp. | 1.3% |
|---|
Tower Semiconductor Ltd. | 1.3% |
|---|
|
| Material Fund Change [Text Block] |
|
| C000052116 |
|
| Shareholder Report [Line Items] |
|
| Fund Name |
Victory Sycamore Small Company Opportunity Fund
|
| Class Name |
Class I
|
| Trading Symbol |
VSOIX
|
| Annual or Semi-Annual Statement [Text Block] |
Annual Shareholder Report
|
| Shareholder Report Annual or Semi-Annual |
annual shareholder report
|
| Additional Information [Text Block] |
You can find additional information about the Fund at advisor.vcm.com/literature/mutual-fund-prospectuses. You may also request more information by calling 800-539-3863 or visiting vcm.com/contact-us.
|
| Additional Information Phone Number |
800-539-3863
|
| Additional Information Website |
vcm.com
|
| Expenses [Text Block] |
What were the Fund's costs for the last year?(based on a hypothetical $10,000 investment) Class Name | Costs of a $10,000 Investment | Costs paid as a percentage of a $10,000 Investment |
|---|
Class I | $91 | 0.90% |
|---|
| | |
|---|
|
| Expenses Paid, Amount |
$ 91
|
| Expense Ratio, Percent |
0.90%
|
| Factors Affecting Performance [Text Block] |
What affected the Fund’s performance during the last year?The Fund underperformed the Russell 2000® Value Index (the “Index”) for the trailing 12-month period ended June 30, 2025. The Fund’s returns were positive across eight of the 11 major economic sectors, with only seven sectors outpacing the Index. Communication services was the top-performing sector, posting a return of 21.38%. By contrast, energy was the worst-performing sector for the period, returning -24.98%. Top contributors to performance: • The Fund’s underweight position in the health care sector was a positive contributor to performance relative to the Index; and • Stock selection in the consumer discretionary, health care and utilities sectors contributed positively to performance. Top detractors from performance: • For the trailing 12-month period ended June 30, 2025, stock selection was the primary driver of relative underperformance, while sector allocation partially offset the negative relative performance from stock selection for the period. • Stock selection in the information technology sector detracted most from the Fund relative performance. However, the Fund’s overweight position in the information technology sector partially offset the unfavorable impact of stock selection. • Stock selection in the materials and energy sectors also detracted from relative performance. However, the Fund’s underweight position in the energy sector (the worst-performing sector) partially offset the negative relative performance of stock selection in the sector. • The Fund’s underweight positions in the financials and communication services (the top-performing sector) sectors detracted from relative performance. |
| Performance Past Does Not Indicate Future [Text] |
The investment return and principal value will fluctuate so that an investor's shares, when redeemed, may be worth more or less than the original cost. Past performance is not a good predictor of the Fund's future performance.
|
| Line Graph [Table Text Block] |
| Victory Sycamore Small Company Opportunity Fund Class I - $4,472,639 | Russell 3000® Index (regulatory broad based index) - $6,764,414 | Russell 2000® Value Index - $3,831,600 |
|---|
6/15 | $2,000,000 | $2,000,000 | $2,000,000 |
|---|
6/16 | $2,043,133 | $2,042,767 | $1,948,364 |
|---|
6/17 | $2,549,633 | $2,420,872 | $2,432,668 |
|---|
6/18 | $2,921,619 | $2,778,631 | $2,751,328 |
|---|
6/19 | $3,019,218 | $3,028,221 | $2,579,771 |
|---|
6/20 | $2,627,735 | $3,225,951 | $2,128,905 |
|---|
6/21 | $4,072,584 | $4,650,674 | $3,688,958 |
|---|
6/22 | $3,715,051 | $4,005,829 | $3,088,379 |
|---|
6/23 | $4,179,340 | $4,765,080 | $3,273,914 |
|---|
6/24 | $4,400,400 | $5,867,009 | $3,630,631 |
|---|
6/25 | $4,472,639 | $6,764,414 | $3,831,600 |
|---|
|
| Average Annual Return [Table Text Block] |
| 1 Year | 5 Year | 10 Year |
|---|
Class I | 1.64% | 11.22% | 8.38% |
|---|
Russell 3000® Index | 15.30% | 15.96% | 12.96% |
|---|
Russell 2000® Value Index | 5.54% | 12.47% | 6.72% |
|---|
|
| No Deduction of Taxes [Text Block] |
The graph and table total returns do not reflect the deduction of taxes that a shareholder would pay on Fund distributions, or redemption of shares.
|
| AssetsNet |
$ 5,605,590,000
|
| Holdings Count | Holding |
113
|
| Advisory Fees Paid, Amount |
$ 48,162,000
|
| InvestmentCompanyPortfolioTurnover |
50.00%
|
| Additional Fund Statistics [Text Block] |
FUND STATISTICS($ amounts in 000s)(as of June 30, 2025)Net Assets | $5,605,590 |
|---|
Number of Holdings | 113 |
|---|
Investment Advisory Fees | $48,162 |
|---|
Portfolio Turnover | 50% |
|---|
|
| Holdings [Text Block] |
Top SectorsFootnote Reference* (% of Net Assets)Footnote Reference(as of June 30, 2025)Value | Value |
|---|
Utilities | 2.6% | Health Care | 4.0% | Consumer Staples | 4.7% | Energy | 4.7% | Real Estate | 5.2% | Materials | 7.6% | Information Technology | 8.9% | Consumer Discretionary | 9.2% | Industrials | 21.6% | FinancialsFootnote Reference** | 28.5% |
Top 10 HoldingsFootnote Reference* (% of Net Assets)Footnote Reference(as of June 30, 2025)Renasant Corp. | 1.6% |
|---|
Old National Bancorp | 1.6% |
|---|
United Bankshares, Inc. | 1.6% |
|---|
National Bank Holdings Corp., Class A | 1.4% |
|---|
Stock Yards Bancorp, Inc. | 1.4% |
|---|
Commercial Metals Co. | 1.3% |
|---|
The Hanover Insurance Group, Inc. | 1.3% |
|---|
UMB Financial Corp. | 1.3% |
|---|
SouthState Corp. | 1.3% |
|---|
Tower Semiconductor Ltd. | 1.3% |
|---|
|
| Material Fund Change [Text Block] |
|
| C000002357 |
|
| Shareholder Report [Line Items] |
|
| Fund Name |
Victory Sycamore Small Company Opportunity Fund
|
| Class Name |
Class R
|
| Trading Symbol |
GOGFX
|
| Annual or Semi-Annual Statement [Text Block] |
Annual Shareholder Report
|
| Shareholder Report Annual or Semi-Annual |
annual shareholder report
|
| Additional Information [Text Block] |
You can find additional information about the Fund at advisor.vcm.com/literature/mutual-fund-prospectuses. You may also request more information by calling 800-539-3863 or visiting vcm.com/contact-us.
|
| Additional Information Phone Number |
800-539-3863
|
| Additional Information Website |
vcm.com
|
| Expenses [Text Block] |
What were the Fund's costs for the last year?(based on a hypothetical $10,000 investment) Class Name | Costs of a $10,000 Investment | Costs paid as a percentage of a $10,000 Investment |
|---|
Class R | $145 | 1.44% |
|---|
| | |
|---|
|
| Expenses Paid, Amount |
$ 145
|
| Expense Ratio, Percent |
1.44%
|
| Factors Affecting Performance [Text Block] |
What affected the Fund’s performance during the last year?The Fund underperformed the Russell 2000® Value Index (the “Index”) for the trailing 12-month period ended June 30, 2025. The Fund’s returns were positive across eight of the 11 major economic sectors, with only seven sectors outpacing the Index. Communication services was the top-performing sector, posting a return of 21.38%. By contrast, energy was the worst-performing sector for the period, returning -24.98%. Top contributors to performance: • The Fund’s underweight position in the health care sector was a positive contributor to performance relative to the Index; and • Stock selection in the consumer discretionary, health care and utilities sectors contributed positively to performance. Top detractors from performance: • For the trailing 12-month period ended June 30, 2025, stock selection was the primary driver of relative underperformance, while sector allocation partially offset the negative relative performance from stock selection for the period. • Stock selection in the information technology sector detracted most from the Fund relative performance. However, the Fund’s overweight position in the information technology sector partially offset the unfavorable impact of stock selection. • Stock selection in the materials and energy sectors also detracted from relative performance. However, the Fund’s underweight position in the energy sector (the worst-performing sector) partially offset the negative relative performance of stock selection in the sector. • The Fund’s underweight positions in the financials and communication services (the top-performing sector) sectors detracted from relative performance. |
| Performance Past Does Not Indicate Future [Text] |
The investment return and principal value will fluctuate so that an investor's shares, when redeemed, may be worth more or less than the original cost. Past performance is not a good predictor of the Fund's future performance.
|
| Line Graph [Table Text Block] |
| Victory Sycamore Small Company Opportunity Fund Class R - $21,198 | Russell 3000® Index (regulatory broad based index) - $33,822 | Russell 2000® Value Index - $19,158 |
|---|
6/15 | $10,000 | $10,000 | $10,000 |
|---|
6/16 | $10,165 | $10,214 | $9,742 |
|---|
6/17 | $12,618 | $12,104 | $12,163 |
|---|
6/18 | $14,378 | $13,893 | $13,757 |
|---|
6/19 | $14,774 | $15,141 | $12,899 |
|---|
6/20 | $12,793 | $16,130 | $10,645 |
|---|
6/21 | $19,728 | $23,253 | $18,445 |
|---|
6/22 | $17,903 | $20,029 | $15,442 |
|---|
6/23 | $20,031 | $23,825 | $16,370 |
|---|
6/24 | $20,974 | $29,335 | $18,153 |
|---|
6/25 | $21,198 | $33,822 | $19,158 |
|---|
|
| Average Annual Return [Table Text Block] |
| 1 Year | 5 Year | 10 Year |
|---|
Class R | 1.06% | 10.63% | 7.80% |
|---|
Russell 3000® Index | 15.30% | 15.96% | 12.96% |
|---|
Russell 2000® Value Index | 5.54% | 12.47% | 6.72% |
|---|
|
| No Deduction of Taxes [Text Block] |
The graph and table total returns do not reflect the deduction of taxes that a shareholder would pay on Fund distributions, or redemption of shares.
|
| AssetsNet |
$ 5,605,590,000
|
| Holdings Count | Holding |
113
|
| Advisory Fees Paid, Amount |
$ 48,162,000
|
| InvestmentCompanyPortfolioTurnover |
50.00%
|
| Additional Fund Statistics [Text Block] |
FUND STATISTICS($ amounts in 000s)(as of June 30, 2025)Net Assets | $5,605,590 |
|---|
Number of Holdings | 113 |
|---|
Investment Advisory Fees | $48,162 |
|---|
Portfolio Turnover | 50% |
|---|
|
| Holdings [Text Block] |
Top SectorsFootnote Reference* (% of Net Assets)Footnote Reference(as of June 30, 2025)Value | Value |
|---|
Utilities | 2.6% | Health Care | 4.0% | Consumer Staples | 4.7% | Energy | 4.7% | Real Estate | 5.2% | Materials | 7.6% | Information Technology | 8.9% | Consumer Discretionary | 9.2% | Industrials | 21.6% | FinancialsFootnote Reference** | 28.5% |
Top 10 HoldingsFootnote Reference* (% of Net Assets)Footnote Reference(as of June 30, 2025)Renasant Corp. | 1.6% |
|---|
Old National Bancorp | 1.6% |
|---|
United Bankshares, Inc. | 1.6% |
|---|
National Bank Holdings Corp., Class A | 1.4% |
|---|
Stock Yards Bancorp, Inc. | 1.4% |
|---|
Commercial Metals Co. | 1.3% |
|---|
The Hanover Insurance Group, Inc. | 1.3% |
|---|
UMB Financial Corp. | 1.3% |
|---|
SouthState Corp. | 1.3% |
|---|
Tower Semiconductor Ltd. | 1.3% |
|---|
|
| Material Fund Change [Text Block] |
|
| C000164985 |
|
| Shareholder Report [Line Items] |
|
| Fund Name |
Victory Sycamore Small Company Opportunity Fund
|
| Class Name |
Class R6
|
| Trading Symbol |
VSORX
|
| Annual or Semi-Annual Statement [Text Block] |
Annual Shareholder Report
|
| Shareholder Report Annual or Semi-Annual |
annual shareholder report
|
| Additional Information [Text Block] |
You can find additional information about the Fund at advisor.vcm.com/literature/mutual-fund-prospectuses. You may also request more information by calling 800-539-3863 or visiting vcm.com/contact-us.
|
| Additional Information Phone Number |
800-539-3863
|
| Additional Information Website |
vcm.com
|
| Expenses [Text Block] |
What were the Fund's costs for the last year?(based on a hypothetical $10,000 investment) Class Name | Costs of a $10,000 Investment | Costs paid as a percentage of a $10,000 Investment |
|---|
Class R6 | $86 | 0.85% |
|---|
| | |
|---|
|
| Expenses Paid, Amount |
$ 86
|
| Expense Ratio, Percent |
0.85%
|
| Factors Affecting Performance [Text Block] |
What affected the Fund’s performance during the last year?The Fund underperformed the Russell 2000® Value Index (the “Index”) for the trailing 12-month period ended June 30, 2025. The Fund’s returns were positive across eight of the 11 major economic sectors, with only seven sectors outpacing the Index. Communication services was the top-performing sector, posting a return of 21.38%. By contrast, energy was the worst-performing sector for the period, returning -24.98%. Top contributors to performance: • The Fund’s underweight position in the health care sector was a positive contributor to performance relative to the Index; and • Stock selection in the consumer discretionary, health care and utilities sectors contributed positively to performance. Top detractors from performance: • For the trailing 12-month period ended June 30, 2025, stock selection was the primary driver of relative underperformance, while sector allocation partially offset the negative relative performance from stock selection for the period. • Stock selection in the information technology sector detracted most from the Fund relative performance. However, the Fund’s overweight position in the information technology sector partially offset the unfavorable impact of stock selection. • Stock selection in the materials and energy sectors also detracted from relative performance. However, the Fund’s underweight position in the energy sector (the worst-performing sector) partially offset the negative relative performance of stock selection in the sector. • The Fund’s underweight positions in the financials and communication services (the top-performing sector) sectors detracted from relative performance. |
| Performance Past Does Not Indicate Future [Text] |
The investment return and principal value will fluctuate so that an investor's shares, when redeemed, may be worth more or less than the original cost. Past performance is not a good predictor of the Fund's future performance.
|
| Line Graph [Table Text Block] |
| Victory Sycamore Small Company Opportunity Fund Class R6 - $23,366 | Russell 3000® Index (regulatory broad based index) - $34,768 | Russell 2000® Value Index - $21,294 |
|---|
12/15Footnote Reference* | $10,000 | $10,000 | $10,000 |
|---|
6/16 | $10,641 | $10,499 | $10,828 |
|---|
6/17 | $13,278 | $12,443 | $13,519 |
|---|
6/18 | $15,219 | $14,282 | $15,290 |
|---|
6/19 | $15,731 | $15,564 | $14,337 |
|---|
6/20 | $13,700 | $16,581 | $11,831 |
|---|
6/21 | $21,242 | $23,903 | $20,501 |
|---|
6/22 | $19,387 | $20,589 | $17,163 |
|---|
6/23 | $21,814 | $24,491 | $18,194 |
|---|
6/24 | $22,979 | $30,155 | $20,177 |
|---|
6/25 | $23,366 | $34,768 | $21,294 |
|---|
|
| Average Annual Return [Table Text Block] |
| 1 Year | 5 Year | Since Inception |
|---|
Class R6 | 1.69% | 11.27% | 9.30% |
|---|
Russell 3000® Index | 15.30% | 15.96% | 13.95% |
|---|
Russell 2000® Value Index | 5.54% | 12.47% | 8.24% |
|---|
|
| No Deduction of Taxes [Text Block] |
The graph and table total returns do not reflect the deduction of taxes that a shareholder would pay on Fund distributions, or redemption of shares.
|
| AssetsNet |
$ 5,605,590,000
|
| Holdings Count | Holding |
113
|
| Advisory Fees Paid, Amount |
$ 48,162,000
|
| InvestmentCompanyPortfolioTurnover |
50.00%
|
| Additional Fund Statistics [Text Block] |
FUND STATISTICS($ amounts in 000s)(as of June 30, 2025)Net Assets | $5,605,590 |
|---|
Number of Holdings | 113 |
|---|
Investment Advisory Fees | $48,162 |
|---|
Portfolio Turnover | 50% |
|---|
|
| Holdings [Text Block] |
Top SectorsFootnote Reference* (% of Net Assets)Footnote Reference(as of June 30, 2025)Value | Value |
|---|
Utilities | 2.6% | Health Care | 4.0% | Consumer Staples | 4.7% | Energy | 4.7% | Real Estate | 5.2% | Materials | 7.6% | Information Technology | 8.9% | Consumer Discretionary | 9.2% | Industrials | 21.6% | FinancialsFootnote Reference** | 28.5% |
Top 10 HoldingsFootnote Reference* (% of Net Assets)Footnote Reference(as of June 30, 2025)Renasant Corp. | 1.6% |
|---|
Old National Bancorp | 1.6% |
|---|
United Bankshares, Inc. | 1.6% |
|---|
National Bank Holdings Corp., Class A | 1.4% |
|---|
Stock Yards Bancorp, Inc. | 1.4% |
|---|
Commercial Metals Co. | 1.3% |
|---|
The Hanover Insurance Group, Inc. | 1.3% |
|---|
UMB Financial Corp. | 1.3% |
|---|
SouthState Corp. | 1.3% |
|---|
Tower Semiconductor Ltd. | 1.3% |
|---|
|
| Material Fund Change [Text Block] |
|
| C000111275 |
|
| Shareholder Report [Line Items] |
|
| Fund Name |
Victory Sycamore Small Company Opportunity Fund
|
| Class Name |
Class Y
|
| Trading Symbol |
VSOYX
|
| Annual or Semi-Annual Statement [Text Block] |
Annual Shareholder Report
|
| Shareholder Report Annual or Semi-Annual |
annual shareholder report
|
| Additional Information [Text Block] |
You can find additional information about the Fund at advisor.vcm.com/literature/mutual-fund-prospectuses. You may also request more information by calling 800-539-3863 or visiting vcm.com/contact-us.
|
| Additional Information Phone Number |
800-539-3863
|
| Additional Information Website |
vcm.com
|
| Expenses [Text Block] |
What were the Fund's costs for the last year?(based on a hypothetical $10,000 investment) Class Name | Costs of a $10,000 Investment | Costs paid as a percentage of a $10,000 Investment |
|---|
Class Y | $96 | 0.95% |
|---|
| | |
|---|
|
| Expenses Paid, Amount |
$ 96
|
| Expense Ratio, Percent |
0.95%
|
| Factors Affecting Performance [Text Block] |
What affected the Fund’s performance during the last year?The Fund underperformed the Russell 2000® Value Index (the “Index”) for the trailing 12-month period ended June 30, 2025. The Fund’s returns were positive across eight of the 11 major economic sectors, with only seven sectors outpacing the Index. Communication services was the top-performing sector, posting a return of 21.38%. By contrast, energy was the worst-performing sector for the period, returning -24.98%. Top contributors to performance: • The Fund’s underweight position in the health care sector was a positive contributor to performance relative to the Index; and • Stock selection in the consumer discretionary, health care and utilities sectors contributed positively to performance. Top detractors from performance: • For the trailing 12-month period ended June 30, 2025, stock selection was the primary driver of relative underperformance, while sector allocation partially offset the negative relative performance from stock selection for the period. • Stock selection in the information technology sector detracted most from the Fund relative performance. However, the Fund’s overweight position in the information technology sector partially offset the unfavorable impact of stock selection. • Stock selection in the materials and energy sectors also detracted from relative performance. However, the Fund’s underweight position in the energy sector (the worst-performing sector) partially offset the negative relative performance of stock selection in the sector. • The Fund’s underweight positions in the financials and communication services (the top-performing sector) sectors detracted from relative performance. |
| Performance Past Does Not Indicate Future [Text] |
The investment return and principal value will fluctuate so that an investor's shares, when redeemed, may be worth more or less than the original cost. Past performance is not a good predictor of the Fund's future performance.
|
| Line Graph [Table Text Block] |
| Victory Sycamore Small Company Opportunity Fund Class Y - $2,207,719 | Russell 3000® Index (regulatory broad based index) - $3,382,207 | Russell 2000® Value Index - $1,915,800 |
|---|
6/15 | $1,000,000 | $1,000,000 | $1,000,000 |
|---|
6/16 | $1,019,867 | $1,021,383 | $974,182 |
|---|
6/17 | $1,269,604 | $1,210,436 | $1,216,334 |
|---|
6/18 | $1,451,641 | $1,389,315 | $1,375,664 |
|---|
6/19 | $1,497,960 | $1,514,111 | $1,289,885 |
|---|
6/20 | $1,302,014 | $1,612,975 | $1,064,452 |
|---|
6/21 | $2,015,150 | $2,325,337 | $1,844,479 |
|---|
6/22 | $1,837,650 | $2,002,914 | $1,544,189 |
|---|
6/23 | $2,065,589 | $2,382,540 | $1,636,957 |
|---|
6/24 | $2,173,373 | $2,933,505 | $1,815,316 |
|---|
6/25 | $2,207,719 | $3,382,207 | $1,915,800 |
|---|
|
| Average Annual Return [Table Text Block] |
| 1 Year | 5 Year | 10 Year |
|---|
Class Y | 1.58% | 11.14% | 8.24% |
|---|
Russell 3000® Index | 15.30% | 15.96% | 12.96% |
|---|
Russell 2000® Value Index | 5.54% | 12.47% | 6.72% |
|---|
|
| No Deduction of Taxes [Text Block] |
The graph and table total returns do not reflect the deduction of taxes that a shareholder would pay on Fund distributions, or redemption of shares.
|
| AssetsNet |
$ 5,605,590,000
|
| Holdings Count | Holding |
113
|
| Advisory Fees Paid, Amount |
$ 48,162,000
|
| InvestmentCompanyPortfolioTurnover |
50.00%
|
| Additional Fund Statistics [Text Block] |
FUND STATISTICS($ amounts in 000s)(as of June 30, 2025)Net Assets | $5,605,590 |
|---|
Number of Holdings | 113 |
|---|
Investment Advisory Fees | $48,162 |
|---|
Portfolio Turnover | 50% |
|---|
|
| Holdings [Text Block] |
Top SectorsFootnote Reference* (% of Net Assets)Footnote Reference(as of June 30, 2025)Value | Value |
|---|
Utilities | 2.6% | Health Care | 4.0% | Consumer Staples | 4.7% | Energy | 4.7% | Real Estate | 5.2% | Materials | 7.6% | Information Technology | 8.9% | Consumer Discretionary | 9.2% | Industrials | 21.6% | FinancialsFootnote Reference** | 28.5% |
Top 10 HoldingsFootnote Reference* (% of Net Assets)Footnote Reference(as of June 30, 2025)Renasant Corp. | 1.6% |
|---|
Old National Bancorp | 1.6% |
|---|
United Bankshares, Inc. | 1.6% |
|---|
National Bank Holdings Corp., Class A | 1.4% |
|---|
Stock Yards Bancorp, Inc. | 1.4% |
|---|
Commercial Metals Co. | 1.3% |
|---|
The Hanover Insurance Group, Inc. | 1.3% |
|---|
UMB Financial Corp. | 1.3% |
|---|
SouthState Corp. | 1.3% |
|---|
Tower Semiconductor Ltd. | 1.3% |
|---|
|
| Material Fund Change [Text Block] |
|