Shareholder Report
|
12 Months Ended |
|
Jun. 30, 2025
USD ($)
Holding
|
|---|
| Shareholder Report [Line Items] |
|
| Document Type |
N-CSR
|
| Amendment Flag |
false
|
| Registrant Name |
DEUTSCHE DWS SECURITIES TRUST
|
| Entity Central Index Key |
0000088048
|
| Entity Investment Company Type |
N-1A
|
| Document Period End Date |
Jun. 30, 2025
|
| C000099775 |
|
| Shareholder Report [Line Items] |
|
| Fund Name |
DWS Enhanced Commodity Strategy Fund
|
| Class Name |
Class A
|
| Trading Symbol |
SKNRX
|
| Annual or Semi-Annual Statement [Text Block] |
This annual shareholder report contains important information about DWS Enhanced Commodity Strategy Fund (the "Fund") for the period July 1, 2024 to June 30, 2025.
|
| Shareholder Report Annual or Semi-Annual |
Annual Shareholder Report
|
| Additional Information [Text Block] |
You can find additional information about the Fund on the Fund's website at dws.com/mutualreports. You can also request this information by contacting us at (800) 728-3337.
|
| Additional Information Phone Number |
(800) 728-3337
|
| Additional Information Website |
<span style="box-sizing: border-box; color: rgb(0, 0, 0); display: inline; flex-wrap: nowrap; font-size: 14.6667px; font-weight: 300; grid-area: auto; line-height: 17.6px; margin: 0px; overflow: visible; text-align: left; text-align-last: auto; white-space-collapse: preserve-breaks;">dws.com/mutualreports</span>
|
| Expenses [Text Block] |
What were the Fund costs for the last year?(Based on a hypothetical $10,000 investment) Fund | Costs of a $10,000 investment | Costs paid as a percentage of a $10,000 investment |
|---|
Class A | $130 | 1.28% |
|---|
Gross expense ratio as of the latest prospectus: 1.38%. See prospectus for any contractual or voluntary waivers; without a waiver, costs would have been higher. |
| Expenses Paid, Amount |
$ 130
|
| Expense Ratio, Percent |
1.28%
|
| Factors Affecting Performance [Text Block] |
How did the Fund perform last year and what affected its performance? Class A shares of the Fund returned 3.44% (unadjusted for sales charges) for the period ended June 30, 2025. The Fund's broad-based index, the S&P 500® Index, returned 15.16% for the same period, while the Fund's additional, more narrowly based index, the Bloomberg Commodity Index, returned 5.77%. The Fund, while producing a positive absolute return in the annual period, did not keep pace with the Bloomberg Commodity Index. We invest in commodities using commodity-linked swaps and futures contracts and use a number of different strategies in an effort to maximize returns and manage risk. Among these, the Fund's roll enhancement strategy (which seeks to invest in contracts that expire further out the commodity curve than the subsequent month) was a key detractor. Most of the underperformance occurred in the fourth calendar quarter of 2024 and the span from April to mid-May of 2025. In both time periods, shorter-dated contracts outpaced the longer-term contracts in which we typically invest. The Fund's tactical strategy (which focuses on the overall direction of commodity markets) detracted. The portfolio averaged 88% market exposure during the period, which hurt results at a time in which commodity prices rose. However, this aspect of our approach also helped cushion the market’s downside during periods of volatility. The Fund's relative value strategy (a proprietary quantitative methodology that determines the commodity sector weightings relative to the Fund's additional benchmark) made a positive contribution to performance. An overweight in agriculture, an underweight in energy, and an overweight in gold contributed, as did our shifts in base metals. We hold the remainder of the Fund's investments in a fixed-income portfolio, some of which serves as collateral for the swaps and futures contracts. The fixed-income positions helped results thanks to the contribution from yield and positive performance from holdings in corporate bonds. We also sought to adjust the portfolio’s positioning to take advantage of short-term market dislocations in an opportunistic fashion. In the aggregate, our decisions in this area helped results. Trades in gold, energy, and base metals all contributed, offsetting a weaker showing in agriculture and silver. |
| Performance Past Does Not Indicate Future [Text] |
The Fund's past performance is not a good predictor or guarantee of the Fund's future performance.
|
| Line Graph [Table Text Block] |
 | Class A | S&P 500® Index | Bloomberg Commodity Index |
|---|
'15 | $9,425 | $10,000 | $10,000 |
|---|
'15 | $8,723 | $10,210 | $8,938 |
|---|
'15 | $8,638 | $9,594 | $8,856 |
|---|
'15 | $8,419 | $9,356 | $8,553 |
|---|
'15 | $8,405 | $10,145 | $8,515 |
|---|
'15 | $8,061 | $10,176 | $7,897 |
|---|
'15 | $7,909 | $10,015 | $7,654 |
|---|
'16 | $7,817 | $9,518 | $7,525 |
|---|
'16 | $7,782 | $9,505 | $7,403 |
|---|
'16 | $8,021 | $10,150 | $7,686 |
|---|
'16 | $8,548 | $10,189 | $8,340 |
|---|
'16 | $8,605 | $10,372 | $8,324 |
|---|
'16 | $8,860 | $10,399 | $8,668 |
|---|
'16 | $8,353 | $10,783 | $8,225 |
|---|
'16 | $8,325 | $10,798 | $8,080 |
|---|
'16 | $8,554 | $10,800 | $8,333 |
|---|
'16 | $8,503 | $10,603 | $8,292 |
|---|
'16 | $8,583 | $10,996 | $8,403 |
|---|
'16 | $8,738 | $11,213 | $8,554 |
|---|
'17 | $8,723 | $11,426 | $8,566 |
|---|
'17 | $8,738 | $11,879 | $8,584 |
|---|
'17 | $8,461 | $11,893 | $8,355 |
|---|
'17 | $8,356 | $12,015 | $8,230 |
|---|
'17 | $8,244 | $12,184 | $8,120 |
|---|
'17 | $8,177 | $12,260 | $8,105 |
|---|
'17 | $8,320 | $12,512 | $8,288 |
|---|
'17 | $8,403 | $12,551 | $8,321 |
|---|
'17 | $8,474 | $12,810 | $8,309 |
|---|
'17 | $8,647 | $13,109 | $8,487 |
|---|
'17 | $8,684 | $13,511 | $8,448 |
|---|
'17 | $8,845 | $13,661 | $8,700 |
|---|
'18 | $9,018 | $14,443 | $8,873 |
|---|
'18 | $8,830 | $13,911 | $8,719 |
|---|
'18 | $8,819 | $13,557 | $8,665 |
|---|
'18 | $9,000 | $13,609 | $8,889 |
|---|
'18 | $9,143 | $13,937 | $9,015 |
|---|
'18 | $8,821 | $14,023 | $8,700 |
|---|
'18 | $8,565 | $14,545 | $8,514 |
|---|
'18 | $8,459 | $15,018 | $8,364 |
|---|
'18 | $8,503 | $15,104 | $8,524 |
|---|
'18 | $8,186 | $14,072 | $8,340 |
|---|
'18 | $7,799 | $14,358 | $8,293 |
|---|
'18 | $7,793 | $13,062 | $7,722 |
|---|
'19 | $8,103 | $14,109 | $8,142 |
|---|
'19 | $8,245 | $14,562 | $8,225 |
|---|
'19 | $8,221 | $14,845 | $8,210 |
|---|
'19 | $8,154 | $15,446 | $8,175 |
|---|
'19 | $7,836 | $14,464 | $7,900 |
|---|
'19 | $7,959 | $15,483 | $8,113 |
|---|
'19 | $7,875 | $15,706 | $8,058 |
|---|
'19 | $7,690 | $15,457 | $7,871 |
|---|
'19 | $7,660 | $15,746 | $7,964 |
|---|
'19 | $7,786 | $16,087 | $8,125 |
|---|
'19 | $7,626 | $16,671 | $7,917 |
|---|
'19 | $7,976 | $17,175 | $8,316 |
|---|
'20 | $7,526 | $17,168 | $7,704 |
|---|
'20 | $7,289 | $15,755 | $7,316 |
|---|
'20 | $6,384 | $13,809 | $6,379 |
|---|
'20 | $6,333 | $15,579 | $6,280 |
|---|
'20 | $6,580 | $16,321 | $6,553 |
|---|
'20 | $6,768 | $16,646 | $6,703 |
|---|
'20 | $7,076 | $17,584 | $7,085 |
|---|
'20 | $7,392 | $18,848 | $7,564 |
|---|
'20 | $7,188 | $18,132 | $7,311 |
|---|
'20 | $7,137 | $17,650 | $7,414 |
|---|
'20 | $7,471 | $19,582 | $7,674 |
|---|
'20 | $7,815 | $20,335 | $8,056 |
|---|
'21 | $7,987 | $20,129 | $8,267 |
|---|
'21 | $8,597 | $20,684 | $8,802 |
|---|
'21 | $8,418 | $21,590 | $8,613 |
|---|
'21 | $9,131 | $22,742 | $9,327 |
|---|
'21 | $9,423 | $22,901 | $9,582 |
|---|
'21 | $9,651 | $23,436 | $9,759 |
|---|
'21 | $9,841 | $23,993 | $9,939 |
|---|
'21 | $9,823 | $24,722 | $9,909 |
|---|
'21 | $10,339 | $23,572 | $10,402 |
|---|
'21 | $10,487 | $25,224 | $10,671 |
|---|
'21 | $9,748 | $25,049 | $9,891 |
|---|
'21 | $10,113 | $26,172 | $10,240 |
|---|
'22 | $10,865 | $24,817 | $11,139 |
|---|
'22 | $11,457 | $24,074 | $11,833 |
|---|
'22 | $12,394 | $24,968 | $12,856 |
|---|
'22 | $12,777 | $22,791 | $13,388 |
|---|
'22 | $12,900 | $22,833 | $13,592 |
|---|
'22 | $11,543 | $20,948 | $12,128 |
|---|
'22 | $11,950 | $22,880 | $12,645 |
|---|
'22 | $11,913 | $21,946 | $12,656 |
|---|
'22 | $10,940 | $19,925 | $11,630 |
|---|
'22 | $10,903 | $21,538 | $11,861 |
|---|
'22 | $11,236 | $22,742 | $12,186 |
|---|
'22 | $11,041 | $21,432 | $11,888 |
|---|
'23 | $11,318 | $22,778 | $11,829 |
|---|
'23 | $10,782 | $22,223 | $11,274 |
|---|
'23 | $10,884 | $23,039 | $11,250 |
|---|
'23 | $10,773 | $23,398 | $11,166 |
|---|
'23 | $10,328 | $23,500 | $10,536 |
|---|
'23 | $10,448 | $25,053 | $10,962 |
|---|
'23 | $10,876 | $25,857 | $11,648 |
|---|
'23 | $10,783 | $25,446 | $11,559 |
|---|
'23 | $10,657 | $24,232 | $11,478 |
|---|
'23 | $10,620 | $23,723 | $11,509 |
|---|
'23 | $10,582 | $25,889 | $11,250 |
|---|
'23 | $10,440 | $27,066 | $10,947 |
|---|
'24 | $10,440 | $27,520 | $10,991 |
|---|
'24 | $10,308 | $28,990 | $10,829 |
|---|
'24 | $10,626 | $29,923 | $11,187 |
|---|
'24 | $10,928 | $28,700 | $11,488 |
|---|
'24 | $11,174 | $30,124 | $11,690 |
|---|
'24 | $10,845 | $31,204 | $11,510 |
|---|
'24 | $10,503 | $31,584 | $11,046 |
|---|
'24 | $10,465 | $32,350 | $11,051 |
|---|
'24 | $10,945 | $33,041 | $11,588 |
|---|
'24 | $10,658 | $32,742 | $11,373 |
|---|
'24 | $10,639 | $34,664 | $11,420 |
|---|
'24 | $10,685 | $33,837 | $11,536 |
|---|
'25 | $11,148 | $34,780 | $11,992 |
|---|
'25 | $11,186 | $34,326 | $12,086 |
|---|
'25 | $11,605 | $32,392 | $12,560 |
|---|
'25 | $10,983 | $32,172 | $11,956 |
|---|
'25 | $10,983 | $34,197 | $11,888 |
|---|
'25 | $11,219 | $35,936 | $12,174 |
|---|
|
| Average Annual Return [Table Text Block] |
Class/Index
| 1-Year | 5-Year | 10-Year |
|---|
Class A Unadjusted for Sales Charge | 3.44% | 10.63% | 1.76% |
|---|
Class A Adjusted for the Maximum Sales Charge (max 5.75% load) | -2.50% | 9.33% | 1.16% |
|---|
S&P 500® Index | 15.16% | 16.64% | 13.65% |
|---|
Bloomberg Commodity Index | 5.77% | 12.68% | 1.99% |
|---|
|
| No Deduction of Taxes [Text Block] |
The performance graph and returns table do not reflect the deduction of taxes that a shareholder would pay on Fund distributions or the redemption of Fund shares.
|
| Performance Table Market Index Changed [Text Block] |
The S&P 500® Index replaces the Bloomberg Commodity Index as the Fund’s broad-based index in compliance with updated regulatory requirements.
|
| AssetsNet |
$ 878,982,242
|
| Holdings Count | Holding |
230
|
| Advisory Fees Paid, Amount |
$ 6,806,609
|
| InvestmentCompanyPortfolioTurnover |
85.00%
|
| Additional Fund Statistics [Text Block] |
Net Assets ($) | 878,982,242 |
|---|
Number of Portfolio Holdings | 230 |
|---|
Portfolio Turnover Rate (%) | 85 |
|---|
Total Net Advisory Fees Paid ($) | 6,806,609 |
|---|
Effective Duration | 0.8 years |
|---|
Effective duration is an approximate measure of the Fund’s sensitivity to interest rate changes taking into consideration any maturity shortening features. |
| Holdings [Text Block] |
Asset Type | % of Net Assets |
|---|
Government & Agency Obligations | 51% |
|---|
Corporate Bonds | 28% |
|---|
Cash Equivalents | 10% |
|---|
Asset-Backed | 10% |
|---|
Commercial Mortgage-Backed Securities | 3% |
|---|
Collateralized Mortgage Obligations | 2% |
|---|
Put Options Purchased | 0% |
|---|
Call Options Purchased | 0% |
|---|
Other Assets and Liabilities, Net | (4%) |
|---|
Total | 100% |
|---|
Commodity-Linked Investments Commodity | % of Net Assets |
|---|
Agriculture | 29% | Energy | 26% | Precious Metals | 19% | Industrials | 17% | Livestock | 7% | Total | 98% |
Credit Rating | % of Net Assets |
|---|
AAA | 24% |
|---|
AA | 44% |
|---|
A | 9% |
|---|
BBB | 20% |
|---|
Below BBB | 1% |
|---|
Not Rated | 1% |
|---|
|
| Credit Ratings Selection [Text Block] |
The quality ratings represent the highest of Moody’s Investors Service, Inc. (“Moody’s”), Fitch Ratings, Inc. (“Fitch”) or S&P Global Ratings (“S&P”) credit ratings. The ratings of Moody’s, Fitch and S&P represent their opinions as to the quality of the securities they rate. Credit quality measures a bond issuer’s ability to repay interest and principal in a timely manner. Ratings are relative and subjective and are not absolute standards of quality. Credit quality does not remove market risk and is subject to change.
|
| Material Fund Change [Text Block] |
|
| C000099777 |
|
| Shareholder Report [Line Items] |
|
| Fund Name |
DWS Enhanced Commodity Strategy Fund
|
| Class Name |
Class C
|
| Trading Symbol |
SKCRX
|
| Annual or Semi-Annual Statement [Text Block] |
This annual shareholder report contains important information about DWS Enhanced Commodity Strategy Fund (the "Fund") for the period July 1, 2024 to June 30, 2025.
|
| Shareholder Report Annual or Semi-Annual |
Annual Shareholder Report
|
| Additional Information [Text Block] |
You can find additional information about the Fund on the Fund's website at dws.com/mutualreports. You can also request this information by contacting us at (800) 728-3337.
|
| Additional Information Phone Number |
(800) 728-3337
|
| Additional Information Website |
<span style="box-sizing: border-box; color: rgb(0, 0, 0); display: inline; flex-wrap: nowrap; font-size: 14.6667px; font-weight: 300; grid-area: auto; line-height: 17.6px; margin: 0px; overflow: visible; text-align: left; text-align-last: auto; white-space-collapse: preserve-breaks;">dws.com/mutualreports</span>
|
| Expenses [Text Block] |
What were the Fund costs for the last year?(Based on a hypothetical $10,000 investment) Fund | Costs of a $10,000 investment | Costs paid as a percentage of a $10,000 investment |
|---|
Class C | $206 | 2.03% |
|---|
Gross expense ratio as of the latest prospectus: 2.03%. See prospectus for any contractual or voluntary waivers; without a waiver, costs would have been higher. |
| Expenses Paid, Amount |
$ 206
|
| Expense Ratio, Percent |
2.03%
|
| Factors Affecting Performance [Text Block] |
How did the Fund perform last year and what affected its performance? Class C shares of the Fund returned 2.57% (unadjusted for sales charges) for the period ended June 30, 2025. The Fund's broad-based index, the S&P 500® Index, returned 15.16% for the same period, while the Fund's additional, more narrowly based index, the Bloomberg Commodity Index, returned 5.77%. The Fund, while producing a positive absolute return in the annual period, did not keep pace with the Bloomberg Commodity Index. We invest in commodities using commodity-linked swaps and futures contracts and use a number of different strategies in an effort to maximize returns and manage risk. Among these, the Fund's roll enhancement strategy (which seeks to invest in contracts that expire further out the commodity curve than the subsequent month) was a key detractor. Most of the underperformance occurred in the fourth calendar quarter of 2024 and the span from April to mid-May of 2025. In both time periods, shorter-dated contracts outpaced the longer-term contracts in which we typically invest. The Fund's tactical strategy (which focuses on the overall direction of commodity markets) detracted. The portfolio averaged 88% market exposure during the period, which hurt results at a time in which commodity prices rose. However, this aspect of our approach also helped cushion the market’s downside during periods of volatility. The Fund's relative value strategy (a proprietary quantitative methodology that determines the commodity sector weightings relative to the Fund's additional benchmark) made a positive contribution to performance. An overweight in agriculture, an underweight in energy, and an overweight in gold contributed, as did our shifts in base metals. We hold the remainder of the Fund's investments in a fixed-income portfolio, some of which serves as collateral for the swaps and futures contracts. The fixed-income positions helped results thanks to the contribution from yield and positive performance from holdings in corporate bonds. We also sought to adjust the portfolio’s positioning to take advantage of short-term market dislocations in an opportunistic fashion. In the aggregate, our decisions in this area helped results. Trades in gold, energy, and base metals all contributed, offsetting a weaker showing in agriculture and silver. |
| Performance Past Does Not Indicate Future [Text] |
The Fund's past performance is not a good predictor or guarantee of the Fund's future performance.
|
| Line Graph [Table Text Block] |
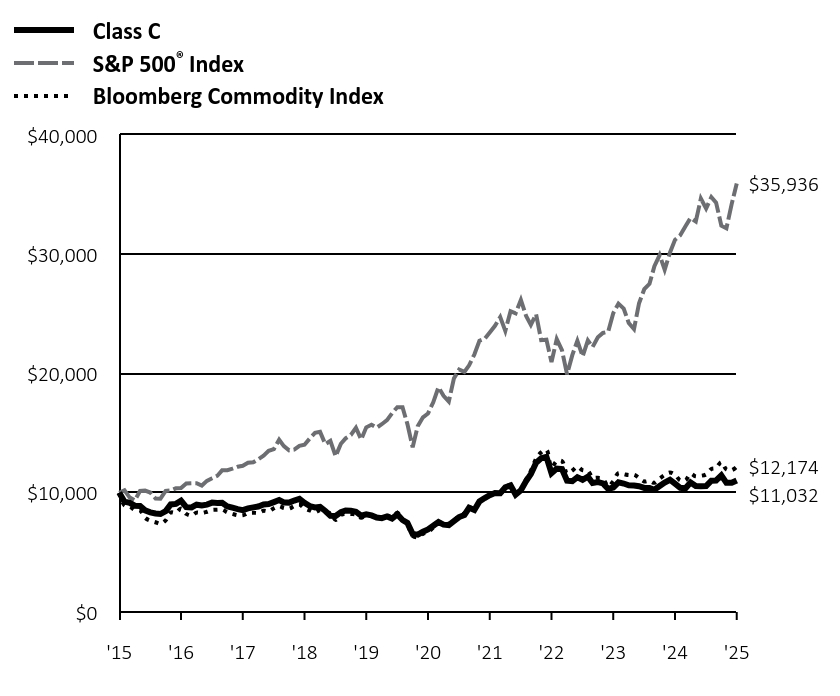 | Class C | S&P 500® Index | Bloomberg Commodity Index |
|---|
'15 | $10,000 | $10,000 | $10,000 |
|---|
'15 | $9,247 | $10,210 | $8,938 |
|---|
'15 | $9,148 | $9,594 | $8,856 |
|---|
'15 | $8,911 | $9,356 | $8,553 |
|---|
'15 | $8,894 | $10,145 | $8,515 |
|---|
'15 | $8,526 | $10,176 | $7,897 |
|---|
'15 | $8,354 | $10,015 | $7,654 |
|---|
'16 | $8,256 | $9,518 | $7,525 |
|---|
'16 | $8,215 | $9,505 | $7,403 |
|---|
'16 | $8,460 | $10,150 | $7,686 |
|---|
'16 | $9,017 | $10,189 | $8,340 |
|---|
'16 | $9,066 | $10,372 | $8,324 |
|---|
'16 | $9,328 | $10,399 | $8,668 |
|---|
'16 | $8,788 | $10,783 | $8,225 |
|---|
'16 | $8,763 | $10,798 | $8,080 |
|---|
'16 | $8,997 | $10,800 | $8,333 |
|---|
'16 | $8,929 | $10,603 | $8,292 |
|---|
'16 | $9,006 | $10,996 | $8,403 |
|---|
'16 | $9,171 | $11,213 | $8,554 |
|---|
'17 | $9,145 | $11,426 | $8,566 |
|---|
'17 | $9,153 | $11,879 | $8,584 |
|---|
'17 | $8,857 | $11,893 | $8,355 |
|---|
'17 | $8,744 | $12,015 | $8,230 |
|---|
'17 | $8,622 | $12,184 | $8,120 |
|---|
'17 | $8,543 | $12,260 | $8,105 |
|---|
'17 | $8,691 | $12,512 | $8,288 |
|---|
'17 | $8,770 | $12,551 | $8,321 |
|---|
'17 | $8,840 | $12,810 | $8,309 |
|---|
'17 | $9,014 | $13,109 | $8,487 |
|---|
'17 | $9,049 | $13,511 | $8,448 |
|---|
'17 | $9,214 | $13,661 | $8,700 |
|---|
'18 | $9,389 | $14,443 | $8,873 |
|---|
'18 | $9,188 | $13,911 | $8,719 |
|---|
'18 | $9,171 | $13,557 | $8,665 |
|---|
'18 | $9,345 | $13,609 | $8,889 |
|---|
'18 | $9,485 | $13,937 | $9,015 |
|---|
'18 | $9,153 | $14,023 | $8,700 |
|---|
'18 | $8,883 | $14,545 | $8,514 |
|---|
'18 | $8,770 | $15,018 | $8,364 |
|---|
'18 | $8,807 | $15,104 | $8,524 |
|---|
'18 | $8,469 | $14,072 | $8,340 |
|---|
'18 | $8,067 | $14,358 | $8,293 |
|---|
'18 | $8,058 | $13,062 | $7,722 |
|---|
'19 | $8,367 | $14,109 | $8,142 |
|---|
'19 | $8,511 | $14,562 | $8,225 |
|---|
'19 | $8,485 | $14,845 | $8,210 |
|---|
'19 | $8,408 | $15,446 | $8,175 |
|---|
'19 | $8,070 | $14,464 | $7,900 |
|---|
'19 | $8,194 | $15,483 | $8,113 |
|---|
'19 | $8,098 | $15,706 | $8,058 |
|---|
'19 | $7,915 | $15,457 | $7,871 |
|---|
'19 | $7,871 | $15,746 | $7,964 |
|---|
'19 | $8,007 | $16,087 | $8,125 |
|---|
'19 | $7,832 | $16,671 | $7,917 |
|---|
'19 | $8,184 | $17,175 | $8,316 |
|---|
'20 | $7,719 | $17,168 | $7,704 |
|---|
'20 | $7,467 | $15,755 | $7,316 |
|---|
'20 | $6,534 | $13,809 | $6,379 |
|---|
'20 | $6,485 | $15,579 | $6,280 |
|---|
'20 | $6,728 | $16,321 | $6,553 |
|---|
'20 | $6,917 | $16,646 | $6,703 |
|---|
'20 | $7,229 | $17,584 | $7,085 |
|---|
'20 | $7,540 | $18,848 | $7,564 |
|---|
'20 | $7,330 | $18,132 | $7,311 |
|---|
'20 | $7,281 | $17,650 | $7,414 |
|---|
'20 | $7,613 | $19,582 | $7,674 |
|---|
'20 | $7,958 | $20,335 | $8,056 |
|---|
'21 | $8,134 | $20,129 | $8,267 |
|---|
'21 | $8,738 | $20,684 | $8,802 |
|---|
'21 | $8,553 | $21,590 | $8,613 |
|---|
'21 | $9,275 | $22,742 | $9,327 |
|---|
'21 | $9,557 | $22,901 | $9,582 |
|---|
'21 | $9,791 | $23,436 | $9,759 |
|---|
'21 | $9,977 | $23,993 | $9,939 |
|---|
'21 | $9,957 | $24,722 | $9,909 |
|---|
'21 | $10,462 | $23,572 | $10,402 |
|---|
'21 | $10,615 | $25,224 | $10,671 |
|---|
'21 | $9,848 | $25,049 | $9,891 |
|---|
'21 | $10,211 | $26,172 | $10,240 |
|---|
'22 | $10,978 | $24,817 | $11,139 |
|---|
'22 | $11,564 | $24,074 | $11,833 |
|---|
'22 | $12,513 | $24,968 | $12,856 |
|---|
'22 | $12,889 | $22,791 | $13,388 |
|---|
'22 | $13,001 | $22,833 | $13,592 |
|---|
'22 | $11,634 | $20,948 | $12,128 |
|---|
'22 | $12,024 | $22,880 | $12,645 |
|---|
'22 | $11,982 | $21,946 | $12,656 |
|---|
'22 | $11,006 | $19,925 | $11,630 |
|---|
'22 | $10,964 | $21,538 | $11,861 |
|---|
'22 | $11,298 | $22,742 | $12,186 |
|---|
'22 | $11,089 | $21,432 | $11,888 |
|---|
'23 | $11,340 | $22,778 | $11,829 |
|---|
'23 | $10,819 | $22,223 | $11,274 |
|---|
'23 | $10,890 | $23,039 | $11,250 |
|---|
'23 | $10,785 | $23,398 | $11,166 |
|---|
'23 | $10,326 | $23,500 | $10,536 |
|---|
'23 | $10,437 | $25,053 | $10,962 |
|---|
'23 | $10,876 | $25,857 | $11,648 |
|---|
'23 | $10,772 | $25,446 | $11,559 |
|---|
'23 | $10,626 | $24,232 | $11,478 |
|---|
'23 | $10,605 | $23,723 | $11,509 |
|---|
'23 | $10,542 | $25,889 | $11,250 |
|---|
'23 | $10,399 | $27,066 | $10,947 |
|---|
'24 | $10,399 | $27,520 | $10,991 |
|---|
'24 | $10,252 | $28,990 | $10,829 |
|---|
'24 | $10,561 | $29,923 | $11,187 |
|---|
'24 | $10,856 | $28,700 | $11,488 |
|---|
'24 | $11,088 | $30,124 | $11,690 |
|---|
'24 | $10,755 | $31,204 | $11,510 |
|---|
'24 | $10,417 | $31,584 | $11,046 |
|---|
'24 | $10,374 | $32,350 | $11,051 |
|---|
'24 | $10,858 | $33,041 | $11,588 |
|---|
'24 | $10,560 | $32,742 | $11,373 |
|---|
'24 | $10,538 | $34,664 | $11,420 |
|---|
'24 | $10,559 | $33,837 | $11,536 |
|---|
'25 | $11,009 | $34,780 | $11,992 |
|---|
'25 | $11,030 | $34,326 | $12,086 |
|---|
'25 | $11,458 | $32,392 | $12,560 |
|---|
'25 | $10,832 | $32,172 | $11,956 |
|---|
'25 | $10,832 | $34,197 | $11,888 |
|---|
'25 | $11,032 | $35,936 | $12,174 |
|---|
|
| Average Annual Return [Table Text Block] |
Class/Index
| 1-Year | 5-Year | 10-Year |
|---|
Class C Unadjusted for Sales Charge | 2.57% | 9.78% | 0.99% |
|---|
Class C Adjusted for the Maximum Sales Charge (max 1.00% CDSC) | 1.57% | 9.78% | 0.99% |
|---|
S&P 500® Index | 15.16% | 16.64% | 13.65% |
|---|
Bloomberg Commodity Index | 5.77% | 12.68% | 1.99% |
|---|
|
| No Deduction of Taxes [Text Block] |
The performance graph and returns table do not reflect the deduction of taxes that a shareholder would pay on Fund distributions or the redemption of Fund shares.
|
| Performance Table Market Index Changed [Text Block] |
The S&P 500® Index replaces the Bloomberg Commodity Index as the Fund’s broad-based index in compliance with updated regulatory requirements.
|
| AssetsNet |
$ 878,982,242
|
| Holdings Count | Holding |
230
|
| Advisory Fees Paid, Amount |
$ 6,806,609
|
| InvestmentCompanyPortfolioTurnover |
85.00%
|
| Additional Fund Statistics [Text Block] |
Net Assets ($) | 878,982,242 |
|---|
Number of Portfolio Holdings | 230 |
|---|
Portfolio Turnover Rate (%) | 85 |
|---|
Total Net Advisory Fees Paid ($) | 6,806,609 |
|---|
Effective Duration | 0.8 years |
|---|
Effective duration is an approximate measure of the Fund’s sensitivity to interest rate changes taking into consideration any maturity shortening features. |
| Holdings [Text Block] |
Asset Type | % of Net Assets |
|---|
Government & Agency Obligations | 51% |
|---|
Corporate Bonds | 28% |
|---|
Cash Equivalents | 10% |
|---|
Asset-Backed | 10% |
|---|
Commercial Mortgage-Backed Securities | 3% |
|---|
Collateralized Mortgage Obligations | 2% |
|---|
Put Options Purchased | 0% |
|---|
Call Options Purchased | 0% |
|---|
Other Assets and Liabilities, Net | (4%) |
|---|
Total | 100% |
|---|
Commodity-Linked Investments Commodity | % of Net Assets |
|---|
Agriculture | 29% | Energy | 26% | Precious Metals | 19% | Industrials | 17% | Livestock | 7% | Total | 98% |
Credit Rating | % of Net Assets |
|---|
AAA | 24% |
|---|
AA | 44% |
|---|
A | 9% |
|---|
BBB | 20% |
|---|
Below BBB | 1% |
|---|
Not Rated | 1% |
|---|
|
| Credit Ratings Selection [Text Block] |
The quality ratings represent the highest of Moody’s Investors Service, Inc. (“Moody’s”), Fitch Ratings, Inc. (“Fitch”) or S&P Global Ratings (“S&P”) credit ratings. The ratings of Moody’s, Fitch and S&P represent their opinions as to the quality of the securities they rate. Credit quality measures a bond issuer’s ability to repay interest and principal in a timely manner. Ratings are relative and subjective and are not absolute standards of quality. Credit quality does not remove market risk and is subject to change.
|
| Material Fund Change [Text Block] |
|
| C000172345 |
|
| Shareholder Report [Line Items] |
|
| Fund Name |
DWS Enhanced Commodity Strategy Fund
|
| Class Name |
Class R6
|
| Trading Symbol |
SKRRX
|
| Annual or Semi-Annual Statement [Text Block] |
This annual shareholder report contains important information about DWS Enhanced Commodity Strategy Fund (the "Fund") for the period July 1, 2024 to June 30, 2025.
|
| Shareholder Report Annual or Semi-Annual |
Annual Shareholder Report
|
| Additional Information [Text Block] |
You can find additional information about the Fund on the Fund's website at dws.com/mutualreports. You can also request this information by contacting us at (800) 728-3337.
|
| Additional Information Phone Number |
(800) 728-3337
|
| Additional Information Website |
<span style="box-sizing: border-box; color: rgb(0, 0, 0); display: inline; flex-wrap: nowrap; font-size: 14.6667px; font-weight: 300; grid-area: auto; line-height: 17.6px; margin: 0px; overflow: visible; text-align: left; text-align-last: auto; white-space-collapse: preserve-breaks;">dws.com/mutualreports</span>
|
| Expenses [Text Block] |
What were the Fund costs for the last year?(Based on a hypothetical $10,000 investment) Fund | Costs of a $10,000 investment | Costs paid as a percentage of a $10,000 investment |
|---|
Class R6 | $104 | 1.02% |
|---|
Gross expense ratio as of the latest prospectus: 1.02%. See prospectus for any contractual or voluntary waivers; without a waiver, costs would have been higher. |
| Expenses Paid, Amount |
$ 104
|
| Expense Ratio, Percent |
1.02%
|
| Factors Affecting Performance [Text Block] |
How did the Fund perform last year and what affected its performance? Class R6 shares of the Fund returned 3.67% for the period ended June 30, 2025. The Fund's broad-based index, the S&P 500® Index, returned 15.16% for the same period, while the Fund's additional, more narrowly based index, the Bloomberg Commodity Index, returned 5.77%. The Fund, while producing a positive absolute return in the annual period, did not keep pace with the Bloomberg Commodity Index. We invest in commodities using commodity-linked swaps and futures contracts and use a number of different strategies in an effort to maximize returns and manage risk. Among these, the Fund's roll enhancement strategy (which seeks to invest in contracts that expire further out the commodity curve than the subsequent month) was a key detractor. Most of the underperformance occurred in the fourth calendar quarter of 2024 and the span from April to mid-May of 2025. In both time periods, shorter-dated contracts outpaced the longer-term contracts in which we typically invest. The Fund's tactical strategy (which focuses on the overall direction of commodity markets) detracted. The portfolio averaged 88% market exposure during the period, which hurt results at a time in which commodity prices rose. However, this aspect of our approach also helped cushion the market’s downside during periods of volatility. The Fund's relative value strategy (a proprietary quantitative methodology that determines the commodity sector weightings relative to the Fund's additional benchmark) made a positive contribution to performance. An overweight in agriculture, an underweight in energy, and an overweight in gold contributed, as did our shifts in base metals. We hold the remainder of the Fund's investments in a fixed-income portfolio, some of which serves as collateral for the swaps and futures contracts. The fixed-income positions helped results thanks to the contribution from yield and positive performance from holdings in corporate bonds. We also sought to adjust the portfolio’s positioning to take advantage of short-term market dislocations in an opportunistic fashion. In the aggregate, our decisions in this area helped results. Trades in gold, energy, and base metals all contributed, offsetting a weaker showing in agriculture and silver. |
| Performance Past Does Not Indicate Future [Text] |
The Fund's past performance is not a good predictor or guarantee of the Fund's future performance.
|
| Line Graph [Table Text Block] |
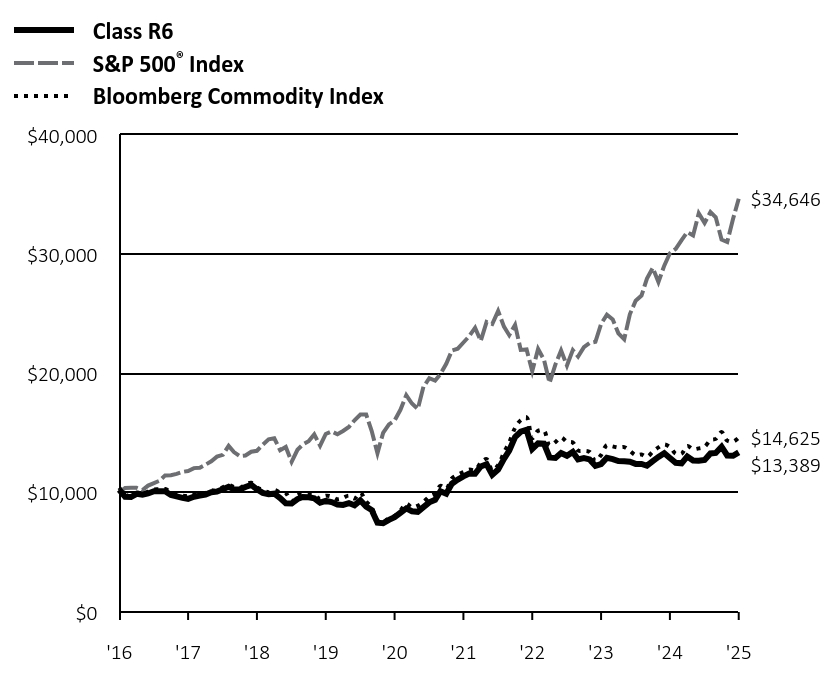 | Class R6 | S&P 500® Index | Bloomberg Commodity Index |
|---|
'16 | $10,246 | $10,026 | $10,413 |
|---|
'16 | $9,661 | $10,396 | $9,881 |
|---|
'16 | $9,637 | $10,410 | $9,707 |
|---|
'16 | $9,906 | $10,412 | $10,011 |
|---|
'16 | $9,840 | $10,222 | $9,962 |
|---|
'16 | $9,939 | $10,601 | $10,095 |
|---|
'16 | $10,132 | $10,810 | $10,277 |
|---|
'17 | $10,115 | $11,015 | $10,291 |
|---|
'17 | $10,132 | $11,453 | $10,312 |
|---|
'17 | $9,816 | $11,466 | $10,038 |
|---|
'17 | $9,696 | $11,584 | $9,886 |
|---|
'17 | $9,567 | $11,747 | $9,755 |
|---|
'17 | $9,491 | $11,820 | $9,736 |
|---|
'17 | $9,663 | $12,063 | $9,957 |
|---|
'17 | $9,758 | $12,100 | $9,997 |
|---|
'17 | $9,848 | $12,350 | $9,982 |
|---|
'17 | $10,046 | $12,638 | $10,196 |
|---|
'17 | $10,098 | $13,026 | $10,149 |
|---|
'17 | $10,292 | $13,171 | $10,452 |
|---|
'18 | $10,499 | $13,925 | $10,659 |
|---|
'18 | $10,283 | $13,411 | $10,475 |
|---|
'18 | $10,272 | $13,071 | $10,410 |
|---|
'18 | $10,479 | $13,121 | $10,679 |
|---|
'18 | $10,652 | $13,437 | $10,830 |
|---|
'18 | $10,285 | $13,519 | $10,452 |
|---|
'18 | $9,990 | $14,022 | $10,228 |
|---|
'18 | $9,869 | $14,479 | $10,047 |
|---|
'18 | $9,919 | $14,562 | $10,240 |
|---|
'18 | $9,555 | $13,567 | $10,019 |
|---|
'18 | $9,110 | $13,843 | $9,963 |
|---|
'18 | $9,102 | $12,593 | $9,276 |
|---|
'19 | $9,468 | $13,602 | $9,782 |
|---|
'19 | $9,641 | $14,039 | $9,881 |
|---|
'19 | $9,614 | $14,312 | $9,863 |
|---|
'19 | $9,537 | $14,891 | $9,821 |
|---|
'19 | $9,170 | $13,945 | $9,491 |
|---|
'19 | $9,312 | $14,928 | $9,746 |
|---|
'19 | $9,215 | $15,142 | $9,680 |
|---|
'19 | $9,011 | $14,902 | $9,456 |
|---|
'19 | $8,977 | $15,181 | $9,567 |
|---|
'19 | $9,133 | $15,510 | $9,760 |
|---|
'19 | $8,939 | $16,073 | $9,510 |
|---|
'19 | $9,352 | $16,558 | $9,990 |
|---|
'20 | $8,833 | $16,552 | $9,255 |
|---|
'20 | $8,549 | $15,189 | $8,788 |
|---|
'20 | $7,492 | $13,313 | $7,663 |
|---|
'20 | $7,443 | $15,020 | $7,545 |
|---|
'20 | $7,728 | $15,735 | $7,872 |
|---|
'20 | $7,954 | $16,048 | $8,052 |
|---|
'20 | $8,320 | $16,953 | $8,512 |
|---|
'20 | $8,685 | $18,172 | $9,087 |
|---|
'20 | $8,449 | $17,481 | $8,783 |
|---|
'20 | $8,399 | $17,016 | $8,906 |
|---|
'20 | $8,797 | $18,879 | $9,219 |
|---|
'20 | $9,195 | $19,605 | $9,678 |
|---|
'21 | $9,404 | $19,407 | $9,932 |
|---|
'21 | $10,122 | $19,942 | $10,575 |
|---|
'21 | $9,913 | $20,815 | $10,347 |
|---|
'21 | $10,761 | $21,926 | $11,205 |
|---|
'21 | $11,100 | $22,079 | $11,511 |
|---|
'21 | $11,375 | $22,595 | $11,724 |
|---|
'21 | $11,604 | $23,131 | $11,940 |
|---|
'21 | $11,594 | $23,835 | $11,904 |
|---|
'21 | $12,199 | $22,726 | $12,497 |
|---|
'21 | $12,385 | $24,319 | $12,820 |
|---|
'21 | $11,511 | $24,150 | $11,882 |
|---|
'21 | $11,946 | $25,232 | $12,301 |
|---|
'22 | $12,836 | $23,927 | $13,381 |
|---|
'22 | $13,539 | $23,210 | $14,215 |
|---|
'22 | $14,667 | $24,072 | $15,444 |
|---|
'22 | $15,112 | $21,973 | $16,083 |
|---|
'22 | $15,270 | $22,013 | $16,329 |
|---|
'22 | $13,671 | $20,196 | $14,569 |
|---|
'22 | $14,146 | $22,058 | $15,190 |
|---|
'22 | $14,117 | $21,159 | $15,204 |
|---|
'22 | $12,964 | $19,210 | $13,971 |
|---|
'22 | $12,921 | $20,765 | $14,249 |
|---|
'22 | $13,331 | $21,926 | $14,639 |
|---|
'22 | $13,095 | $20,663 | $14,281 |
|---|
'23 | $13,419 | $21,961 | $14,211 |
|---|
'23 | $12,792 | $21,425 | $13,543 |
|---|
'23 | $12,902 | $22,212 | $13,515 |
|---|
'23 | $12,794 | $22,558 | $13,414 |
|---|
'23 | $12,251 | $22,656 | $12,658 |
|---|
'23 | $12,404 | $24,153 | $13,169 |
|---|
'23 | $12,927 | $24,929 | $13,993 |
|---|
'23 | $12,818 | $24,532 | $13,886 |
|---|
'23 | $12,661 | $23,363 | $13,789 |
|---|
'23 | $12,639 | $22,872 | $13,826 |
|---|
'23 | $12,595 | $24,960 | $13,514 |
|---|
'23 | $12,418 | $26,094 | $13,151 |
|---|
'24 | $12,418 | $26,533 | $13,203 |
|---|
'24 | $12,264 | $27,949 | $13,009 |
|---|
'24 | $12,647 | $28,849 | $13,439 |
|---|
'24 | $13,001 | $27,670 | $13,801 |
|---|
'24 | $13,311 | $29,042 | $14,043 |
|---|
'24 | $12,914 | $30,085 | $13,827 |
|---|
'24 | $12,513 | $30,451 | $13,269 |
|---|
'24 | $12,468 | $31,189 | $13,276 |
|---|
'24 | $13,042 | $31,855 | $13,921 |
|---|
'24 | $12,705 | $31,567 | $13,663 |
|---|
'24 | $12,682 | $33,420 | $13,719 |
|---|
'24 | $12,746 | $32,623 | $13,859 |
|---|
'25 | $13,291 | $33,531 | $14,407 |
|---|
'25 | $13,336 | $33,094 | $14,519 |
|---|
'25 | $13,858 | $31,229 | $15,089 |
|---|
'25 | $13,126 | $31,017 | $14,364 |
|---|
'25 | $13,103 | $32,970 | $14,281 |
|---|
'25 | $13,389 | $34,646 | $14,625 |
|---|
|
| Average Annual Return [Table Text Block] |
Class/Index
| 1-Year | 5-Year | Since Inception 6/1/16 |
|---|
Class R6 No Sales Charge | 3.67% | 10.98% | 3.27% |
|---|
S&P 500® Index | 15.16% | 16.64% | 14.67% |
|---|
Bloomberg Commodity Index | 5.77% | 12.68% | 4.28% |
|---|
|
| Performance Inception Date |
Jun. 01, 2016
|
| No Deduction of Taxes [Text Block] |
The performance graph and returns table do not reflect the deduction of taxes that a shareholder would pay on Fund distributions or the redemption of Fund shares.
|
| Performance Table Market Index Changed [Text Block] |
The S&P 500® Index replaces the Bloomberg Commodity Index as the Fund’s broad-based index in compliance with updated regulatory requirements.
|
| AssetsNet |
$ 878,982,242
|
| Holdings Count | Holding |
230
|
| Advisory Fees Paid, Amount |
$ 6,806,609
|
| InvestmentCompanyPortfolioTurnover |
85.00%
|
| Additional Fund Statistics [Text Block] |
Net Assets ($) | 878,982,242 |
|---|
Number of Portfolio Holdings | 230 |
|---|
Portfolio Turnover Rate (%) | 85 |
|---|
Total Net Advisory Fees Paid ($) | 6,806,609 |
|---|
Effective Duration | 0.8 years |
|---|
Effective duration is an approximate measure of the Fund’s sensitivity to interest rate changes taking into consideration any maturity shortening features. |
| Holdings [Text Block] |
Asset Type | % of Net Assets |
|---|
Government & Agency Obligations | 51% |
|---|
Corporate Bonds | 28% |
|---|
Cash Equivalents | 10% |
|---|
Asset-Backed | 10% |
|---|
Commercial Mortgage-Backed Securities | 3% |
|---|
Collateralized Mortgage Obligations | 2% |
|---|
Put Options Purchased | 0% |
|---|
Call Options Purchased | 0% |
|---|
Other Assets and Liabilities, Net | (4%) |
|---|
Total | 100% |
|---|
Commodity-Linked Investments Commodity | % of Net Assets |
|---|
Agriculture | 29% | Energy | 26% | Precious Metals | 19% | Industrials | 17% | Livestock | 7% | Total | 98% |
Credit Rating | % of Net Assets |
|---|
AAA | 24% |
|---|
AA | 44% |
|---|
A | 9% |
|---|
BBB | 20% |
|---|
Below BBB | 1% |
|---|
Not Rated | 1% |
|---|
|
| Credit Ratings Selection [Text Block] |
The quality ratings represent the highest of Moody’s Investors Service, Inc. (“Moody’s”), Fitch Ratings, Inc. (“Fitch”) or S&P Global Ratings (“S&P”) credit ratings. The ratings of Moody’s, Fitch and S&P represent their opinions as to the quality of the securities they rate. Credit quality measures a bond issuer’s ability to repay interest and principal in a timely manner. Ratings are relative and subjective and are not absolute standards of quality. Credit quality does not remove market risk and is subject to change.
|
| Material Fund Change [Text Block] |
|
| C000099779 |
|
| Shareholder Report [Line Items] |
|
| Fund Name |
DWS Enhanced Commodity Strategy Fund
|
| Class Name |
Class S
|
| Trading Symbol |
SKSRX
|
| Annual or Semi-Annual Statement [Text Block] |
This annual shareholder report contains important information about DWS Enhanced Commodity Strategy Fund (the "Fund") for the period July 1, 2024 to June 30, 2025.
|
| Shareholder Report Annual or Semi-Annual |
Annual Shareholder Report
|
| Additional Information [Text Block] |
You can find additional information about the Fund on the Fund's website at dws.com/mutualreports. You can also request this information by contacting us at (800) 728-3337.
|
| Additional Information Phone Number |
(800) 728-3337
|
| Additional Information Website |
<span style="box-sizing: border-box; color: rgb(0, 0, 0); display: inline; flex-wrap: nowrap; font-size: 14.6667px; font-weight: 300; grid-area: auto; line-height: 17.6px; margin: 0px; overflow: visible; text-align: left; text-align-last: auto; white-space-collapse: preserve-breaks;">dws.com/mutualreports</span>
|
| Expenses [Text Block] |
What were the Fund costs for the last year?(Based on a hypothetical $10,000 investment) Fund | Costs of a $10,000 investment | Costs paid as a percentage of a $10,000 investment |
|---|
Class S | $115 | 1.13% |
|---|
Gross expense ratio as of the latest prospectus: 1.14%. See prospectus for any contractual or voluntary waivers; without a waiver, costs would have been higher. |
| Expenses Paid, Amount |
$ 115
|
| Expense Ratio, Percent |
1.13%
|
| Factors Affecting Performance [Text Block] |
How did the Fund perform last year and what affected its performance? Class S shares of the Fund returned 3.55% for the period ended June 30, 2025. The Fund's broad-based index, the S&P 500® Index, returned 15.16% for the same period, while the Fund's additional, more narrowly based index, the Bloomberg Commodity Index, returned 5.77%. The Fund, while producing a positive absolute return in the annual period, did not keep pace with the Bloomberg Commodity Index. We invest in commodities using commodity-linked swaps and futures contracts and use a number of different strategies in an effort to maximize returns and manage risk. Among these, the Fund's roll enhancement strategy (which seeks to invest in contracts that expire further out the commodity curve than the subsequent month) was a key detractor. Most of the underperformance occurred in the fourth calendar quarter of 2024 and the span from April to mid-May of 2025. In both time periods, shorter-dated contracts outpaced the longer-term contracts in which we typically invest. The Fund's tactical strategy (which focuses on the overall direction of commodity markets) detracted. The portfolio averaged 88% market exposure during the period, which hurt results at a time in which commodity prices rose. However, this aspect of our approach also helped cushion the market’s downside during periods of volatility. The Fund's relative value strategy (a proprietary quantitative methodology that determines the commodity sector weightings relative to the Fund's additional benchmark) made a positive contribution to performance. An overweight in agriculture, an underweight in energy, and an overweight in gold contributed, as did our shifts in base metals. We hold the remainder of the Fund's investments in a fixed-income portfolio, some of which serves as collateral for the swaps and futures contracts. The fixed-income positions helped results thanks to the contribution from yield and positive performance from holdings in corporate bonds. We also sought to adjust the portfolio’s positioning to take advantage of short-term market dislocations in an opportunistic fashion. In the aggregate, our decisions in this area helped results. Trades in gold, energy, and base metals all contributed, offsetting a weaker showing in agriculture and silver. |
| Performance Past Does Not Indicate Future [Text] |
The Fund's past performance is not a good predictor or guarantee of the Fund's future performance.
|
| Line Graph [Table Text Block] |
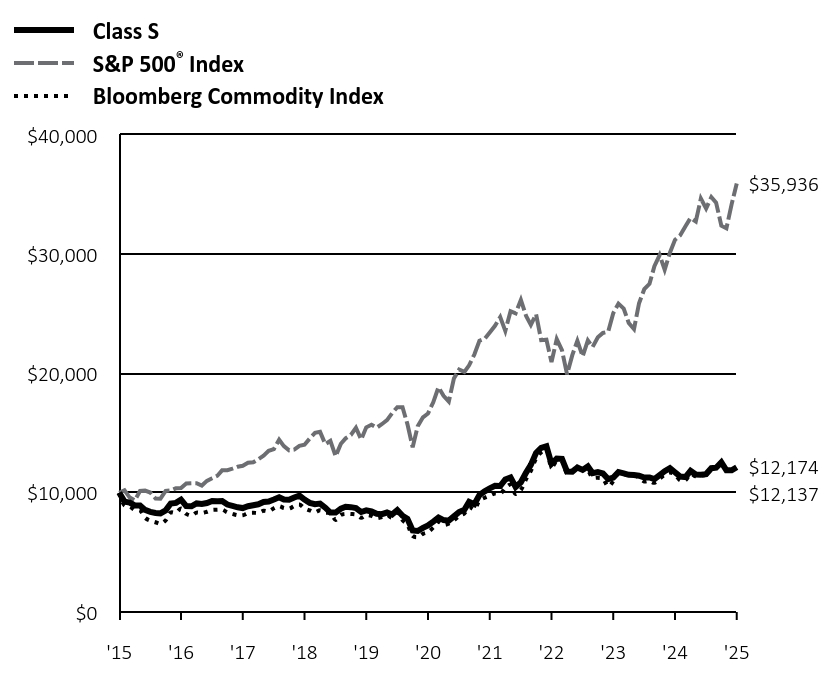 | Class S | S&P 500® Index | Bloomberg Commodity Index |
|---|
'15 | $10,000 | $10,000 | $10,000 |
|---|
'15 | $9,256 | $10,210 | $8,938 |
|---|
'15 | $9,168 | $9,594 | $8,856 |
|---|
'15 | $8,935 | $9,356 | $8,553 |
|---|
'15 | $8,928 | $10,145 | $8,515 |
|---|
'15 | $8,559 | $10,176 | $7,897 |
|---|
'15 | $8,397 | $10,015 | $7,654 |
|---|
'16 | $8,308 | $9,518 | $7,525 |
|---|
'16 | $8,272 | $9,505 | $7,403 |
|---|
'16 | $8,523 | $10,150 | $7,686 |
|---|
'16 | $9,092 | $10,189 | $8,340 |
|---|
'16 | $9,151 | $10,372 | $8,324 |
|---|
'16 | $9,423 | $10,399 | $8,668 |
|---|
'16 | $8,884 | $10,783 | $8,225 |
|---|
'16 | $8,862 | $10,798 | $8,080 |
|---|
'16 | $9,103 | $10,800 | $8,333 |
|---|
'16 | $9,050 | $10,603 | $8,292 |
|---|
'16 | $9,134 | $10,996 | $8,403 |
|---|
'16 | $9,305 | $11,213 | $8,554 |
|---|
'17 | $9,289 | $11,426 | $8,566 |
|---|
'17 | $9,305 | $11,879 | $8,584 |
|---|
'17 | $9,010 | $11,893 | $8,355 |
|---|
'17 | $8,900 | $12,015 | $8,230 |
|---|
'17 | $8,781 | $12,184 | $8,120 |
|---|
'17 | $8,716 | $12,260 | $8,105 |
|---|
'17 | $8,866 | $12,512 | $8,288 |
|---|
'17 | $8,953 | $12,551 | $8,321 |
|---|
'17 | $9,032 | $12,810 | $8,309 |
|---|
'17 | $9,222 | $13,109 | $8,487 |
|---|
'17 | $9,262 | $13,511 | $8,448 |
|---|
'17 | $9,436 | $13,661 | $8,700 |
|---|
'18 | $9,626 | $14,443 | $8,873 |
|---|
'18 | $9,428 | $13,911 | $8,719 |
|---|
'18 | $9,414 | $13,557 | $8,665 |
|---|
'18 | $9,604 | $13,609 | $8,889 |
|---|
'18 | $9,763 | $13,937 | $9,015 |
|---|
'18 | $9,420 | $14,023 | $8,700 |
|---|
'18 | $9,150 | $14,545 | $8,514 |
|---|
'18 | $9,039 | $15,018 | $8,364 |
|---|
'18 | $9,088 | $15,104 | $8,524 |
|---|
'18 | $8,746 | $14,072 | $8,340 |
|---|
'18 | $8,337 | $14,358 | $8,293 |
|---|
'18 | $8,334 | $13,062 | $7,722 |
|---|
'19 | $8,670 | $14,109 | $8,142 |
|---|
'19 | $8,820 | $14,562 | $8,225 |
|---|
'19 | $8,791 | $14,845 | $8,210 |
|---|
'19 | $8,720 | $15,446 | $8,175 |
|---|
'19 | $8,383 | $14,464 | $7,900 |
|---|
'19 | $8,518 | $15,483 | $8,113 |
|---|
'19 | $8,430 | $15,706 | $8,058 |
|---|
'19 | $8,234 | $15,457 | $7,871 |
|---|
'19 | $8,207 | $15,746 | $7,964 |
|---|
'19 | $8,340 | $16,087 | $8,125 |
|---|
'19 | $8,171 | $16,671 | $7,917 |
|---|
'19 | $8,545 | $17,175 | $8,316 |
|---|
'20 | $8,070 | $17,168 | $7,704 |
|---|
'20 | $7,810 | $15,755 | $7,316 |
|---|
'20 | $6,839 | $13,809 | $6,379 |
|---|
'20 | $6,794 | $15,579 | $6,280 |
|---|
'20 | $7,055 | $16,321 | $6,553 |
|---|
'20 | $7,258 | $16,646 | $6,703 |
|---|
'20 | $7,584 | $17,584 | $7,085 |
|---|
'20 | $7,927 | $18,848 | $7,564 |
|---|
'20 | $7,707 | $18,132 | $7,311 |
|---|
'20 | $7,661 | $17,650 | $7,414 |
|---|
'20 | $8,015 | $19,582 | $7,674 |
|---|
'20 | $8,385 | $20,335 | $8,056 |
|---|
'21 | $8,576 | $20,129 | $8,267 |
|---|
'21 | $9,232 | $20,684 | $8,802 |
|---|
'21 | $9,037 | $21,590 | $8,613 |
|---|
'21 | $9,803 | $22,742 | $9,327 |
|---|
'21 | $10,121 | $22,901 | $9,582 |
|---|
'21 | $10,369 | $23,436 | $9,759 |
|---|
'21 | $10,579 | $23,993 | $9,939 |
|---|
'21 | $10,560 | $24,722 | $9,909 |
|---|
'21 | $11,112 | $23,572 | $10,402 |
|---|
'21 | $11,282 | $25,224 | $10,671 |
|---|
'21 | $10,484 | $25,049 | $9,891 |
|---|
'21 | $10,877 | $26,172 | $10,240 |
|---|
'22 | $11,689 | $24,817 | $11,139 |
|---|
'22 | $12,332 | $24,074 | $11,833 |
|---|
'22 | $13,342 | $24,968 | $12,856 |
|---|
'22 | $13,762 | $22,791 | $13,388 |
|---|
'22 | $13,893 | $22,833 | $13,592 |
|---|
'22 | $12,429 | $20,948 | $12,128 |
|---|
'22 | $12,861 | $22,880 | $12,645 |
|---|
'22 | $12,835 | $21,946 | $12,656 |
|---|
'22 | $11,779 | $19,925 | $11,630 |
|---|
'22 | $11,759 | $21,538 | $11,861 |
|---|
'22 | $12,113 | $22,742 | $12,186 |
|---|
'22 | $11,912 | $21,432 | $11,888 |
|---|
'23 | $12,207 | $22,778 | $11,829 |
|---|
'23 | $11,636 | $22,223 | $11,274 |
|---|
'23 | $11,731 | $23,039 | $11,250 |
|---|
'23 | $11,613 | $23,398 | $11,166 |
|---|
'23 | $11,139 | $23,500 | $10,536 |
|---|
'23 | $11,273 | $25,053 | $10,962 |
|---|
'23 | $11,729 | $25,857 | $11,648 |
|---|
'23 | $11,630 | $25,446 | $11,559 |
|---|
'23 | $11,502 | $24,232 | $11,478 |
|---|
'23 | $11,482 | $23,723 | $11,509 |
|---|
'23 | $11,423 | $25,889 | $11,250 |
|---|
'23 | $11,277 | $27,066 | $10,947 |
|---|
'24 | $11,277 | $27,520 | $10,991 |
|---|
'24 | $11,137 | $28,990 | $10,829 |
|---|
'24 | $11,481 | $29,923 | $11,187 |
|---|
'24 | $11,804 | $28,700 | $11,488 |
|---|
'24 | $12,066 | $30,124 | $11,690 |
|---|
'24 | $11,721 | $31,204 | $11,510 |
|---|
'24 | $11,356 | $31,584 | $11,046 |
|---|
'24 | $11,316 | $32,350 | $11,051 |
|---|
'24 | $11,834 | $33,041 | $11,588 |
|---|
'24 | $11,527 | $32,742 | $11,373 |
|---|
'24 | $11,507 | $34,664 | $11,420 |
|---|
'24 | $11,562 | $33,837 | $11,536 |
|---|
'25 | $12,056 | $34,780 | $11,992 |
|---|
'25 | $12,097 | $34,326 | $12,086 |
|---|
'25 | $12,548 | $32,392 | $12,560 |
|---|
'25 | $11,883 | $32,172 | $11,956 |
|---|
'25 | $11,883 | $34,197 | $11,888 |
|---|
'25 | $12,137 | $35,936 | $12,174 |
|---|
|
| Average Annual Return [Table Text Block] |
Class/Index
| 1-Year | 5-Year | 10-Year |
|---|
Class S No Sales Charge | 3.55% | 10.83% | 1.96% |
|---|
S&P 500® Index | 15.16% | 16.64% | 13.65% |
|---|
Bloomberg Commodity Index | 5.77% | 12.68% | 1.99% |
|---|
|
| No Deduction of Taxes [Text Block] |
The performance graph and returns table do not reflect the deduction of taxes that a shareholder would pay on Fund distributions or the redemption of Fund shares.
|
| Performance Table Market Index Changed [Text Block] |
The S&P 500® Index replaces the Bloomberg Commodity Index as the Fund’s broad-based index in compliance with updated regulatory requirements.
|
| AssetsNet |
$ 878,982,242
|
| Holdings Count | Holding |
230
|
| Advisory Fees Paid, Amount |
$ 6,806,609
|
| InvestmentCompanyPortfolioTurnover |
85.00%
|
| Additional Fund Statistics [Text Block] |
Net Assets ($) | 878,982,242 |
|---|
Number of Portfolio Holdings | 230 |
|---|
Portfolio Turnover Rate (%) | 85 |
|---|
Total Net Advisory Fees Paid ($) | 6,806,609 |
|---|
Effective Duration | 0.8 years |
|---|
Effective duration is an approximate measure of the Fund’s sensitivity to interest rate changes taking into consideration any maturity shortening features. |
| Holdings [Text Block] |
Asset Type | % of Net Assets |
|---|
Government & Agency Obligations | 51% |
|---|
Corporate Bonds | 28% |
|---|
Cash Equivalents | 10% |
|---|
Asset-Backed | 10% |
|---|
Commercial Mortgage-Backed Securities | 3% |
|---|
Collateralized Mortgage Obligations | 2% |
|---|
Put Options Purchased | 0% |
|---|
Call Options Purchased | 0% |
|---|
Other Assets and Liabilities, Net | (4%) |
|---|
Total | 100% |
|---|
Commodity-Linked Investments Commodity | % of Net Assets |
|---|
Agriculture | 29% | Energy | 26% | Precious Metals | 19% | Industrials | 17% | Livestock | 7% | Total | 98% |
Credit Rating | % of Net Assets |
|---|
AAA | 24% |
|---|
AA | 44% |
|---|
A | 9% |
|---|
BBB | 20% |
|---|
Below BBB | 1% |
|---|
Not Rated | 1% |
|---|
|
| Credit Ratings Selection [Text Block] |
The quality ratings represent the highest of Moody’s Investors Service, Inc. (“Moody’s”), Fitch Ratings, Inc. (“Fitch”) or S&P Global Ratings (“S&P”) credit ratings. The ratings of Moody’s, Fitch and S&P represent their opinions as to the quality of the securities they rate. Credit quality measures a bond issuer’s ability to repay interest and principal in a timely manner. Ratings are relative and subjective and are not absolute standards of quality. Credit quality does not remove market risk and is subject to change.
|
| Material Fund Change [Text Block] |
|
| C000099774 |
|
| Shareholder Report [Line Items] |
|
| Fund Name |
DWS Enhanced Commodity Strategy Fund
|
| Class Name |
Institutional Class
|
| Trading Symbol |
SKIRX
|
| Annual or Semi-Annual Statement [Text Block] |
This annual shareholder report contains important information about DWS Enhanced Commodity Strategy Fund (the "Fund") for the period July 1, 2024 to June 30, 2025.
|
| Shareholder Report Annual or Semi-Annual |
Annual Shareholder Report
|
| Additional Information [Text Block] |
You can find additional information about the Fund on the Fund's website at dws.com/mutualreports. You can also request this information by contacting us at (800) 728-3337.
|
| Additional Information Phone Number |
(800) 728-3337
|
| Additional Information Website |
<span style="box-sizing: border-box; color: rgb(0, 0, 0); display: inline; flex-wrap: nowrap; font-size: 14.6667px; font-weight: 300; grid-area: auto; line-height: 17.6px; margin: 0px; overflow: visible; text-align: left; text-align-last: auto; white-space-collapse: preserve-breaks;">dws.com/mutualreports</span>
|
| Expenses [Text Block] |
What were the Fund costs for the last year?(Based on a hypothetical $10,000 investment) Fund | Costs of a $10,000 investment | Costs paid as a percentage of a $10,000 investment |
|---|
Institutional Class | $104 | 1.02% |
|---|
Gross expense ratio as of the latest prospectus: 1.03%. See prospectus for any contractual or voluntary waivers; without a waiver, costs would have been higher. |
| Expenses Paid, Amount |
$ 104
|
| Expense Ratio, Percent |
1.02%
|
| Factors Affecting Performance [Text Block] |
How did the Fund perform last year and what affected its performance? Institutional Class shares of the Fund returned 3.50% for the period ended June 30, 2025. The Fund's broad-based index, the S&P 500® Index, returned 15.16% for the same period, while the Fund's additional, more narrowly based index, the Bloomberg Commodity Index, returned 5.77%. The Fund, while producing a positive absolute return in the annual period, did not keep pace with the Bloomberg Commodity Index. We invest in commodities using commodity-linked swaps and futures contracts and use a number of different strategies in an effort to maximize returns and manage risk. Among these, the Fund's roll enhancement strategy (which seeks to invest in contracts that expire further out the commodity curve than the subsequent month) was a key detractor. Most of the underperformance occurred in the fourth calendar quarter of 2024 and the span from April to mid-May of 2025. In both time periods, shorter-dated contracts outpaced the longer-term contracts in which we typically invest. The Fund's tactical strategy (which focuses on the overall direction of commodity markets) detracted. The portfolio averaged 88% market exposure during the period, which hurt results at a time in which commodity prices rose. However, this aspect of our approach also helped cushion the market’s downside during periods of volatility. The Fund's relative value strategy (a proprietary quantitative methodology that determines the commodity sector weightings relative to the Fund's additional benchmark) made a positive contribution to performance. An overweight in agriculture, an underweight in energy, and an overweight in gold contributed, as did our shifts in base metals. We hold the remainder of the Fund's investments in a fixed-income portfolio, some of which serves as collateral for the swaps and futures contracts. The fixed-income positions helped results thanks to the contribution from yield and positive performance from holdings in corporate bonds. We also sought to adjust the portfolio’s positioning to take advantage of short-term market dislocations in an opportunistic fashion. In the aggregate, our decisions in this area helped results. Trades in gold, energy, and base metals all contributed, offsetting a weaker showing in agriculture and silver. |
| Performance Past Does Not Indicate Future [Text] |
The Fund's past performance is not a good predictor or guarantee of the Fund's future performance.
|
| Line Graph [Table Text Block] |
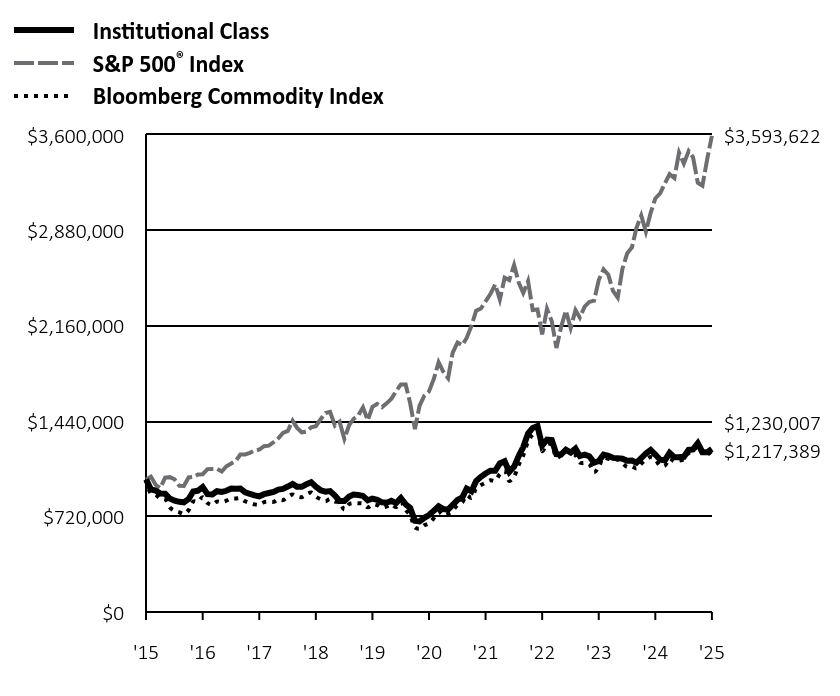 | Institutional Class | S&P 500® Index | Bloomberg Commodity Index |
|---|
'15 | $1,000,000 | $1,000,000 | $1,000,000 |
|---|
'15 | $925,165 | $1,020,951 | $893,810 |
|---|
'15 | $917,095 | $959,353 | $885,598 |
|---|
'15 | $894,186 | $935,615 | $855,336 |
|---|
'15 | $892,717 | $1,014,538 | $851,520 |
|---|
'15 | $855,979 | $1,017,555 | $789,749 |
|---|
'15 | $840,028 | $1,001,506 | $765,379 |
|---|
'16 | $831,201 | $951,807 | $752,516 |
|---|
'16 | $827,523 | $950,523 | $740,276 |
|---|
'16 | $852,949 | $1,015,005 | $768,567 |
|---|
'16 | $909,616 | $1,018,940 | $833,989 |
|---|
'16 | $916,240 | $1,037,238 | $832,413 |
|---|
'16 | $943,002 | $1,039,926 | $866,798 |
|---|
'16 | $889,222 | $1,078,267 | $822,491 |
|---|
'16 | $887,012 | $1,079,781 | $807,998 |
|---|
'16 | $911,614 | $1,079,985 | $833,305 |
|---|
'16 | $905,511 | $1,060,285 | $829,234 |
|---|
'16 | $914,666 | $1,099,553 | $840,292 |
|---|
'16 | $932,253 | $1,121,287 | $855,438 |
|---|
'17 | $930,676 | $1,142,554 | $856,597 |
|---|
'17 | $932,253 | $1,187,920 | $858,385 |
|---|
'17 | $903,125 | $1,189,306 | $835,539 |
|---|
'17 | $892,073 | $1,201,520 | $822,959 |
|---|
'17 | $880,232 | $1,218,429 | $812,028 |
|---|
'17 | $873,208 | $1,226,034 | $810,467 |
|---|
'17 | $889,012 | $1,251,245 | $828,792 |
|---|
'17 | $897,705 | $1,255,075 | $832,133 |
|---|
'17 | $905,928 | $1,280,965 | $830,892 |
|---|
'17 | $924,126 | $1,310,857 | $848,709 |
|---|
'17 | $928,873 | $1,351,061 | $844,794 |
|---|
'17 | $946,628 | $1,366,083 | $870,015 |
|---|
'18 | $965,639 | $1,444,297 | $887,293 |
|---|
'18 | $945,835 | $1,391,064 | $871,948 |
|---|
'18 | $944,735 | $1,355,713 | $866,529 |
|---|
'18 | $963,772 | $1,360,915 | $888,924 |
|---|
'18 | $979,637 | $1,393,689 | $901,517 |
|---|
'18 | $945,780 | $1,402,267 | $869,999 |
|---|
'18 | $918,758 | $1,454,450 | $851,431 |
|---|
'18 | $907,631 | $1,501,844 | $836,356 |
|---|
'18 | $912,194 | $1,510,392 | $852,394 |
|---|
'18 | $878,780 | $1,407,156 | $833,993 |
|---|
'18 | $837,849 | $1,435,832 | $829,297 |
|---|
'18 | $837,147 | $1,306,190 | $772,178 |
|---|
'19 | $870,739 | $1,410,863 | $814,234 |
|---|
'19 | $885,767 | $1,456,163 | $822,477 |
|---|
'19 | $883,167 | $1,484,459 | $821,009 |
|---|
'19 | $876,073 | $1,544,564 | $817,548 |
|---|
'19 | $842,378 | $1,446,410 | $790,041 |
|---|
'19 | $856,238 | $1,548,348 | $811,257 |
|---|
'19 | $847,338 | $1,570,601 | $805,801 |
|---|
'19 | $827,756 | $1,545,722 | $787,110 |
|---|
'19 | $824,635 | $1,574,643 | $796,356 |
|---|
'19 | $838,945 | $1,608,749 | $812,458 |
|---|
'19 | $821,952 | $1,667,145 | $791,655 |
|---|
'19 | $859,830 | $1,717,463 | $831,565 |
|---|
'20 | $812,161 | $1,716,790 | $770,388 |
|---|
'20 | $786,079 | $1,575,465 | $731,559 |
|---|
'20 | $688,083 | $1,380,875 | $637,853 |
|---|
'20 | $683,568 | $1,557,895 | $628,040 |
|---|
'20 | $710,658 | $1,632,095 | $655,300 |
|---|
'20 | $731,436 | $1,664,553 | $670,256 |
|---|
'20 | $764,106 | $1,758,409 | $708,511 |
|---|
'20 | $798,590 | $1,884,804 | $756,429 |
|---|
'20 | $776,868 | $1,813,188 | $731,078 |
|---|
'20 | $772,309 | $1,764,968 | $741,376 |
|---|
'20 | $807,870 | $1,958,168 | $767,417 |
|---|
'20 | $845,384 | $2,033,456 | $805,589 |
|---|
'21 | $864,597 | $2,012,927 | $826,741 |
|---|
'21 | $930,471 | $2,068,433 | $880,235 |
|---|
'21 | $911,285 | $2,159,021 | $861,337 |
|---|
'21 | $988,217 | $2,274,245 | $932,747 |
|---|
'21 | $1,020,273 | $2,290,129 | $958,196 |
|---|
'21 | $1,045,549 | $2,343,592 | $975,935 |
|---|
'21 | $1,066,643 | $2,399,264 | $993,878 |
|---|
'21 | $1,065,726 | $2,472,215 | $990,939 |
|---|
'21 | $1,121,521 | $2,357,233 | $1,040,240 |
|---|
'21 | $1,137,317 | $2,522,385 | $1,067,121 |
|---|
'21 | $1,057,020 | $2,504,908 | $989,109 |
|---|
'21 | $1,096,951 | $2,617,168 | $1,023,977 |
|---|
'22 | $1,180,014 | $2,481,737 | $1,113,869 |
|---|
'22 | $1,244,618 | $2,407,430 | $1,183,260 |
|---|
'22 | $1,346,851 | $2,496,817 | $1,285,577 |
|---|
'22 | $1,389,063 | $2,279,090 | $1,338,809 |
|---|
'22 | $1,403,574 | $2,283,271 | $1,359,225 |
|---|
'22 | $1,255,394 | $2,094,801 | $1,212,774 |
|---|
'22 | $1,300,277 | $2,287,951 | $1,264,469 |
|---|
'22 | $1,297,637 | $2,194,644 | $1,265,583 |
|---|
'22 | $1,190,897 | $1,992,520 | $1,162,964 |
|---|
'22 | $1,188,916 | $2,153,837 | $1,186,120 |
|---|
'22 | $1,224,583 | $2,274,202 | $1,218,598 |
|---|
'22 | $1,202,885 | $2,143,175 | $1,188,768 |
|---|
'23 | $1,232,659 | $2,277,839 | $1,182,943 |
|---|
'23 | $1,177,080 | $2,222,262 | $1,127,357 |
|---|
'23 | $1,187,160 | $2,303,851 | $1,125,035 |
|---|
'23 | $1,175,208 | $2,339,811 | $1,116,581 |
|---|
'23 | $1,127,403 | $2,349,981 | $1,053,647 |
|---|
'23 | $1,139,450 | $2,505,257 | $1,096,207 |
|---|
'23 | $1,187,511 | $2,585,738 | $1,164,790 |
|---|
'23 | $1,177,498 | $2,544,569 | $1,155,865 |
|---|
'23 | $1,163,052 | $2,423,249 | $1,147,840 |
|---|
'23 | $1,161,040 | $2,372,296 | $1,150,889 |
|---|
'23 | $1,157,016 | $2,588,947 | $1,124,964 |
|---|
'23 | $1,140,727 | $2,706,564 | $1,094,706 |
|---|
'24 | $1,142,749 | $2,752,046 | $1,099,061 |
|---|
'24 | $1,126,569 | $2,898,993 | $1,082,894 |
|---|
'24 | $1,161,765 | $2,992,267 | $1,118,718 |
|---|
'24 | $1,196,354 | $2,870,049 | $1,148,823 |
|---|
'24 | $1,222,804 | $3,012,359 | $1,168,991 |
|---|
'24 | $1,188,382 | $3,120,449 | $1,151,012 |
|---|
'24 | $1,149,452 | $3,158,432 | $1,104,556 |
|---|
'24 | $1,145,354 | $3,235,045 | $1,105,094 |
|---|
'24 | $1,200,137 | $3,304,136 | $1,158,819 |
|---|
'24 | $1,167,087 | $3,274,172 | $1,137,344 |
|---|
'24 | $1,167,087 | $3,466,370 | $1,141,970 |
|---|
'24 | $1,170,923 | $3,383,738 | $1,153,610 |
|---|
'25 | $1,223,010 | $3,477,966 | $1,199,222 |
|---|
'25 | $1,227,177 | $3,432,585 | $1,208,563 |
|---|
'25 | $1,273,185 | $3,239,178 | $1,256,048 |
|---|
'25 | $1,205,954 | $3,217,213 | $1,195,647 |
|---|
'25 | $1,205,954 | $3,419,720 | $1,188,754 |
|---|
'25 | $1,230,007 | $3,593,622 | $1,217,389 |
|---|
|
| Average Annual Return [Table Text Block] |
Class/Index
| 1-Year | 5-Year | 10-Year |
|---|
Institutional Class No Sales Charge | 3.50% | 10.95% | 2.09% |
|---|
S&P 500® Index | 15.16% | 16.64% | 13.65% |
|---|
Bloomberg Commodity Index | 5.77% | 12.68% | 1.99% |
|---|
|
| No Deduction of Taxes [Text Block] |
The performance graph and returns table do not reflect the deduction of taxes that a shareholder would pay on Fund distributions or the redemption of Fund shares.
|
| Performance Table Market Index Changed [Text Block] |
The S&P 500® Index replaces the Bloomberg Commodity Index as the Fund’s broad-based index in compliance with updated regulatory requirements.
|
| AssetsNet |
$ 878,982,242
|
| Holdings Count | Holding |
230
|
| Advisory Fees Paid, Amount |
$ 6,806,609
|
| InvestmentCompanyPortfolioTurnover |
85.00%
|
| Additional Fund Statistics [Text Block] |
Net Assets ($) | 878,982,242 |
|---|
Number of Portfolio Holdings | 230 |
|---|
Portfolio Turnover Rate (%) | 85 |
|---|
Total Net Advisory Fees Paid ($) | 6,806,609 |
|---|
Effective Duration | 0.8 years |
|---|
Effective duration is an approximate measure of the Fund’s sensitivity to interest rate changes taking into consideration any maturity shortening features. |
| Holdings [Text Block] |
Asset Type | % of Net Assets |
|---|
Government & Agency Obligations | 51% |
|---|
Corporate Bonds | 28% |
|---|
Cash Equivalents | 10% |
|---|
Asset-Backed | 10% |
|---|
Commercial Mortgage-Backed Securities | 3% |
|---|
Collateralized Mortgage Obligations | 2% |
|---|
Put Options Purchased | 0% |
|---|
Call Options Purchased | 0% |
|---|
Other Assets and Liabilities, Net | (4%) |
|---|
Total | 100% |
|---|
Commodity-Linked Investments Commodity | % of Net Assets |
|---|
Agriculture | 29% | Energy | 26% | Precious Metals | 19% | Industrials | 17% | Livestock | 7% | Total | 98% |
Credit Rating | % of Net Assets |
|---|
AAA | 24% |
|---|
AA | 44% |
|---|
A | 9% |
|---|
BBB | 20% |
|---|
Below BBB | 1% |
|---|
Not Rated | 1% |
|---|
|
| Credit Ratings Selection [Text Block] |
The quality ratings represent the highest of Moody’s Investors Service, Inc. (“Moody’s”), Fitch Ratings, Inc. (“Fitch”) or S&P Global Ratings (“S&P”) credit ratings. The ratings of Moody’s, Fitch and S&P represent their opinions as to the quality of the securities they rate. Credit quality measures a bond issuer’s ability to repay interest and principal in a timely manner. Ratings are relative and subjective and are not absolute standards of quality. Credit quality does not remove market risk and is subject to change.
|
| Material Fund Change [Text Block] |
|