ADDITIONAL INFORMATION
This contains important information about the Pinnacle Value Fund - PVFIX for Jan. 1, 2025 to June 30, 2025.
You can find additional information at www.pinnaclevaluefund.com. You can also request this information by calling (877) 369-3705 X115.
expense Information
What were the Fund costs for the past six months?
(based on a hypothetical $10,000 investment)
| Fund Name | Costs of a $10,000 investment | Costs paid as a percentage of a $10,000 investment* |
| Pinnacle Value Fund | $61 | 1.24% |
*Annualized
managment’s discussion of fund performance
Our Fund’s NAV fell 2.3%, slightly worse than the benchmark R2000 which fell 1.8%. We feel the Fund is well positioned with a basket of well researched equities and a large cash balance earning 4% plus in a government MMF. We continue to search for undervalued equities with strong fundamentals and reasonable valuations that provide a margin of safety.
As shown on the next page, detractors to performance outweighed contributors. Our results were hampered by our large cash position and disappointing results at two of our larger positions, Culp Inc. and Unifi. High Point, NC based Culp makes synthetic fabrics for the upholstered furniture and mattress ticking markets both of which face slowing demand after a robust, pandemic driven run where cocooning at home drove furniture and mattress sales. Culp is undergoing a major restructuring with asset sales and headcount reductions which should help restore profitability. Greensboro, NC based Unifi makes texturized nylon/polyester yarns used to produce synthetic fabrics that go into apparel, home furnishings and vehicle interiors. Like Culp, Unifi has excess capacity and has embarked on a major restructuring involving asset sales, plant closures and expense reductions. Both are making solid progress so far.
Contributors to performance include our Sprott precious metals ETFs where higher precious metals prices drove earnings and share prices higher. Seaboard was also a positive contributor as the agriculture conglomerate almost doubled earnings on higher sales.
We had slightly more portfolio buys than sales. We took advantage of lower prices to add to existing positions Coda Octopus, Heartland Trucking, Omega Flex, Shoe Carnival and Unifi. All have viable business models, acceptable management and strong balance sheets. We added a few new positions including Cohu, a Poway, CA maker of test/automation/inspection/metrology products used in semiconductor manufacturing; Diodes, a Plano, TX based maker of electronic components; Innospec, an Englewood, CO producer of specialty chemicals; and Stepan, a Northfield, IL maker of surfactants, polymers and other specialty chemicals.
We trimmed several positions including Getty Realty, Graham Corp, Kirby Corp and our Sprott precious metal ETFs that we view as fully valued- all were sold at long term capital gains rates.
Outlook & Current Positioning
US equities have had a good run with the most recent rally driven by lower investor anxiety over tariffs and interest rates. Economic data continue to show moderate growth, low unemployment and reasonable inflation. Investors continue to expect at least one interest rate cut before year end and perhaps more in 2026. The Artificial Intelligence craze has jumpstarted a “tech renaissance” and driven the NASDAQ and S&P 500 to new highs. In summary, investors continue to embrace the prospects of a soft landing – a strong economy with high employment and low inflation.
On the flip side, the market is priced to perfection with most valuation metrics (P/E, price/book, price/cash flow, etc.) near all time highs. Growing US sovereign debt remains a concern. Approaching $37 trillion, the Treasury must continue to sell huge amounts of government securities to fund our deficits which may put upward pressure on interest rates. There’s also concern that Big Tech/AI could disappoint if reality falls short of expectations. Finally, corporate profit margins are probably past peak levels for this cycle as more firms are forced to absorb higher labor, tariff and material costs in order to maintain market share.
While our crystal ball is no better than others, we believe inflation and interest rates will remain higher for longer than most people think. We feel most optimistic scenarios are already priced into the market with no room for error. So, we’ll stay conservative, let valuations be our guide and be attentive for any market dislocations that may occur.
Please be advised that we will most likely make a distribution of net realized capital gains in December most of which we expect to be long-term. We’ll have an estimate in late November that we’ll post on our website for your tax planning.
By now you should have received your June statement. Should you have any questions about your account or the Fund, don’t hesitate to call or write. We are positioned to invest our cash as opportunities appear and are searching diligently for situations where good things are happening below the surface. Your portfolio manager remains a major Fund shareholder.
John E. Deysher
Pinnacle Value Fund
President & Portfolio Manager
745 Fifth Ave.- 500
New York, NY 10151
212-725-0805
Performance graph
AVERAGE ANNUAL RETURNS
| One Year | Five Year | Ten Year | |
| Pinnacle Value Fund | 4.02% | 15.17% | 5.29% |
| Russell 2000 Index | 7.68% | 10.04% | 7.12% |
Cumulative Performance Comparison of $10,000 Investment
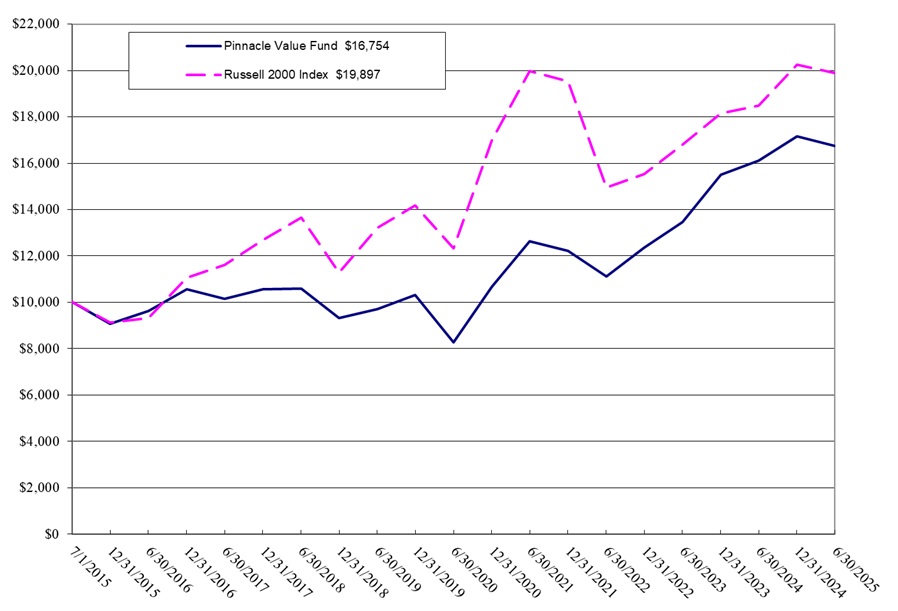
Past performance is not a good predictor of future performance. The returns shown do not reflect taxes that a shareholder would pay on Fund distributions or on the redemption of Fund shares held in taxable accounts. Updated performance data current to the most recent month-end can be obtained by calling 877-369-3705 X115.
Fund statistics
| PORTFOLIO | PORTFOLIO | ADVISORY FEES | |
| NET ASSETS: | HOLDINGS: | TURNOVER: | PAID BY FUND: |
| $33,856,657 | 43 | 13.77% | $154,672 |
| SECURITY CLASSIFICATIONS | |
| Government Money Market Funds | 31.8% |
| Consumer Goods & Services | 12.6 |
| Apparel & Textiles | 10.0 |
| Transportation | 9.4 |
| Industrial Goods & Services | 8.9 |
| Construction & Fabrication | 8.5 |
| Energy | 7.6 |
| Technology | 3.8 |
| Banks & Thrifts | 3.7 |
| Insurance | 2.3 |
| Closed End & Exchange Traded Funds | 1.4 |
| Total | 100.0% |
| TOP 10 POSITIONS | % net assets |
| 1.Gulf Island Fabrication- engineering/design/construction | 8.3 |
| 2. Hurco Cos.- machine tool maker with worldwide distribution | 5.9 |
| 3. Unifi- texturized nylon/polyester yarn used to produce fabrics | 5.6 |
| 4. Culp Inc.- fabrics for upholstered furniture & mattress coverings | 3.8 |
| 5. Weyco Group- wholesale & retail shoes | 3.6 |
| 6. Ingles Markets- regional supermarket chain | 3.5 |
| 7. Seaboard- agricultural conglomerate | 3.5 |
| 8. Bristow Group- helicopter services to commercial/government clients | 3.3 |
| 9. Stealthgas- owns/operates fleet of liquid petroleum gas (LPG) tankers | 2.4 |
| 10. AerSale- aviation services | 2.4 |
| Total | 42.3% |
| YTD TOP 5 Contributors (includes dividends) | |
| 1 .Seaboard | 0.5% |
| 2. Sprott gold miners ETF | 0.5 |
| 3. Sprott junior gold miners ETF | 0.4 |
| 4. Stealthgas | 0.3 |
| 5. Diodes | 0.3% |
| YTD TOP 5 Detractors (includes dividends) | |
| 1.Culp | -1.8% |
| 2.Unifi | -0.9 |
| 3.Weyco | -0.4 |
| 4.Shoe Carnival | -0.3 |
| 5.OP Bank | -0.3% |