Shareholder Report
|
6 Months Ended |
|
Jun. 30, 2025
USD ($)
shares
|
|---|
| Shareholder Report [Line Items] |
|
| Document Type |
N-CSRS
|
| Amendment Flag |
false
|
| Registrant Name |
ALPS Variable Investment Trust
|
| Entity Central Index Key |
0001382990
|
| Entity Investment Company Type |
N-1A
|
| Document Period End Date |
Jun. 30, 2025
|
| Morningstar Conservative ETF Asset Allocation Portfolio - Class I |
|
| Shareholder Report [Line Items] |
|
| Fund Name |
Morningstar Conservative ETF Asset Allocation Portfolio
|
| Class Name |
Class I
|
| No Trading Symbol Flag |
true
|
| Annual or Semi-Annual Statement [Text Block] |
This semi-annual shareholder report contains important information about Morningstar Conservative ETF Asset Allocation Portfolio (the "Portfolio") for the period of January 1, 2025 to June 30, 2025 (the "Period").
|
| Shareholder Report Annual or Semi-Annual |
semi-annual shareholder report
|
| Additional Information [Text Block] |
You can find additional information about the Portfolio at https://www.alpsfunds.com/variable-insurance-trusts/cetfx. You can also request this information by contacting us at 1-866-432-2926.
|
| Additional Information Phone Number |
1-866-432-2926
|
| Additional Information Website |
https://www.alpsfunds.com/variable-insurance-trusts/cetfx
|
| Expenses [Text Block] |
|
| Expenses Paid, Amount |
$ 27
|
| Expense Ratio, Percent |
0.53%
|
| Performance Past Does Not Indicate Future [Text] |
The Portfolio's past performance is not a good predictor of the Portfolio's future performance.
|
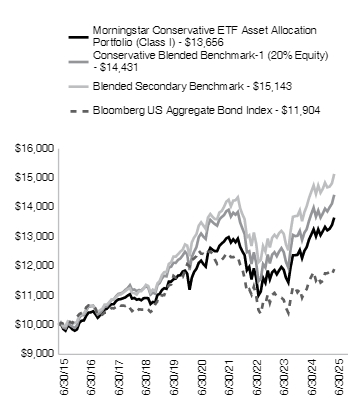
| Line Graph [Table Text Block] |
|
| Average Annual Return [Table Text Block] |
| Morningstar Conservative ETF Asset Allocation - I | 7.97%
|
2.76%
|
3.16%
|
|
Conservative Blended Benchmark-1(a) |
8.79%
|
2.66%
|
3.75%
|
|
Blended Secondary Benchmark(b) |
7.86%
|
2.96%
|
4.24%
|
|
Bloomberg US Aggregate Bond Index* |
6.08%
|
-0.73%
|
1.76%
|
|
| No Deduction of Taxes [Text Block] |
The chart and the Average Annual Total Returns table do not reflect the deduction of taxes that a shareholder would pay on Portfolio distributions or sale of Portfolio shares.
|
| Net Assets |
$ 28,765,499
|
| Holdings Count | shares |
16
|
| Advisory Fees Paid, Amount |
$ 41,662
|
| Investment Company, Portfolio Turnover |
10.00%
|
| Additional Fund Statistics [Text Block] |
| Net Assets |
$28,765,499 |
| Number of Portfolio Holdings |
16 |
| Portfolio Turnover Rate |
10% |
| Total Advisory Fees Paid |
$41,662 |
|
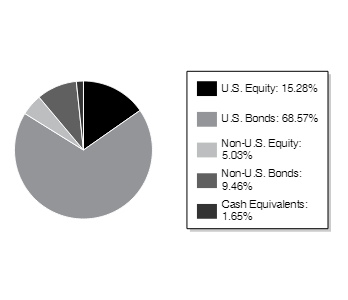
| Holdings [Text Block] |
|
U.S. Equity
|
15.28% |
|
U.S. Bonds
|
68.57% |
|
Non-U.S. Equity
|
5.03% |
|
Non-U.S. Bonds
|
9.46% |
|
Cash Equivalents
|
1.65% |
 | | * | As a percentage of net assets. |
Holdings are subject to change.
|
| Morningstar Conservative ETF Asset Allocation Portfolio - Class II |
|
| Shareholder Report [Line Items] |
|
| Fund Name |
Morningstar Conservative ETF Asset Allocation Portfolio
|
| Class Name |
Class II
|
| Trading Symbol |
CETFX
|
| Annual or Semi-Annual Statement [Text Block] |
This semi-annual shareholder report contains important information about Morningstar Conservative ETF Asset Allocation Portfolio (the "Portfolio" or "CETFX") for the period of January 1, 2025 to June 30, 2025 (the "Period").
|
| Shareholder Report Annual or Semi-Annual |
semi-annual shareholder report
|
| Additional Information [Text Block] |
You can find additional information about the Portfolio at https://www.alpsfunds.com/variable-insurance-trusts/cetfx. You can also request this information by contacting us at 1-866-432-2926.
|
| Additional Information Phone Number |
1-866-432-2926
|
| Additional Information Website |
https://www.alpsfunds.com/variable-insurance-trusts/cetfx
|
| Expenses [Text Block] |
|
| Expenses Paid, Amount |
$ 39
|
| Expense Ratio, Percent |
0.78%
|
| Performance Past Does Not Indicate Future [Text] |
The Portfolio's past performance is not a good predictor of the Portfolio's future performance.
|
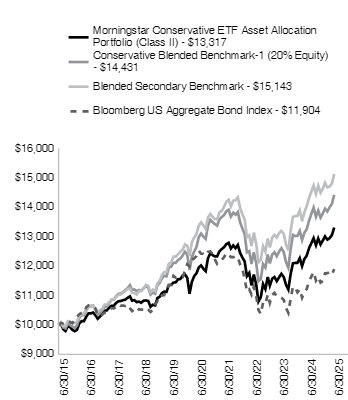
| Line Graph [Table Text Block] |
|
| Average Annual Return [Table Text Block] |
| Morningstar Conservative ETF Asset Allocation - II | 7.76%
|
2.52%
|
2.91%
|
|
Conservative Blended Benchmark-1(a) |
8.79%
|
2.66%
|
3.75%
|
|
Blended Secondary Benchmark(b) |
7.86%
|
2.96%
|
4.24%
|
|
Bloomberg US Aggregate Bond Index* |
6.08%
|
-0.73%
|
1.76%
|
|
| No Deduction of Taxes [Text Block] |
The chart and the Average Annual Total Returns table do not reflect the deduction of taxes that a shareholder would pay on Portfolio distributions or sale of Portfolio shares.
|
| Net Assets |
$ 28,765,499
|
| Holdings Count | shares |
16
|
| Advisory Fees Paid, Amount |
$ 41,662
|
| Investment Company, Portfolio Turnover |
10.00%
|
| Additional Fund Statistics [Text Block] |
| Net Assets |
$28,765,499 |
| Number of Portfolio Holdings |
16 |
| Portfolio Turnover Rate |
10% |
| Total Advisory Fees Paid |
$41,662 |
|
| Holdings [Text Block] |
|
U.S. Equity
|
15.28% |
|
U.S. Bonds
|
68.57% |
|
Non-U.S. Equity
|
5.03% |
|
Non-U.S. Bonds
|
9.46% |
|
Cash Equivalents
|
1.65% |
 | | * | As a percentage of net assets. |
Holdings are subject to change.
|
| Morningstar Income and Growth ETF Asset Allocation Portfolio - Class I |
|
| Shareholder Report [Line Items] |
|
| Fund Name |
Morningstar Income and Growth ETF Asset Allocation Portfolio
|
| Class Name |
Class I
|
| No Trading Symbol Flag |
true
|
| Annual or Semi-Annual Statement [Text Block] |
This semi-annual shareholder report contains important information about Morningstar Income and Growth ETF Asset Allocation Portfolio (the "Portfolio") for the period of January 1, 2025 to June 30, 2025 (the "Period").
|
| Shareholder Report Annual or Semi-Annual |
semi-annual shareholder report
|
| Additional Information [Text Block] |
You can find additional information about the Portfolio at https://www.alpsfunds.com/variable-insurance-trusts/ietfx. You can also request this information by contacting us at 1-866-432-2926.
|
| Additional Information Phone Number |
1-866-432-2926
|
| Additional Information Website |
https://www.alpsfunds.com/variable-insurance-trusts/ietfx
|
| Expenses [Text Block] |
|
| Expenses Paid, Amount |
$ 27
|
| Expense Ratio, Percent |
0.53%
|
| Performance Past Does Not Indicate Future [Text] |
The Portfolio's past performance is not a good predictor of the Portfolio's future performance.
|
| Line Graph [Table Text Block] |
|
Morningstar Income and Growth ETF Asset Allocation Portfolio (Class I) - $16,031 |
|
Income & Growth Blended Benchmark-1 (40% Equity) - $17,323 |
|
Blended Secondary Benchmark - $19,038 |
| |
Bloomberg US Aggregate Bond Index - $11,904 |
|
Bloomberg US 1000 Index - $34,884 |
| 06/30/2015 | 10000 | 10000 | 10000 | 10000 | 10000 | | 07/31/2015 | 10036 | 10071 | 10122 | 10070 | 10194 | | 08/31/2015 | 9738 | 9809 | 9870 | 10055 | 9582 | | 09/30/2015 | 9611 | 9703 | 9809 | 10123 | 9320 | | 10/31/2015 | 9900 | 10019 | 10141 | 10125 | 10069 | | 11/30/2015 | 9873 | 9971 | 10138 | 10098 | 10104 | | 12/31/2015 | 9741 | 9887 | 10056 | 10065 | 9929 | | 01/31/2016 | 9587 | 9711 | 9933 | 10204 | 9390 | | 02/29/2016 | 9616 | 9767 | 9966 | 10276 | 9383 | | 03/31/2016 | 9962 | 10146 | 10287 | 10371 | 10032 | | 04/30/2016 | 10049 | 10246 | 10325 | 10410 | 10086 | | 05/31/2016 | 10078 | 10265 | 10401 | 10413 | 10274 | | 06/30/2016 | 10203 | 10377 | 10515 | 10600 | 10297 | | 07/31/2016 | 10386 | 10601 | 10706 | 10667 | 10692 | | 08/31/2016 | 10405 | 10610 | 10706 | 10655 | 10706 | | 09/30/2016 | 10444 | 10642 | 10704 | 10649 | 10717 | | 10/31/2016 | 10319 | 10481 | 10580 | 10567 | 10506 | | 11/30/2016 | 10280 | 10419 | 10600 | 10317 | 10917 | | 12/31/2016 | 10397 | 10513 | 10692 | 10332 | 11121 | | 01/31/2017 | 10532 | 10645 | 10785 | 10352 | 11346 | | 02/28/2017 | 10688 | 10819 | 10996 | 10422 | 11784 | | 03/31/2017 | 10729 | 10854 | 10998 | 10416 | 11794 | | 04/30/2017 | 10833 | 10973 | 11090 | 10497 | 11922 | | 05/31/2017 | 10916 | 11109 | 11200 | 10577 | 12078 | | 06/30/2017 | 10937 | 11136 | 11222 | 10567 | 12166 | | 07/31/2017 | 11083 | 11296 | 11341 | 10612 | 12405 | | 08/31/2017 | 11145 | 11367 | 11412 | 10707 | 12440 | | 09/30/2017 | 11208 | 11438 | 11477 | 10656 | 12708 | | 10/31/2017 | 11280 | 11533 | 11588 | 10663 | 13002 | | 11/30/2017 | 11353 | 11660 | 11722 | 10649 | 13397 | | 12/31/2017 | 11449 | 11751 | 11805 | 10698 | 13544 | | 01/31/2018 | 11627 | 11985 | 12001 | 10575 | 14294 | | 02/28/2018 | 11382 | 11737 | 11762 | 10474 | 13771 | | 03/31/2018 | 11371 | 11694 | 11685 | 10542 | 13461 | | 04/30/2018 | 11326 | 11669 | 11656 | 10463 | 13503 | | 05/31/2018 | 11360 | 11736 | 11815 | 10538 | 13850 | | 06/30/2018 | 11304 | 11719 | 11837 | 10525 | 13939 | | 07/31/2018 | 11449 | 11868 | 12015 | 10527 | 14419 | | 08/31/2018 | 11471 | 11978 | 12216 | 10595 | 14901 | | 09/30/2018 | 11471 | 11954 | 12201 | 10527 | 14953 | | 10/31/2018 | 11092 | 11529 | 11816 | 10444 | 13884 | | 11/30/2018 | 11203 | 11635 | 11952 | 10506 | 14180 | | 12/31/2018 | 10992 | 11381 | 11642 | 10699 | 12883 | | 01/31/2019 | 11398 | 11851 | 12085 | 10813 | 13973 | | 02/28/2019 | 11494 | 11989 | 12237 | 10806 | 14452 | | 03/31/2019 | 11626 | 12156 | 12463 | 11014 | 14696 | | 04/30/2019 | 11757 | 12331 | 12668 | 11017 | 15289 | | 05/31/2019 | 11566 | 12135 | 12471 | 11212 | 14328 | | 06/30/2019 | 11925 | 12572 | 12910 | 11353 | 15326 | | 07/31/2019 | 11925 | 12618 | 13001 | 11378 | 15573 | | 08/31/2019 | 11925 | 12660 | 13105 | 11673 | 15295 | | 09/30/2019 | 12020 | 12719 | 13166 | 11611 | 15552 | | 10/31/2019 | 12164 | 12880 | 13303 | 11646 | 15877 | | 11/30/2019 | 12248 | 13013 | 13493 | 11640 | 16476 | | 12/31/2019 | 12442 | 13203 | 13652 | 11632 | 16943 | | 01/31/2020 | 12404 | 13280 | 13795 | 11855 | 16972 | | 02/29/2020 | 12077 | 12937 | 13479 | 12069 | 15588 | | 03/31/2020 | 11210 | 12059 | 12772 | 11998 | 13534 | | 04/30/2020 | 11826 | 12750 | 13552 | 12211 | 15322 | | 05/31/2020 | 12115 | 13062 | 13844 | 12268 | 16144 | | 06/30/2020 | 12253 | 13274 | 14003 | 12345 | 16504 | | 07/31/2020 | 12530 | 13723 | 14434 | 12530 | 17447 | | 08/31/2020 | 12731 | 14039 | 14785 | 12428 | 18726 | | 09/30/2020 | 12542 | 13838 | 14556 | 12422 | 18047 | | 10/31/2020 | 12417 | 13702 | 14365 | 12366 | 17624 | | 11/30/2020 | 13196 | 14501 | 15072 | 12488 | 19697 | | 12/31/2020 | 13527 | 14832 | 15315 | 12505 | 20522 | | 01/31/2021 | 13475 | 14757 | 15193 | 12415 | 20369 | | 02/28/2021 | 13606 | 14802 | 15240 | 12236 | 20971 | | 03/31/2021 | 13723 | 14857 | 15402 | 12083 | 21740 | | 04/30/2021 | 13984 | 15205 | 15798 | 12178 | 22903 | | 05/31/2021 | 14140 | 15320 | 15871 | 12218 | 22988 | | 06/30/2021 | 14205 | 15438 | 16080 | 12304 | 23604 | | 07/31/2021 | 14296 | 15585 | 16332 | 12442 | 24108 | | 08/31/2021 | 14401 | 15732 | 16513 | 12418 | 24815 | | 09/30/2021 | 14127 | 15371 | 16128 | 12310 | 23682 | | 10/31/2021 | 14361 | 15684 | 16577 | 12307 | 25330 | | 11/30/2021 | 14179 | 15535 | 16558 | 12344 | 24995 | | 12/31/2021 | 14428 | 15768 | 16832 | 12312 | 25964 | | 01/31/2022 | 14058 | 15234 | 16284 | 12047 | 24455 | | 02/28/2022 | 13879 | 14983 | 15989 | 11912 | 23774 | | 03/31/2022 | 13825 | 14890 | 15982 | 11581 | 24555 | | 04/30/2022 | 13166 | 14043 | 15092 | 11142 | 22334 | | 05/31/2022 | 13303 | 14076 | 15157 | 11214 | 22278 | | 06/30/2022 | 12645 | 13402 | 14526 | 11038 | 20441 | | 07/31/2022 | 13153 | 13997 | 15257 | 11307 | 22354 | | 08/31/2022 | 12755 | 13559 | 14772 | 10988 | 21497 | | 09/30/2022 | 11973 | 12696 | 13878 | 10513 | 19499 | | 10/31/2022 | 12330 | 12971 | 14230 | 10377 | 21049 | | 11/30/2022 | 12947 | 13637 | 14839 | 10759 | 22174 | | 12/31/2022 | 12652 | 13394 | 14463 | 10710 | 20880 | | 01/31/2023 | 13227 | 14008 | 15073 | 11040 | 22287 | | 02/28/2023 | 12873 | 13653 | 14714 | 10754 | 21748 | | 03/31/2023 | 13109 | 13996 | 15139 | 11027 | 22441 | | 04/30/2023 | 13212 | 14111 | 15287 | 11094 | 22707 | | 05/31/2023 | 13020 | 13968 | 15225 | 10973 | 22834 | | 06/30/2023 | 13345 | 14309 | 15601 | 10934 | 24377 | | 07/31/2023 | 13581 | 14545 | 15798 | 10927 | 25218 | | 08/31/2023 | 13404 | 14330 | 15646 | 10857 | 24773 | | 09/30/2023 | 13035 | 13879 | 15132 | 10581 | 23613 | | 10/31/2023 | 12799 | 13598 | 14877 | 10414 | 23035 | | 11/30/2023 | 13522 | 14461 | 15794 | 10886 | 25199 | | 12/31/2023 | 14042 | 15084 | 16417 | 11302 | 26447 | | 01/31/2024 | 14042 | 15067 | 16506 | 11271 | 26811 | | 02/29/2024 | 14195 | 15239 | 16734 | 11112 | 28269 | | 03/31/2024 | 14470 | 15509 | 17038 | 11215 | 29178 | | 04/30/2024 | 14103 | 15085 | 16527 | 10931 | 27921 | | 05/31/2024 | 14470 | 15467 | 17012 | 11117 | 29238 | | 06/30/2024 | 14638 | 15656 | 17349 | 11222 | 30215 | | 07/31/2024 | 14944 | 15996 | 17660 | 11484 | 30643 | | 08/31/2024 | 15174 | 16300 | 17975 | 11649 | 31346 | | 09/30/2024 | 15388 | 16583 | 18265 | 11805 | 32011 | | 10/31/2024 | 15112 | 16217 | 17953 | 11512 | 31767 | | 11/30/2024 | 15495 | 16579 | 18482 | 11634 | 33796 | | 12/31/2024 | 15193 | 16244 | 18143 | 11444 | 32856 | | 01/31/2025 | 15430 | 16508 | 18401 | 11504 | 33888 | | 02/28/2025 | 15525 | 16613 | 18531 | 11757 | 33296 | | 03/31/2025 | 15256 | 16355 | 18121 | 11762 | 31340 | | 04/30/2025 | 15303 | 16506 | 18114 | 11808 | 31162 | | 05/31/2025 | 15620 | 16854 | 18502 | 11724 | 33175 | | 06/30/2025 | 16031 | 17323 | 19038 | 11904 | 34884 |  |
| Average Annual Return [Table Text Block] |
| Morningstar Income & Growth ETF Asset Allocation - I | 9.51%
|
5.52%
|
4.83%
|
|
Income & Growth Blended Benchmark-1(a) |
10.65%
|
5.47%
|
5.65%
|
|
Blended Secondary Benchmark(b) |
9.73%
|
6.34%
|
6.65%
|
|
Bloomberg US Aggregate Bond Index* |
6.08%
|
-0.73%
|
1.76%
|
|
Bloomberg US 1000 Index* |
15.45%
|
16.15%
|
13.31%
|
|
| No Deduction of Taxes [Text Block] |
The chart and the Average Annual Total Returns table do not reflect the deduction of taxes that a shareholder would pay on Portfolio distributions or sale of Portfolio shares.
|
| Net Assets |
$ 51,004,810
|
| Holdings Count | shares |
19
|
| Advisory Fees Paid, Amount |
$ 92,833
|
| Investment Company, Portfolio Turnover |
11.00%
|
| Additional Fund Statistics [Text Block] |
| Net Assets |
$51,004,810 |
| Number of Portfolio Holdings |
19 |
| Portfolio Turnover Rate |
11% |
| Total Advisory Fees Paid |
$92,833 |
|
| Holdings [Text Block] |
|
U.S. Equity
|
29.11% |
|
U.S. Bonds
|
51.19% |
|
Non-U.S. Equity
|
11.06% |
|
Non-U.S. Bonds
|
6.44% |
|
Cash Equivalents
|
2.21% |
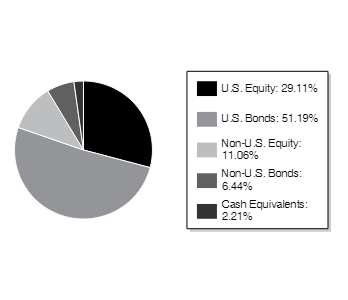 | | * | As a percentage of net assets. |
Holdings are subject to change.
|
| Morningstar Income and Growth ETF Asset Allocation Portfolio - Class II |
|
| Shareholder Report [Line Items] |
|
| Fund Name |
Morningstar Income and Growth ETF Asset Allocation Portfolio
|
| Class Name |
Class II
|
| Trading Symbol |
IETFX
|
| Annual or Semi-Annual Statement [Text Block] |
This semi-annual shareholder report contains important information about Morningstar Income and Growth ETF Asset Allocation Portfolio (the "Portfolio" or "IETFX") for the period of January 1, 2025 to June 30, 2025 (the "Period").
|
| Shareholder Report Annual or Semi-Annual |
semi-annual shareholder report
|
| Additional Information [Text Block] |
You can find additional information about the Portfolio at https://www.alpsfunds.com/variable-insurance-trusts/ietfx. You can also request this information by contacting us at 1-866-432-2926.
|
| Additional Information Phone Number |
1-866-432-2926
|
| Additional Information Website |
https://www.alpsfunds.com/variable-insurance-trusts/ietfx
|
| Expenses [Text Block] |
|
| Expenses Paid, Amount |
$ 40
|
| Expense Ratio, Percent |
0.78%
|
| Performance Past Does Not Indicate Future [Text] |
The Portfolio's past performance is not a good predictor of the Portfolio's future performance.
|
| Line Graph [Table Text Block] |
|
Morningstar Income and Growth ETF Asset Allocation Portfolio (Class II) - $15,632 |
|
Income & Growth Blended Benchmark-1 (40% Equity) - $17,323 |
|
Blended Secondary Benchmark - $19,038 |
| |
Bloomberg US Aggregate Bond Index - $11,904 |
|
Bloomberg US 1000 Index - $34,884 |
| 06/30/2015 | 10000 | 10000 | 10000 | 10000 | 10000 | | 07/31/2015 | 10026 | 10071 | 10122 | 10070 | 10194 | | 08/31/2015 | 9730 | 9809 | 9870 | 10055 | 9582 | | 09/30/2015 | 9608 | 9703 | 9809 | 10123 | 9320 | | 10/31/2015 | 9887 | 10019 | 10141 | 10125 | 10069 | | 11/30/2015 | 9852 | 9971 | 10138 | 10098 | 10104 | | 12/31/2015 | 9730 | 9887 | 10056 | 10065 | 9929 | | 01/31/2016 | 9573 | 9711 | 9933 | 10204 | 9390 | | 02/29/2016 | 9601 | 9767 | 9966 | 10276 | 9383 | | 03/31/2016 | 9941 | 10146 | 10287 | 10371 | 10032 | | 04/30/2016 | 10024 | 10246 | 10325 | 10410 | 10086 | | 05/31/2016 | 10052 | 10265 | 10401 | 10413 | 10274 | | 06/30/2016 | 10171 | 10377 | 10515 | 10600 | 10297 | | 07/31/2016 | 10355 | 10601 | 10706 | 10667 | 10692 | | 08/31/2016 | 10365 | 10610 | 10706 | 10655 | 10706 | | 09/30/2016 | 10402 | 10642 | 10704 | 10649 | 10717 | | 10/31/2016 | 10282 | 10481 | 10580 | 10567 | 10506 | | 11/30/2016 | 10245 | 10419 | 10600 | 10317 | 10917 | | 12/31/2016 | 10350 | 10513 | 10692 | 10332 | 11121 | | 01/31/2017 | 10488 | 10645 | 10785 | 10352 | 11346 | | 02/28/2017 | 10636 | 10819 | 10996 | 10422 | 11784 | | 03/31/2017 | 10675 | 10854 | 10998 | 10416 | 11794 | | 04/30/2017 | 10774 | 10973 | 11090 | 10497 | 11922 | | 05/31/2017 | 10863 | 11109 | 11200 | 10577 | 12078 | | 06/30/2017 | 10883 | 11136 | 11222 | 10567 | 12166 | | 07/31/2017 | 11031 | 11296 | 11341 | 10612 | 12405 | | 08/31/2017 | 11080 | 11367 | 11412 | 10707 | 12440 | | 09/30/2017 | 11140 | 11438 | 11477 | 10656 | 12708 | | 10/31/2017 | 11219 | 11533 | 11588 | 10663 | 13002 | | 11/30/2017 | 11278 | 11660 | 11722 | 10649 | 13397 | | 12/31/2017 | 11378 | 11751 | 11805 | 10698 | 13544 | | 01/31/2018 | 11557 | 11985 | 12001 | 10575 | 14294 | | 02/28/2018 | 11305 | 11737 | 11762 | 10474 | 13771 | | 03/31/2018 | 11294 | 11694 | 11685 | 10542 | 13461 | | 04/30/2018 | 11241 | 11669 | 11656 | 10463 | 13503 | | 05/31/2018 | 11273 | 11736 | 11815 | 10538 | 13850 | | 06/30/2018 | 11220 | 11719 | 11837 | 10525 | 13939 | | 07/31/2018 | 11357 | 11868 | 12015 | 10527 | 14419 | | 08/31/2018 | 11378 | 11978 | 12216 | 10595 | 14901 | | 09/30/2018 | 11368 | 11954 | 12201 | 10527 | 14953 | | 10/31/2018 | 10999 | 11529 | 11816 | 10444 | 13884 | | 11/30/2018 | 11104 | 11635 | 11952 | 10506 | 14180 | | 12/31/2018 | 10895 | 11381 | 11642 | 10699 | 12883 | | 01/31/2019 | 11287 | 11851 | 12085 | 10813 | 13973 | | 02/28/2019 | 11377 | 11989 | 12237 | 10806 | 14452 | | 03/31/2019 | 11512 | 12156 | 12463 | 11014 | 14696 | | 04/30/2019 | 11635 | 12331 | 12668 | 11017 | 15289 | | 05/31/2019 | 11456 | 12135 | 12471 | 11212 | 14328 | | 06/30/2019 | 11803 | 12572 | 12910 | 11353 | 15326 | | 07/31/2019 | 11803 | 12618 | 13001 | 11378 | 15573 | | 08/31/2019 | 11803 | 12660 | 13105 | 11673 | 15295 | | 09/30/2019 | 11882 | 12719 | 13166 | 11611 | 15552 | | 10/31/2019 | 12028 | 12880 | 13303 | 11646 | 15877 | | 11/30/2019 | 12106 | 13013 | 13493 | 11640 | 16476 | | 12/31/2019 | 12300 | 13203 | 13652 | 11632 | 16943 | | 01/31/2020 | 12253 | 13280 | 13795 | 11855 | 16972 | | 02/29/2020 | 11937 | 12937 | 13479 | 12069 | 15588 | | 03/31/2020 | 11069 | 12059 | 12772 | 11998 | 13534 | | 04/30/2020 | 11679 | 12750 | 13552 | 12211 | 15322 | | 05/31/2020 | 11960 | 13062 | 13844 | 12268 | 16144 | | 06/30/2020 | 12101 | 13274 | 14003 | 12345 | 16504 | | 07/31/2020 | 12370 | 13723 | 14434 | 12530 | 17447 | | 08/31/2020 | 12570 | 14039 | 14785 | 12428 | 18726 | | 09/30/2020 | 12382 | 13838 | 14556 | 12422 | 18047 | | 10/31/2020 | 12253 | 13702 | 14365 | 12366 | 17624 | | 11/30/2020 | 13015 | 14501 | 15072 | 12488 | 19697 | | 12/31/2020 | 13337 | 14832 | 15315 | 12505 | 20522 | | 01/31/2021 | 13276 | 14757 | 15193 | 12415 | 20369 | | 02/28/2021 | 13410 | 14802 | 15240 | 12236 | 20971 | | 03/31/2021 | 13531 | 14857 | 15402 | 12083 | 21740 | | 04/30/2021 | 13785 | 15205 | 15798 | 12178 | 22903 | | 05/31/2021 | 13918 | 15320 | 15871 | 12218 | 22988 | | 06/30/2021 | 13990 | 15438 | 16080 | 12304 | 23604 | | 07/31/2021 | 14075 | 15585 | 16332 | 12442 | 24108 | | 08/31/2021 | 14184 | 15732 | 16513 | 12418 | 24815 | | 09/30/2021 | 13906 | 15371 | 16128 | 12310 | 23682 | | 10/31/2021 | 14136 | 15684 | 16577 | 12307 | 25330 | | 11/30/2021 | 13942 | 15535 | 16558 | 12344 | 24995 | | 12/31/2021 | 14200 | 15768 | 16832 | 12312 | 25964 | | 01/31/2022 | 13832 | 15234 | 16284 | 12047 | 24455 | | 02/28/2022 | 13642 | 14983 | 15989 | 11912 | 23774 | | 03/31/2022 | 13592 | 14890 | 15982 | 11581 | 24555 | | 04/30/2022 | 12933 | 14043 | 15092 | 11142 | 22334 | | 05/31/2022 | 13072 | 14076 | 15157 | 11214 | 22278 | | 06/30/2022 | 12414 | 13402 | 14526 | 11038 | 20441 | | 07/31/2022 | 12920 | 13997 | 15257 | 11307 | 22354 | | 08/31/2022 | 12528 | 13559 | 14772 | 10988 | 21497 | | 09/30/2022 | 11755 | 12696 | 13878 | 10513 | 19499 | | 10/31/2022 | 12097 | 12971 | 14230 | 10377 | 21049 | | 11/30/2022 | 12705 | 13637 | 14839 | 10759 | 22174 | | 12/31/2022 | 12419 | 13394 | 14463 | 10710 | 20880 | | 01/31/2023 | 12973 | 14008 | 15073 | 11040 | 22287 | | 02/28/2023 | 12635 | 13653 | 14714 | 10754 | 21748 | | 03/31/2023 | 12865 | 13996 | 15139 | 11027 | 22441 | | 04/30/2023 | 12960 | 14111 | 15287 | 11094 | 22707 | | 05/31/2023 | 12770 | 13968 | 15225 | 10973 | 22834 | | 06/30/2023 | 13081 | 14309 | 15601 | 10934 | 24377 | | 07/31/2023 | 13311 | 14545 | 15798 | 10927 | 25218 | | 08/31/2023 | 13122 | 14330 | 15646 | 10857 | 24773 | | 09/30/2023 | 12770 | 13879 | 15132 | 10581 | 23613 | | 10/31/2023 | 12541 | 13598 | 14877 | 10414 | 23035 | | 11/30/2023 | 13230 | 14461 | 15794 | 10886 | 25199 | | 12/31/2023 | 13735 | 15084 | 16417 | 11302 | 26447 | | 01/31/2024 | 13735 | 15067 | 16506 | 11271 | 26811 | | 02/29/2024 | 13888 | 15239 | 16734 | 11112 | 28269 | | 03/31/2024 | 14153 | 15509 | 17038 | 11215 | 29178 | | 04/30/2024 | 13791 | 15085 | 16527 | 10931 | 27921 | | 05/31/2024 | 14139 | 15467 | 17012 | 11117 | 29238 | | 06/30/2024 | 14306 | 15656 | 17349 | 11222 | 30215 | | 07/31/2024 | 14613 | 15996 | 17660 | 11484 | 30643 | | 08/31/2024 | 14822 | 16300 | 17975 | 11649 | 31346 | | 09/30/2024 | 15046 | 16583 | 18265 | 11805 | 32011 | | 10/31/2024 | 14767 | 16217 | 17953 | 11512 | 31767 | | 11/30/2024 | 15129 | 16579 | 18482 | 11634 | 33796 | | 12/31/2024 | 14829 | 16244 | 18143 | 11444 | 32856 | | 01/31/2025 | 15058 | 16508 | 18401 | 11504 | 33888 | | 02/28/2025 | 15144 | 16613 | 18531 | 11757 | 33296 | | 03/31/2025 | 14886 | 16355 | 18121 | 11762 | 31340 | | 04/30/2025 | 14929 | 16506 | 18114 | 11808 | 31162 | | 05/31/2025 | 15230 | 16854 | 18502 | 11724 | 33175 | | 06/30/2025 | 15632 | 17323 | 19038 | 11904 | 34884 | 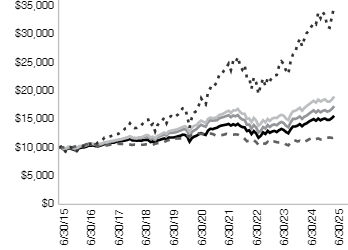 |
| Average Annual Return [Table Text Block] |
| Morningstar Income & Growth ETF Asset Allocation - II | 9.26%
|
5.25%
|
4.57%
|
|
Income & Growth Blended Benchmark-1(a) |
10.65%
|
5.47%
|
5.65%
|
|
Blended Secondary Benchmark(b) |
9.73%
|
6.34%
|
6.65%
|
|
Bloomberg US Aggregate Bond Index* |
6.08%
|
-0.73%
|
1.76%
|
|
Bloomberg US 1000 Index* |
15.45%
|
16.15%
|
13.31%
|
|
| No Deduction of Taxes [Text Block] |
The chart and the Average Annual Total Returns table do not reflect the deduction of taxes that a shareholder would pay on Portfolio distributions or sale of Portfolio shares.
|
| Net Assets |
$ 51,004,810
|
| Holdings Count | shares |
19
|
| Advisory Fees Paid, Amount |
$ 92,833
|
| Investment Company, Portfolio Turnover |
11.00%
|
| Additional Fund Statistics [Text Block] |
| Net Assets |
$51,004,810 |
| Number of Portfolio Holdings |
19 |
| Portfolio Turnover Rate |
11% |
| Total Advisory Fees Paid |
$92,833 |
|
| Holdings [Text Block] |
|
U.S. Equity
|
29.11% |
|
U.S. Bonds
|
51.19% |
|
Non-U.S. Equity
|
11.06% |
|
Non-U.S. Bonds
|
6.44% |
|
Cash Equivalents
|
2.21% |
 | | * | As a percentage of net assets. |
Holdings are subject to change.
|
| Morningstar Balanced ETF Asset Allocation Portfolio - Class I |
|
| Shareholder Report [Line Items] |
|
| Fund Name |
Morningstar Balanced ETF Asset Allocation Portfolio
|
| Class Name |
Class I
|
| No Trading Symbol Flag |
true
|
| Annual or Semi-Annual Statement [Text Block] |
This semi-annual shareholder report contains important information about Morningstar Balanced ETF Asset Allocation Portfolio (the "Portfolio") for the period of January 1, 2025 to June 30, 2025 (the "Period").
|
| Shareholder Report Annual or Semi-Annual |
semi-annual shareholder report
|
| Additional Information [Text Block] |
You can find additional information about the Portfolio at https://www.alpsfunds.com/variable-insurance-trusts/betfx. You can also request this information by contacting us at 1-866-432-2926.
|
| Additional Information Phone Number |
1-866-432-2926
|
| Additional Information Website |
https://www.alpsfunds.com/variable-insurance-trusts/betfx
|
| Expenses [Text Block] |
|
| Expenses Paid, Amount |
$ 27
|
| Expense Ratio, Percent |
0.53%
|
| Performance Past Does Not Indicate Future [Text] |
The Portfolio's past performance is not a good predictor of the Portfolio's future performance.
|
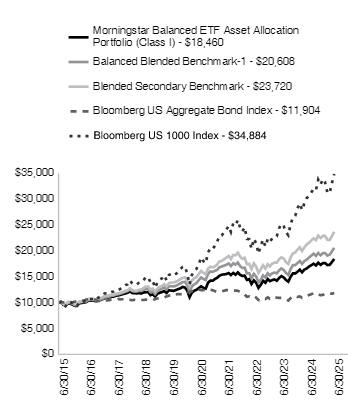
| Line Graph [Table Text Block] |
|
| Average Annual Return [Table Text Block] |
| Morningstar Balanced ETF Asset Allocation - I | 11.11%
|
8.13%
|
6.32%
|
|
Balanced Blended Benchmark-1(a) |
12.46%
|
8.35%
|
7.50%
|
|
Blended Secondary Benchmark(b) |
11.59%
|
9.70%
|
9.02%
|
|
Bloomberg US Aggregate Bond Index* |
6.08%
|
-0.73%
|
1.76%
|
|
Bloomberg US 1000 Index* |
15.45%
|
16.15%
|
13.31%
|
|
| No Deduction of Taxes [Text Block] |
The chart and the Average Annual Total Returns table do not reflect the deduction of taxes that a shareholder would pay on Portfolio distributions or sale of Portfolio shares.
|
| Net Assets |
$ 165,383,455
|
| Holdings Count | shares |
18
|
| Advisory Fees Paid, Amount |
$ 353,260
|
| Investment Company, Portfolio Turnover |
9.00%
|
| Additional Fund Statistics [Text Block] |
| Net Assets |
$165,383,455 |
| Number of Portfolio Holdings |
18 |
| Portfolio Turnover Rate |
9% |
| Total Advisory Fees Paid |
$353,260 |
|
| Holdings [Text Block] |
|
U.S. Equity
|
43.01% |
|
U.S. Bonds
|
35.67% |
|
Non-U.S. Equity
|
17.52% |
|
Non-U.S. Bonds
|
2.92% |
|
Cash Equivalents
|
0.89% |
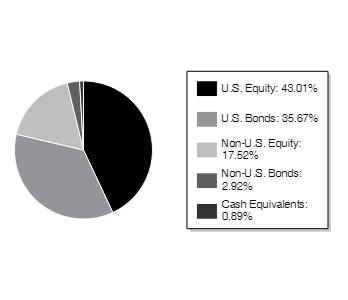 | | * | As a percentage of net assets. |
Holdings are subject to change.
|
| Morningstar Balanced ETF Asset Allocation Portfolio - Class II |
|
| Shareholder Report [Line Items] |
|
| Fund Name |
Morningstar Balanced ETF Asset Allocation Portfolio
|
| Class Name |
Class II
|
| Trading Symbol |
BETFX
|
| Annual or Semi-Annual Statement [Text Block] |
This semi-annual shareholder report contains important information about Morningstar Balanced ETF Asset Allocation Portfolio (the "Portfolio" or "BETFX") for the period of January 1, 2025 to June 30, 2025 (the "Period").
|
| Shareholder Report Annual or Semi-Annual |
semi-annual shareholder report
|
| Additional Information [Text Block] |
You can find additional information about the Portfolio at https://www.alpsfunds.com/variable-insurance-trusts/betfx. You can also request this information by contacting us at 1-866-432-2926.
|
| Additional Information Phone Number |
1-866-432-2926
|
| Additional Information Website |
https://www.alpsfunds.com/variable-insurance-trusts/betfx
|
| Expenses [Text Block] |
|
| Expenses Paid, Amount |
$ 40
|
| Expense Ratio, Percent |
0.78%
|
| Performance Past Does Not Indicate Future [Text] |
The Portfolio's past performance is not a good predictor of the Portfolio's future performance.
|
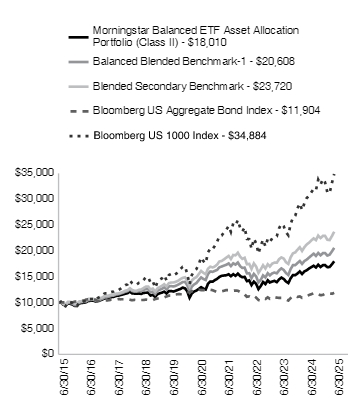
| Line Graph [Table Text Block] |
|
| Average Annual Return [Table Text Block] |
| Morningstar Balanced ETF Asset Allocation - II |
10.77%
|
7.85%
|
6.06%
|
|
Balanced Blended Benchmark-1(a) |
12.46%
|
8.35%
|
7.50%
|
|
Blended Secondary Benchmark(b) |
11.59%
|
9.70%
|
9.02%
|
|
Bloomberg US Aggregate Bond Index* |
6.08%
|
-0.73%
|
1.76%
|
|
Bloomberg US 1000 Index* |
15.45%
|
16.15%
|
13.31%
|
|
| No Deduction of Taxes [Text Block] |
The chart and the Average Annual Total Returns table do not reflect the deduction of taxes that a shareholder would pay on Portfolio distributions or sale of Portfolio shares.
|
| Net Assets |
$ 165,383,455
|
| Holdings Count | shares |
18
|
| Advisory Fees Paid, Amount |
$ 353,260
|
| Investment Company, Portfolio Turnover |
9.00%
|
| Additional Fund Statistics [Text Block] |
| Net Assets |
$165,383,455 |
| Number of Portfolio Holdings |
18 |
| Portfolio Turnover Rate |
9% |
| Total Advisory Fees Paid |
$353,260 |
|
| Holdings [Text Block] |
|
U.S. Equity
|
43.01% |
|
U.S. Bonds
|
35.67% |
|
Non-U.S. Equity
|
17.52% |
|
Non-U.S. Bonds
|
2.92% |
|
Cash Equivalents
|
0.89% |
 | | * | As a percentage of net assets. |
Holdings are subject to change.
|
| Morningstar Growth ETF Asset Allocation Portfolio - Class I |
|
| Shareholder Report [Line Items] |
|
| Fund Name |
Morningstar Growth ETF Asset Allocation Portfolio
|
| Class Name |
Class I
|
| No Trading Symbol Flag |
true
|
| Annual or Semi-Annual Statement [Text Block] |
This semi-annual shareholder report contains important information about Morningstar Growth ETF Asset Allocation Portfolio (the "Portfolio") for the period of January 1, 2025 to June 30, 2025 (the "Period").
|
| Shareholder Report Annual or Semi-Annual |
semi-annual shareholder report
|
| Additional Information [Text Block] |
You can find additional information about the Portfolio at https://www.alpsfunds.com/variable-insurance-trusts/getfx. You can also request this information by contacting us at 1-866-432-2926.
|
| Additional Information Phone Number |
1-866-432-2926
|
| Additional Information Website |
https://www.alpsfunds.com/variable-insurance-trusts/getfx
|
| Expenses [Text Block] |
|
| Expenses Paid, Amount |
$ 27
|
| Expense Ratio, Percent |
0.52%
|
| Performance Past Does Not Indicate Future [Text] |
The Portfolio's past performance is not a good predictor of the Portfolio's future performance.
|
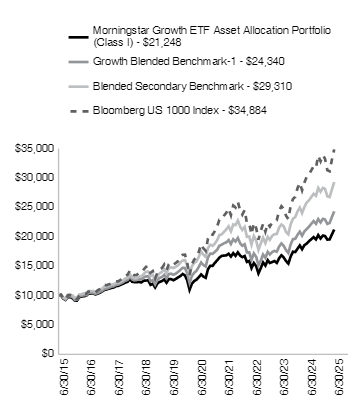
| Line Graph [Table Text Block] |
|
| Average Annual Return [Table Text Block] |
| Morningstar Growth ETF Asset Allocation - I | 12.70%
|
10.82%
|
7.83%
|
|
Growth Blended Benchmark-1(a) |
14.20%
|
11.34%
|
9.30%
|
|
Blended Secondary Benchmark(b) |
13.41%
|
13.12%
|
11.35%
|
|
Bloomberg US 1000 Index* |
15.45%
|
16.15%
|
13.31%
|
|
| No Deduction of Taxes [Text Block] |
The chart and the Average Annual Total Returns table do not reflect the deduction of taxes that a shareholder would pay on Portfolio distributions or sale of Portfolio shares.
|
| Net Assets |
$ 275,594,795
|
| Holdings Count | shares |
15
|
| Advisory Fees Paid, Amount |
$ 582,913
|
| Investment Company, Portfolio Turnover |
13.00%
|
| Additional Fund Statistics [Text Block] |
| Net Assets |
$275,594,795 |
| Number of Portfolio Holdings |
15 |
| Portfolio Turnover Rate |
13% |
| Total Advisory Fees Paid |
$582,913 |
|
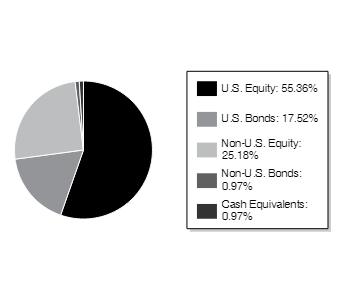
| Holdings [Text Block] |
|
U.S. Equity
|
55.36% |
|
U.S. Bonds
|
17.52% |
|
Non-U.S. Equity
|
25.18% |
|
Non-U.S. Bonds
|
0.97% |
|
Cash Equivalents
|
0.97% |
 | | * | As a percentage of net assets. |
Holdings are subject to change.
|
| Morningstar Growth ETF Asset Allocation Portfolio - Class II |
|
| Shareholder Report [Line Items] |
|
| Fund Name |
Morningstar Growth ETF Asset Allocation Portfolio
|
| Class Name |
Class II
|
| Trading Symbol |
GETFX
|
| Annual or Semi-Annual Statement [Text Block] |
This semi-annual shareholder report contains important information about Morningstar Growth ETF Asset Allocation Portfolio (the "Portfolio" or "GETFX") for the period of January 1, 2025 to June 30, 2025 (the "Period").
|
| Shareholder Report Annual or Semi-Annual |
semi-annual shareholder report
|
| Additional Information [Text Block] |
You can find additional information about the Portfolio at https://www.alpsfunds.com/variable-insurance-trusts/getfx. You can also request this information by contacting us at 1-866-432-2926.
|
| Additional Information Phone Number |
1-866-432-2926
|
| Additional Information Website |
https://www.alpsfunds.com/variable-insurance-trusts/getfx
|
| Expenses [Text Block] |
|
| Expenses Paid, Amount |
$ 40
|
| Expense Ratio, Percent |
0.77%
|
| Performance Past Does Not Indicate Future [Text] |
The Portfolio's past performance is not a good predictor of the Portfolio's future performance.
|
| Line Graph [Table Text Block] |

|
| Average Annual Return [Table Text Block] |
| Morningstar Growth ETF Asset Allocation - II | 12.34%
|
10.54%
|
7.55%
|
|
Growth Blended Benchmark-1(a) |
14.20%
|
11.34%
|
9.30%
|
|
Blended Secondary Benchmark(b) |
13.41%
|
13.12%
|
11.35%
|
|
Bloomberg US 1000 Index* |
15.45%
|
16.15%
|
13.31%
|
|
| No Deduction of Taxes [Text Block] |
The chart and the Average Annual Total Returns table do not reflect the deduction of taxes that a shareholder would pay on Portfolio distributions or sale of Portfolio shares.
|
| Net Assets |
$ 275,594,795
|
| Holdings Count | shares |
15
|
| Advisory Fees Paid, Amount |
$ 582,913
|
| Investment Company, Portfolio Turnover |
13.00%
|
| Additional Fund Statistics [Text Block] |
| Net Assets |
$275,594,795 |
| Number of Portfolio Holdings |
15 |
| Portfolio Turnover Rate |
13% |
| Total Advisory Fees Paid |
$582,913 |
|
| Holdings [Text Block] |
|
U.S. Equity
|
55.36% |
|
U.S. Bonds
|
17.52% |
|
Non-U.S. Equity
|
25.18% |
|
Non-U.S. Bonds
|
0.97% |
|
Cash Equivalents
|
0.97% |
 | | * | As a percentage of net assets. |
Holdings are subject to change.
|
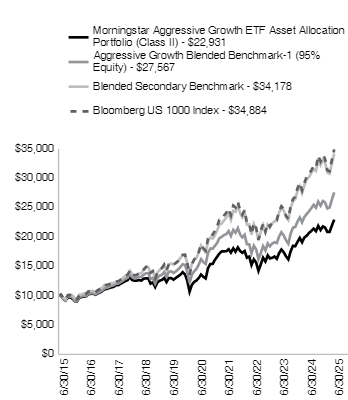
| Morningstar Aggressive Growth ETF Asset Allocation Portfolio - Class I |
|
| Shareholder Report [Line Items] |
|
| Fund Name |
Morningstar Aggressive Growth ETF Asset Allocation Portfolio
|
| Class Name |
Class I
|
| No Trading Symbol Flag |
true
|
| Annual or Semi-Annual Statement [Text Block] |
This semi-annual shareholder report contains important information about Morningstar Aggressive Growth ETF Asset Allocation Portfolio (the "Portfolio") for the period of January 1, 2025 to June 30, 2025 (the "Period").
|
| Shareholder Report Annual or Semi-Annual |
semi-annual shareholder report
|
| Additional Information [Text Block] |
You can find additional information about the Portfolio at https://www.alpsfunds.com/variable-insurance-trusts/agtfx. You can also request this information by contacting us at 1-866-432-2926.
|
| Additional Information Phone Number |
1-866-432-2926
|
| Additional Information Website |
https://www.alpsfunds.com/variable-insurance-trusts/agtfx
|
| Expenses [Text Block] |
|
| Expenses Paid, Amount |
$ 27
|
| Expense Ratio, Percent |
0.53%
|
| Performance Past Does Not Indicate Future [Text] |
The Portfolio's past performance is not a good predictor of the Portfolio's future performance.
|
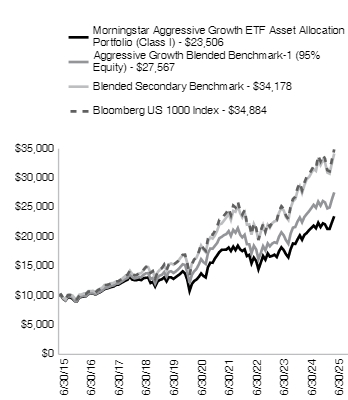
| Line Graph [Table Text Block] |
|
| Average Annual Return [Table Text Block] |
| Morningstar Aggressive Growth ETF Asset Allocation - I | 13.81%
|
13.05%
|
8.92%
|
|
Aggressive Growth Blended Benchmark-1(a) |
15.45%
|
13.65%
|
10.67%
|
|
Blended Secondary Benchmark(b) |
14.73%
|
15.76%
|
13.08%
|
|
Bloomberg US 1000 Index* |
15.45%
|
16.15%
|
13.31%
|
|
| No Deduction of Taxes [Text Block] |
The chart and the Average Annual Total Returns table do not reflect the deduction of taxes that a shareholder would pay on Portfolio distributions or sale of Portfolio shares.
|
| Net Assets |
$ 209,805,970
|
| Holdings Count | shares |
11
|
| Advisory Fees Paid, Amount |
$ 443,687
|
| Investment Company, Portfolio Turnover |
14.00%
|
| Additional Fund Statistics [Text Block] |
| Net Assets |
$209,805,970 |
| Number of Portfolio Holdings |
11 |
| Portfolio Turnover Rate |
14% |
| Total Advisory Fees Paid |
$443,687 |
|
| Holdings [Text Block] |
|
U.S. Equity
|
64.63% |
|
U.S. Bonds
|
3.89% |
|
Non-U.S. Equity
|
30.61% |
|
Cash Equivalents
|
0.87% |
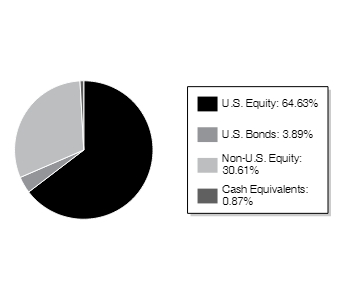 | | * | As a percentage of net assets. |
Holdings are subject to change.
|
| Morningstar Aggressive Growth ETF Asset Allocation Portfolio - Class II |
|
| Shareholder Report [Line Items] |
|
| Fund Name |
Morningstar Aggressive Growth ETF Asset Allocation Portfolio
|
| Class Name |
Class II
|
| Trading Symbol |
AGTFX
|
| Annual or Semi-Annual Statement [Text Block] |
This semi-annual shareholder report contains important information about Morningstar Aggressive Growth ETF Asset Allocation Portfolio (the "Portfolio" or "AGTFX") for the period of January 1, 2025 to June 30, 2025 (the "Period").
|
| Shareholder Report Annual or Semi-Annual |
semi-annual shareholder report
|
| Additional Information [Text Block] |
You can find additional information about the Portfolio at https://www.alpsfunds.com/variable-insurance-trusts/agtfx. You can also request this information by contacting us at 1-866-432-2926.
|
| Additional Information Phone Number |
1-866-432-2926
|
| Additional Information Website |
https://www.alpsfunds.com/variable-insurance-trusts/agtfx
|
| Expenses [Text Block] |
|
| Expenses Paid, Amount |
$ 40
|
| Expense Ratio, Percent |
0.78%
|
| Performance Past Does Not Indicate Future [Text] |
The Portfolio's past performance is not a good predictor of the Portfolio's future performance.
|
| Line Graph [Table Text Block] |
|
| Average Annual Return [Table Text Block] |
| Morningstar Aggressive Growth ETF Asset Allocation - II | 13.56%
|
12.77%
|
8.65%
|
|
Aggressive Growth Blended Benchmark-1(a) |
15.45%
|
13.65%
|
10.67%
|
|
Blended Secondary Benchmark(b) |
14.73%
|
15.76%
|
13.08%
|
|
Bloomberg US 1000 Index* |
15.45%
|
16.15%
|
13.31%
|
|
| No Deduction of Taxes [Text Block] |
The chart and the Average Annual Total Returns table do not reflect the deduction of taxes that a shareholder would pay on Portfolio distributions or sale of Portfolio shares.
|
| Net Assets |
$ 209,805,970
|
| Holdings Count | shares |
11
|
| Advisory Fees Paid, Amount |
$ 443,687
|
| Investment Company, Portfolio Turnover |
14.00%
|
| Additional Fund Statistics [Text Block] |
| Net Assets |
$209,805,970 |
| Number of Portfolio Holdings |
11 |
| Portfolio Turnover Rate |
14% |
| Total Advisory Fees Paid |
$443,687 |
|
| Holdings [Text Block] |
|
U.S. Equity
|
64.63% |
|
U.S. Bonds
|
3.89% |
|
Non-U.S. Equity
|
30.61% |
|
Cash Equivalents
|
0.87% |
 | | * | As a percentage of net assets. |
Holdings are subject to change.
|
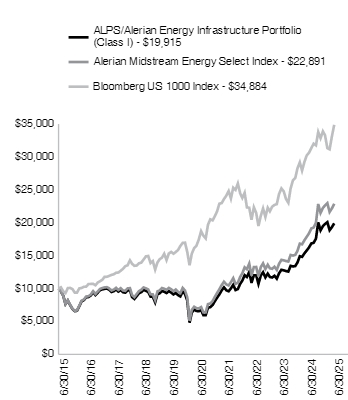
| ALPS/Alerian Energy Infrastructure Portfolio - Class I |
|
| Shareholder Report [Line Items] |
|
| Fund Name |
ALPS | Alerian Energy Infrastructure Portfolio
|
| Class Name |
Class I
|
| No Trading Symbol Flag |
true
|
| Annual or Semi-Annual Statement [Text Block] |
This semi-annual shareholder report contains important information about ALPS | Alerian Energy Infrastructure Portfolio (the "Portfolio") for the period of January 1, 2025 to June 30, 2025 (the "Period").
|
| Shareholder Report Annual or Semi-Annual |
semi-annual shareholder report
|
| Additional Information [Text Block] |
You can find additional information about the Portfolio at https://www.alpsfunds.com/variable-insurance-trusts/alefx. You can also request this information by contacting us at 1-866-432-2926.
|
| Additional Information Phone Number |
1-866-432-2926
|
| Additional Information Website |
https://www.alpsfunds.com/variable-insurance-trusts/alefx
|
| Expenses [Text Block] |
|
| Expenses Paid, Amount |
$ 48
|
| Expense Ratio, Percent |
0.95%
|
| Performance Past Does Not Indicate Future [Text] |
The Portfolio's past performance is not a good predictor of the Portfolio's future performance.
|
| Line Graph [Table Text Block] |
|
| Average Annual Return [Table Text Block] |
| ALPS | Alerian Energy Infrastructure Portfolio - I - NAV | 26.19%
|
24.71%
|
7.13%
|
|
Alerian Midstream Energy Select Index |
28.17%
|
26.65%
|
8.63%
|
|
Bloomberg US 1000 Index* |
15.45%
|
16.15%
|
13.31%
|
|
| No Deduction of Taxes [Text Block] |
The chart and the Average Annual Total Returns table do not reflect the deduction of taxes that a shareholder would pay on Portfolio distributions or sale of Portfolio shares.
|
| Net Assets |
$ 128,084,446
|
| Holdings Count | shares |
25
|
| Advisory Fees Paid, Amount |
$ 455,281
|
| Investment Company, Portfolio Turnover |
10.00%
|
| Additional Fund Statistics [Text Block] |
| Net Assets |
$128,084,446 |
| Number of Portfolio Holdings |
25 |
| Portfolio Turnover Rate |
10% |
| Total Advisory Fees Paid |
$455,281 |
|
| Holdings [Text Block] |
|
Energy Transfer LP
|
8.83% |
|
Enbridge, Inc.
|
7.84% |
|
Enterprise Products Partners LP
|
7.12% |
|
The Williams Cos., Inc.
|
6.48% |
|
Kinder Morgan, Inc.
|
5.30% |
|
Cheniere Energy, Inc.
|
5.17% |
|
DT Midstream, Inc.
|
5.16% |
|
Keyera Corp.
|
4.99% |
|
Plains GP Holdings LP
|
4.97% |
|
MPLX LP
|
4.95% |
|
Total % of Top 10 Holdings
|
60.81% |
|
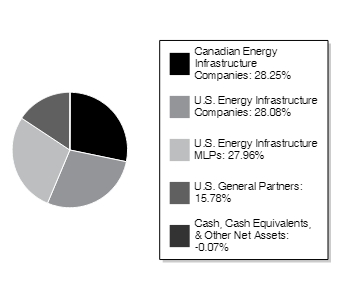
Canadian Energy Infrastructure Companies
|
28.25% |
|
U.S. Energy Infrastructure Companies
|
28.08% |
|
U.S. Energy Infrastructure MLPs
|
27.96% |
|
U.S. General Partners
|
15.78% |
|
Cash, Cash Equivalents, & Other Net Assets
|
-0.07% |
 | | * | As a percentage of net assets. |
Holdings are subject to change.
|
| Largest Holdings [Text Block] |
|
Energy Transfer LP
|
8.83% |
|
Enbridge, Inc.
|
7.84% |
|
Enterprise Products Partners LP
|
7.12% |
|
The Williams Cos., Inc.
|
6.48% |
|
Kinder Morgan, Inc.
|
5.30% |
|
Cheniere Energy, Inc.
|
5.17% |
|
DT Midstream, Inc.
|
5.16% |
|
Keyera Corp.
|
4.99% |
|
Plains GP Holdings LP
|
4.97% |
|
MPLX LP
|
4.95% |
|
Total % of Top 10 Holdings
|
60.81% |
|
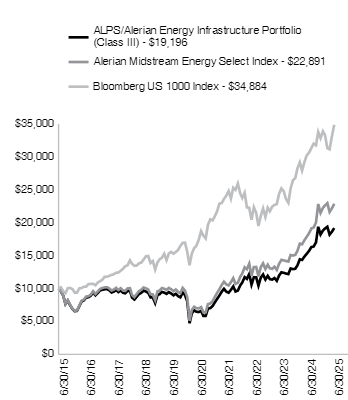
| ALPS/Alerian Energy Infrastructure Portfolio - Class III |
|
| Shareholder Report [Line Items] |
|
| Fund Name |
ALPS | Alerian Energy Infrastructure Portfolio
|
| Class Name |
Class III
|
| Trading Symbol |
ALEFX
|
| Annual or Semi-Annual Statement [Text Block] |
This semi-annual shareholder report contains important information about ALPS | Alerian Energy Infrastructure Portfolio (the "Portfolio" or "ALEFX") for the period of January 1, 2025 to June 30, 2025 (the "Period").
|
| Shareholder Report Annual or Semi-Annual |
semi-annual shareholder report
|
| Additional Information [Text Block] |
You can find additional information about the Portfolio at https://www.alpsfunds.com/variable-insurance-trusts/alefx. You can also request this information by contacting us at 1-866-432-2926.
|
| Additional Information Phone Number |
1-866-432-2926
|
| Additional Information Website |
https://www.alpsfunds.com/variable-insurance-trusts/alefx
|
| Expenses [Text Block] |
|
| Expenses Paid, Amount |
$ 66
|
| Expense Ratio, Percent |
1.30%
|
| Performance Past Does Not Indicate Future [Text] |
The Portfolio's past performance is not a good predictor of the Portfolio's future performance.
|
| Line Graph [Table Text Block] |
|
| Average Annual Return [Table Text Block] |
| ALPS | Alerian Energy Infrastructure Portfolio - III - NAV | 25.65%
|
24.25%
|
6.74%
|
|
Alerian Midstream Energy Select Index |
28.17%
|
26.65%
|
8.63%
|
|
Bloomberg US 1000 Index* |
15.45%
|
16.15%
|
13.31%
|
|
| No Deduction of Taxes [Text Block] |
The chart and the Average Annual Total Returns table do not reflect the deduction of taxes that a shareholder would pay on Portfolio distributions or sale of Portfolio shares.
|
| Net Assets |
$ 128,084,446
|
| Holdings Count | shares |
25
|
| Advisory Fees Paid, Amount |
$ 455,281
|
| Investment Company, Portfolio Turnover |
10.00%
|
| Additional Fund Statistics [Text Block] |
| Net Assets |
$128,084,446 |
| Number of Portfolio Holdings |
25 |
| Portfolio Turnover Rate |
10% |
| Total Advisory Fees Paid |
$455,281 |
|
| Holdings [Text Block] |
|
Energy Transfer LP
|
8.83% |
|
Enbridge, Inc.
|
7.84% |
|
Enterprise Products Partners LP
|
7.12% |
|
The Williams Cos., Inc.
|
6.48% |
|
Kinder Morgan, Inc.
|
5.30% |
|
Cheniere Energy, Inc.
|
5.17% |
|
DT Midstream, Inc.
|
5.16% |
|
Keyera Corp.
|
4.99% |
|
Plains GP Holdings LP
|
4.97% |
|
MPLX LP
|
4.95% |
|
Total % of Top 10 Holdings
|
60.81% |
|
Canadian Energy Infrastructure Companies
|
28.25% |
|
U.S. Energy Infrastructure Companies
|
28.08% |
|
U.S. Energy Infrastructure MLPs
|
27.96% |
|
U.S. General Partners
|
15.78% |
|
Cash, Cash Equivalents, & Other Net Assets
|
-0.07% |
 | | * | As a percentage of net assets. |
Holdings are subject to change.
|
| Largest Holdings [Text Block] |
|
Energy Transfer LP
|
8.83% |
|
Enbridge, Inc.
|
7.84% |
|
Enterprise Products Partners LP
|
7.12% |
|
The Williams Cos., Inc.
|
6.48% |
|
Kinder Morgan, Inc.
|
5.30% |
|
Cheniere Energy, Inc.
|
5.17% |
|
DT Midstream, Inc.
|
5.16% |
|
Keyera Corp.
|
4.99% |
|
Plains GP Holdings LP
|
4.97% |
|
MPLX LP
|
4.95% |
|
Total % of Top 10 Holdings
|
60.81% |
|
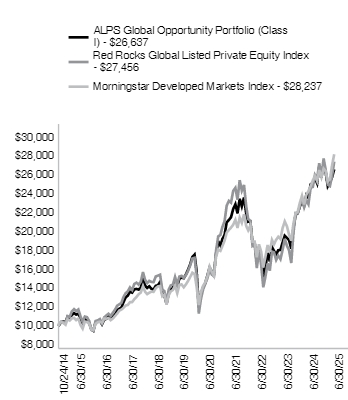
| ALPS Global Opportunity Portfolio - Class I |
|
| Shareholder Report [Line Items] |
|
| Fund Name |
ALPS Global Opportunity Portfolio
|
| Class Name |
Class I
|
| No Trading Symbol Flag |
true
|
| Annual or Semi-Annual Statement [Text Block] |
This semi-annual shareholder report contains important information about ALPS Global Opportunity Portfolio (the "Portfolio") for the period of January 1, 2025 to June 30, 2025 (the "Period").
|
| Shareholder Report Annual or Semi-Annual |
semi-annual shareholder report
|
| Additional Information [Text Block] |
You can find additional information about the Portfolio at https://www.alpsfunds.com/variable-insurance-trusts/avpex. You can also request this information by contacting us at 1-866-432-2926.
|
| Additional Information Phone Number |
1-866-432-2926
|
| Additional Information Website |
https://www.alpsfunds.com/variable-insurance-trusts/avpex
|
| Expenses [Text Block] |
|
| Expenses Paid, Amount |
$ 55
|
| Expense Ratio, Percent |
1.10%
|
| Performance Past Does Not Indicate Future [Text] |
The Portfolio's past performance is not a good predictor of the Portfolio's future performance.
|
| Line Graph [Table Text Block] |
|
| Average Annual Return [Table Text Block] |
| ALPS Global Opportunity Portfolio - I - NAV | 12.82%
|
12.88%
|
9.02%
|
|
Red Rocks Global Listed Private Equity Index |
19.70%
|
13.63%
|
9.01%
|
|
Morningstar Developed Markets Index* |
16.08%
|
14.04%
|
10.25%
|
|
| No Deduction of Taxes [Text Block] |
The chart and the Average Annual Total Returns table do not reflect the deduction of taxes that a shareholder would pay on Portfolio distributions or sale of Portfolio shares.
|
| Net Assets |
$ 23,357,383
|
| Holdings Count | shares |
51
|
| Advisory Fees Paid, Amount |
$ 64,653
|
| Investment Company, Portfolio Turnover |
13.00%
|
| Additional Fund Statistics [Text Block] |
| Net Assets |
$23,357,383 |
| Number of Portfolio Holdings |
51 |
| Portfolio Turnover Rate |
13% |
| Total Advisory Fees Paid |
$64,653 |
|
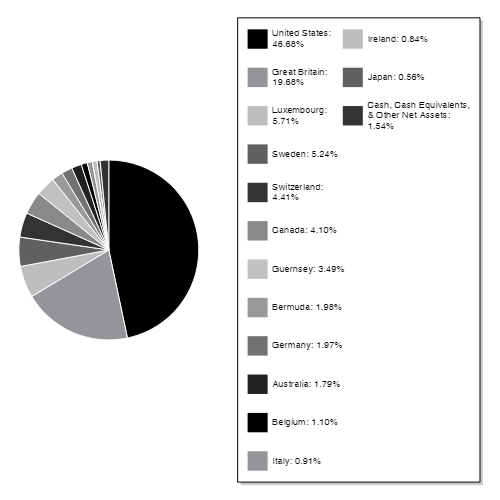
| Holdings [Text Block] |
|
United States
|
46.68% |
|
Great Britain
|
19.68% |
|
Luxembourg
|
5.71% |
|
Sweden
|
5.24% |
|
Switzerland
|
4.41% |
|
Canada
|
4.10% |
|
Guernsey
|
3.49% |
|
Bermuda
|
1.98% |
|
Germany
|
1.97% |
|
Australia
|
1.79% |
|
Belgium
|
1.10% |
|
Italy
|
0.91% |
|
Ireland
|
0.84% |
|
Japan
|
0.56% |
|
Cash, Cash Equivalents, & Other Net Assets
|
1.54% |

|
3i Group PLC
|
6.24% |
|
KKR & Co., Inc.
|
5.13% |
|
HgCapital Trust PLC
|
4.94% |
|
Ares Management LP
|
4.82% |
|
Berkshire Hathaway, Inc.
|
4.38% |
|
Constellation Software, Inc.
|
4.10% |
|
Brederode SA
|
3.97% |
|
Apollo Global Management, Inc.
|
3.58% |
|
Partners Group Holding AG
|
3.44% |
|
Blackstone, Inc.
|
3.42% |
|
Total % of Top 10 Holdings
|
44.02% |
| | * | As a percentage of net assets. |
Holdings are subject to change.
|
| Largest Holdings [Text Block] |
|
3i Group PLC
|
6.24% |
|
KKR & Co., Inc.
|
5.13% |
|
HgCapital Trust PLC
|
4.94% |
|
Ares Management LP
|
4.82% |
|
Berkshire Hathaway, Inc.
|
4.38% |
|
Constellation Software, Inc.
|
4.10% |
|
Brederode SA
|
3.97% |
|
Apollo Global Management, Inc.
|
3.58% |
|
Partners Group Holding AG
|
3.44% |
|
Blackstone, Inc.
|
3.42% |
|
Total % of Top 10 Holdings
|
44.02% |
| | * | As a percentage of net assets. |
Holdings are subject to change. |
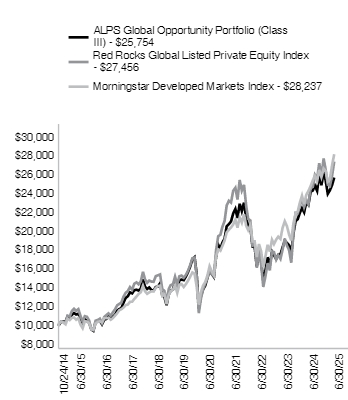
| ALPS Global Opportunity Portfolio - Class III |
|
| Shareholder Report [Line Items] |
|
| Fund Name |
ALPS Global Opportunity Portfolio
|
| Class Name |
Class III
|
| Trading Symbol |
AVPEX
|
| Annual or Semi-Annual Statement [Text Block] |
This semi-annual shareholder report contains important information about ALPS Global Opportunity Portfolio (the "Portfolio" or "AVPEX") for the period of January 1, 2025 to June 30, 2025 (the "Period").
|
| Shareholder Report Annual or Semi-Annual |
semi-annual shareholder report
|
| Additional Information [Text Block] |
You can find additional information about the Portfolio at https://www.alpsfunds.com/variable-insurance-trusts/avpex. You can also request this information by contacting us at 1-866-432-2926.
|
| Additional Information Phone Number |
1-866-432-2926
|
| Additional Information Website |
https://www.alpsfunds.com/variable-insurance-trusts/avpex
|
| Expenses [Text Block] |
|
| Expenses Paid, Amount |
$ 71
|
| Expense Ratio, Percent |
1.40%
|
| Performance Past Does Not Indicate Future [Text] |
The Portfolio's past performance is not a good predictor of the Portfolio's future performance.
|
| Line Graph [Table Text Block] |
|
| Average Annual Return [Table Text Block] |
| ALPS Global Opportunity Portfolio - III - NAV | 12.61%
|
12.54%
|
8.68%
|
|
Red Rocks Global Listed Private Equity Index |
19.70%
|
13.63%
|
9.01%
|
|
Morningstar Developed Markets Index* |
16.08%
|
14.04%
|
10.25%
|
|
| No Deduction of Taxes [Text Block] |
The chart and the Average Annual Total Returns table do not reflect the deduction of taxes that a shareholder would pay on Portfolio distributions or sale of Portfolio shares.
|
| Net Assets |
$ 23,357,383
|
| Holdings Count | shares |
51
|
| Advisory Fees Paid, Amount |
$ 64,653
|
| Investment Company, Portfolio Turnover |
13.00%
|
| Additional Fund Statistics [Text Block] |
| Net Assets |
$23,357,383 |
| Number of Portfolio Holdings |
51 |
| Portfolio Turnover Rate |
13% |
| Total Advisory Fees Paid |
$64,653 |
|
| Holdings [Text Block] |
|
United States
|
46.68% |
|
Great Britain
|
19.68% |
|
Luxembourg
|
5.71% |
|
Sweden
|
5.24% |
|
Switzerland
|
4.41% |
|
Canada
|
4.10% |
|
Guernsey
|
3.49% |
|
Bermuda
|
1.98% |
|
Germany
|
1.97% |
|
Australia
|
1.79% |
|
Belgium
|
1.10% |
|
Italy
|
0.91% |
|
Ireland
|
0.84% |
|
Japan
|
0.56% |
|
Cash, Cash Equivalents, & Other Net Assets
|
1.54% |
|
3i Group PLC
|
6.24% |
|
KKR & Co., Inc.
|
5.13% |
|
HgCapital Trust PLC
|
4.94% |
|
Ares Management LP
|
4.82% |
|
Berkshire Hathaway, Inc.
|
4.38% |
|
Constellation Software, Inc.
|
4.10% |
|
Brederode SA
|
3.97% |
|
Apollo Global Management, Inc.
|
3.58% |
|
Partners Group Holding AG
|
3.44% |
|
Blackstone, Inc.
|
3.42% |
|
Total % of Top 10 Holdings
|
44.02% |
| | * | As a percentage of net assets. |
Holdings are subject to change.
|
| Largest Holdings [Text Block] |
|
3i Group PLC
|
6.24% |
|
KKR & Co., Inc.
|
5.13% |
|
HgCapital Trust PLC
|
4.94% |
|
Ares Management LP
|
4.82% |
|
Berkshire Hathaway, Inc.
|
4.38% |
|
Constellation Software, Inc.
|
4.10% |
|
Brederode SA
|
3.97% |
|
Apollo Global Management, Inc.
|
3.58% |
|
Partners Group Holding AG
|
3.44% |
|
Blackstone, Inc.
|
3.42% |
|
Total % of Top 10 Holdings
|
44.02% |
| | * | As a percentage of net assets. |
Holdings are subject to change. |