Shareholder Report
Jun. 30, 2025
USD ($)
Holding
Shareholder Report |
6 Months Ended |
|---|---|
|
Jun. 30, 2025
USD ($)
Holding
| |
| Shareholder Report [Line Items] | |
| Document Type | N-CSRS |
| Amendment Flag | false |
| Registrant Name | Gateway Trust |
| Entity Central Index Key | 0001406305 |
| Entity Investment Company Type | N-1A |
| Document Period End Date | Jun. 30, 2025 |
| C000146363 | |
| Shareholder Report [Line Items] | |
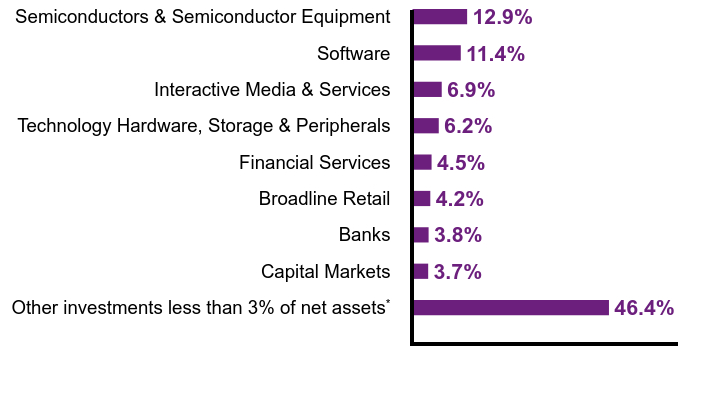
| Fund Name | Gateway Equity Call Premium Fund |
| Class Name | Class A |
| Trading Symbol | GCPAX |
| Annual or Semi-Annual Statement [Text Block] | This semi-annual shareholder report contains important information about Gateway Equity Call Premium Fund for the period of January 1, 2025 to June 30, 2025. |
| Shareholder Report Annual or Semi-Annual | Semi-annual Shareholder Report |
| Additional Information [Text Block] | You can find additional information (including tax information) about the Fund at im.natixis.com/funddocuments. You can also request the information by contacting us at (800) 225-5478 or by contacting your financial intermediary directly. |
| Additional Information Phone Number | (800) 225-5478 |
| Additional Information Website | <span style="box-sizing: border-box; color: rgb(0, 0, 0); display: inline; flex-wrap: nowrap; font-size: 12px; font-weight: 400; grid-area: auto; line-height: 18px; margin: 0px; overflow: visible; text-align: left; text-align-last: auto; white-space-collapse: preserve-breaks;">im.natixis.com/funddocuments</span> |
| Expenses [Text Block] | |
| Expenses Paid, Amount | $ 47 |
| Expense Ratio, Percent | 0.93% |
| AssetsNet | $ 266,754,056 |
| Holdings Count | Holding | 257 |
| Advisory Fees Paid, Amount | $ 554,951 |
| InvestmentCompanyPortfolioTurnover | 9.00% |
| Additional Fund Statistics [Text Block] | |
| Holdings [Text Block] | |
| Largest Holdings [Text Block] | |
| Material Fund Change [Text Block] | |
| C000146364 | |
| Shareholder Report [Line Items] | |
| Fund Name | Gateway Equity Call Premium Fund |
| Class Name | Class C |
| Trading Symbol | GCPCX |
| Annual or Semi-Annual Statement [Text Block] | This semi-annual shareholder report contains important information about Gateway Equity Call Premium Fund for the period of January 1, 2025 to June 30, 2025. |
| Shareholder Report Annual or Semi-Annual | Semi-annual Shareholder Report |
| Additional Information [Text Block] | You can find additional information (including tax information) about the Fund at im.natixis.com/funddocuments. You can also request the information by contacting us at (800) 225-5478 or by contacting your financial intermediary directly. |
| Additional Information Phone Number | (800) 225-5478 |
| Additional Information Website | <span style="box-sizing: border-box; color: rgb(0, 0, 0); display: inline; flex-wrap: nowrap; font-size: 12px; font-weight: 400; grid-area: auto; line-height: 18px; margin: 0px; overflow: visible; text-align: left; text-align-last: auto; white-space-collapse: preserve-breaks;">im.natixis.com/funddocuments</span> |
| Expenses [Text Block] | |
| Expenses Paid, Amount | $ 84 |
| Expense Ratio, Percent | 1.68% |
| AssetsNet | $ 266,754,056 |
| Holdings Count | Holding | 257 |
| Advisory Fees Paid, Amount | $ 554,951 |
| InvestmentCompanyPortfolioTurnover | 9.00% |
| Additional Fund Statistics [Text Block] | |
| Holdings [Text Block] | |
| Largest Holdings [Text Block] | |
| Material Fund Change [Text Block] | |
| C000190731 | |
| Shareholder Report [Line Items] | |
| Fund Name | Gateway Equity Call Premium Fund |
| Class Name | Class N |
| Trading Symbol | GCPNX |
| Annual or Semi-Annual Statement [Text Block] | This semi-annual shareholder report contains important information about Gateway Equity Call Premium Fund for the period of January 1, 2025 to June 30, 2025. |
| Shareholder Report Annual or Semi-Annual | Semi-annual Shareholder Report |
| Additional Information [Text Block] | You can find additional information (including tax information) about the Fund at im.natixis.com/funddocuments. You can also request the information by contacting us at (800) 225-5478 or by contacting your financial intermediary directly. |
| Additional Information Phone Number | (800) 225-5478 |
| Additional Information Website | <span style="box-sizing: border-box; color: rgb(0, 0, 0); display: inline; flex-wrap: nowrap; font-size: 12px; font-weight: 400; grid-area: auto; line-height: 18px; margin: 0px; overflow: visible; text-align: left; text-align-last: auto; white-space-collapse: preserve-breaks;">im.natixis.com/funddocuments</span> |
| Expenses [Text Block] | |
| Expenses Paid, Amount | $ 32 |
| Expense Ratio, Percent | 0.63% |
| AssetsNet | $ 266,754,056 |
| Holdings Count | Holding | 257 |
| Advisory Fees Paid, Amount | $ 554,951 |
| InvestmentCompanyPortfolioTurnover | 9.00% |
| Additional Fund Statistics [Text Block] | |
| Holdings [Text Block] | |
| Largest Holdings [Text Block] | |
| Material Fund Change [Text Block] | |
| C000146365 | |
| Shareholder Report [Line Items] | |
| Fund Name | Gateway Equity Call Premium Fund |
| Class Name | Class Y |
| Trading Symbol | GCPYX |
| Annual or Semi-Annual Statement [Text Block] | This semi-annual shareholder report contains important information about Gateway Equity Call Premium Fund for the period of January 1, 2025 to June 30, 2025. |
| Shareholder Report Annual or Semi-Annual | Semi-annual Shareholder Report |
| Additional Information [Text Block] | You can find additional information (including tax information) about the Fund at im.natixis.com/funddocuments. You can also request the information by contacting us at (800) 225-5478 or by contacting your financial intermediary directly. |
| Additional Information Phone Number | (800) 225-5478 |
| Additional Information Website | <span style="box-sizing: border-box; color: rgb(0, 0, 0); display: inline; flex-wrap: nowrap; font-size: 12px; font-weight: 400; grid-area: auto; line-height: 18px; margin: 0px; overflow: visible; text-align: left; text-align-last: auto; white-space-collapse: preserve-breaks;">im.natixis.com/funddocuments</span> |
| Expenses [Text Block] | |
| Expenses Paid, Amount | $ 34 |
| Expense Ratio, Percent | 0.68% |
| AssetsNet | $ 266,754,056 |
| Holdings Count | Holding | 257 |
| Advisory Fees Paid, Amount | $ 554,951 |
| InvestmentCompanyPortfolioTurnover | 9.00% |
| Additional Fund Statistics [Text Block] | |
| Holdings [Text Block] | |
| Largest Holdings [Text Block] | |
| Material Fund Change [Text Block] | |
| C000052969 | |
| Shareholder Report [Line Items] | |
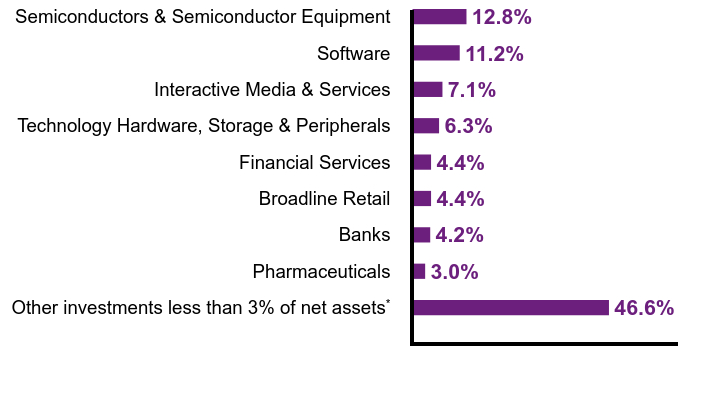
| Fund Name | Gateway Fund |
| Class Name | Class A |
| Trading Symbol | GATEX |
| Annual or Semi-Annual Statement [Text Block] | This semi-annual shareholder report contains important information about Gateway Fund for the period of January 1, 2025 to June 30, 2025. |
| Shareholder Report Annual or Semi-Annual | Semi-annual Shareholder Report |
| Additional Information [Text Block] | You can find additional information (including tax information) about the Fund at im.natixis.com/funddocuments. You can also request the information by contacting us at (800) 225-5478 or by contacting your financial intermediary directly. |
| Additional Information Phone Number | (800) 225-5478 |
| Additional Information Website | <span style="box-sizing: border-box; color: rgb(0, 0, 0); display: inline; flex-wrap: nowrap; font-size: 12px; font-weight: 400; grid-area: auto; line-height: 18px; margin: 0px; overflow: visible; text-align: left; text-align-last: auto; white-space-collapse: preserve-breaks;">im.natixis.com/funddocuments</span> |
| Expenses [Text Block] | |
| Expenses Paid, Amount | $ 47 |
| Expense Ratio, Percent | 0.93% |
| AssetsNet | $ 6,781,218,825 |
| Holdings Count | Holding | 205 |
| Advisory Fees Paid, Amount | $ 18,564,142 |
| InvestmentCompanyPortfolioTurnover | 13.00% |
| Additional Fund Statistics [Text Block] | |
| Holdings [Text Block] | |
| Largest Holdings [Text Block] | |
| Material Fund Change [Text Block] | |
| C000052970 | |
| Shareholder Report [Line Items] | |
| Fund Name | Gateway Fund |
| Class Name | Class C |
| Trading Symbol | GTECX |
| Annual or Semi-Annual Statement [Text Block] | This semi-annual shareholder report contains important information about Gateway Fund for the period of January 1, 2025 to June 30, 2025. |
| Shareholder Report Annual or Semi-Annual | Semi-annual Shareholder Report |
| Additional Information [Text Block] | You can find additional information (including tax information) about the Fund at im.natixis.com/funddocuments. You can also request the information by contacting us at (800) 225-5478 or by contacting your financial intermediary directly. |
| Additional Information Phone Number | (800) 225-5478 |
| Additional Information Website | <span style="box-sizing: border-box; color: rgb(0, 0, 0); display: inline; flex-wrap: nowrap; font-size: 12px; font-weight: 400; grid-area: auto; line-height: 18px; margin: 0px; overflow: visible; text-align: left; text-align-last: auto; white-space-collapse: preserve-breaks;">im.natixis.com/funddocuments</span> |
| Expenses [Text Block] | |
| Expenses Paid, Amount | $ 85 |
| Expense Ratio, Percent | 1.70% |
| AssetsNet | $ 6,781,218,825 |
| Holdings Count | Holding | 205 |
| Advisory Fees Paid, Amount | $ 18,564,142 |
| InvestmentCompanyPortfolioTurnover | 13.00% |
| Additional Fund Statistics [Text Block] | |
| Holdings [Text Block] | |
| Largest Holdings [Text Block] | |
| Material Fund Change [Text Block] | |
| C000190730 | |
| Shareholder Report [Line Items] | |
| Fund Name | Gateway Fund |
| Class Name | Class N |
| Trading Symbol | GTENX |
| Annual or Semi-Annual Statement [Text Block] | This semi-annual shareholder report contains important information about Gateway Fund for the period of January 1, 2025 to June 30, 2025. |
| Shareholder Report Annual or Semi-Annual | Semi-annual Shareholder Report |
| Additional Information [Text Block] | You can find additional information (including tax information) about the Fund at im.natixis.com/funddocuments. You can also request the information by contacting us at (800) 225-5478 or by contacting your financial intermediary directly. |
| Additional Information Phone Number | (800) 225-5478 |
| Additional Information Website | <span style="box-sizing: border-box; color: rgb(0, 0, 0); display: inline; flex-wrap: nowrap; font-size: 12px; font-weight: 400; grid-area: auto; line-height: 18px; margin: 0px; overflow: visible; text-align: left; text-align-last: auto; white-space-collapse: preserve-breaks;">im.natixis.com/funddocuments</span> |
| Expenses [Text Block] | |
| Expenses Paid, Amount | $ 33 |
| Expense Ratio, Percent | 0.65% |
| AssetsNet | $ 6,781,218,825 |
| Holdings Count | Holding | 205 |
| Advisory Fees Paid, Amount | $ 18,564,142 |
| InvestmentCompanyPortfolioTurnover | 13.00% |
| Additional Fund Statistics [Text Block] | |
| Holdings [Text Block] | |
| Largest Holdings [Text Block] | |
| Material Fund Change [Text Block] | |
| C000052971 | |
| Shareholder Report [Line Items] | |
| Fund Name | Gateway Fund |
| Class Name | Class Y |
| Trading Symbol | GTEYX |
| Annual or Semi-Annual Statement [Text Block] | This semi-annual shareholder report contains important information about Gateway Fund for the period of January 1, 2025 to June 30, 2025. |
| Shareholder Report Annual or Semi-Annual | Semi-annual Shareholder Report |
| Additional Information [Text Block] | You can find additional information (including tax information) about the Fund at im.natixis.com/funddocuments. You can also request the information by contacting us at (800) 225-5478 or by contacting your financial intermediary directly. |
| Additional Information Phone Number | (800) 225-5478 |
| Additional Information Website | <span style="box-sizing: border-box; color: rgb(0, 0, 0); display: inline; flex-wrap: nowrap; font-size: 12px; font-weight: 400; grid-area: auto; line-height: 18px; margin: 0px; overflow: visible; text-align: left; text-align-last: auto; white-space-collapse: preserve-breaks;">im.natixis.com/funddocuments</span> |
| Expenses [Text Block] | |
| Expenses Paid, Amount | $ 35 |
| Expense Ratio, Percent | 0.70% |
| AssetsNet | $ 6,781,218,825 |
| Holdings Count | Holding | 205 |
| Advisory Fees Paid, Amount | $ 18,564,142 |
| InvestmentCompanyPortfolioTurnover | 13.00% |
| Additional Fund Statistics [Text Block] | |
| Holdings [Text Block] | |
| Largest Holdings [Text Block] | |
| Material Fund Change [Text Block] |