Shareholder Report
Jun. 30, 2025
USD ($)
Holding
®
– Victory Sycamore Established Value Fund (the Fund) for the period of January 1, 2025 to June 30, 2025.
columbiathreadneedleus.com/resources/literature
. You can also request more information by contacting us at 1-800-345-6611.
What were the Fund costs for the reporting period?
(Based on a hypothetical $10,000 investment)
| Class | Cost of a $10,000 investment | Cost paid as a percentage of a $10,000 investment |
| Class 1 | $ 41 |
0.82 % (a) |
| (a) |
Annualized.
|
Key Fund Statistics
Fund net assets |
$ 439,939,432 |
Total number of portfolio holdings |
74 |
Portfolio turnover for the reporting period |
28% |
Graphical Representation of Fund Holdings
The tables below show the investment makeup of the Fund represented as a percentage of Fund net assets. Derivatives are excluded from the tables unless otherwise noted. The Fund's portfolio composition is subject to change.
Top Holdings
| U.S. Foods Holding Corp. | 2.4 % |
| Alliant Energy Corp. | 2.4 % |
| Crown Holdings, Inc. | 2.0 % |
| Quest Diagnostics, Inc. | 1.9 % |
| Fidelity National Financial, Inc. | 1.9 % |
| Performance Food Group, Inc. | 1.9 % |
| Willis Towers Watson PLC | 1.8 % |
| Genpact Ltd. | 1.8 % |
| Expedia Group, Inc. | 1.8 % |
| American Water Works Co., Inc. | 1.8 % |
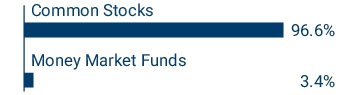
Asset Categories

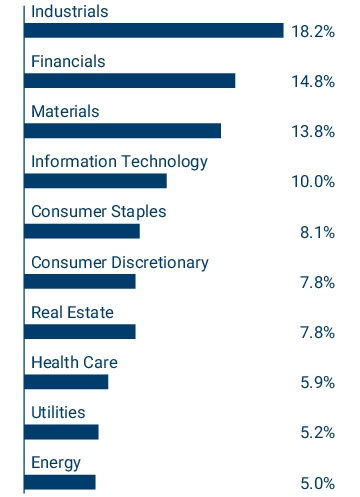
Equity Sector Allocation

Top Holdings
| U.S. Foods Holding Corp. | 2.4 % |
| Alliant Energy Corp. | 2.4 % |
| Crown Holdings, Inc. | 2.0 % |
| Quest Diagnostics, Inc. | 1.9 % |
| Fidelity National Financial, Inc. | 1.9 % |
| Performance Food Group, Inc. | 1.9 % |
| Willis Towers Watson PLC | 1.8 % |
| Genpact Ltd. | 1.8 % |
| Expedia Group, Inc. | 1.8 % |
| American Water Works Co., Inc. | 1.8 % |
®
– Victory Sycamore Established Value Fund (the Fund) for the period of January 1, 2025 to June 30, 2025.
columbiathreadneedleus.com/resources/literature
. You can also request more information by contacting us at 1-800-345-6611.
What were the Fund costs for the reporting period?
(Based on a hypothetical $10,000 investment)
| Class | Cost of a $10,000 investment | Cost paid as a percentage of a $10,000 investment |
| Class 2 | $ 53 |
1.07 % (a) |
| (a) |
Annualized.
|
Key Fund Statistics
Fund net assets |
$ 439,939,432 |
Total number of portfolio holdings |
74 |
Portfolio turnover for the reporting period |
28% |
Graphical Representation of Fund Holdings
The tables below show the investment makeup of the Fund represented as a percentage of Fund net assets. Derivatives are excluded from the tables unless otherwise noted. The Fund's portfolio composition is subject to change.
Top Holdings
| U.S. Foods Holding Corp. | 2.4 % |
| Alliant Energy Corp. | 2.4 % |
| Crown Holdings, Inc. | 2.0 % |
| Quest Diagnostics, Inc. | 1.9 % |
| Fidelity National Financial, Inc. | 1.9 % |
| Performance Food Group, Inc. | 1.9 % |
| Willis Towers Watson PLC | 1.8 % |
| Genpact Ltd. | 1.8 % |
| Expedia Group, Inc. | 1.8 % |
| American Water Works Co., Inc. | 1.8 % |
Asset Categories

Equity Sector Allocation
Top Holdings
| U.S. Foods Holding Corp. | 2.4 % |
| Alliant Energy Corp. | 2.4 % |
| Crown Holdings, Inc. | 2.0 % |
| Quest Diagnostics, Inc. | 1.9 % |
| Fidelity National Financial, Inc. | 1.9 % |
| Performance Food Group, Inc. | 1.9 % |
| Willis Towers Watson PLC | 1.8 % |
| Genpact Ltd. | 1.8 % |
| Expedia Group, Inc. | 1.8 % |
| American Water Works Co., Inc. | 1.8 % |
®
– Victory Sycamore Established Value Fund (the Fund) for the period of January 1, 2025 to June 30, 2025.
columbiathreadneedleus.com/resources/literature
. You can also request more information by contacting us at 1-800-345-6611.
What were the Fund costs for the reporting period?
(Based on a hypothetical $10,000 investment)
| Class | Cost of a $10,000 investment | Cost paid as a percentage of a $10,000 investment |
| Class 3 | $ 46 |
0.94 % (a) |
| (a) |
Annualized.
|
Key Fund Statistics
Fund net assets |
$ 439,939,432 |
Total number of portfolio holdings |
74 |
Portfolio turnover for the reporting period |
28% |
Graphical Representation of Fund Holdings
The tables below show the investment makeup of the Fund represented as a percentage of Fund net assets. Derivatives are excluded from the tables unless otherwise noted. The Fund's portfolio composition is subject to change.
Top Holdings
| U.S. Foods Holding Corp. | 2.4 % |
| Alliant Energy Corp. | 2.4 % |
| Crown Holdings, Inc. | 2.0 % |
| Quest Diagnostics, Inc. | 1.9 % |
| Fidelity National Financial, Inc. | 1.9 % |
| Performance Food Group, Inc. | 1.9 % |
| Willis Towers Watson PLC | 1.8 % |
| Genpact Ltd. | 1.8 % |
| Expedia Group, Inc. | 1.8 % |
| American Water Works Co., Inc. | 1.8 % |
Asset Categories
Equity Sector Allocation

Top Holdings
| U.S. Foods Holding Corp. | 2.4 % |
| Alliant Energy Corp. | 2.4 % |
| Crown Holdings, Inc. | 2.0 % |
| Quest Diagnostics, Inc. | 1.9 % |
| Fidelity National Financial, Inc. | 1.9 % |
| Performance Food Group, Inc. | 1.9 % |
| Willis Towers Watson PLC | 1.8 % |
| Genpact Ltd. | 1.8 % |
| Expedia Group, Inc. | 1.8 % |
| American Water Works Co., Inc. | 1.8 % |
| [1] | Annualized. |