Shareholder Report
Jun. 30, 2025
USD ($)
Holding
columbiathreadneedleus.com/resources/literature
. You can also request more information by contacting us at 1-800-345-6611.
What were the Fund costs for the reporting period?
(Based on a hypothetical $10,000 investment)
| Class | Cost of a $10,000 investment | Cost paid as a percentage of a $10,000 investment |
| Class 1 | $ 35 | 0.68 % (a) |
| (a) | Annualized. |
Key Fund Statistics
Fund net assets | $ 910,152,321 |
Total number of portfolio holdings | 86 |
Portfolio turnover for the reporting period | 18% |
Graphical Representation of Fund Holdings
The tables below show the investment makeup of the Fund represented as a percentage of Fund net assets. Derivatives are excluded from the tables unless otherwise noted. The Fund's portfolio composition is subject to change.
Top Holdings
| JPMorgan Chase & Co. | 3.7 % |
| Exxon Mobil Corp. | 3.7 % |
| International Business Machines Corp. | 3.0 % |
| Cisco Systems, Inc. | 2.8 % |
| Philip Morris International, Inc. | 2.7 % |
| AbbVie, Inc. | 2.7 % |
| Goldman Sachs Group, Inc. (The) | 2.7 % |
| Johnson & Johnson | 2.2 % |
| Chevron Corp. | 2.1 % |
| Bank of America Corp. | 2.0 % |
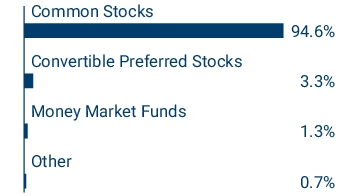
Asset Categories
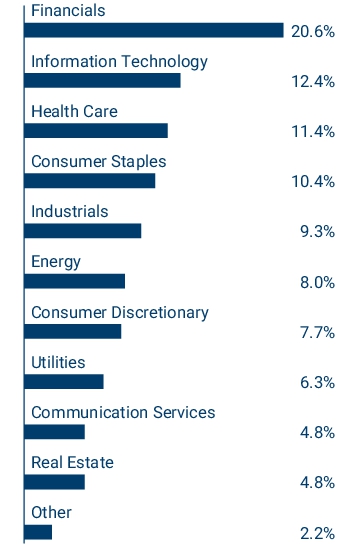
Equity Sector Allocation

Top Holdings
| JPMorgan Chase & Co. | 3.7 % |
| Exxon Mobil Corp. | 3.7 % |
| International Business Machines Corp. | 3.0 % |
| Cisco Systems, Inc. | 2.8 % |
| Philip Morris International, Inc. | 2.7 % |
| AbbVie, Inc. | 2.7 % |
| Goldman Sachs Group, Inc. (The) | 2.7 % |
| Johnson & Johnson | 2.2 % |
| Chevron Corp. | 2.1 % |
| Bank of America Corp. | 2.0 % |
columbiathreadneedleus.com/resources/literature
. You can also request more information by contacting us at 1-800-345-6611.
What were the Fund costs for the reporting period?
(Based on a hypothetical $10,000 investment)
| Class | Cost of a $10,000 investment | Cost paid as a percentage of a $10,000 investment |
| Class 2 | $ 47 | 0.93 % (a) |
| (a) | Annualized. |
Key Fund Statistics
Fund net assets | $ 910,152,321 |
Total number of portfolio holdings | 86 |
Portfolio turnover for the reporting period | 18% |
Graphical Representation of Fund Holdings
The tables below show the investment makeup of the Fund represented as a percentage of Fund net assets. Derivatives are excluded from the tables unless otherwise noted. The Fund's portfolio composition is subject to change.
Top Holdings
| JPMorgan Chase & Co. | 3.7 % |
| Exxon Mobil Corp. | 3.7 % |
| International Business Machines Corp. | 3.0 % |
| Cisco Systems, Inc. | 2.8 % |
| Philip Morris International, Inc. | 2.7 % |
| AbbVie, Inc. | 2.7 % |
| Goldman Sachs Group, Inc. (The) | 2.7 % |
| Johnson & Johnson | 2.2 % |
| Chevron Corp. | 2.1 % |
| Bank of America Corp. | 2.0 % |
Asset Categories

Equity Sector Allocation
Top Holdings
| JPMorgan Chase & Co. | 3.7 % |
| Exxon Mobil Corp. | 3.7 % |
| International Business Machines Corp. | 3.0 % |
| Cisco Systems, Inc. | 2.8 % |
| Philip Morris International, Inc. | 2.7 % |
| AbbVie, Inc. | 2.7 % |
| Goldman Sachs Group, Inc. (The) | 2.7 % |
| Johnson & Johnson | 2.2 % |
| Chevron Corp. | 2.1 % |
| Bank of America Corp. | 2.0 % |
columbiathreadneedleus.com/resources/literature
. You can also request more information by contacting us at 1-800-345-6611.
What were the Fund costs for the reporting period?
(Based on a hypothetical $10,000 investment)
| Class | Cost of a $10,000 investment | Cost paid as a percentage of a $10,000 investment |
| Class 3 | $ 41 | 0.80 % (a) |
| (a) | Annualized. |
Key Fund Statistics
Fund net assets | $ 910,152,321 |
Total number of portfolio holdings | 86 |
Portfolio turnover for the reporting period | 18% |
Graphical Representation of Fund Holdings
The tables below show the investment makeup of the Fund represented as a percentage of Fund net assets. Derivatives are excluded from the tables unless otherwise noted. The Fund's portfolio composition is subject to change.
Top Holdings
| JPMorgan Chase & Co. | 3.7 % |
| Exxon Mobil Corp. | 3.7 % |
| International Business Machines Corp. | 3.0 % |
| Cisco Systems, Inc. | 2.8 % |
| Philip Morris International, Inc. | 2.7 % |
| AbbVie, Inc. | 2.7 % |
| Goldman Sachs Group, Inc. (The) | 2.7 % |
| Johnson & Johnson | 2.2 % |
| Chevron Corp. | 2.1 % |
| Bank of America Corp. | 2.0 % |
Asset Categories

Equity Sector Allocation

Top Holdings
| JPMorgan Chase & Co. | 3.7 % |
| Exxon Mobil Corp. | 3.7 % |
| International Business Machines Corp. | 3.0 % |
| Cisco Systems, Inc. | 2.8 % |
| Philip Morris International, Inc. | 2.7 % |
| AbbVie, Inc. | 2.7 % |
| Goldman Sachs Group, Inc. (The) | 2.7 % |
| Johnson & Johnson | 2.2 % |
| Chevron Corp. | 2.1 % |
| Bank of America Corp. | 2.0 % |
| [1] | Annualized. |