Shareholder Report
Jun. 30, 2025
USD ($)
$ / shares
WHAT WERE THE FUND COSTS FOR THE PAST YEAR? (based on a hypothetical $10,000 investment)
|
Class Name
|
Costs of a $10,000 investment
|
Costs paid as a percentage of a $10,000 investment
|
|
Class A
|
$147
|
1.42%
|
HOW DID THE FUND PERFORM LAST YEAR AND WHAT AFFECTED ITS PERFORMANCE?
For the fiscal year ended June 30, 2025, the Class returned 6.75% (load-waived), compared to the 13.30% return of a securities market index with investment characteristics similar to those of the Fund, the Russell 3000 Value Index. The Fund’s broad-based securities market index, the Russell 3000 Index, returned 15.30% over the same period.
The Fund trailed the Russell 3000 Value Index and the Russell 3000 Index as we stuck to the basic tenet when practicing our long-term investment philosophy. We believe the price paid for a security is the biggest factor determining future returns. Our value philosophy seeks to find undervalued securities when short-term problems produce prices which don’t properly recognize a company’s future ability to produce excess future free cash flow. Our holdings in financials and industrials showed positive returns but underperformed their index counterparts.
It is important to note that volatility characterized U.S. equity markets for much of the fiscal year. While a narrow range of growth-oriented technology stocks (“the “Magnificent Seven” mega-cap companies) continued to dominate the market during the first half of 2024, a shift occurred shortly after the start of the fiscal year. As market breadth expanded, value stocks demonstrated improved performance. This trend continued into 2025, with a higher percentage of stocks outperforming the overall market compared to the previous year. The broadening of the market and improved performance of value factors helped the Class outperform the benchmark Russell 3000 Index for two of the four quarters during the fiscal year – the quarters ended September 30, 2024, and March 31, 2025.
We sought to take advantage of last year’s market volatility. We remained focused on individual companies, their operations, prospects, and financial strength to withstand current short-term issues. Notable changes in the Fund’s positioning from the end of the previous fiscal year end included decreased exposure to the Industrials sector and a higher allocation to Information Technology stocks.
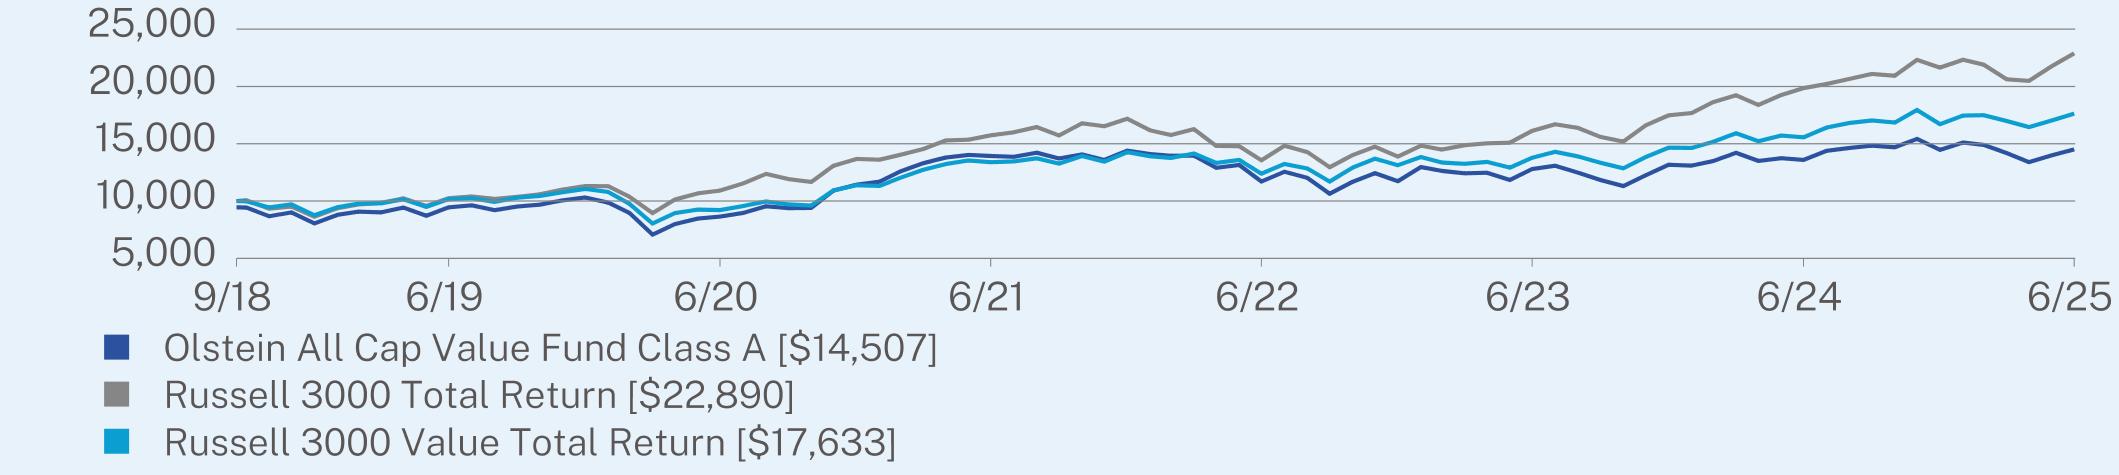
ANNUAL AVERAGE TOTAL RETURN (%)
|
|
1 Year
|
5 Year
|
Since Inception
(09/17/2018) |
|
Class A (without sales charge)
|
6.75
|
10.91
|
6.52
|
|
Class A (with sales charge)
|
0.86
|
9.65
|
5.64
|
|
Russell 3000 Total Return
|
15.30
|
15.96
|
12.98
|
|
Russell 3000 Value Total Return
|
13.30
|
13.87
|
8.72
|
Visit https://www.olsteinfunds.com/resources/documents-forms for more recent performance information.
Visit https://www.olsteinfunds.com/resources/documents-forms for more recent performance information.
KEY FUND STATISTICS (as of June 30, 2025)
|
Net Assets
|
$499,627,715
|
|
Number of Equity Holdings
|
80
|
|
Net Advisory Fee
|
$5,309,140
|
|
Portfolio Turnover
|
38%
|
|
Security Type (% of Net Assets)
|
|
|
Common Stocks
|
96.6%
|
|
Cash & Other
|
3.4%
|
|
Top 10 Equity Issuers (% of Net Assets)
|
|
|
Walt Disney Company
|
2.8%
|
|
Johnson & Johnson
|
1.9%
|
|
General Dynamics Corporation
|
1.8%
|
|
Aptiv PLC
|
1.8%
|
|
Becton, Dickinson & Company
|
1.8%
|
|
Vontier Corporation
|
1.8%
|
|
Sensata Technologies Holdings PLC
|
1.7%
|
|
Schlumberger Ltd.
|
1.7%
|
|
ABM Industries, Inc.
|
1.6%
|
|
Baxter International, Inc.
|
1.6%
|

WHAT WERE THE FUND COSTS FOR THE PAST YEAR? (based on a hypothetical $10,000 investment)
|
Class Name
|
Costs of a $10,000 investment
|
Costs paid as a percentage of a $10,000 investment
|
|
Class C
|
$223
|
2.17%
|
HOW DID THE FUND PERFORM LAST YEAR AND WHAT AFFECTED ITS PERFORMANCE?
For the fiscal year ended June 30, 2025, the Class returned 5.98% (load-waived), compared to the 13.30% return of a securities market index with investment characteristics similar to those of the Fund, the Russell 3000 Value Index. The Fund’s broad-based securities market index, the Russell 3000 Index, returned 15.30% over the same period.
The Fund trailed the Russell 3000 Value Index and the Russell 3000 Index as we stuck to the basic tenet when practicing our long-term investment philosophy. We believe the price paid for a security is the biggest factor determining future returns. Our value philosophy seeks to find undervalued securities when short-term problems produce prices which don’t properly recognize a company’s future ability to produce excess future free cash flow. Our holdings in financials and industrials showed positive returns but underperformed their index counterparts.
It is important to note that volatility characterized U.S. equity markets for much of the fiscal year. While a narrow range of growth-oriented technology stocks (“the “Magnificent Seven” mega-cap companies) continued to dominate the market during the first half of 2024, a shift occurred shortly after the start of the fiscal year. As market breadth expanded, value stocks demonstrated improved performance. This trend continued into 2025, with a higher percentage of stocks outperforming the overall market compared to the previous year. The broadening of the market and improved performance of value factors helped the Class outperform the benchmark Russell 3000 Index for two of the four quarters during the fiscal year – the quarters ended September 30, 2024, and March 31, 2025.
We sought to take advantage of last year’s market volatility. We remained focused on individual companies, their operations, prospects, and financial strength to withstand current short-term issues. Notable changes in the Fund’s positioning from the end of the previous fiscal year end included decreased exposure to the Industrials sector and a higher allocation to Information Technology stocks.
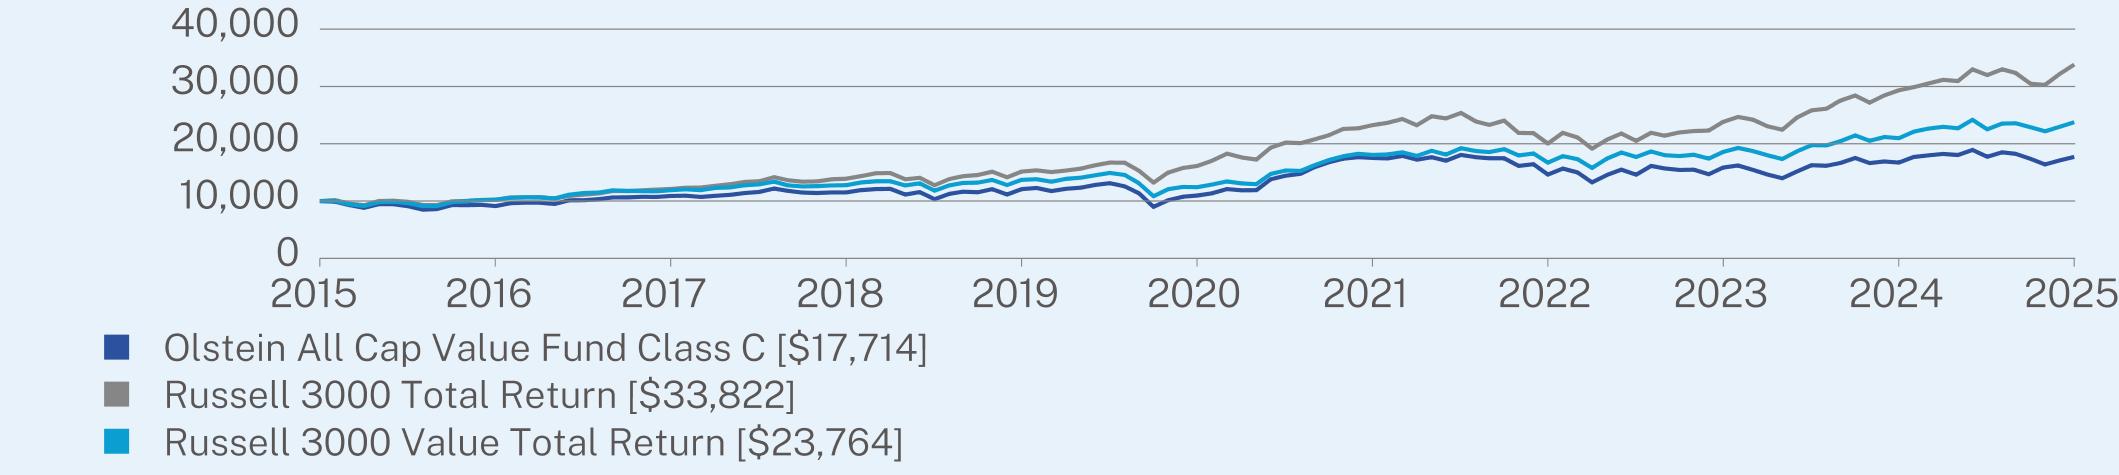
ANNUAL AVERAGE TOTAL RETURN (%)
|
|
1 Year
|
5 Year
|
10 Year
|
|
Class C (without sales charge)
|
5.98
|
10.07
|
5.88
|
|
Class C (with sales charge)
|
5.03
|
10.07
|
5.88
|
|
Russell 3000 Total Return
|
15.30
|
15.96
|
12.96
|
|
Russell 3000 Value Total Return
|
13.30
|
13.87
|
9.04
|
Visit https://www.olsteinfunds.com/resources/documents-forms for more recent performance information.
Visit https://www.olsteinfunds.com/resources/documents-forms for more recent performance information.
KEY FUND STATISTICS (as of June 30, 2025)
|
Net Assets
|
$499,627,715
|
|
Number of Equity Holdings
|
80
|
|
Net Advisory Fee
|
$5,309,140
|
|
Portfolio Turnover
|
38%
|
|
Security Type (% of Net Assets)
|
|
|
Common Stocks
|
96.6%
|
|
Cash & Other
|
3.4%
|
|
Top 10 Equity Issuers (% of Net Assets)
|
|
|
Walt Disney Company
|
2.8%
|
|
Johnson & Johnson
|
1.9%
|
|
General Dynamics Corporation
|
1.8%
|
|
Aptiv PLC
|
1.8%
|
|
Becton, Dickinson & Company
|
1.8%
|
|
Vontier Corporation
|
1.8%
|
|
Sensata Technologies Holdings PLC
|
1.7%
|
|
Schlumberger Ltd.
|
1.7%
|
|
ABM Industries, Inc.
|
1.6%
|
|
Baxter International, Inc.
|
1.6%
|
WHAT WERE THE FUND COSTS FOR THE PAST YEAR? (based on a hypothetical $10,000 investment)
|
Class Name
|
Costs of a $10,000 investment
|
Costs paid as a percentage of a $10,000 investment
|
|
Adviser Class
|
$121
|
1.17%
|
HOW DID THE FUND PERFORM LAST YEAR AND WHAT AFFECTED ITS PERFORMANCE?
For the fiscal year ended June 30, 2025, the Class returned 7.05% compared to the 13.30% return of a securities market index with investment characteristics similar to those of the Fund, the Russell 3000 Value Index. The Fund’s broad-based securities market index, the Russell 3000 Index, returned 15.30% over the same period.
The Fund trailed the Russell 3000 Value Index and the Russell 3000 Index as we stuck to the basic tenet when practicing our long-term investment philosophy. We believe the price paid for a security is the biggest factor determining future returns. Our value philosophy seeks to find undervalued securities when short-term problems produce prices which don’t properly recognize a company’s future ability to produce excess future free cash flow. Our holdings in financials and industrials showed positive returns but underperformed their index counterparts.
It is important to note that volatility characterized U.S. equity markets for much of the fiscal year. While a narrow range of growth-oriented technology stocks (“the “Magnificent Seven” mega-cap companies) continued to dominate the market during the first half of 2024, a shift occurred shortly after the start of the fiscal year. As market breadth expanded, value stocks demonstrated improved performance. This trend continued into 2025, with a higher percentage of stocks outperforming the overall market compared to the previous year. The broadening of the market and improved performance of value factors helped the Class outperform the benchmark Russell 3000 Index for two of the four quarters during the fiscal year – the quarters ended September 30, 2024, and March 31, 2025.
We sought to take advantage of last year’s market volatility. We remained focused on individual companies, their operations, prospects, and financial strength to withstand current short-term issues. Notable changes in the Fund’s positioning from the end of the previous fiscal year end included decreased exposure to the Industrials sector and a higher allocation to Information Technology stocks.
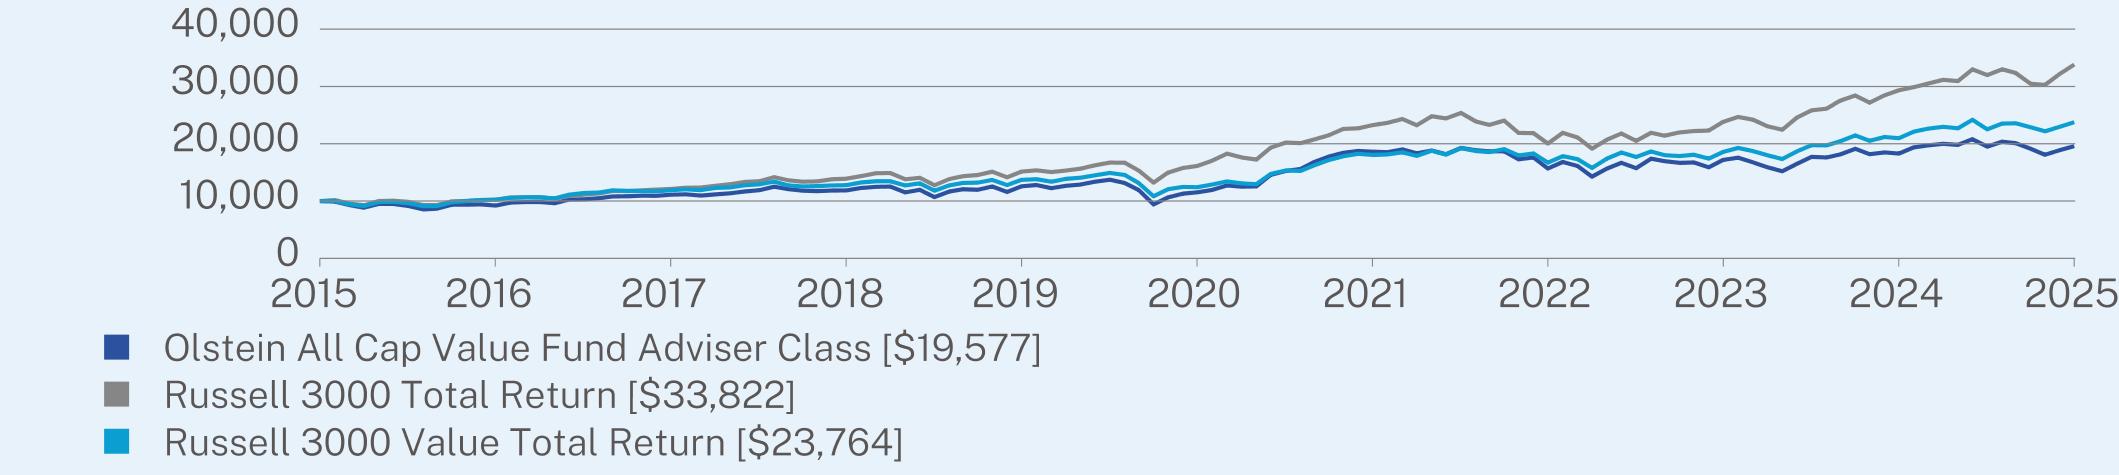
ANNUAL AVERAGE TOTAL RETURN (%)
|
|
1 Year
|
5 Year
|
10 Year
|
|
Adviser Class (without sales charge)
|
7.05
|
11.18
|
6.95
|
|
Russell 3000 Total Return
|
15.30
|
15.96
|
12.96
|
|
Russell 3000 Value Total Return
|
13.30
|
13.87
|
9.04
|
Visit https://www.olsteinfunds.com/resources/documents-forms for more recent performance information.
Visit https://www.olsteinfunds.com/resources/documents-forms for more recent performance information.
KEY FUND STATISTICS (as of June 30, 2025)
|
Net Assets
|
$499,627,715
|
|
Number of Equity Holdings
|
80
|
|
Net Advisory Fee
|
$5,309,140
|
|
Portfolio Turnover
|
38%
|
|
Security Type (% of Net Assets)
|
|
|
Common Stocks
|
96.6%
|
|
Cash & Other
|
3.4%
|
|
Top 10 Equity Issuers (% of Net Assets)
|
|
|
Walt Disney Company
|
2.8%
|
|
Johnson & Johnson
|
1.9%
|
|
General Dynamics Corporation
|
1.8%
|
|
Aptiv PLC
|
1.8%
|
|
Becton, Dickinson & Company
|
1.8%
|
|
Vontier Corporation
|
1.8%
|
|
Sensata Technologies Holdings PLC
|
1.7%
|
|
Schlumberger Ltd.
|
1.7%
|
|
ABM Industries, Inc.
|
1.6%
|
|
Baxter International, Inc.
|
1.6%
|

WHAT WERE THE FUND COSTS FOR THE PAST YEAR? (based on a hypothetical $10,000 investment)
|
Class Name
|
Costs of a $10,000 investment
|
Costs paid as a percentage of a $10,000 investment
|
|
Class A
|
$160
|
1.60%
|
HOW DID THE FUND PERFORM LAST YEAR AND WHAT AFFECTED ITS PERFORMANCE?
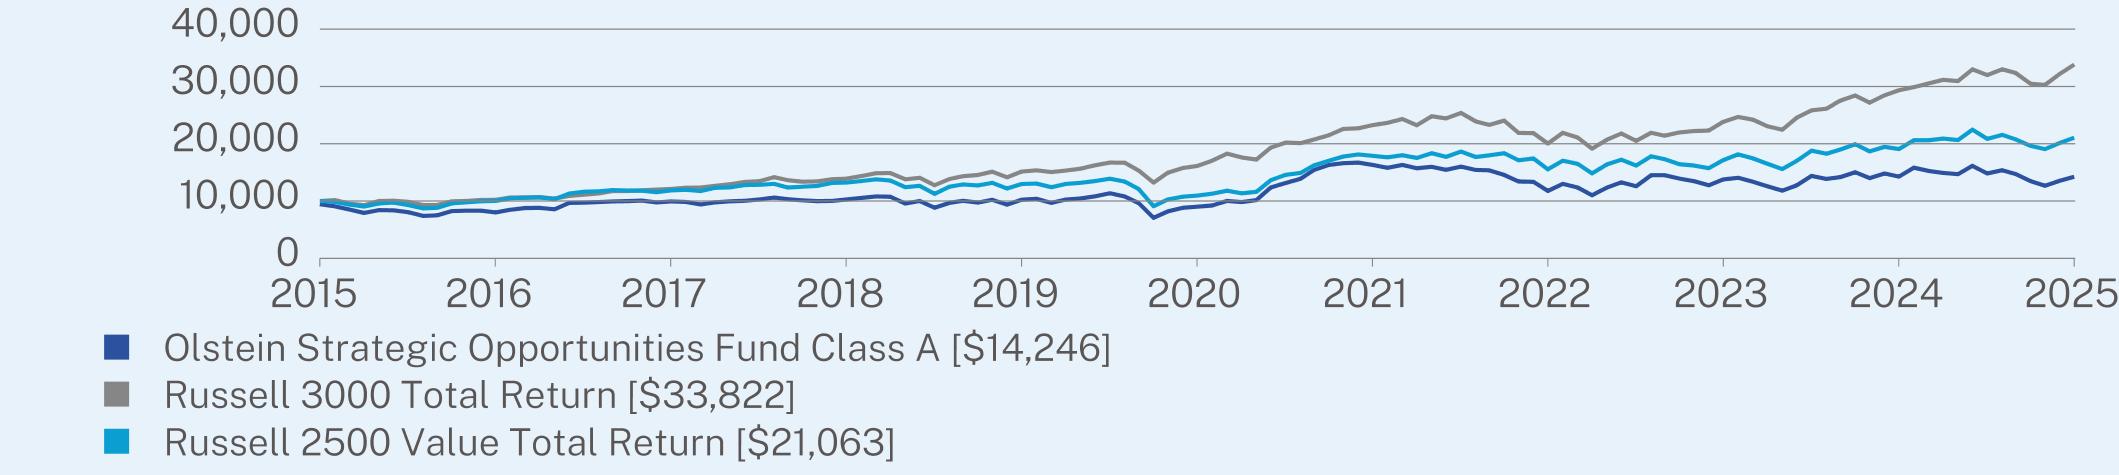
For the fiscal year ended June 30, 2025, the Class returned -0.13% (load-waived), compared to the 10.47% return of a securities market index with investment characteristics similar to those of the Fund, the Russell 2500 Value Index. The Fund’s broad-based securities market index, the Russell 3000 Index, returned 15.30% over the same period.
The Fund trailed the Russell 2500 Value Index and the Russell 3000 Index during the fiscal year primarily due to stock selection in the Consumer Discretionary, Consumer Staples, Health Care and Information Technology sectors. As market breadth expanded and value stocks demonstrated improved performance during the fiscal year, the Fund’s Industrials, Materials and Real Estate holdings contributed favorably to relative performance by outperforming their respective Russell 2500 Value Index sectors.
We are long-term investors and last year’s market volatility enabled us to fill our portfolio with companies that in our opinion had outstanding liquidity, but their market prices were affected by short-term problems. However, we believe that these companies had excellent financial liquidity, sound balance sheets, and were selling at discounts to their intrinsic value based on their normalized ability to produce free cash flow. Notable changes in the Fund’s positioning from the end of the previous fiscal year end include decreased exposure to the Consumer Discretionary sector and a higher allocation to Industrials and Information Technology stocks.
ANNUAL AVERAGE TOTAL RETURN (%)
|
|
1 Year
|
5 Year
|
10 Year
|
|
Class A (without sales charge)
|
-0.13
|
9.59
|
4.19
|
|
Class A (with sales charge)
|
-5.64
|
8.36
|
3.60
|
|
Russell 3000 Total Return
|
15.30
|
15.96
|
12.96
|
|
Russell 2500 Value Total Return
|
10.47
|
13.96
|
7.73
|
Visit https://www.olsteinfunds.com/resources/documents-forms for more recent performance information.
Visit https://www.olsteinfunds.com/resources/documents-forms for more recent performance information.
KEY FUND STATISTICS (as of June 30, 2025)
|
Net Assets
|
$51,475,990
|
|
Number of Equity Holdings
|
37
|
|
Net Advisory Fee
|
$498,290
|
|
Portfolio Turnover
|
24%
|
|
Security Type (% of Net Assets)
|
|
|
Common Stocks
|
98.5%
|
|
Cash & Other
|
1.5%
|
|
Top 10 Equity Issuers (% of Net Assets)
|
|
|
Sensata Technologies Holding PLC
|
4.8%
|
|
Shyft Group, Inc.
|
4.7%
|
|
Blue Bird Corporation
|
4.3%
|
|
Gates Industrial Corporation PLC
|
4.3%
|
|
Vontier Corporation
|
4.1%
|
|
Dine Brands Global, Inc.
|
3.7%
|
|
Invesco Ltd.
|
3.6%
|
|
Vishay Intertechnology, Inc.
|
3.5%
|
|
ABM Industries, Inc.
|
3.4%
|
|
Central Garden & Pet Company - Class A
|
3.3%
|

WHAT WERE THE FUND COSTS FOR THE PAST YEAR? (based on a hypothetical $10,000 investment)
|
Class Name
|
Costs of a $10,000 investment
|
Costs paid as a percentage of a $10,000 investment
|
|
Class C
|
$234
|
2.35%
|
HOW DID THE FUND PERFORM LAST YEAR AND WHAT AFFECTED ITS PERFORMANCE?
For the fiscal year ended June 30, 2025, the Class returned -0.89% (load-waived), compared to the 10.47% return of a securities market index with investment characteristics similar to those of the Fund, the Russell 2500 Value Index. The Fund’s broad-based securities market index, the Russell 3000 Index, returned 15.30% over the same period.
The Fund trailed the Russell 2500 Value Index and the Russell 3000 Index during the fiscal year primarily due to stock selection in the Consumer Discretionary, Consumer Staples, Health Care and Information Technology sectors. As market breadth expanded and value stocks demonstrated improved performance during the fiscal year, the Fund’s Industrials, Materials and Real Estate holdings contributed favorably to relative performance by outperforming their respective Russell 2500 Value Index sectors.
We are long-term investors and last year’s market volatility enabled us to fill our portfolio with companies that in our opinion had outstanding liquidity, but their market prices were affected by short-term problems. However, we believe that these companies had excellent financial liquidity, sound balance sheets, and were selling at discounts to their intrinsic value based on their normalized ability to produce free cash flow. Notable changes in the Fund’s positioning from the end of the previous fiscal year end include decreased exposure to the Consumer Discretionary sector and a higher allocation to Industrials and Information Technology stocks.

ANNUAL AVERAGE TOTAL RETURN (%)
|
|
1 Year
|
5 Year
|
10 Year
|
|
Class C (without sales charge)
|
-0.89
|
8.76
|
3.41
|
|
Class C (with sales charge)
|
-1.81
|
8.76
|
3.41
|
|
Russell 3000 Total Return
|
15.30
|
15.96
|
12.96
|
|
Russell 2500 Value Total Return
|
10.47
|
13.96
|
7.73
|
Visit https://www.olsteinfunds.com/resources/documents-forms for more recent performance information.
Visit https://www.olsteinfunds.com/resources/documents-forms for more recent performance information.
KEY FUND STATISTICS (as of June 30, 2025)
|
Net Assets
|
$51,475,990
|
|
Number of Equity Holdings
|
37
|
|
Net Advisory Fee
|
$498,290
|
|
Portfolio Turnover
|
24%
|
|
Security Type (% of Net Assets)
|
|
|
Common Stocks
|
98.5%
|
|
Cash & Other
|
1.5%
|
|
Top 10 Equity Issuers (% of Net Assets)
|
|
|
Sensata Technologies Holding PLC
|
4.8%
|
|
Shyft Group, Inc.
|
4.7%
|
|
Blue Bird Corporation
|
4.3%
|
|
Gates Industrial Corporation PLC
|
4.3%
|
|
Vontier Corporation
|
4.1%
|
|
Dine Brands Global, Inc.
|
3.7%
|
|
Invesco Ltd.
|
3.6%
|
|
Vishay Intertechnology, Inc.
|
3.5%
|
|
ABM Industries, Inc.
|
3.4%
|
|
Central Garden & Pet Company - Class A
|
3.3%
|
WHAT WERE THE FUND COSTS FOR THE PAST YEAR? (based on a hypothetical $10,000 investment)
|
Class Name
|
Costs of a $10,000 investment
|
Costs paid as a percentage of a $10,000 investment
|
|
Adviser Class
|
$135
|
1.35%
|
HOW DID THE FUND PERFORM LAST YEAR AND WHAT AFFECTED ITS PERFORMANCE?
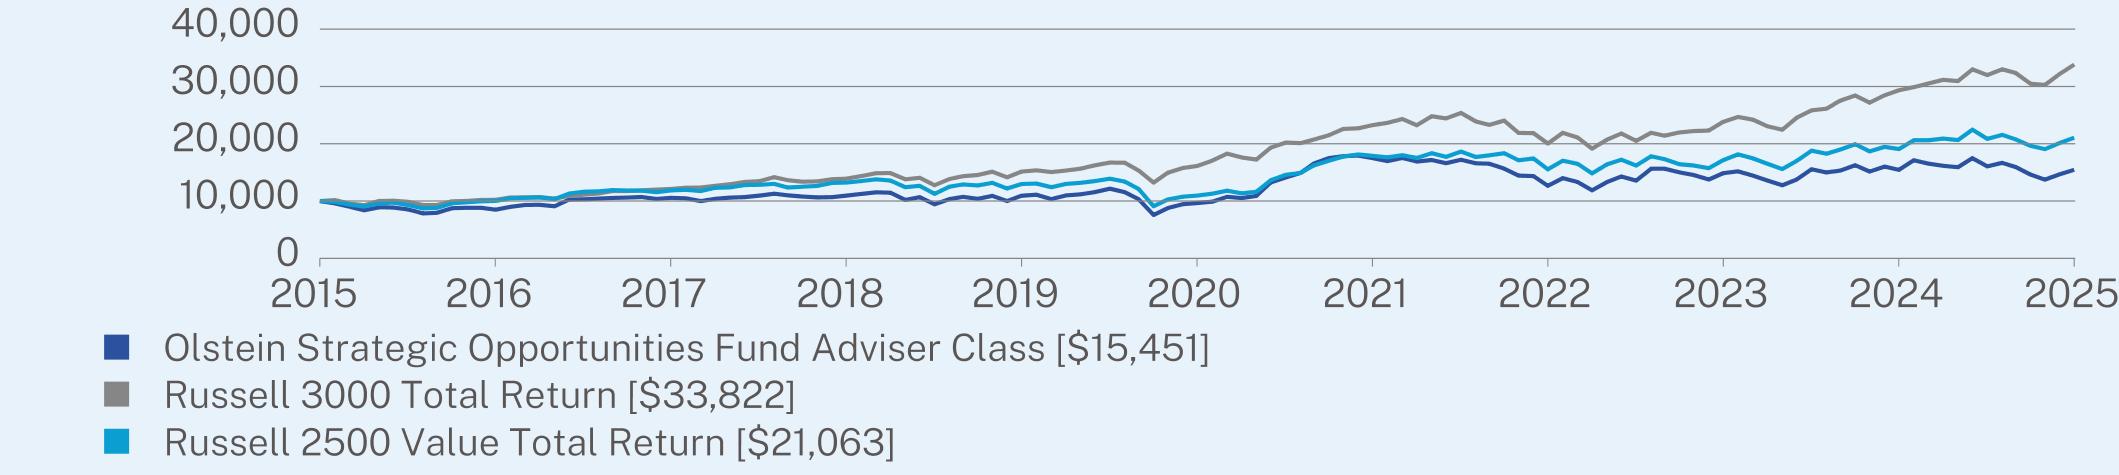
For the fiscal year ended June 30, 2025, the Class returned 0.10%, compared to the 10.47% return of a securities market index with investment characteristics similar to those of the Fund, the Russell 2500 Value Index. The Fund’s broad-based securities market index, the Russell 3000 Index, returned 15.30% over the same period.
The Fund trailed the Russell 2500 Value Index and the Russell 3000 Index during the fiscal year primarily due to stock selection in the Consumer Discretionary, Consumer Staples, Health Care and Information Technology sectors. As market breadth expanded and value stocks demonstrated improved performance during the fiscal year, the Fund’s Industrials, Materials and Real Estate holdings contributed favorably to relative performance by outperforming their respective Russell 2500 Value Index sectors.
We are long-term investors and last year’s market volatility enabled us to fill our portfolio with companies that in our opinion had outstanding liquidity, but their market prices were affected by short-term problems. However, we believe that these companies had excellent financial liquidity, sound balance sheets, and were selling at discounts to their intrinsic value based on their normalized ability to produce free cash flow. Notable changes in the Fund’s positioning from the end of the previous fiscal year end include decreased exposure to the Consumer Discretionary sector and a higher allocation to Industrials and Information Technology stocks.
ANNUAL AVERAGE TOTAL RETURN (%)
|
|
1 Year
|
5 Year
|
10 Year
|
|
Adviser Class (without sales charge)
|
0.10
|
9.86
|
4.45
|
|
Russell 3000 Total Return
|
15.30
|
15.96
|
12.96
|
|
Russell 2500 Value Total Return
|
10.47
|
13.96
|
7.73
|
Visit https://www.olsteinfunds.com/resources/documents-forms for more recent performance information.
Visit https://www.olsteinfunds.com/resources/documents-forms for more recent performance information.
KEY FUND STATISTICS (as of June 30, 2025)
|
Net Assets
|
$51,475,990
|
|
Number of Equity Holdings
|
37
|
|
Net Advisory Fee
|
$498,290
|
|
Portfolio Turnover
|
24%
|
|
Security Type (% of Net Assets)
|
|
|
Common Stocks
|
98.5%
|
|
Cash & Other
|
1.5%
|
|
Top 10 Equity Issuers (% of Net Assets)
|
|
|
Sensata Technologies Holding PLC
|
4.8%
|
|
Shyft Group, Inc.
|
4.7%
|
|
Blue Bird Corporation
|
4.3%
|
|
Gates Industrial Corporation PLC
|
4.3%
|
|
Vontier Corporation
|
4.1%
|
|
Dine Brands Global, Inc.
|
3.7%
|
|
Invesco Ltd.
|
3.6%
|
|
Vishay Intertechnology, Inc.
|
3.5%
|
|
ABM Industries, Inc.
|
3.4%
|
|
Central Garden & Pet Company - Class A
|
3.3%
|
