| Class | Costs of a $10,000 Investment | Costs Paid as a % of a $10,000 Investment |
|---|---|---|
| Class A | $84 | 1.69%2 |
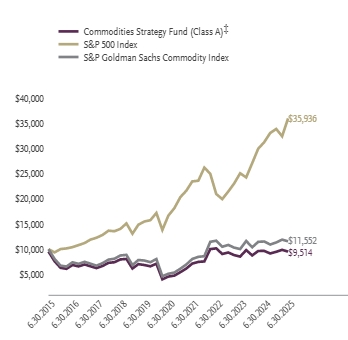
For the period of January 1, 2025 to June 30, 2025, the fund (Class A shares) returned 0.38%, underperforming the fund's broad-based securities market index, the S&P 500 Index, which returned 6.20% for the same period and underperforming the fund's secondary index, the S&P Goldman Sachs Commodity Index, which returned 1.94% for the same period.
What factors materially affected the fund's performance over the last six months?
The fund obtained exposure to the commodities markets through futures on the S&P Goldman Sachs Commodity Index. S&P Goldman Sachs Commodity Index futures had a strong first quarter of 2025 but experienced headwinds from energy and agricultural sectors in the second quarter of 2025. Eleven of the twenty-four index components had positive returns for the period. The components with some of the largest positive returns were gold, silver, and live cattle. The components with some of the largest negative returns were cocoa, corn, and Kansas wheat.
| 6 Month† | One Year | Five Years | Ten Years | |
|---|---|---|---|---|
| Class A (without sales charge) | 0.38% | -1.48% | 15.84% | -0.01% |
| Class A (with sales charge)‡ | -4.39% | -6.17% | 14.72% | -0.50% |
| S&P 500 Index | 6.20% | 15.16% | 16.64% | 13.65% |
| S&P Goldman Sachs Commodity Index | 1.94% | 0.25% | 17.69% | 1.45% |
| Net Assets | $6,658,424 |
| Total Number of Portfolio Holdings | |
| Portfolio Turnover Rate | –% |

| Top 10 | % of Net Assets |
|---|---|
| Guggenheim Ultra Short Duration Fund — Institutional Class | |
| Guggenheim Strategy Fund II | |
| Total |
1 | "Consolidated Holdings Diversification (Market Exposure as a % of Net Assets)" excludes any temporary cash investments, investments in Guggenheim Strategy Funds Trust mutual funds, or investments in Guggenheim Ultra Short Duration Fund. |
2 | "Largest Holdings (as a % of Net Assets)" excludes any temporary cash or derivative investments. |
| Top 10 | % of Net Assets |
|---|---|
| Guggenheim Ultra Short Duration Fund — Institutional Class | |
| Guggenheim Strategy Fund II | |
| Total |
2 | "Largest Holdings (as a % of Net Assets)" excludes any temporary cash or derivative investments. |
There were no changes in or disagreements with fund accountants for the period.
| Class | Costs of a $10,000 Investment | Costs Paid as a % of a $10,000 Investment |
|---|---|---|
| Class C | $120 | 2.42%2 |
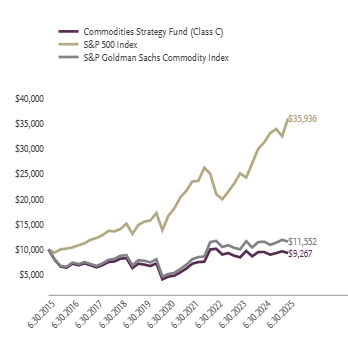
For the period of January 1, 2025 to June 30, 2025, the fund (Class C shares) returned 0.01%, underperforming the fund's broad-based securities market index, the S&P 500 Index, which returned 6.20% for the same period and underperforming the fund's secondary index, the S&P Goldman Sachs Commodity Index, which returned 1.94% for the same period.
What factors materially affected the fund's performance over the last six months?
The fund obtained exposure to the commodities markets through futures on the S&P Goldman Sachs Commodity Index. S&P Goldman Sachs Commodity Index futures had a strong first quarter of 2025 but experienced headwinds from energy and agricultural sectors in the second quarter of 2025. Eleven of the twenty-four index components had positive returns for the period. The components with some of the largest positive returns were gold, silver, and live cattle. The components with some of the largest negative returns were cocoa, corn, and Kansas wheat.
| 6 Month† | One Year | Five Years | Ten Years | |
|---|---|---|---|---|
| Class C (without CDSC) | 0.01% | -2.21% | 14.98% | -0.76% |
| Class C (with CDSC)§ | -0.99% | -3.18% | 14.98% | -0.76% |
| S&P 500 Index | 6.20% | 15.16% | 16.64% | 13.65% |
| S&P Goldman Sachs Commodity Index | 1.94% | 0.25% | 17.69% | 1.45% |
| Net Assets | $6,658,424 |
| Total Number of Portfolio Holdings | |
| Portfolio Turnover Rate | –% |

| Top 10 | % of Net Assets |
|---|---|
| Guggenheim Ultra Short Duration Fund — Institutional Class | |
| Guggenheim Strategy Fund II | |
| Total |
1 | "Consolidated Holdings Diversification (Market Exposure as a % of Net Assets)" excludes any temporary cash investments, investments in Guggenheim Strategy Funds Trust mutual funds, or investments in Guggenheim Ultra Short Duration Fund. |
2 | "Largest Holdings (as a % of Net Assets)" excludes any temporary cash or derivative investments. |
| Top 10 | % of Net Assets |
|---|---|
| Guggenheim Ultra Short Duration Fund — Institutional Class | |
| Guggenheim Strategy Fund II | |
| Total |
2 | "Largest Holdings (as a % of Net Assets)" excludes any temporary cash or derivative investments. |
There were no changes in or disagreements with fund accountants for the period.
| Class | Costs of a $10,000 Investment | Costs Paid as a % of a $10,000 Investment |
|---|---|---|
| Class H | $84 | 1.69%2 |
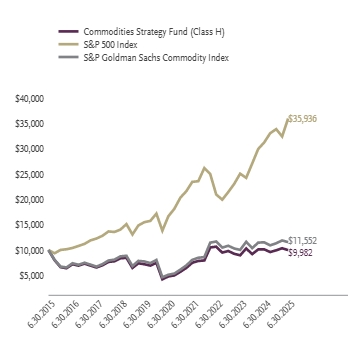
For the period of January 1, 2025 to June 30, 2025, the fund (Class H shares) returned 0.39%, underperforming the fund's broad-based securities market index, the S&P 500 Index, which returned 6.20% for the same period and underperforming the fund's secondary index, the S&P Goldman Sachs Commodity Index, which returned 1.94% for the same period.
What factors materially affected the fund's performance over the last six months?
The fund obtained exposure to the commodities markets through futures on the S&P Goldman Sachs Commodity Index. S&P Goldman Sachs Commodity Index futures had a strong first quarter of 2025 but experienced headwinds from energy and agricultural sectors in the second quarter of 2025. Eleven of the twenty-four index components had positive returns for the period. The components with some of the largest positive returns were gold, silver, and live cattle. The components with some of the largest negative returns were cocoa, corn, and Kansas wheat.
| 6 Month† | One Year | Five Years | Ten Years | |
|---|---|---|---|---|
| Class H | 0.39% | -1.51% | -0.02% | |
| S&P 500 Index | 6.20% | 15.16% | 16.64% | 13.65% |
| S&P Goldman Sachs Commodity Index | 1.94% | 0.25% | 17.69% | 1.45% |
| Net Assets | $6,658,424 |
| Total Number of Portfolio Holdings | |
| Portfolio Turnover Rate | –% |
| Top 10 | % of Net Assets |
|---|---|
| Guggenheim Ultra Short Duration Fund — Institutional Class | |
| Guggenheim Strategy Fund II | |
| Total |
1 | "Consolidated Holdings Diversification (Market Exposure as a % of Net Assets)" excludes any temporary cash investments, investments in Guggenheim Strategy Funds Trust mutual funds, or investments in Guggenheim Ultra Short Duration Fund. |
2 | "Largest Holdings (as a % of Net Assets)" excludes any temporary cash or derivative investments. |
| Top 10 | % of Net Assets |
|---|---|
| Guggenheim Ultra Short Duration Fund — Institutional Class | |
| Guggenheim Strategy Fund II | |
| Total |
2 | "Largest Holdings (as a % of Net Assets)" excludes any temporary cash or derivative investments. |
There were no changes in or disagreements with fund accountants for the period.
| Class | Costs of a $10,000 Investment | Costs Paid as a % of a $10,000 Investment |
|---|---|---|
| Class A | $95 | 1.95%2 |
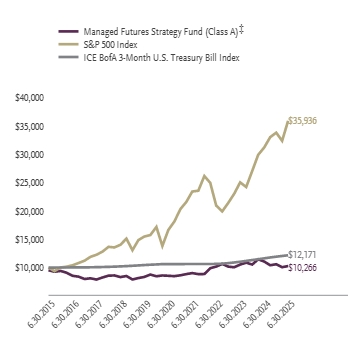
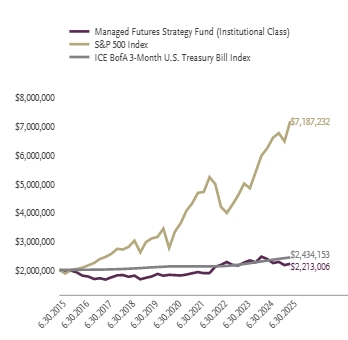
For the period of January 1, 2025 to June 30, 2025, the fund (Class A shares) returned -2.99%, underperforming the fund's broad-based securities market index, the S&P 500 Index, which returned 6.20% for the same period and underperforming the fund's secondary index, the ICE BofA 3-Month U.S. Treasury Bill Index, which returned 2.09% for the same period.
What factors materially affected the fund's performance over the last six months?
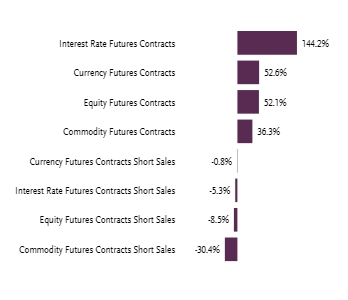
In the first half of 2025, futures markets were marked by a mix of reversals and consolidation, presenting a challenging environment for trend-following systems. Global stock index futures saw choppy behavior, with early-year rallies in U.S. and European equities stalling amid shifting central bank policy signals and geopolitical uncertainty. Bond futures were volatile but lacked sustained directional moves, as inflation data and diverging rate expectations kept global yields in flux. In foreign exchange, the U.S. dollar strengthened modestly against major currencies in Q1 before weakening in Q2, driven by changing interest rate differentials and mixed economic signals across regions. Commodity futures were mixed—energy markets, particularly crude oil, saw sharp but short-lived moves tied to supply disruptions and OPEC policy, while metals and agricultural contracts experienced sporadic price swings without sustained trends.
This backdrop of frequent reversals and limited trend persistence across asset classes created a difficult environment for trend-following models, which typically perform best in sustained directional markets. Reflecting these conditions, the fund posted a negative return in Q1, with losses across all asset classes—Currencies and Fixed Income were the largest detractors, while Commodities and Equities also contributed to the decline. In Q2, performance improved, supported by gains in Commodities, Currencies, and Equities, though Fixed Income remained a drag. Despite the recovery in Q2, the fund ended the first half of the year with a net loss.
| 6 Month† | One Year | Five Years | Ten Years | |
|---|---|---|---|---|
| Class A (without sales charge) | -2.99% | -7.22% | 3.74% | 0.75% |
| Class A (with sales charge)‡ | -7.60% | -11.62% | 2.74% | 0.26% |
| S&P 500 Index | 6.20% | 15.16% | 16.64% | 13.65% |
| ICE BofA 3-Month U.S. Treasury Bill Index | 2.09% | 4.71% | 2.78% | 1.98% |
| Net Assets | $19,444,598 |
| Total Number of Portfolio Holdings | |
| Portfolio Turnover Rate | –% |
| Guggenheim Strategy Fund III | |
| Guggenheim Strategy Fund II | |
| Guggenheim Ultra Short Duration Fund — Institutional Class | |
| Total |
1 | "Consolidated Holdings Diversification (Market Exposure as a % of Net Assets)" excludes any temporary cash investments, investments in Guggenheim Strategy Funds Trust mutual funds, or investments in Guggenheim Ultra Short Duration Fund. |
2 | "Largest Holdings (as a % of Net Assets)" excludes any temporary cash or derivative investments. |
| Guggenheim Strategy Fund III | |
| Guggenheim Strategy Fund II | |
| Guggenheim Ultra Short Duration Fund — Institutional Class | |
| Total |
2 | "Largest Holdings (as a % of Net Assets)" excludes any temporary cash or derivative investments. |
There were no changes in or disagreements with fund accountants for the period.
| Class | Costs of a $10,000 Investment | Costs Paid as a % of a $10,000 Investment |
|---|---|---|
| Class C | $131 | 2.68%2 |
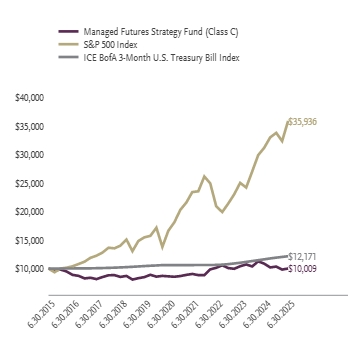
For the period of January 1, 2025 to June 30, 2025, the fund (Class C shares) returned -3.33%, underperforming the fund's broad-based securities market index, the S&P 500 Index, which returned 6.20% for the same period and underperforming the fund's secondary index, the ICE BofA 3-Month U.S. Treasury Bill Index, which returned 2.09% for the same period.
What factors materially affected the fund's performance over the last six months?
In the first half of 2025, futures markets were marked by a mix of reversals and consolidation, presenting a challenging environment for trend-following systems. Global stock index futures saw choppy behavior, with early-year rallies in U.S. and European equities stalling amid shifting central bank policy signals and geopolitical uncertainty. Bond futures were volatile but lacked sustained directional moves, as inflation data and diverging rate expectations kept global yields in flux. In foreign exchange, the U.S. dollar strengthened modestly against major currencies in Q1 before weakening in Q2, driven by changing interest rate differentials and mixed economic signals across regions. Commodity futures were mixed—energy markets, particularly crude oil, saw sharp but short-lived moves tied to supply disruptions and OPEC policy, while metals and agricultural contracts experienced sporadic price swings without sustained trends.
This backdrop of frequent reversals and limited trend persistence across asset classes created a difficult environment for trend-following models, which typically perform best in sustained directional markets. Reflecting these conditions, the fund posted a negative return in Q1, with losses across all asset classes—Currencies and Fixed Income were the largest detractors, while Commodities and Equities also contributed to the decline. In Q2, performance improved, supported by gains in Commodities, Currencies, and Equities, though Fixed Income remained a drag. Despite the recovery in Q2, the fund ended the first half of the year with a net loss.
| 6 Month† | One Year | Five Years | Ten Years | |
|---|---|---|---|---|
| Class C (without CDSC) | -3.33% | -7.91% | 2.99% | 0.01% |
| Class C (with CDSC)§ | -4.30% | -8.79% | 2.99% | 0.01% |
| S&P 500 Index | 6.20% | 15.16% | 16.64% | 13.65% |
| ICE BofA 3-Month U.S. Treasury Bill Index | 2.09% | 4.71% | 2.78% | 1.98% |
| Net Assets | $19,444,598 |
| Total Number of Portfolio Holdings | |
| Portfolio Turnover Rate | –% |

| Guggenheim Strategy Fund III | |
| Guggenheim Strategy Fund II | |
| Guggenheim Ultra Short Duration Fund — Institutional Class | |
| Total |
1 | "Consolidated Holdings Diversification (Market Exposure as a % of Net Assets)" excludes any temporary cash investments, investments in Guggenheim Strategy Funds Trust mutual funds, or investments in Guggenheim Ultra Short Duration Fund. |
2 | "Largest Holdings (as a % of Net Assets)" excludes any temporary cash or derivative investments. |
| Guggenheim Strategy Fund III | |
| Guggenheim Strategy Fund II | |
| Guggenheim Ultra Short Duration Fund — Institutional Class | |
| Total |
2 | "Largest Holdings (as a % of Net Assets)" excludes any temporary cash or derivative investments. |
There were no changes in or disagreements with fund accountants for the period.
| Class | Costs of a $10,000 Investment | Costs Paid as a % of a $10,000 Investment |
|---|---|---|
| Class P | $95 | 1.94%2 |
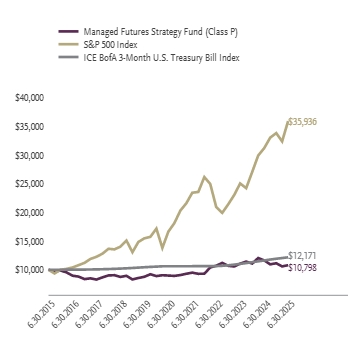
For the period of January 1, 2025 to June 30, 2025, the fund (Class P shares) returned -3.01%, underperforming the fund's broad-based securities market index, the S&P 500 Index, which returned 6.20% for the same period and underperforming the fund's secondary index, the ICE BofA 3-Month U.S. Treasury Bill Index, which returned 2.09% for the same period.
What factors materially affected the fund's performance over the last six months?
In the first half of 2025, futures markets were marked by a mix of reversals and consolidation, presenting a challenging environment for trend-following systems. Global stock index futures saw choppy behavior, with early-year rallies in U.S. and European equities stalling amid shifting central bank policy signals and geopolitical uncertainty. Bond futures were volatile but lacked sustained directional moves, as inflation data and diverging rate expectations kept global yields in flux. In foreign exchange, the U.S. dollar strengthened modestly against major currencies in Q1 before weakening in Q2, driven by changing interest rate differentials and mixed economic signals across regions. Commodity futures were mixed—energy markets, particularly crude oil, saw sharp but short-lived moves tied to supply disruptions and OPEC policy, while metals and agricultural contracts experienced sporadic price swings without sustained trends.
This backdrop of frequent reversals and limited trend persistence across asset classes created a difficult environment for trend-following models, which typically perform best in sustained directional markets. Reflecting these conditions, the fund posted a negative return in Q1, with losses across all asset classes—Currencies and Fixed Income were the largest detractors, while Commodities and Equities also contributed to the decline. In Q2, performance improved, supported by gains in Commodities, Currencies, and Equities, though Fixed Income remained a drag. Despite the recovery in Q2, the fund ended the first half of the year with a net loss.
| 6 Month† | One Year | Five Years | Ten Years | |
|---|---|---|---|---|
| Class P | -3.01% | -7.23% | 3.73% | 0.77% |
| S&P 500 Index | 6.20% | 15.16% | 16.64% | 13.65% |
| ICE BofA 3-Month U.S. Treasury Bill Index | 2.09% | 4.71% | 2.78% | 1.98% |
| Net Assets | $19,444,598 |
| Total Number of Portfolio Holdings | |
| Portfolio Turnover Rate | –% |

| Guggenheim Strategy Fund III | |
| Guggenheim Strategy Fund II | |
| Guggenheim Ultra Short Duration Fund — Institutional Class | |
| Total |
1 | "Consolidated Holdings Diversification (Market Exposure as a % of Net Assets)" excludes any temporary cash investments, investments in Guggenheim Strategy Funds Trust mutual funds, or investments in Guggenheim Ultra Short Duration Fund. |
2 | "Largest Holdings (as a % of Net Assets)" excludes any temporary cash or derivative investments. |
| Guggenheim Strategy Fund III | |
| Guggenheim Strategy Fund II | |
| Guggenheim Ultra Short Duration Fund — Institutional Class | |
| Total |
2 | "Largest Holdings (as a % of Net Assets)" excludes any temporary cash or derivative investments. |
There were no changes in or disagreements with fund accountants for the period.
| Class | Costs of a $10,000 Investment | Costs Paid as a % of a $10,000 Investment |
|---|---|---|
| Institutional Class | $81 | 1.66%2 |
For the period of January 1, 2025 to June 30, 2025, the fund (Institutional Class shares) returned -2.83%, underperforming the fund's broad-based securities market index, the S&P 500 Index, which returned 6.20% for the same period and underperforming the fund's secondary index, the ICE BofA 3-Month U.S. Treasury Bill Index, which returned 2.09% for the same period.
What factors materially affected the fund's performance over the last six months?
In the first half of 2025, futures markets were marked by a mix of reversals and consolidation, presenting a challenging environment for trend-following systems. Global stock index futures saw choppy behavior, with early-year rallies in U.S. and European equities stalling amid shifting central bank policy signals and geopolitical uncertainty. Bond futures were volatile but lacked sustained directional moves, as inflation data and diverging rate expectations kept global yields in flux. In foreign exchange, the U.S. dollar strengthened modestly against major currencies in Q1 before weakening in Q2, driven by changing interest rate differentials and mixed economic signals across regions. Commodity futures were mixed—energy markets, particularly crude oil, saw sharp but short-lived moves tied to supply disruptions and OPEC policy, while metals and agricultural contracts experienced sporadic price swings without sustained trends.
This backdrop of frequent reversals and limited trend persistence across asset classes created a difficult environment for trend-following models, which typically perform best in sustained directional markets. Reflecting these conditions, the fund posted a negative return in Q1, with losses across all asset classes—Currencies and Fixed Income were the largest detractors, while Commodities and Equities also contributed to the decline. In Q2, performance improved, supported by gains in Commodities, Currencies, and Equities, though Fixed Income remained a drag. Despite the recovery in Q2, the fund ended the first half of the year with a net loss.
| 6 Month† | One Year | Five Years | Ten Years | |
|---|---|---|---|---|
| Institutional Class | -2.83% | -7.00% | 4.02% | 1.02% |
| S&P 500 Index | 6.20% | 15.16% | 16.64% | 13.65% |
| ICE BofA 3-Month U.S. Treasury Bill Index | 2.09% | 4.71% | 2.78% | 1.98% |
| Net Assets | $19,444,598 |
| Total Number of Portfolio Holdings | |
| Portfolio Turnover Rate | –% |

| Guggenheim Strategy Fund III | |
| Guggenheim Strategy Fund II | |
| Guggenheim Ultra Short Duration Fund — Institutional Class | |
| Total |
1 | "Consolidated Holdings Diversification (Market Exposure as a % of Net Assets)" excludes any temporary cash investments, investments in Guggenheim Strategy Funds Trust mutual funds, or investments in Guggenheim Ultra Short Duration Fund. |
2 | "Largest Holdings (as a % of Net Assets)" excludes any temporary cash or derivative investments. |
| Guggenheim Strategy Fund III | |
| Guggenheim Strategy Fund II | |
| Guggenheim Ultra Short Duration Fund — Institutional Class | |
| Total |
2 | "Largest Holdings (as a % of Net Assets)" excludes any temporary cash or derivative investments. |
There were no changes in or disagreements with fund accountants for the period.
| Class | Costs of a $10,000 Investment | Costs Paid as a % of a $10,000 Investment |
|---|---|---|
| Class A | $90 | 1.83%2 |
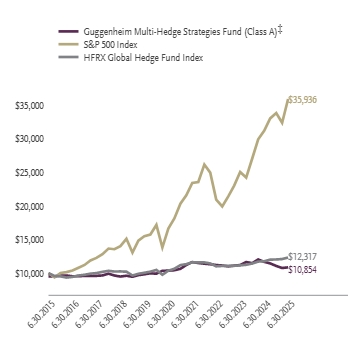
For the period of January 1, 2025 to June 30, 2025, the fund (Class A shares) returned -2.30%, underperforming the fund's broad-based securities market index, the S&P 500 Index, which returned 6.20% for the same period and underperforming the fund's secondary index, the HFRX Global Hedge Fund Index, which returned 2.38% for the same period.
What factors materially affected the fund's performance over the last six months?
The fund's merger arbitrage strategy was the largest positive contributor in the first half of the year as several notable deals closed (e.g. Capital One / Discover). Closed-end fund arbitrage and the long/short equity strategy also made modest positive contributions. The fund's global macro strategies were a net detractor during the period as positive contributions from Flow (driven primarily by fixed income) did not make up for poor performance in value (primarily commodities and fixed income) and Momentum (hurt by equities and currency). Flow strategies take positions based on expected capital flows in markets which are determined through economic theory or statistical observation of market behavior. Momentum is a systematic trend-following strategy that seeks to capture momentum premia in futures markets. Carry strategies seek to capture inefficiencies in the futures curves of different markets and asset classes including commodities, fixed income, and implied volatility. Value premia strategies take positions based on expected future prices in markets as derived from economic and/or non-price data and include strategies applied to commodities, currencies, and fixed income. A market neutral strategy attempts to profit whether the market is going up or down.
| 6 Month† | One Year | Five Years | Ten Years | |
|---|---|---|---|---|
| Class A (without sales charge) | -2.30% | -7.03% | 0.93% | 1.32% |
| Class A (with sales charge)‡ | -6.94% | -11.44% | -0.05% | 0.82% |
| S&P 500 Index | 6.20% | 15.16% | 16.64% | 13.65% |
| HFRX Global Hedge Fund Index | 2.38% | 4.74% | 3.52% | 2.11% |
| Net Assets | $15,910,915 |
| Total Number of Portfolio Holdings | |
| Portfolio Turnover Rate | 75% |

| Top 10 | % of Net Assets |
|---|---|
| Guggenheim Ultra Short Duration Fund — Institutional Class | |
| Guggenheim Strategy Fund II | |
| Guggenheim Strategy Fund III | |
| Kellanova | |
| Everi Holdings, Inc. | |
| ALLETE, Inc. | |
| Enstar Group Ltd. | |
| Hess Corp. | |
| Dun & Bradstreet Holdings, Inc. | |
| Redfin Corp. | |
| Top 10 Total |
* | Less than 0.1%. |
1 | "Consolidated Holdings Diversification (Market Exposure as a % of Net Assets)" excludes any temporary cash investments, investments in Guggenheim Strategy Funds Trust mutual funds, or investments in Guggenheim Ultra Short Duration Fund. |
2 | "10 Largest Holdings (as a % of Net Assets)" excludes any temporary cash or derivative investments. |
| Top 10 | % of Net Assets |
|---|---|
| Guggenheim Ultra Short Duration Fund — Institutional Class | |
| Guggenheim Strategy Fund II | |
| Guggenheim Strategy Fund III | |
| Kellanova | |
| Everi Holdings, Inc. | |
| ALLETE, Inc. | |
| Enstar Group Ltd. | |
| Hess Corp. | |
| Dun & Bradstreet Holdings, Inc. | |
| Redfin Corp. | |
| Top 10 Total |
2 | "10 Largest Holdings (as a % of Net Assets)" excludes any temporary cash or derivative investments. |
There were no changes in or disagreements with fund accountants for the period.
| Class | Costs of a $10,000 Investment | Costs Paid as a % of a $10,000 Investment |
|---|---|---|
| Class C | $126 | 2.58%2 |
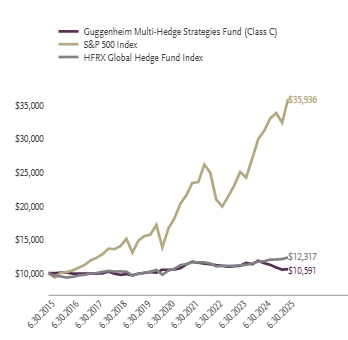
For the period of January 1, 2025 to June 30, 2025, the fund (Class C shares) returned -2.65%, underperforming the fund's broad-based securities market index, the S&P 500 Index, which returned 6.20% for the same period and underperforming the fund's secondary index, the HFRX Global Hedge Fund Index, which returned 2.38% for the same period.
What factors materially affected the fund's performance over the last six months?
The fund's merger arbitrage strategy was the largest positive contributor in the first half of the year as several notable deals closed (e.g. Capital One / Discover). Closed-end fund arbitrage and the long/short equity strategy also made modest positive contributions. The fund's global macro strategies were a net detractor during the period as positive contributions from Flow (driven primarily by fixed income) did not make up for poor performance in value (primarily commodities and fixed income) and Momentum (hurt by equities and currency). Flow strategies take positions based on expected capital flows in markets which are determined through economic theory or statistical observation of market behavior. Momentum is a systematic trend-following strategy that seeks to capture momentum premia in futures markets. Carry strategies seek to capture inefficiencies in the futures curves of different markets and asset classes including commodities, fixed income, and implied volatility. Value premia strategies take positions based on expected future prices in markets as derived from economic and/or non-price data and include strategies applied to commodities, currencies, and fixed income. A market neutral strategy attempts to profit whether the market is going up or down.
| 6 Month† | One Year | Five Years | Ten Years | |
|---|---|---|---|---|
| Class C (without CDSC) | -2.65% | -7.74% | 0.18% | 0.58% |
| Class C (with CDSC)§ | -3.62% | -8.65% | 0.18% | 0.58% |
| S&P 500 Index | 6.20% | 15.16% | 16.64% | 13.65% |
| HFRX Global Hedge Fund Index | 2.38% | 4.74% | 3.52% | 2.11% |
| Net Assets | $15,910,915 |
| Total Number of Portfolio Holdings | |
| Portfolio Turnover Rate | 75% |

| Top 10 | % of Net Assets |
|---|---|
| Guggenheim Ultra Short Duration Fund — Institutional Class | |
| Guggenheim Strategy Fund II | |
| Guggenheim Strategy Fund III | |
| Kellanova | |
| Everi Holdings, Inc. | |
| ALLETE, Inc. | |
| Enstar Group Ltd. | |
| Hess Corp. | |
| Dun & Bradstreet Holdings, Inc. | |
| Redfin Corp. | |
| Top 10 Total |
* | Less than 0.1%. |
1 | "Consolidated Holdings Diversification (Market Exposure as a % of Net Assets)" excludes any temporary cash investments, investments in Guggenheim Strategy Funds Trust mutual funds, or investments in Guggenheim Ultra Short Duration Fund. |
2 | "10 Largest Holdings (as a % of Net Assets)" excludes any temporary cash or derivative investments. |
| Top 10 | % of Net Assets |
|---|---|
| Guggenheim Ultra Short Duration Fund — Institutional Class | |
| Guggenheim Strategy Fund II | |
| Guggenheim Strategy Fund III | |
| Kellanova | |
| Everi Holdings, Inc. | |
| ALLETE, Inc. | |
| Enstar Group Ltd. | |
| Hess Corp. | |
| Dun & Bradstreet Holdings, Inc. | |
| Redfin Corp. | |
| Top 10 Total |
2 | "10 Largest Holdings (as a % of Net Assets)" excludes any temporary cash or derivative investments. |
There were no changes in or disagreements with fund accountants for the period.
| Class | Costs of a $10,000 Investment | Costs Paid as a % of a $10,000 Investment |
|---|---|---|
| Class P | $90 | 1.83%2 |
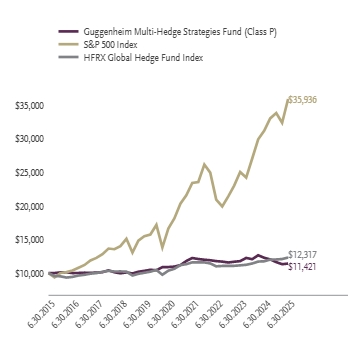
For the period of January 1, 2025 to June 30, 2025, the fund (Class P shares) returned -2.29%, underperforming the fund's broad-based securities market index, the S&P 500 Index, which returned 6.20% for the same period and underperforming the fund's secondary index, the HFRX Global Hedge Fund Index, which returned 2.38% for the same period.
What factors materially affected the fund's performance over the last six months?
The fund's merger arbitrage strategy was the largest positive contributor in the first half of the year as several notable deals closed (e.g. Capital One / Discover). Closed-end fund arbitrage and the long/short equity strategy also made modest positive contributions. The fund's global macro strategies were a net detractor during the period as positive contributions from Flow (driven primarily by fixed income) did not make up for poor performance in value (primarily commodities and fixed income) and Momentum (hurt by equities and currency). Flow strategies take positions based on expected capital flows in markets which are determined through economic theory or statistical observation of market behavior. Momentum is a systematic trend-following strategy that seeks to capture momentum premia in futures markets. Carry strategies seek to capture inefficiencies in the futures curves of different markets and asset classes including commodities, fixed income, and implied volatility. Value premia strategies take positions based on expected future prices in markets as derived from economic and/or non-price data and include strategies applied to commodities, currencies, and fixed income. A market neutral strategy attempts to profit whether the market is going up or down.
| 6 Month† | One Year | Five Years | Ten Years | |
|---|---|---|---|---|
| Class P | -2.29% | -7.00% | 0.93% | 1.34% |
| S&P 500 Index | 6.20% | 15.16% | 16.64% | 13.65% |
| HFRX Global Hedge Fund Index | 2.38% | 4.74% | 3.52% | 2.11% |
| Net Assets | $15,910,915 |
| Total Number of Portfolio Holdings | |
| Portfolio Turnover Rate | 75% |

| Top 10 | % of Net Assets |
|---|---|
| Guggenheim Ultra Short Duration Fund — Institutional Class | |
| Guggenheim Strategy Fund II | |
| Guggenheim Strategy Fund III | |
| Kellanova | |
| Everi Holdings, Inc. | |
| ALLETE, Inc. | |
| Enstar Group Ltd. | |
| Hess Corp. | |
| Dun & Bradstreet Holdings, Inc. | |
| Redfin Corp. | |
| Top 10 Total |
* | Less than 0.1%. |
1 | "Consolidated Holdings Diversification (Market Exposure as a % of Net Assets)" excludes any temporary cash investments, investments in Guggenheim Strategy Funds Trust mutual funds, or investments in Guggenheim Ultra Short Duration Fund. |
2 | "10 Largest Holdings (as a % of Net Assets)" excludes any temporary cash or derivative investments. |
| Top 10 | % of Net Assets |
|---|---|
| Guggenheim Ultra Short Duration Fund — Institutional Class | |
| Guggenheim Strategy Fund II | |
| Guggenheim Strategy Fund III | |
| Kellanova | |
| Everi Holdings, Inc. | |
| ALLETE, Inc. | |
| Enstar Group Ltd. | |
| Hess Corp. | |
| Dun & Bradstreet Holdings, Inc. | |
| Redfin Corp. | |
| Top 10 Total |
2 | "10 Largest Holdings (as a % of Net Assets)" excludes any temporary cash or derivative investments. |
There were no changes in or disagreements with fund accountants for the period.
| Class | Costs of a $10,000 Investment | Costs Paid as a % of a $10,000 Investment |
|---|---|---|
| Institutional Class | $78 | 1.58%2 |
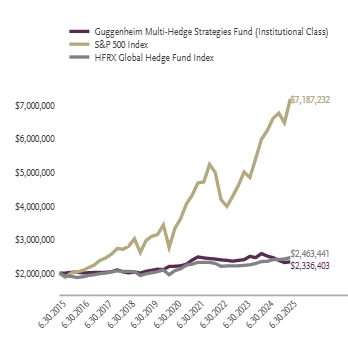
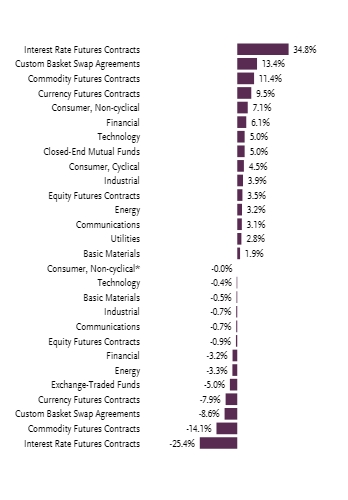
For the period of January 1, 2025 to June 30, 2025, the fund (Institutional Class shares) returned -2.17%, underperforming the fund's broad-based securities market index, the S&P 500 Index, which returned 6.20% for the same period and underperforming the fund's secondary index, the HFRX Global Hedge Fund Index, which returned 2.38% for the same period.
What factors materially affected the fund's performance over the last six months?
The fund's merger arbitrage strategy was the largest positive contributor in the first half of the year as several notable deals closed (e.g. Capital One / Discover). Closed-end fund arbitrage and the long/short equity strategy also made modest positive contributions. The fund's global macro strategies were a net detractor during the period as positive contributions from Flow (driven primarily by fixed income) did not make up for poor performance in value (primarily commodities and fixed income) and Momentum (hurt by equities and currency). Flow strategies take positions based on expected capital flows in markets which are determined through economic theory or statistical observation of market behavior. Momentum is a systematic trend-following strategy that seeks to capture momentum premia in futures markets. Carry strategies seek to capture inefficiencies in the futures curves of different markets and asset classes including commodities, fixed income, and implied volatility. Value premia strategies take positions based on expected future prices in markets as derived from economic and/or non-price data and include strategies applied to commodities, currencies, and fixed income. A market neutral strategy attempts to profit whether the market is going up or down.
| 6 Month† | One Year | Five Years | Ten Years | |
|---|---|---|---|---|
| Institutional Class | -2.17% | -6.80% | 1.18% | 1.57% |
| S&P 500 Index | 6.20% | 15.16% | 16.64% | 13.65% |
| HFRX Global Hedge Fund Index | 2.38% | 4.74% | 3.52% | 2.11% |
| Net Assets | $15,910,915 |
| Total Number of Portfolio Holdings | |
| Portfolio Turnover Rate | 75% |
| Top 10 | % of Net Assets |
|---|---|
| Guggenheim Ultra Short Duration Fund — Institutional Class | |
| Guggenheim Strategy Fund II | |
| Guggenheim Strategy Fund III | |
| Kellanova | |
| Everi Holdings, Inc. | |
| ALLETE, Inc. | |
| Enstar Group Ltd. | |
| Hess Corp. | |
| Dun & Bradstreet Holdings, Inc. | |
| Redfin Corp. | |
| Top 10 Total |
* | Less than 0.1%. |
1 | "Consolidated Holdings Diversification (Market Exposure as a % of Net Assets)" excludes any temporary cash investments, investments in Guggenheim Strategy Funds Trust mutual funds, or investments in Guggenheim Ultra Short Duration Fund. |
2 | "10 Largest Holdings (as a % of Net Assets)" excludes any temporary cash or derivative investments. |
| Top 10 | % of Net Assets |
|---|---|
| Guggenheim Ultra Short Duration Fund — Institutional Class | |
| Guggenheim Strategy Fund II | |
| Guggenheim Strategy Fund III | |
| Kellanova | |
| Everi Holdings, Inc. | |
| ALLETE, Inc. | |
| Enstar Group Ltd. | |
| Hess Corp. | |
| Dun & Bradstreet Holdings, Inc. | |
| Redfin Corp. | |
| Top 10 Total |
2 | "10 Largest Holdings (as a % of Net Assets)" excludes any temporary cash or derivative investments. |
There were no changes in or disagreements with fund accountants for the period.