| Class | Costs of a $10,000 Investment | Costs Paid as a % of a $10,000 Investment |
|---|---|---|
| Variable Annuity | $93 | 1.80%2 |
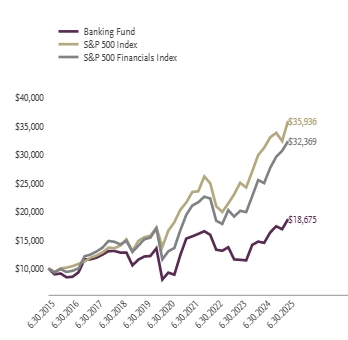
For the period of January 1, 2025 to June 30, 2025, the fund returned 7.30%, outperforming the fund's broad-based securities market index, the S&P 500 Index, which returned 6.20% for the same period and underperforming the fund's secondary index, the S&P 500 Financials Index, which returned 9.23% for the same period.
What factors materially affected the fund's performance over the last six months?
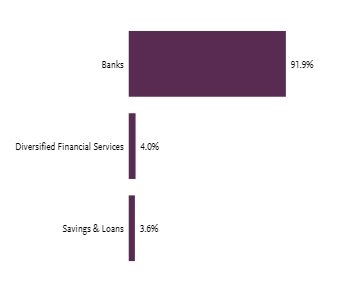
The industries that contributed the most to performance were diversified banks, asset management & custody banks, and consumer finance. No industry detracted from performance. The holdings that contributed the most to performance were Nu Holdings Limited/Cayman Islands—Class A, JP Morgan Chase & Co, and Citigroup, Inc. Those that detracted the most were First Citizens BancShares, Inc.—Class A, Grupo Financiero Galicia SA Sponsored ADR—Class B, and U.S. Bancorp.
| 6 Month‡ | One Year | Five Years | Ten Years | |
|---|---|---|---|---|
| Banking Fund | 7.30% | 28.79% | 15.04% | 6.44% |
| S&P 500 Index | 6.20% | 15.16% | 16.64% | 13.65% |
| S&P 500 Financials Index | 9.23% | 29.45% | 19.99% | 12.46% |
| Net Assets | $6,452,224 |
| Total Number of Portfolio Holdings | |
| Portfolio Turnover Rate | 36% |
| Top 10 | % of Net Assets |
|---|---|
| Citigroup, Inc. | |
| Wells Fargo & Co. | |
| JPMorgan Chase & Co. | |
| Capital One Financial Corp. | |
| Bank of America Corp. | |
| PNC Financial Services Group, Inc. | |
| U.S. Bancorp | |
| NU Holdings Limited/Cayman Islands — Class A | |
| Bank of New York Mellon Corp. | |
| Truist Financial Corp. | |
| Top 10 Total |
1 | "Holdings Diversification (Market Exposure as a % of Net Assets)" excludes any temporary cash investments, investments in Guggenheim Strategy Funds Trust mutual funds, or investments in Guggenheim Ultra Short Duration Fund. |
2 | "10 Largest Holdings (as a % of Net Assets)" excludes any temporary cash investments. |
| Top 10 | % of Net Assets |
|---|---|
| Citigroup, Inc. | |
| Wells Fargo & Co. | |
| JPMorgan Chase & Co. | |
| Capital One Financial Corp. | |
| Bank of America Corp. | |
| PNC Financial Services Group, Inc. | |
| U.S. Bancorp | |
| NU Holdings Limited/Cayman Islands — Class A | |
| Bank of New York Mellon Corp. | |
| Truist Financial Corp. | |
| Top 10 Total |
2 | "10 Largest Holdings (as a % of Net Assets)" excludes any temporary cash investments. |
There were no changes in or disagreements with fund accountants for the period.
| Class | Costs of a $10,000 Investment | Costs Paid as a % of a $10,000 Investment |
|---|---|---|
| Variable Annuity | $94 | 1.80%2 |
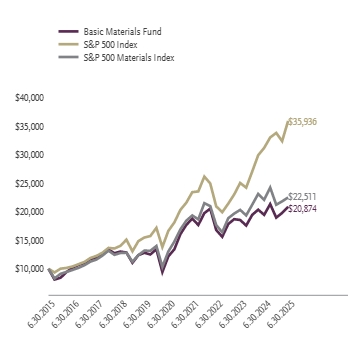
For the period of January 1, 2025 to June 30, 2025, the fund returned 10.01%, outperforming the fund's broad-based securities market index, the S&P 500 Index, which returned 6.20% for the same period and outperforming the fund's secondary index, the S&P 500 Materials Index, which returned 6.03% for the same period.
What factors materially affected the fund's performance over the last six months?
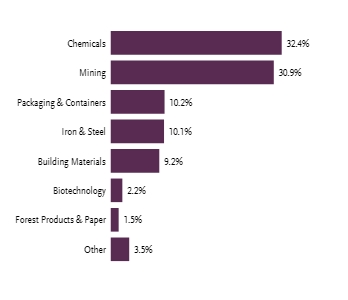
The industries that contributed the most to performance were gold, steel, and fertilizers & agricultural chemicals. Those that detracted the most were specialty chemicals, commodity chemicals, and paper & plastic packaging products & materials. The holdings that contributed the most to performance were Newmont Corp., Linde plc, and Anglogold Ashanti plc. Those that detracted the most were Dow, Inc., LyondellBasell Industries N.V. - Class A, and Albemarle Corp.
| 6 Month‡ | One Year | Five Years | Ten Years | |
|---|---|---|---|---|
| Basic Materials Fund | 10.01% | 7.25% | 11.38% | 7.64% |
| S&P 500 Index | 6.20% | 15.16% | 16.64% | 13.65% |
| S&P 500 Materials Index | 6.03% | 1.86% | 11.56% | 8.45% |
| Net Assets | $5,513,640 |
| Total Number of Portfolio Holdings | |
| Portfolio Turnover Rate | 40% |
| Top 10 | % of Net Assets |
|---|---|
| Linde plc | |
| Sherwin-Williams Co. | |
| Ecolab, Inc. | |
| Newmont Corp. | |
| Freeport-McMoRan, Inc. | |
| Air Products and Chemicals, Inc. | |
| CRH plc | |
| Corteva, Inc. | |
| Vulcan Materials Co. | |
| Martin Marietta Materials, Inc. | |
| Top 10 Total |
1 | "Holdings Diversification (Market Exposure as a % of Net Assets)" excludes any temporary cash investments, investments in Guggenheim Strategy Funds Trust mutual funds, or investments in Guggenheim Ultra Short Duration Fund. |
2 | "10 Largest Holdings (as a % of Net Assets)" excludes any temporary cash investments. |
| Top 10 | % of Net Assets |
|---|---|
| Linde plc | |
| Sherwin-Williams Co. | |
| Ecolab, Inc. | |
| Newmont Corp. | |
| Freeport-McMoRan, Inc. | |
| Air Products and Chemicals, Inc. | |
| CRH plc | |
| Corteva, Inc. | |
| Vulcan Materials Co. | |
| Martin Marietta Materials, Inc. | |
| Top 10 Total |
2 | "10 Largest Holdings (as a % of Net Assets)" excludes any temporary cash investments. |
There were no changes in or disagreements with fund accountants for the period.
| Class | Costs of a $10,000 Investment | Costs Paid as a % of a $10,000 Investment |
|---|---|---|
| Variable Annuity | $88 | 1.80%2 |
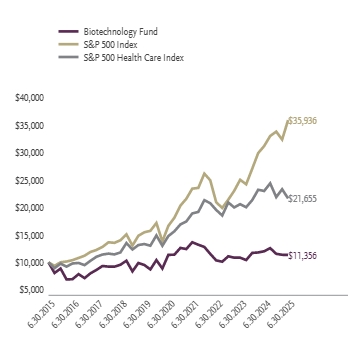
For the period of January 1, 2025 to June 30, 2025, the fund returned -1.71%, underperforming the fund's broad-based securities market index, the S&P 500 Index, which returned 6.20% for the same period and underperforming the fund's secondary index, the S&P 500 Health Care Index, which returned -1.11% for the same period.
What factors materially affected the fund's performance over the last six months?
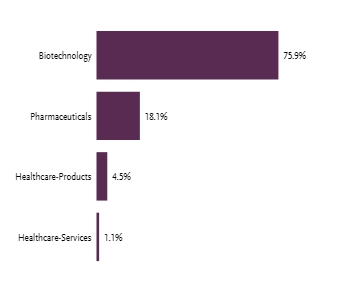
The industries that contributed the most to performance were pharmaceuticals, fertilizers & agricultural chemicals, and health care services. Those that detracted the most were biotechnology and life sciences tools & services. The holdings that contributed the most to performance were Corteva, Inc., Gilead Sciences, Inc., and Alnylam Pharmaceuticals, Inc. Those that detracted the most were Sarepta Therapeutics, Inc., Regeneron Pharmaceuticals, Inc., and Vaxcyte, Inc.
| 6 Month‡ | One Year | Five Years | Ten Years | |
|---|---|---|---|---|
| Biotechnology Fund | -1.71% | -5.52% | -0.01% | 1.28% |
| S&P 500 Index | 6.20% | 15.16% | 16.64% | 13.65% |
| S&P 500 Health Care Index | -1.11% | -5.90% | 7.93% | 8.03% |
| Net Assets | $8,996,675 |
| Total Number of Portfolio Holdings | |
| Portfolio Turnover Rate | 528% |
| Top 10 | % of Net Assets |
|---|---|
| AbbVie, Inc. | |
| Amgen, Inc. | |
| Gilead Sciences, Inc. | |
| Vertex Pharmaceuticals, Inc. | |
| Regeneron Pharmaceuticals, Inc. | |
| Corteva, Inc. | |
| Alnylam Pharmaceuticals, Inc. | |
| Natera, Inc. | |
| AstraZeneca plc ADR | |
| Insmed, Inc. | |
| Top 10 Total |
1 | "Holdings Diversification (Market Exposure as a % of Net Assets)" excludes any temporary cash investments, investments in Guggenheim Strategy Funds Trust mutual funds, or investments in Guggenheim Ultra Short Duration Fund. |
2 | "10 Largest Holdings (as a % of Net Assets)" excludes any temporary cash investments. |
| Top 10 | % of Net Assets |
|---|---|
| AbbVie, Inc. | |
| Amgen, Inc. | |
| Gilead Sciences, Inc. | |
| Vertex Pharmaceuticals, Inc. | |
| Regeneron Pharmaceuticals, Inc. | |
| Corteva, Inc. | |
| Alnylam Pharmaceuticals, Inc. | |
| Natera, Inc. | |
| AstraZeneca plc ADR | |
| Insmed, Inc. | |
| Top 10 Total |
2 | "10 Largest Holdings (as a % of Net Assets)" excludes any temporary cash investments. |
There were no changes in or disagreements with fund accountants for the period.
| Class | Costs of a $10,000 Investment | Costs Paid as a % of a $10,000 Investment |
|---|---|---|
| Variable Annuity | $90 | 1.80%2 |
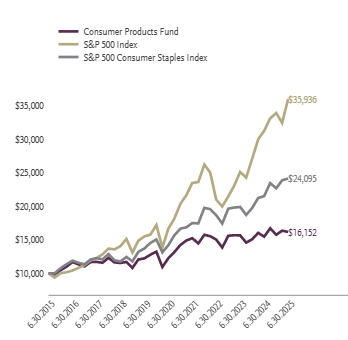
For the period of January 1, 2025 to June 30, 2025, the fund returned 2.72%, underperforming the fund's broad-based securities market index, the S&P 500 Index, which returned 6.20% for the same period and underperforming the fund's secondary index, the S&P 500 Consumer Staples Index, which returned 6.40% for the same period.
What factors materially affected the fund's performance over the last six months?
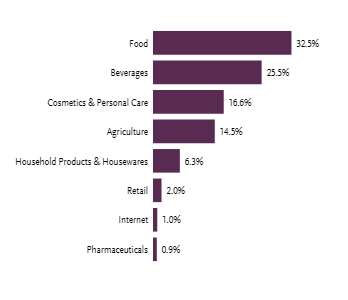
The industries that contributed the most to performance were tobacco, soft drinks & non-alcoholic beverages, and food retail. Those that detracted the most were packaged foods & meats, distillers & vintners, and household products. The holdings that contributed the most to performance were Phillip Morris International, Inc., Coca-Cola Co., and Celsius Holdings, Inc. Those that detracted the most were PepsiCo, Inc., Freshpet, Inc., and Constellation Brands, Inc.—Class A.
| 6 Month‡ | One Year | Five Years | Ten Years | |
|---|---|---|---|---|
| Consumer Products Fund | 2.72% | 4.62% | 5.72% | 4.91% |
| S&P 500 Index | 6.20% | 15.16% | 16.64% | 13.65% |
| S&P 500 Consumer Staples Index | 6.40% | 12.16% | 11.20% | 9.19% |
| Net Assets | $5,687,063 |
| Total Number of Portfolio Holdings | |
| Portfolio Turnover Rate | 24% |
| Top 10 | % of Net Assets |
|---|---|
| Procter & Gamble Co. | |
| Philip Morris International, Inc. | |
| Coca-Cola Co. | |
| PepsiCo, Inc. | |
| Altria Group, Inc. | |
| Mondelez International, Inc. — Class A | |
| Colgate-Palmolive Co. | |
| Kroger Co. | |
| Keurig Dr Pepper, Inc. | |
| Monster Beverage Corp. | |
| Top 10 Total |
1 | "Holdings Diversification (Market Exposure as a % of Net Assets)" excludes any temporary cash investments, investments in Guggenheim Strategy Funds Trust mutual funds, or investments in Guggenheim Ultra Short Duration Fund. |
2 | "10 Largest Holdings (as a % of Net Assets)" excludes any temporary cash investments. |
| Top 10 | % of Net Assets |
|---|---|
| Procter & Gamble Co. | |
| Philip Morris International, Inc. | |
| Coca-Cola Co. | |
| PepsiCo, Inc. | |
| Altria Group, Inc. | |
| Mondelez International, Inc. — Class A | |
| Colgate-Palmolive Co. | |
| Kroger Co. | |
| Keurig Dr Pepper, Inc. | |
| Monster Beverage Corp. | |
| Top 10 Total |
2 | "10 Largest Holdings (as a % of Net Assets)" excludes any temporary cash investments. |
There were no changes in or disagreements with fund accountants for the period.
| Class | Costs of a $10,000 Investment | Costs Paid as a % of a $10,000 Investment |
|---|---|---|
| Variable Annuity | $93 | 1.79%2 |
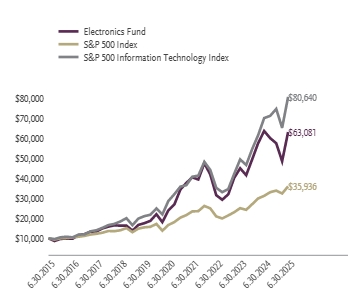
For the period of January 1, 2025 to June 30, 2025, the fund returned 9.74%, outperforming the fund's broad-based securities market index, the S&P 500 Index, which returned 6.20% for the same period and outperforming the fund's secondary index, the S&P 500 Information Technology Index, which returned 8.05% for the same period.
What factors materially affected the fund's performance over the last six months?
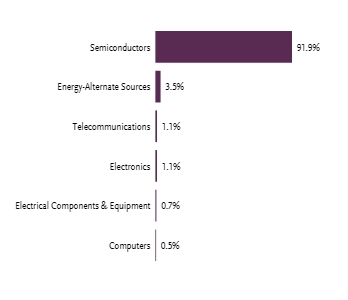
The industries that contributed the most to performance were semiconductors and semiconductor materials & equipment. No industries detracted from performance. The holdings that contributed the most to performance were NVIDIA Corp., Broadcom, Inc. and KLA Corp. Those that detracted the most were Marvell Technology, Inc., Enphase Energy, Inc. and Teradyne, Inc.
| 6 Month‡ | One Year | Five Years | Ten Years | |
|---|---|---|---|---|
| Electronics Fund | 9.74% | -0.82% | 21.40% | 20.22% |
| S&P 500 Index | 6.20% | 15.16% | 16.64% | 13.65% |
| S&P 500 Information Technology Index | 8.05% | 15.10% | 23.02% | 23.21% |
| Net Assets | $12,776,636 |
| Total Number of Portfolio Holdings | |
| Portfolio Turnover Rate | 17% |
| Top 10 | % of Net Assets |
|---|---|
| NVIDIA Corp. | |
| Broadcom, Inc. | |
| Advanced Micro Devices, Inc. | |
| Texas Instruments, Inc. | |
| QUALCOMM, Inc. | |
| Applied Materials, Inc. | |
| Micron Technology, Inc. | |
| Lam Research Corp. | |
| KLA Corp. | |
| Analog Devices, Inc. | |
| Top 10 Total |
1 | "Holdings Diversification (Market Exposure as a % of Net Assets)" excludes any temporary cash investments, investments in Guggenheim Strategy Funds Trust mutual funds, or investments in Guggenheim Ultra Short Duration Fund. |
2 | "10 Largest Holdings (as a % of Net Assets)" excludes any temporary cash investments. |
| Top 10 | % of Net Assets |
|---|---|
| NVIDIA Corp. | |
| Broadcom, Inc. | |
| Advanced Micro Devices, Inc. | |
| Texas Instruments, Inc. | |
| QUALCOMM, Inc. | |
| Applied Materials, Inc. | |
| Micron Technology, Inc. | |
| Lam Research Corp. | |
| KLA Corp. | |
| Analog Devices, Inc. | |
| Top 10 Total |
2 | "10 Largest Holdings (as a % of Net Assets)" excludes any temporary cash investments. |
There were no changes in or disagreements with fund accountants for the period.
| Class | Costs of a $10,000 Investment | Costs Paid as a % of a $10,000 Investment |
|---|---|---|
| Variable Annuity | $89 | 1.80%2 |
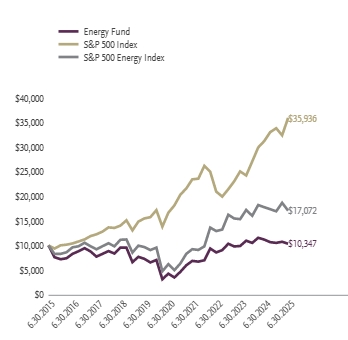
For the period of January 1, 2025 to June 30, 2025, the fund returned -1.60%, underperforming the fund's broad-based securities market index, the S&P 500 Index, which returned 6.20% for the same period and underperforming the fund's secondary index, the S&P 500 Energy Index, which returned 0.77% for the same period.
What factors materially affected the fund's performance over the last six months?
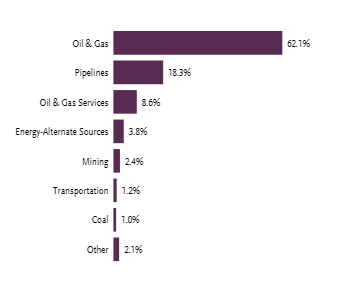
The industries that contributed the most to performance were oil & gas refining and marketing, coal & consumable fuels, and oil & gas storage and transportation. Those that detracted the most were oil & gas equipment & services, oil & gas drilling, and oil & gas exploration & production. The holdings that contributed the most to performance were EQT Corp., Cameco Corp., and SolarEdge Technologies, Inc. Those that detracted the most were Enphase Energy, Inc., ONEOK, Inc., and New Fortress Energy Inc.—Class A.
| 6 Month‡ | One Year | Five Years | Ten Years | |
|---|---|---|---|---|
| Energy Fund | -1.60% | -7.56% | 19.47% | 0.34% |
| S&P 500 Index | 6.20% | 15.16% | 16.64% | 13.65% |
| S&P 500 Energy Index | 0.77% | -3.96% | 22.54% | 5.49% |
| Net Assets | $10,239,991 |
| Total Number of Portfolio Holdings | |
| Portfolio Turnover Rate | 415% |
| Top 10 | % of Net Assets |
|---|---|
| Exxon Mobil Corp. | |
| Chevron Corp. | |
| ConocoPhillips | |
| Williams Companies, Inc. | |
| EOG Resources, Inc. | |
| Kinder Morgan, Inc. | |
| Cheniere Energy, Inc. | |
| Marathon Petroleum Corp. | |
| ONEOK, Inc. | |
| Phillips 66 | |
| Top 10 Total |
1 | "Holdings Diversification (Market Exposure as a % of Net Assets)" excludes any temporary cash investments, investments in Guggenheim Strategy Funds Trust mutual funds, or investments in Guggenheim Ultra Short Duration Fund. |
2 | "10 Largest Holdings (as a % of Net Assets)" excludes any temporary cash investments. |
| Top 10 | % of Net Assets |
|---|---|
| Exxon Mobil Corp. | |
| Chevron Corp. | |
| ConocoPhillips | |
| Williams Companies, Inc. | |
| EOG Resources, Inc. | |
| Kinder Morgan, Inc. | |
| Cheniere Energy, Inc. | |
| Marathon Petroleum Corp. | |
| ONEOK, Inc. | |
| Phillips 66 | |
| Top 10 Total |
2 | "10 Largest Holdings (as a % of Net Assets)" excludes any temporary cash investments. |
There were no changes in or disagreements with fund accountants for the period.
| Class | Costs of a $10,000 Investment | Costs Paid as a % of a $10,000 Investment |
|---|---|---|
| Variable Annuity | $81 | 1.80%2 |
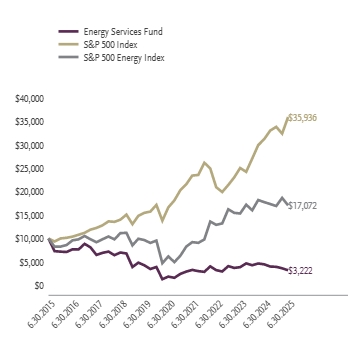
For the period of January 1, 2025 to June 30, 2025, the fund returned -18.50%, underperforming the fund's broad-based securities market index, the S&P 500 Index, which returned 6.20% for the same period and underperforming the fund's secondary index, the S&P 500 Energy Index, which returned 0.77% for the same period.
What factors materially affected the fund's performance over the last six months?
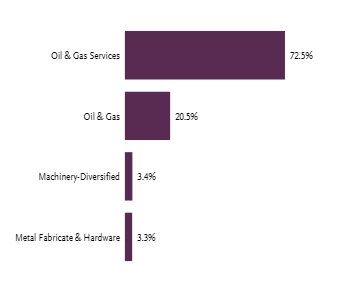
No industry contributed to positive performance. The industries that detracted from performance were oil & gas drilling, and oil & gas equipment and services. The holdings that contributed the most to performance were TechnipFMC plc, Solaris Energy Infrastructure, Inc.—Class A, and Valaris Ltd. Those that detracted the most were Helmerich & Payne, Inc., SLB (formerly Schlumberger, Ltd.), and Halliburton Co.
| 6 Month‡ | One Year | Five Years | Ten Years | |
|---|---|---|---|---|
| Energy Services Fund | -18.50% | -28.25% | 11.49% | -10.71% |
| S&P 500 Index | 6.20% | 15.16% | 16.64% | 13.65% |
| S&P 500 Energy Index | 0.77% | -3.96% | 22.54% | 5.49% |
| Net Assets | $2,989,824 |
| Total Number of Portfolio Holdings | |
| Portfolio Turnover Rate | 1,273% |
| Top 10 | % of Net Assets |
|---|---|
| Schlumberger N.V. | |
| Baker Hughes Co. | |
| Halliburton Co. | |
| TechnipFMC plc | |
| ChampionX Corp. | |
| Archrock, Inc. | |
| NOV, Inc. | |
| Weatherford International plc | |
| Cactus, Inc. — Class A | |
| Noble Corporation plc | |
| Top 10 Total |
1 | "Holdings Diversification (Market Exposure as a % of Net Assets)" excludes any temporary cash investments, investments in Guggenheim Strategy Funds Trust mutual funds, or investments in Guggenheim Ultra Short Duration Fund. |
2 | "10 Largest Holdings (as a % of Net Assets)" excludes any temporary cash investments. |
| Top 10 | % of Net Assets |
|---|---|
| Schlumberger N.V. | |
| Baker Hughes Co. | |
| Halliburton Co. | |
| TechnipFMC plc | |
| ChampionX Corp. | |
| Archrock, Inc. | |
| NOV, Inc. | |
| Weatherford International plc | |
| Cactus, Inc. — Class A | |
| Noble Corporation plc | |
| Top 10 Total |
2 | "10 Largest Holdings (as a % of Net Assets)" excludes any temporary cash investments. |
There were no changes in or disagreements with fund accountants for the period.
| Class | Costs of a $10,000 Investment | Costs Paid as a % of a $10,000 Investment |
|---|---|---|
| Variable Annuity | $93 | 1.80%2 |
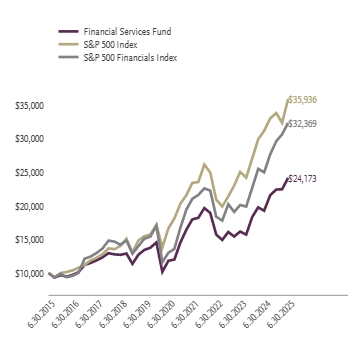
For the period of January 1, 2025 to June 30, 2025, the fund returned 7.72%, outperforming the fund's broad-based securities market index, the S&P 500 Index, which returned 6.20% for the same period and underperforming the fund's secondary index, the S&P 500 Financials Index, which returned 9.23% for the same period.
What factors materially affected the fund's performance over the last six months?
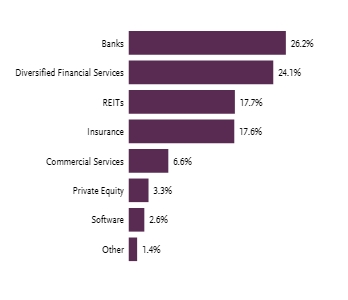
The industries that contributed the most to performance were investment banking & brokerage, diversified banks, and financial exchanges & data. Those that detracted the most were data center REITs, multi-family residential REITs, and industrial REITs. The holdings that contributed the most to performance were Robinhood Markets, Inc.— Class A, JPMorgan Chase & Co., StoneCo, Ltd.—Class A. Those that detracted the most were Fiserv, Inc., Global Payments, Inc., and Blackstone, Inc.— Class A.
| 6 Month‡ | One Year | Five Years | Ten Years | |
|---|---|---|---|---|
| Financial Services Fund | 7.72% | 25.35% | 15.38% | 9.23% |
| S&P 500 Index | 6.20% | 15.16% | 16.64% | 13.65% |
| S&P 500 Financials Index | 9.23% | 29.45% | 19.99% | 12.46% |
| Net Assets | $11,339,481 |
| Total Number of Portfolio Holdings | |
| Portfolio Turnover Rate | 50% |
| Top 10 | % of Net Assets |
|---|---|
| Berkshire Hathaway, Inc. — Class B | |
| JPMorgan Chase & Co. | |
| Visa, Inc. — Class A | |
| Mastercard, Inc. — Class A | |
| Bank of America Corp. | |
| Wells Fargo & Co. | |
| Goldman Sachs Group, Inc. | |
| Blackstone, Inc. — Class A | |
| Morgan Stanley | |
| S&P Global, Inc. | |
| Top 10 Total |
1 | "Holdings Diversification (Market Exposure as a % of Net Assets)" excludes any temporary cash investments, investments in Guggenheim Strategy Funds Trust mutual funds, or investments in Guggenheim Ultra Short Duration Fund. |
2 | "10 Largest Holdings (as a % of Net Assets)" excludes any temporary cash investments. |
| Top 10 | % of Net Assets |
|---|---|
| Berkshire Hathaway, Inc. — Class B | |
| JPMorgan Chase & Co. | |
| Visa, Inc. — Class A | |
| Mastercard, Inc. — Class A | |
| Bank of America Corp. | |
| Wells Fargo & Co. | |
| Goldman Sachs Group, Inc. | |
| Blackstone, Inc. — Class A | |
| Morgan Stanley | |
| S&P Global, Inc. | |
| Top 10 Total |
2 | "10 Largest Holdings (as a % of Net Assets)" excludes any temporary cash investments. |
There were no changes in or disagreements with fund accountants for the period.
| Class | Costs of a $10,000 Investment | Costs Paid as a % of a $10,000 Investment |
|---|---|---|
| Variable Annuity | $89 | 1.80%2 |
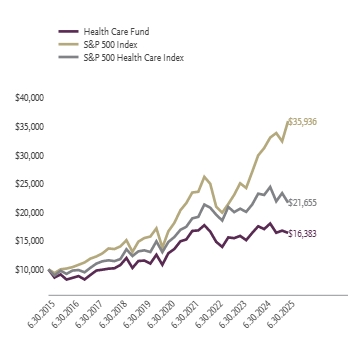
For the period of January 1, 2025 to June 30, 2025, the fund returned -0.11%, underperforming the fund's broad-based securities market index, the S&P 500 Index, which returned 6.20% for the same period and outperforming the fund's secondary index, the S&P 500 Health Care Index, which returned -1.11% for the same period.
What factors materially affected the fund's performance over the last six months?
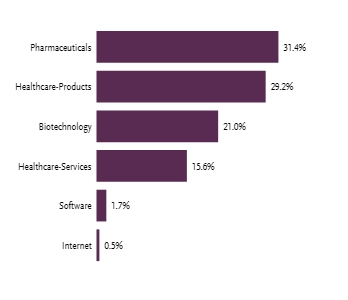
The industries that contributed the most to performance were health care equipment, health care services, and health care distributors. Those that detracted the most were life sciences tools & services, managed health care, and biotechnology. The holdings that contributed the most to performance were CVS Health Corp., Abbott Laboratories, and Boston Scientific Corp. Those that detracted the most were UnitedHealth Group, Inc., Sarepta Therapeutics, Inc. and Thermo Fisher Scientific, Inc.
| 6 Month‡ | One Year | Five Years | Ten Years | |
|---|---|---|---|---|
| Health Care Fund | -0.11% | -3.93% | 5.03% | 5.06% |
| S&P 500 Index | 6.20% | 15.16% | 16.64% | 13.65% |
| S&P 500 Health Care Index | -1.11% | -5.90% | 7.93% | 8.03% |
| Net Assets | $9,027,393 |
| Total Number of Portfolio Holdings | |
| Portfolio Turnover Rate | 43% |
| Top 10 | % of Net Assets |
|---|---|
| Eli Lilly & Co. | |
| Johnson & Johnson | |
| AbbVie, Inc. | |
| UnitedHealth Group, Inc. | |
| Abbott Laboratories | |
| Intuitive Surgical, Inc. | |
| Merck & Company, Inc. | |
| Boston Scientific Corp. | |
| Thermo Fisher Scientific, Inc. | |
| Stryker Corp. | |
| Top 10 Total |
1 | "Holdings Diversification (Market Exposure as a % of Net Assets)" excludes any temporary cash investments, investments in Guggenheim Strategy Funds Trust mutual funds, or investments in Guggenheim Ultra Short Duration Fund. |
2 | "10 Largest Holdings (as a % of Net Assets)" excludes any temporary cash investments. |
| Top 10 | % of Net Assets |
|---|---|
| Eli Lilly & Co. | |
| Johnson & Johnson | |
| AbbVie, Inc. | |
| UnitedHealth Group, Inc. | |
| Abbott Laboratories | |
| Intuitive Surgical, Inc. | |
| Merck & Company, Inc. | |
| Boston Scientific Corp. | |
| Thermo Fisher Scientific, Inc. | |
| Stryker Corp. | |
| Top 10 Total |
2 | "10 Largest Holdings (as a % of Net Assets)" excludes any temporary cash investments. |
There were no changes in or disagreements with fund accountants for the period.
| Class | Costs of a $10,000 Investment | Costs Paid as a % of a $10,000 Investment |
|---|---|---|
| Variable Annuity | $94 | 1.80%2 |
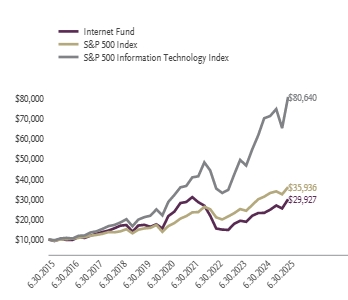
For the period of January 1, 2025 to June 30, 2025, the fund returned 11.54%, outperforming the fund's broad-based securities market index, the S&P 500 Index, which returned 6.20% for the same period and outperforming the fund's secondary index, the S&P 500 Information Technology Index, which returned 8.05% for the same period.
What factors materially affected the fund's performance over the last six months?
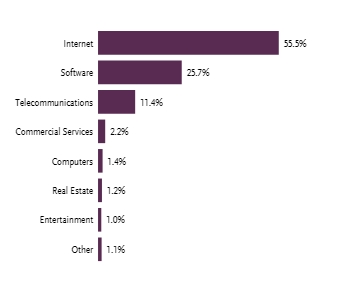
The industries that contributed the most to performance were movies & entertainment, interactive home entertainment and internet services & infrastructure. Those that detracted the most were application software, transaction & payment processing, and human resources & employment services. The holdings that contributed the most to performance were Netflix, Inc., Uber Technologies, Inc., and Meta Platforms, Inc.—Class A. Those that detracted the most were Salesforce, Inc., Alphabet, Inc.—Class A, and Adobe, Inc.
| 6 Month‡ | One Year | Five Years | Ten Years | |
|---|---|---|---|---|
| Internet Fund | 11.54% | 29.18% | 6.75% | 11.59% |
| S&P 500 Index | 6.20% | 15.16% | 16.64% | 13.65% |
| S&P 500 Information Technology Index | 8.05% | 15.10% | 23.02% | 23.21% |
| Net Assets | $5,640,733 |
| Total Number of Portfolio Holdings | |
| Portfolio Turnover Rate | 50% |
| Top 10 | % of Net Assets |
|---|---|
| Meta Platforms, Inc. — Class A | |
| Amazon.com, Inc. | |
| Alphabet, Inc. — Class A | |
| Netflix, Inc. | |
| Cisco Systems, Inc. | |
| Salesforce, Inc. | |
| Uber Technologies, Inc. | |
| Adobe, Inc. | |
| DoorDash, Inc. — Class A | |
| Arista Networks, Inc. | |
| Top 10 Total |
1 | "Holdings Diversification (Market Exposure as a % of Net Assets)" excludes any temporary cash investments, investments in Guggenheim Strategy Funds Trust mutual funds, or investments in Guggenheim Ultra Short Duration Fund. |
2 | "10 Largest Holdings (as a % of Net Assets)" excludes any temporary cash investments. |
| Top 10 | % of Net Assets |
|---|---|
| Meta Platforms, Inc. — Class A | |
| Amazon.com, Inc. | |
| Alphabet, Inc. — Class A | |
| Netflix, Inc. | |
| Cisco Systems, Inc. | |
| Salesforce, Inc. | |
| Uber Technologies, Inc. | |
| Adobe, Inc. | |
| DoorDash, Inc. — Class A | |
| Arista Networks, Inc. | |
| Top 10 Total |
2 | "10 Largest Holdings (as a % of Net Assets)" excludes any temporary cash investments. |
There were no changes in or disagreements with fund accountants for the period.
| Class | Costs of a $10,000 Investment | Costs Paid as a % of a $10,000 Investment |
|---|---|---|
| Variable Annuity | $94 | 1.80%2 |
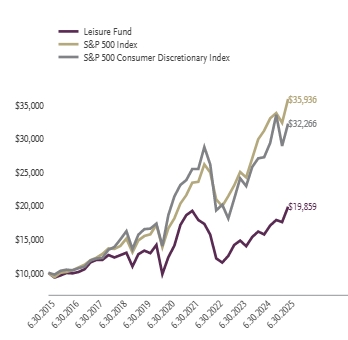
For the period of January 1, 2025 to June 30, 2025, the fund returned 11.07%, outperforming the fund's broad-based securities market index, the S&P 500 Index, which returned 6.20% for the same period and outperforming the fund's secondary index, the S&P 500 Consumer Discretionary Index, which returned -3.87% for the same period.
What factors materially affected the fund's performance over the last six months?
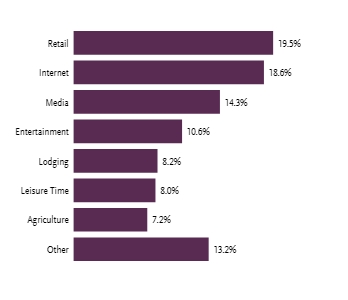
The industries that contributed the most to performance were movies & entertainment, tobacco, and interactive home entertainment. Those that detracted the most were hotels resorts & cruise lines, distillers & vintners, and casinos & gaming. The holdings that contributed the most to performance were Netflix, Inc, Philip Morris International, Inc., Roblox Corp—Class A. Those that detracted the most were Constellation Brands, Inc.—Class A, Trip.com Group Ltd. ADR, and Starbucks Corp.
| 6 Month‡ | One Year | Five Years | Ten Years | |
|---|---|---|---|---|
| Leisure Fund | 11.07% | 26.27% | 10.00% | 7.10% |
| S&P 500 Index | 6.20% | 15.16% | 16.64% | 13.65% |
| S&P 500 Consumer Discretionary Index | -3.87% | 18.40% | 11.65% | 12.43% |
| Net Assets | $6,517,889 |
| Total Number of Portfolio Holdings | |
| Portfolio Turnover Rate | 154% |
| Top 10 | % of Net Assets |
|---|---|
| Netflix, Inc. | |
| Philip Morris International, Inc. | |
| Walt Disney Co. | |
| McDonald's Corp. | |
| Comcast Corp. — Class A | |
| DoorDash, Inc. — Class A | |
| Starbucks Corp. | |
| Altria Group, Inc. | |
| Royal Caribbean Cruises Ltd. | |
| Chipotle Mexican Grill, Inc. — Class A | |
| Top 10 Total |
1 | "Holdings Diversification (Market Exposure as a % of Net Assets)" excludes any temporary cash investments, investments in Guggenheim Strategy Funds Trust mutual funds, or investments in Guggenheim Ultra Short Duration Fund. |
2 | "10 Largest Holdings (as a % of Net Assets)" excludes any temporary cash investments. |
| Top 10 | % of Net Assets |
|---|---|
| Netflix, Inc. | |
| Philip Morris International, Inc. | |
| Walt Disney Co. | |
| McDonald's Corp. | |
| Comcast Corp. — Class A | |
| DoorDash, Inc. — Class A | |
| Starbucks Corp. | |
| Altria Group, Inc. | |
| Royal Caribbean Cruises Ltd. | |
| Chipotle Mexican Grill, Inc. — Class A | |
| Top 10 Total |
2 | "10 Largest Holdings (as a % of Net Assets)" excludes any temporary cash investments. |
There were no changes in or disagreements with fund accountants for the period.
| Class | Costs of a $10,000 Investment | Costs Paid as a % of a $10,000 Investment |
|---|---|---|
| Variable Annuity | $105 | 1.70%2 |
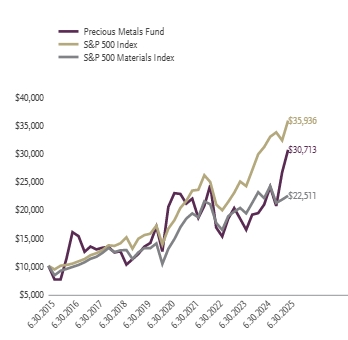
For the period of January 1, 2025 to June 30, 2025, the fund returned 48.39%, outperforming the fund's broad-based securities market index, the S&P 500 Index, which returned 6.20% for the same period and outperforming the fund's secondary index, the S&P 500 Materials Index, which returned 6.03% for the same period.
What factors materially affected the fund's performance over the last six months?
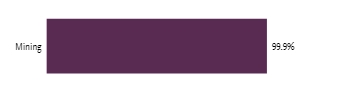
The industries that contributed the most to performance were gold, silver, and precious metals. No industries detracted from performance. The holdings that contributed the most to performance were Newmont Corp., Agnicio Eagle Mines Ltd., and Anglogold Ashanti plc. No holdings detracted from performance.
| 6 Month‡ | One Year | Five Years | Ten Years | |
|---|---|---|---|---|
| Precious Metals Fund | 48.39% | 46.75% | 8.40% | 11.87% |
| S&P 500 Index | 6.20% | 15.16% | 16.64% | 13.65% |
| S&P 500 Materials Index | 6.03% | 1.86% | 11.56% | 8.45% |
| Net Assets | $25,956,305 |
| Total Number of Portfolio Holdings | |
| Portfolio Turnover Rate | 117% |
| Top 10 | % of Net Assets |
|---|---|
| Newmont Corp. | |
| Freeport-McMoRan, Inc. | |
| Agnico Eagle Mines Ltd. | |
| Wheaton Precious Metals Corp. | |
| Barrick Mining Corp. | |
| Kinross Gold Corp. | |
| Franco-Nevada Corp. | |
| Gold Fields Ltd. ADR | |
| Anglogold Ashanti plc | |
| Alamos Gold, Inc. — Class A | |
| Top 10 Total |
1 | "Holdings Diversification (Market Exposure as a % of Net Assets)" excludes any temporary cash investments, investments in Guggenheim Strategy Funds Trust mutual funds, or investments in Guggenheim Ultra Short Duration Fund. |
2 | "10 Largest Holdings (as a % of Net Assets)" excludes any temporary cash investments. |
| Top 10 | % of Net Assets |
|---|---|
| Newmont Corp. | |
| Freeport-McMoRan, Inc. | |
| Agnico Eagle Mines Ltd. | |
| Wheaton Precious Metals Corp. | |
| Barrick Mining Corp. | |
| Kinross Gold Corp. | |
| Franco-Nevada Corp. | |
| Gold Fields Ltd. ADR | |
| Anglogold Ashanti plc | |
| Alamos Gold, Inc. — Class A | |
| Top 10 Total |
2 | "10 Largest Holdings (as a % of Net Assets)" excludes any temporary cash investments. |
There were no changes in or disagreements with fund accountants for the period.
| Class | Costs of a $10,000 Investment | Costs Paid as a % of a $10,000 Investment |
|---|---|---|
| Variable Annuity | $89 | 1.80%2 |
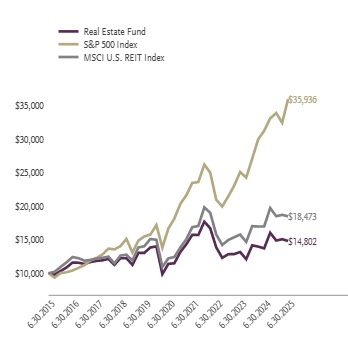
For the period of January 1, 2025 to June 30, 2025, the fund returned -0.45%, underperforming the fund's broad-based securities market index, the S&P 500 Index, which returned 6.20% for the same period and underperforming the fund's secondary index, the MSCI U.S. REIT Index, which returned -0.09% for the same period.
What factors materially affected the fund's performance over the last six months?
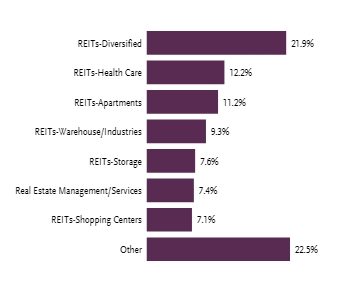
The industries that contributed the most to performance were telecom tower REITs, health care REITs, and other specialized REITs. Those that detracted the most were hotel & resort REITs, retail REITS, and office REITs. The holdings that contributed the most to performance were Welltower, Inc., American Tower Corp.— Class A, and Crown Castle, Inc. Those that detracted the most were Equinix, Inc., Alexandria Real Estate Equities, Inc., and Americold Realty Trust, Inc.
| 6 Month‡ | One Year | Five Years | Ten Years | |
|---|---|---|---|---|
| Real Estate Fund | -0.45% | 8.00% | 5.38% | 4.00% |
| S&P 500 Index | 6.20% | 15.16% | 16.64% | 13.65% |
| MSCI U.S. REIT Index | -0.09% | 8.92% | 8.63% | 6.33% |
| Net Assets | $3,654,812 |
| Total Number of Portfolio Holdings | |
| Portfolio Turnover Rate | 144% |
| Top 10 | % of Net Assets |
|---|---|
| American Tower Corp. — Class A | |
| Welltower, Inc. | |
| Prologis, Inc. | |
| Digital Realty Trust, Inc. | |
| Realty Income Corp. | |
| Simon Property Group, Inc. | |
| Equinix, Inc. | |
| Public Storage | |
| Crown Castle, Inc. | |
| CBRE Group, Inc. — Class A | |
| Top 10 Total |
1 | "Holdings Diversification (Market Exposure as a % of Net Assets)" excludes any temporary cash investments, investments in Guggenheim Strategy Funds Trust mutual funds, or investments in Guggenheim Ultra Short Duration Fund. |
2 | "10 Largest Holdings (as a % of Net Assets)" excludes any temporary cash investments. |
| Top 10 | % of Net Assets |
|---|---|
| American Tower Corp. — Class A | |
| Welltower, Inc. | |
| Prologis, Inc. | |
| Digital Realty Trust, Inc. | |
| Realty Income Corp. | |
| Simon Property Group, Inc. | |
| Equinix, Inc. | |
| Public Storage | |
| Crown Castle, Inc. | |
| CBRE Group, Inc. — Class A | |
| Top 10 Total |
2 | "10 Largest Holdings (as a % of Net Assets)" excludes any temporary cash investments. |
There were no changes in or disagreements with fund accountants for the period.
| Class | Costs of a $10,000 Investment | Costs Paid as a % of a $10,000 Investment |
|---|---|---|
| Variable Annuity | $91 | 1.80%2 |
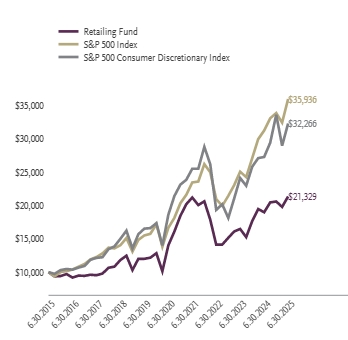
For the period of January 1, 2025 to June 30, 2025, the fund returned 3.65%, underperforming the fund's broad-based securities market index, the S&P 500 Index, which returned 6.20% for the same period and outperforming the fund's secondary index, the S&P 500 Consumer Discretionary Index, which returned -3.87% for the same period.
What factors materially affected the fund's performance over the last six months?
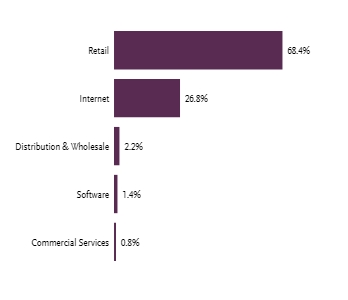
The industries that contributed the most to performance were automotive retail, broadline retail, and consumer staples merchandise retail. Those that detracted the most were apparel retail, home improvement retail, and computer & electronics retail. The holdings that contributed the most to performance were Carvana Co., MercadoLibre, Inc., and Alibaba Group Holding Ltd. ADR. Those that detracted the most were Target Corp., Global-e Online Ltd., and Abercrombie & Fitch Co.—Class A.
| 6 Month‡ | One Year | Five Years | Ten Years | |
|---|---|---|---|---|
| Retailing Fund | 3.65% | 12.44% | 8.76% | 7.87% |
| S&P 500 Index | 6.20% | 15.16% | 16.64% | 13.65% |
| S&P 500 Consumer Discretionary Index | -3.87% | 18.40% | 11.65% | 12.43% |
| Net Assets | $2,242,079 |
| Total Number of Portfolio Holdings | |
| Portfolio Turnover Rate | 142% |
| Top 10 | % of Net Assets |
|---|---|
| Amazon.com, Inc. | |
| Walmart, Inc. | |
| Costco Wholesale Corp. | |
| TJX Companies, Inc. | |
| Home Depot, Inc. | |
| Lowe's Companies, Inc. | |
| O'Reilly Automotive, Inc. | |
| Carvana Co. | |
| Coupang, Inc. | |
| PDD Holdings, Inc.ADR | |
| Top 10 Total |
1 | "Holdings Diversification (Market Exposure as a % of Net Assets)" excludes any temporary cash investments, investments in Guggenheim Strategy Funds Trust mutual funds, or investments in Guggenheim Ultra Short Duration Fund. |
2 | "10 Largest Holdings (as a % of Net Assets)" excludes any temporary cash investments. |
| Top 10 | % of Net Assets |
|---|---|
| Amazon.com, Inc. | |
| Walmart, Inc. | |
| Costco Wholesale Corp. | |
| TJX Companies, Inc. | |
| Home Depot, Inc. | |
| Lowe's Companies, Inc. | |
| O'Reilly Automotive, Inc. | |
| Carvana Co. | |
| Coupang, Inc. | |
| PDD Holdings, Inc.ADR | |
| Top 10 Total |
2 | "10 Largest Holdings (as a % of Net Assets)" excludes any temporary cash investments. |
There were no changes in or disagreements with fund accountants for the period.
| Class | Costs of a $10,000 Investment | Costs Paid as a % of a $10,000 Investment |
|---|---|---|
| Variable Annuity | $94 | 1.80%2 |
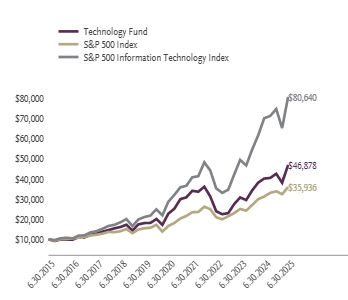
For the period of January 1, 2025 to June 30, 2025, the fund returned 10.26%, outperforming the fund's broad-based securities market index, the S&P 500 Index, which returned 6.20% for the same period and outperforming the fund's secondary index, the S&P 500 Information Technology Index, which returned 8.05% for the same period.
What factors materially affected the fund's performance over the last six months?
The industries that contributed the most to performance were systems software, semiconductors, and application software. Those that detracted the most were technology hardware storage & peripherals, and electronic equipment & instruments. The holdings that contributed the most to performance were Palantir Technologies, Inc.—Class A, Microsoft Corp., and NVIDIA Corp. Those that detracted the most were Apple, Inc., Alphabet, Inc.—Class A, and Marvell Technology, Inc.
| 6 Month‡ | One Year | Five Years | Ten Years | |
|---|---|---|---|---|
| Technology Fund | 10.26% | 16.76% | 15.58% | 16.71% |
| S&P 500 Index | 6.20% | 15.16% | 16.64% | 13.65% |
| S&P 500 Information Technology Index | 8.05% | 15.10% | 23.02% | 23.21% |
| Net Assets | $29,999,078 |
| Total Number of Portfolio Holdings | |
| Portfolio Turnover Rate | 140% |
| Top 10 | % of Net Assets |
|---|---|
| NVIDIA Corp. | |
| Microsoft Corp. | |
| Apple, Inc. | |
| Alphabet, Inc. — Class A | |
| Meta Platforms, Inc. — Class A | |
| Broadcom, Inc. | |
| Oracle Corp. | |
| International Business Machines Corp. | |
| Advanced Micro Devices, Inc. | |
| Cisco Systems, Inc. | |
| Top 10 Total |
1 | "Holdings Diversification (Market Exposure as a % of Net Assets)" excludes any temporary cash investments, investments in Guggenheim Strategy Funds Trust mutual funds, or investments in Guggenheim Ultra Short Duration Fund. |
2 | "10 Largest Holdings (as a % of Net Assets)" excludes any temporary cash investments. |
| Top 10 | % of Net Assets |
|---|---|
| NVIDIA Corp. | |
| Microsoft Corp. | |
| Apple, Inc. | |
| Alphabet, Inc. — Class A | |
| Meta Platforms, Inc. — Class A | |
| Broadcom, Inc. | |
| Oracle Corp. | |
| International Business Machines Corp. | |
| Advanced Micro Devices, Inc. | |
| Cisco Systems, Inc. | |
| Top 10 Total |
2 | "10 Largest Holdings (as a % of Net Assets)" excludes any temporary cash investments. |
There were no changes in or disagreements with fund accountants for the period.
| Class | Costs of a $10,000 Investment | Costs Paid as a % of a $10,000 Investment |
|---|---|---|
| Variable Annuity | $94 | 1.80%2 |
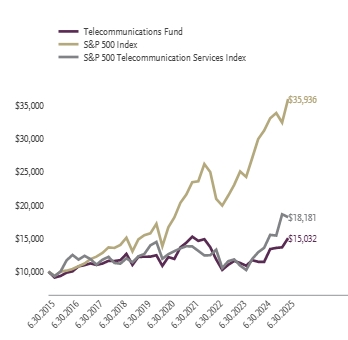
For the period of January 1, 2025 to June 30, 2025, the fund returned 10.77%, outperforming the fund's broad-based securities market index, the S&P 500 Index, which returned 6.20% for the same period and underperforming the fund's secondary index, the S&P 500 Telecommunication Services Index, which returned 17.87% for the same period.
What factors materially affected the fund's performance over the last six months?
The industries that contributed the most to performance were communications equipment, integrated telecommunication services, and wireless telecommunication services. No industries detracted from performance. The holdings that contributed the most to performance were AT&T, Inc., Liberty Broadband Corp.—Class C, and AST SpaceMobile, Inc. Those that detracted the most were Liberty Global Ltd.—Class A, Lumen Technologies, Inc., and Motorola Solutions, Inc.
| 6 Month‡ | One Year | Five Years | Ten Years | |
|---|---|---|---|---|
| Telecommunications Fund | 10.77% | 31.02% | 4.28% | 4.16% |
| S&P 500 Index | 6.20% | 15.16% | 16.64% | 13.65% |
| S&P 500 Telecommunication Services Index | 17.87% | 33.88% | 7.58% | 6.16% |
| Net Assets | $5,434,626 |
| Total Number of Portfolio Holdings | |
| Portfolio Turnover Rate | 489% |
| Top 10 | % of Net Assets |
|---|---|
| Cisco Systems, Inc. | |
| AT&T, Inc. | |
| Verizon Communications, Inc. | |
| Comcast Corp. — Class A | |
| T-Mobile US, Inc. | |
| Arista Networks, Inc. | |
| Charter Communications, Inc. — Class A | |
| Motorola Solutions, Inc. | |
| Roku, Inc. | |
| Juniper Networks, Inc. | |
| Top 10 Total |
1 | "Holdings Diversification (Market Exposure as a % of Net Assets)" excludes any temporary cash investments, investments in Guggenheim Strategy Funds Trust mutual funds, or investments in Guggenheim Ultra Short Duration Fund. |
2 | "10 Largest Holdings (as a % of Net Assets)" excludes any temporary cash investments. |
| Top 10 | % of Net Assets |
|---|---|
| Cisco Systems, Inc. | |
| AT&T, Inc. | |
| Verizon Communications, Inc. | |
| Comcast Corp. — Class A | |
| T-Mobile US, Inc. | |
| Arista Networks, Inc. | |
| Charter Communications, Inc. — Class A | |
| Motorola Solutions, Inc. | |
| Roku, Inc. | |
| Juniper Networks, Inc. | |
| Top 10 Total |
2 | "10 Largest Holdings (as a % of Net Assets)" excludes any temporary cash investments. |
There were no changes in or disagreements with fund accountants for the period.
| Class | Costs of a $10,000 Investment | Costs Paid as a % of a $10,000 Investment |
|---|---|---|
| Variable Annuity | $88 | 1.80%2 |
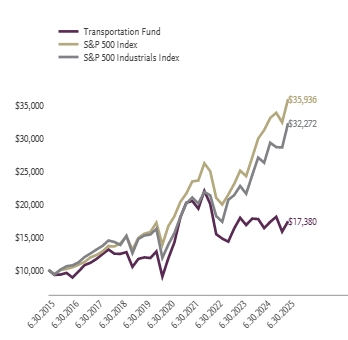
For the period of January 1, 2025 to June 30, 2025, the fund returned -3.77%, underperforming the fund's broad-based securities market index, the S&P 500 Index, which returned 6.20% for the same period and underperforming the fund's secondary index, the S&P 500 Industrials Index, which returned 12.72% for the same period.
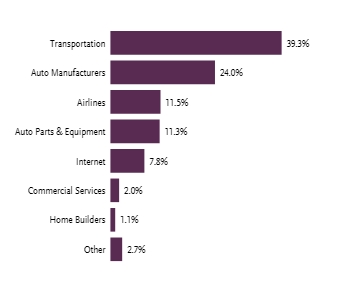
What factors materially affected the fund's performance over the last six months?
The industries that contributed the most to performance were passenger ground transportation, rail transportation, and automotive parts & equipment. Those that detracted the most were automobile manufacturers, air freight & logistics, and cargo transportation. The holdings that contributed the most to performance were Uber Technologies, Inc., Avis Budget Group, Inc, and Ryanair Holdings plc ADR. Those that detracted the most were Tesla, Inc, United Parcel Service, Inc. — Class B, and FedEx Corp.
| 6 Month‡ | One Year | Five Years | Ten Years | |
|---|---|---|---|---|
| Transportation Fund | -3.77% | 6.29% | 8.14% | 5.68% |
| S&P 500 Index | 6.20% | 15.16% | 16.64% | 13.65% |
| S&P 500 Industrials Index | 12.72% | 22.89% | 18.43% | 12.43% |
| Net Assets | $3,357,350 |
| Total Number of Portfolio Holdings | |
| Portfolio Turnover Rate | 23% |
| Top 10 | % of Net Assets |
|---|---|
| Tesla, Inc. | |
| Uber Technologies, Inc. | |
| Union Pacific Corp. | |
| United Parcel Service, Inc. — Class B | |
| CSX Corp. | |
| Norfolk Southern Corp. | |
| FedEx Corp. | |
| General Motors Co. | |
| Ford Motor Co. | |
| Delta Air Lines, Inc. | |
| Top 10 Total |
1 | "Holdings Diversification (Market Exposure as a % of Net Assets)" excludes any temporary cash investments, investments in Guggenheim Strategy Funds Trust mutual funds, or investments in Guggenheim Ultra Short Duration Fund. |
2 | "10 Largest Holdings (as a % of Net Assets)" excludes any temporary cash investments. |
| Top 10 | % of Net Assets |
|---|---|
| Tesla, Inc. | |
| Uber Technologies, Inc. | |
| Union Pacific Corp. | |
| United Parcel Service, Inc. — Class B | |
| CSX Corp. | |
| Norfolk Southern Corp. | |
| FedEx Corp. | |
| General Motors Co. | |
| Ford Motor Co. | |
| Delta Air Lines, Inc. | |
| Top 10 Total |
2 | "10 Largest Holdings (as a % of Net Assets)" excludes any temporary cash investments. |
There were no changes in or disagreements with fund accountants for the period.
| Class | Costs of a $10,000 Investment | Costs Paid as a % of a $10,000 Investment |
|---|---|---|
| Variable Annuity | $94 | 1.80%2 |
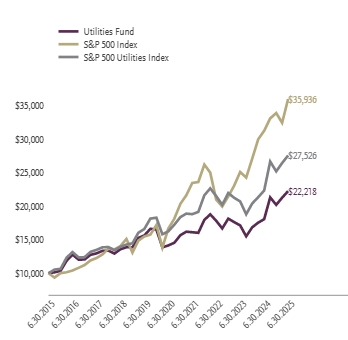
For the period of January 1, 2025 to June 30, 2025, the fund returned 10.09%, outperforming the fund's broad-based securities market index, the S&P 500 Index, which returned 6.20% for the same period and outperforming the fund's secondary index, the S&P 500 Utilities Index, which returned 9.41% for the same period.
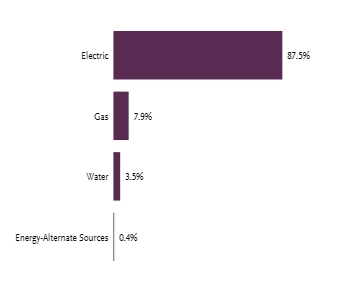
What factors materially affected the fund's performance over the last six months?
The industries that contributed the most to performance were electric utilities, multi utilities, and independent power producers & energy traders. No industries detracted from performance. The holdings that contributed the most to performance were Constellation Energy Corp., NRG Energy, Inc., and Vistra Corp. Those that detracted the most were PG&E Corp., Edison International, and Sempra.
| 6 Month‡ | One Year | Five Years | Ten Years | |
|---|---|---|---|---|
| Utilities Fund | 10.09% | 23.16% | 9.46% | 8.31% |
| S&P 500 Index | 6.20% | 15.16% | 16.64% | 13.65% |
| S&P 500 Utilities Index | 9.41% | 23.40% | 11.14% | 10.66% |
| Net Assets | $11,199,910 |
| Total Number of Portfolio Holdings | |
| Portfolio Turnover Rate | 192% |
| Top 10 | % of Net Assets |
|---|---|
| NextEra Energy, Inc. | |
| Constellation Energy Corp. | |
| Southern Co. | |
| Duke Energy Corp. | |
| Vistra Corp. | |
| American Electric Power Company, Inc. | |
| Sempra | |
| Dominion Energy, Inc. | |
| Public Service Enterprise Group, Inc. | |
| Exelon Corp. | |
| Top 10 Total |
1 | "Holdings Diversification (Market Exposure as a % of Net Assets)" excludes any temporary cash investments, investments in Guggenheim Strategy Funds Trust mutual funds, or investments in Guggenheim Ultra Short Duration Fund. |
2 | "10 Largest Holdings (as a % of Net Assets)" excludes any temporary cash investments. |
| Top 10 | % of Net Assets |
|---|---|
| NextEra Energy, Inc. | |
| Constellation Energy Corp. | |
| Southern Co. | |
| Duke Energy Corp. | |
| Vistra Corp. | |
| American Electric Power Company, Inc. | |
| Sempra | |
| Dominion Energy, Inc. | |
| Public Service Enterprise Group, Inc. | |
| Exelon Corp. | |
| Top 10 Total |
2 | "10 Largest Holdings (as a % of Net Assets)" excludes any temporary cash investments. |
There were no changes in or disagreements with fund accountants for the period.
| Class | Costs of a $10,000 Investment | Costs Paid as a % of a $10,000 Investment |
|---|---|---|
| Variable Annuity | $94 | 1.87%2 |
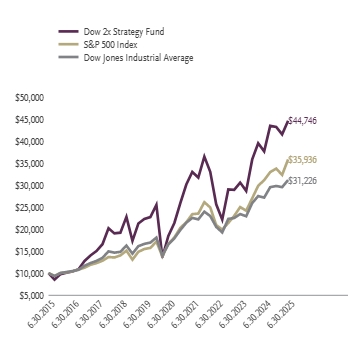
For the period of January 1, 2025 to June 30, 2025, the fund returned 3.18%, underperforming the fund's broad-based securities market index, the S&P 500 Index, which returned 6.20% for the same period and underperforming the fund's secondary index, the Dow Jones Industrial Average, which returned 4.55% for the same period.
What factors materially affected the fund's performance over the last six months?
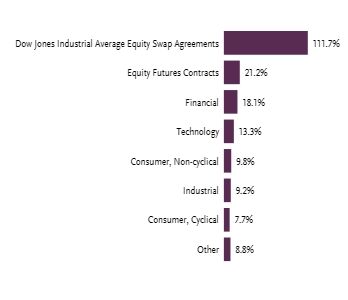
The sectors that contributed the most to the return of the underlying index were financials, industrials, and information technology. Those that detracted the most were health care, consumer discretionary, and energy. The holdings that contributed the most to return of the underlying index were Goldman Sachs Group, Inc., Microsoft Corp., and International Business Machines Corp. Those that detracted the most were UnitedHealth Group., Inc., Salesforce, Inc., and Apple, Inc. The fund maintained a daily correlation of over 99% to its benchmark of 200% of the daily price movement of the Dow Jones Industrial Average.
| 6 Month‡ | One Year | Five Years | Ten Years | |
|---|---|---|---|---|
| Dow 2x Strategy Fund | 3.18% | 18.43% | 19.35% | 16.16% |
| S&P 500 Index | 6.20% | 15.16% | 16.64% | 13.65% |
| Dow Jones Industrial Average | 4.55% | 14.72% | 13.52% | 12.06% |
| Net Assets | $8,356,478 |
| Total Number of Portfolio Holdings | |
| Portfolio Turnover Rate | 600% |
| Top 10 | % of Net Assets |
|---|---|
| Goldman Sachs Group, Inc. | |
| Microsoft Corp. | |
| Caterpillar, Inc. | |
| Home Depot, Inc. | |
| Visa, Inc. — Class A | |
| Sherwin-Williams Co. | |
| American Express Co. | |
| UnitedHealth Group, Inc. | |
| International Business Machines Corp. | |
| McDonald's Corp. | |
| Top 10 Total |
1 | "Holdings Diversification (Market Exposure as a % of Net Assets)" excludes any temporary cash investments, investments in Guggenheim Strategy Funds Trust mutual funds, or investments in Guggenheim Ultra Short Duration Fund. |
2 | "10 Largest Holdings (as a % of Net Assets)" excludes any temporary cash or derivative investments. |
| Top 10 | % of Net Assets |
|---|---|
| Goldman Sachs Group, Inc. | |
| Microsoft Corp. | |
| Caterpillar, Inc. | |
| Home Depot, Inc. | |
| Visa, Inc. — Class A | |
| Sherwin-Williams Co. | |
| American Express Co. | |
| UnitedHealth Group, Inc. | |
| International Business Machines Corp. | |
| McDonald's Corp. | |
| Top 10 Total |
2 | "10 Largest Holdings (as a % of Net Assets)" excludes any temporary cash or derivative investments. |
There were no changes in or disagreements with fund accountants for the period.
| Class | Costs of a $10,000 Investment | Costs Paid as a % of a $10,000 Investment |
|---|---|---|
| Variable Annuity | $88 | 1.84%2 |
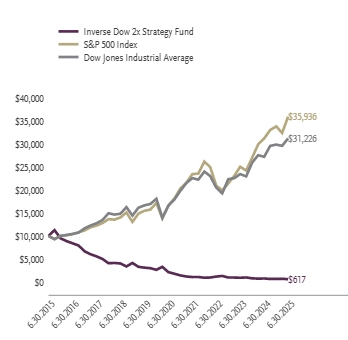
For the period of January 1, 2025 to June 30, 2025, the fund returned -7.98%, underperforming the fund's broad-based securities market index, the S&P 500 Index, which returned 6.20% for the same period and underperforming the fund's secondary index, the Dow Jones Industrial Average, which returned 4.55% for the same period.
What factors materially affected the fund's performance over the last six months?
The sectors that contributed the most to the return of the underlying index were financials, industrials, and information technology. Those that detracted the most were health care, consumer discretionary, and energy. The holdings that contributed the most to return of the underlying index were Goldman Sachs Group, Inc., Microsoft Corp., and International Business Machines Corp. Those that detracted the most were UnitedHealth Group, Inc., Salesforce, Inc., and Apple, Inc. The fund maintained a daily correlation of over 99% to its benchmark of -200% of the daily price movement of the Dow Jones Industrial Average.
| 6 Month‡ | One Year | Five Years | Ten Years | |
|---|---|---|---|---|
| Inverse Dow 2x Strategy Fund | -7.98% | -19.73% | -22.11% | -24.32% |
| S&P 500 Index | 6.20% | 15.16% | 16.64% | 13.65% |
| Dow Jones Industrial Average | 4.55% | 14.72% | 13.52% | 12.06% |
| Net Assets | $780,387 |
| Total Number of Portfolio Holdings | |
| Portfolio Turnover Rate | 0% |

1 | "Holdings Diversification (Market Exposure as a % of Net Assets)" excludes any temporary cash investments, investments in Guggenheim Strategy Funds Trust mutual funds, or investments in Guggenheim Ultra Short Duration Fund. |
There were no changes in or disagreements with fund accountants for the period.
| Class | Costs of a $10,000 Investment | Costs Paid as a % of a $10,000 Investment |
|---|---|---|
| Variable Annuity | $87 | 1.79%2 |
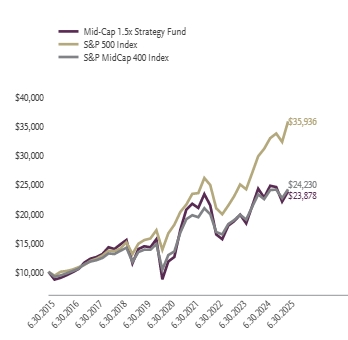
For the period of January 1, 2025 to June 30, 2025, the fund returned -2.99%, underperforming the fund's broad-based securities market index, the S&P 500 Index, which returned 6.20% for the same period and underperforming the fund's secondary index, the S&P MidCap 400 Index, which returned 0.20% for the same period.
What factors materially affected the fund's performance over the last six months?
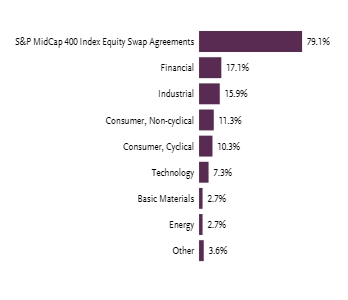
The sectors that contributed the most to the return of the underlying index were industrials, consumer staples, and financials. The sectors that detracted the most were health care, consumer discretionary, and information technology. The holdings that contributed the most to the return of the underlying index were Curtiss-Wright Corp, Carpenter Technology Corp, and ATI, Inc. Those that detracted the most were Sarepta Therapeutics, Inc., Illumina, Inc., and Avantor, Inc. The fund maintained a correlation of over 99% to its benchmark of 150% of the daily price movement of the S&P MidCap 400 Index.
| 6 Month‡ | One Year | Five Years | Ten Years | |
|---|---|---|---|---|
| Mid-Cap 1.5x Strategy Fund | -2.99% | 4.83% | 15.15% | 9.09% |
| S&P 500 Index | 6.20% | 15.16% | 16.64% | 13.65% |
| S&P MidCap 400 Index | 0.20% | 7.53% | 13.44% | 9.25% |
| Net Assets | $3,403,459 |
| Total Number of Portfolio Holdings | |
| Portfolio Turnover Rate | 12% |
| Top 10 | % of Net Assets |
|---|---|
| Guggenheim Ultra Short Duration Fund — Institutional Class | |
| Guggenheim Strategy Fund II | |
| Interactive Brokers Group, Inc. — Class A | |
| EMCOR Group, Inc. | |
| Guidewire Software, Inc. | |
| RB Global, Inc. | |
| Flex Ltd. | |
| Casey's General Stores, Inc. | |
| Comfort Systems USA, Inc. | |
| Curtiss-Wright Corp. | |
| Top 10 Total |
1 | "Holdings Diversification (Market Exposure as a % of Net Assets)" excludes any temporary cash investments, investments in Guggenheim Strategy Funds Trust mutual funds, or investments in Guggenheim Ultra Short Duration Fund. |
2 | "10 Largest Holdings (as a % of Net Assets)" excludes any temporary cash or derivative investments. |
| Top 10 | % of Net Assets |
|---|---|
| Guggenheim Ultra Short Duration Fund — Institutional Class | |
| Guggenheim Strategy Fund II | |
| Interactive Brokers Group, Inc. — Class A | |
| EMCOR Group, Inc. | |
| Guidewire Software, Inc. | |
| RB Global, Inc. | |
| Flex Ltd. | |
| Casey's General Stores, Inc. | |
| Comfort Systems USA, Inc. | |
| Curtiss-Wright Corp. | |
| Top 10 Total |
2 | "10 Largest Holdings (as a % of Net Assets)" excludes any temporary cash or derivative investments. |
There were no changes in or disagreements with fund accountants for the period.
| Class | Costs of a $10,000 Investment | Costs Paid as a % of a $10,000 Investment |
|---|---|---|
| Variable Annuity | $91 | 1.84%2 |
For the period of January 1, 2025 to June 30, 2025, the fund returned 0.17%, underperforming the fund's broad-based securities market index, the S&P 500 Index, which returned 6.20% for the same period and underperforming the fund's secondary index, the S&P MidCap 400 Index, which returned 0.20% for the same period.
What factors materially affected the fund's performance over the last six months?
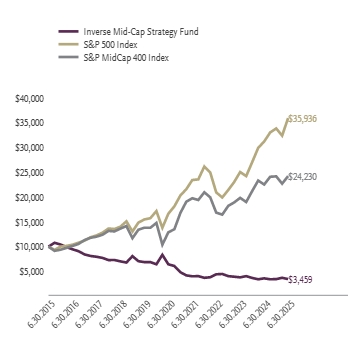
The sectors that contributed the most to the return of the underlying index were industrials, consumer staples, and financials. The sectors that detracted the most were health care, consumer discretionary, and information technology. The holdings that contributed the most to the return of the underlying index were Curtiss-Wright Corp, Carpenter Technology Corp, and ATI, Inc. Those that detracted the most were Sarepta Therapeutics, Inc., Illumina, Inc., and Avantor, Inc. The fund maintained a daily correlation of 99% to its benchmark of -100% of the daily price movement of the S&P MidCap 400 Index.
| 6 Month‡ | One Year | Five Years | Ten Years | |
|---|---|---|---|---|
| Inverse Mid-Cap Strategy Fund | 0.17% | -4.09% | -11.69% | -10.07% |
| S&P 500 Index | 6.20% | 15.16% | 16.64% | 13.65% |
| S&P MidCap 400 Index | 0.20% | 7.53% | 13.44% | 9.25% |
| Net Assets | $135,660 |
| Total Number of Portfolio Holdings | |
| Portfolio Turnover Rate | 0% |

| Top 10 | % of Net Assets |
|---|---|
| Guggenheim Ultra Short Duration Fund — Institutional Class | |
| Guggenheim Strategy Fund II | |
| Total |
1 | "Holdings Diversification (Market Exposure as a % of Net Assets)" excludes any temporary cash investments, investments in Guggenheim Strategy Funds Trust mutual funds, or investments in Guggenheim Ultra Short Duration Fund. |
2 | "Largest Holdings (as a % of Net Assets)" excludes any temporary cash or derivative investments. |
| Top 10 | % of Net Assets |
|---|---|
| Guggenheim Ultra Short Duration Fund — Institutional Class | |
| Guggenheim Strategy Fund II | |
| Total |
2 | "Largest Holdings (as a % of Net Assets)" excludes any temporary cash or derivative investments. |
There were no changes in or disagreements with fund accountants for the period.
| Class | Costs of a $10,000 Investment | Costs Paid as a % of a $10,000 Investment |
|---|---|---|
| Variable Annuity | $88 | 1.72%2 |
For the period of January 1, 2025 to June 30, 2025, the fund returned 7.51%, outperforming the fund's broad-based securities market index, the S&P 500 Index, which returned 6.20% for the same period and underperforming the fund's secondary index, the NASDAQ-100 Index, which returned 8.35% for the same period.
What factors materially affected the fund's performance over the last six months?
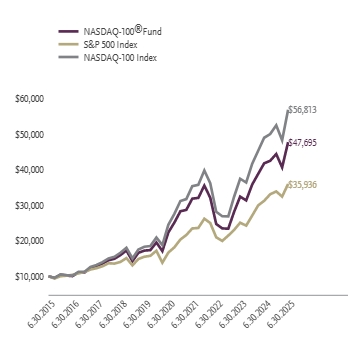
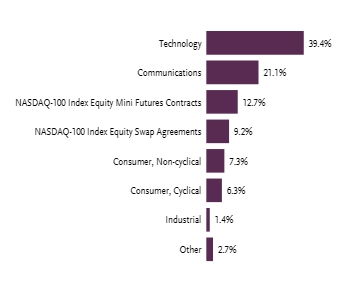
The sectors that contributed the most to the return of the underlying index were information technology, communication services, and utilities. Those that detracted the most were consumer discretionary, energy, and financials. The holdings that contributed the most to the return of the underlying index were Microsoft Corp., NVIDIA Corp., and Netflix, Inc. Those that detracted the most were Apple, Inc., Tesla, Inc. and PepsiCo, Inc. The fund maintained a daily correlation of over 99% to its benchmark of 100% of the daily price movement of the NASDAQ-100 Index.
| 6 Month‡ | One Year | Five Years | Ten Years | |
|---|---|---|---|---|
| NASDAQ-100® Fund | 7.51% | 14.27% | 16.42% | 16.91% |
| S&P 500 Index | 6.20% | 15.16% | 16.64% | 13.65% |
| NASDAQ-100 Index | 8.35% | 16.10% | 18.36% | 18.97% |
| Net Assets | $129,330,613 |
| Total Number of Portfolio Holdings | |
| Portfolio Turnover Rate | 73% |
| Top 10 | % of Net Assets |
|---|---|
| NVIDIA Corp. | |
| Guggenheim Ultra Short Duration Fund — Institutional Class | |
| Microsoft Corp. | |
| Guggenheim Strategy Fund II | |
| Apple, Inc. | |
| Amazon.com, Inc. | |
| Broadcom, Inc. | |
| Meta Platforms, Inc. — Class A | |
| Netflix, Inc. | |
| Tesla, Inc. | |
| Top 10 Total |
1 | "Holdings Diversification (Market Exposure as a % of Net Assets)" excludes any temporary cash investments, investments in Guggenheim Strategy Funds Trust mutual funds, or investments in Guggenheim Ultra Short Duration Fund. |
2 | "10 Largest Holdings (as a % of Net Assets)" excludes any temporary cash or derivative investments. |
| Top 10 | % of Net Assets |
|---|---|
| NVIDIA Corp. | |
| Guggenheim Ultra Short Duration Fund — Institutional Class | |
| Microsoft Corp. | |
| Guggenheim Strategy Fund II | |
| Apple, Inc. | |
| Amazon.com, Inc. | |
| Broadcom, Inc. | |
| Meta Platforms, Inc. — Class A | |
| Netflix, Inc. | |
| Tesla, Inc. | |
| Top 10 Total |
2 | "10 Largest Holdings (as a % of Net Assets)" excludes any temporary cash or derivative investments. |
There were no changes in or disagreements with fund accountants for the period.
| Class | Costs of a $10,000 Investment | Costs Paid as a % of a $10,000 Investment |
|---|---|---|
| Variable Annuity | $98 | 1.90%2 |
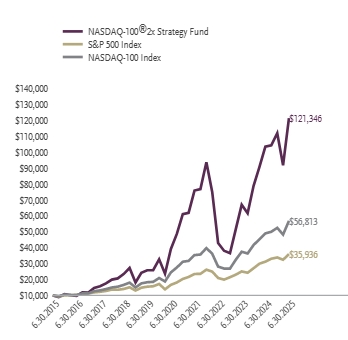
For the period of January 1, 2025 to June 30, 2025, the fund returned 8.50%, outperforming the fund's broad-based securities market index, the S&P 500 Index, which returned 6.20% for the same period and outperforming the fund's secondary index, the NASDAQ-100 Index, which returned 8.35% for the same period.
What factors materially affected the fund's performance over the last six months?
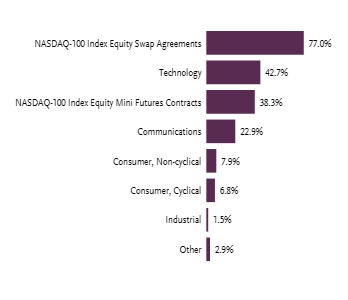
The sectors that contributed the most to the return of the underlying index were information technology, communication services, and utilities. Those that detracted the most were consumer discretionary, energy, and financials. The holdings that contributed the most to the return of the underlying index were Microsoft Corp., NVIDIA Corp., and Netflix, Inc. Those that detracted the most were Apple, Inc., Tesla, Inc. and PepsiCo, Inc. The fund maintained a daily correlation of over 99% to its benchmark of 200% of the daily price movement of the NASDAQ-100 Index.
| 6 Month‡ | One Year | Five Years | Ten Years | |
|---|---|---|---|---|
| NASDAQ-100® 2x Strategy Fund | 8.50% | 17.31% | 25.38% | 28.35% |
| S&P 500 Index | 6.20% | 15.16% | 16.64% | 13.65% |
| NASDAQ-100 Index | 8.35% | 16.10% | 18.36% | 18.97% |
| Net Assets | $142,037,041 |
| Total Number of Portfolio Holdings | |
| Portfolio Turnover Rate | 370% |
| Top 10 | % of Net Assets |
|---|---|
| NVIDIA Corp. | |
| Microsoft Corp. | |
| Apple, Inc. | |
| Amazon.com, Inc. | |
| Broadcom, Inc. | |
| Meta Platforms, Inc. — Class A | |
| Netflix, Inc. | |
| Tesla, Inc. | |
| Costco Wholesale Corp. | |
| Alphabet, Inc. — Class A | |
| Top 10 Total |
1 | "Holdings Diversification (Market Exposure as a % of Net Assets)" excludes any temporary cash investments, investments in Guggenheim Strategy Funds Trust mutual funds, or in investments in Guggenheim Ultra Short Duration Fund. |
2 | "10 Largest Holdings (as a % of Net Assets)" excludes any temporary cash or derivative investments. |
| Top 10 | % of Net Assets |
|---|---|
| NVIDIA Corp. | |
| Microsoft Corp. | |
| Apple, Inc. | |
| Amazon.com, Inc. | |
| Broadcom, Inc. | |
| Meta Platforms, Inc. — Class A | |
| Netflix, Inc. | |
| Tesla, Inc. | |
| Costco Wholesale Corp. | |
| Alphabet, Inc. — Class A | |
| Top 10 Total |
2 | "10 Largest Holdings (as a % of Net Assets)" excludes any temporary cash or derivative investments. |
There were no changes in or disagreements with fund accountants for the period.
| Class | Costs of a $10,000 Investment | Costs Paid as a % of a $10,000 Investment |
|---|---|---|
| Variable Annuity | $86 | 1.82%2 |
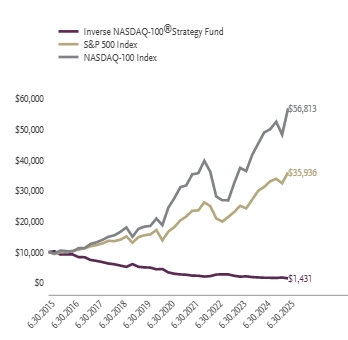
For the period of January 1, 2025 to June 30, 2025, the fund returned -8.85%, underperforming the fund's broad-based securities market index, the S&P 500 Index, which returned 6.20% for the same period and underperforming the fund's secondary index, the NASDAQ-100 Index, which returned 8.35% for the same period.
What factors materially affected the fund's performance over the last six months?
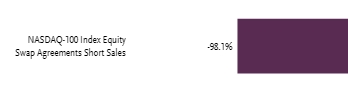
The sectors that contributed the most to the return of the underlying index were information technology, communication services, and utilities. Those that detracted the most were consumer discretionary, energy, and financials. The holdings that contributed the most to the return of the underlying index were Microsoft Corp., NVIDIA Corp., and Netflix, Inc. Those that detracted the most were Apple, Inc., Tesla, Inc. and PepsiCo, Inc. The fund maintained a daily correlation of over 99% to its benchmark of -100% of the daily price movement of the NASDAQ-100 Index.
| 6 Month‡ | One Year | Five Years | Ten Years | |
|---|---|---|---|---|
| Inverse NASDAQ-100® Strategy Fund | -8.85% | -12.95% | -15.81% | -17.67% |
| S&P 500 Index | 6.20% | 15.16% | 16.64% | 13.65% |
| NASDAQ-100 Index | 8.35% | 16.10% | 18.36% | 18.97% |
| Net Assets | $1,061,736 |
| Total Number of Portfolio Holdings | |
| Portfolio Turnover Rate | 0% |
| Top 10 | % of Net Assets |
|---|---|
| Guggenheim Ultra Short Duration Fund — Institutional Class | |
| Guggenheim Strategy Fund II | |
| Total |
1 | "Holdings Diversification (Market Exposure as a % of Net Assets)" excludes any temporary cash investments, investments in Guggenheim Strategy Funds Trust mutual funds, or investments in Guggenheim Ultra Short Duration Fund. |
2 | "Largest Holdings (as a % of Net Assets)" excludes any temporary cash or derivative investments. |
| Top 10 | % of Net Assets |
|---|---|
| Guggenheim Ultra Short Duration Fund — Institutional Class | |
| Guggenheim Strategy Fund II | |
| Total |
2 | "Largest Holdings (as a % of Net Assets)" excludes any temporary cash or derivative investments. |
There were no changes in or disagreements with fund accountants for the period.
| Class | Costs of a $10,000 Investment | Costs Paid as a % of a $10,000 Investment |
|---|---|---|
| Variable Annuity | $87 | 1.81%2 |
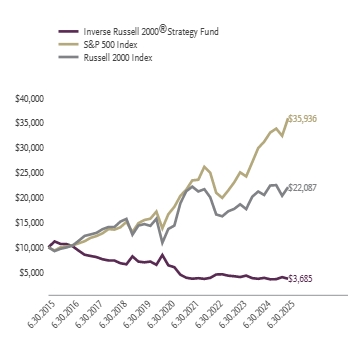
For the period of January 1, 2025 to June 30, 2025, the fund returned -5.94%, underperforming the fund's broad-based securities market index, the S&P 500 Index, which returned 6.20% for the same period and underperforming the fund's secondary index, the Russell 2000 Index, which returned -1.79% for the same period.
What factors materially affected the fund's performance over the last six months?
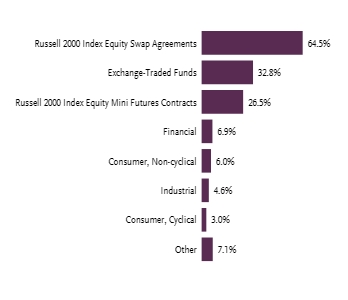
The sectors that contributed the most to the return of the underlying index were industrials, financials, and materials. The sectors that detracted the most were health care, energy, and consumer discretionary. The holdings that contributed the most to the return of the underlying index were Carpenter Technology Corp., Insmed, Inc., and Hims & Hers Health, Inc. Those that detracted the most were Vaxcyte, Inc., Abercrombie & Fitch Co.—Class A, and FTAI Aviation, Ltd. The fund maintained a daily correlation of over 99% to its benchmark of 150% of the daily price movement of the Russell 2000 Index.
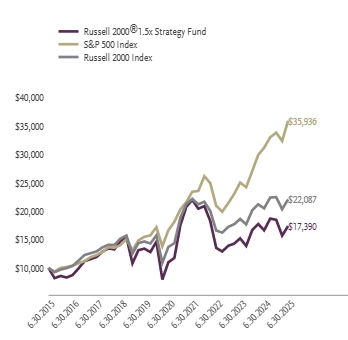
| 6 Month‡ | One Year | Five Years | Ten Years | |
|---|---|---|---|---|
| Russell 2000® 1.5x Strategy Fund | -5.94% | 4.51% | 9.61% | 5.69% |
| S&P 500 Index | 6.20% | 15.16% | 16.64% | 13.65% |
| Russell 2000 Index | -1.79% | 7.68% | 10.04% | 8.25% |
| Net Assets | $2,484,166 |
| Total Number of Portfolio Holdings | |
| Portfolio Turnover Rate | 4% |
| Top 10 | % of Net Assets |
|---|---|
| Vanguard Russell 2000 ETF | |
| iShares Russell 2000 Index ETF | |
| Guggenheim Ultra Short Duration Fund — Institutional Class | |
| Guggenheim Strategy Fund II | |
| Credo Technology Group Holding Ltd. | |
| Fabrinet | |
| IonQ, Inc. | |
| Hims & Hers Health, Inc. | |
| HealthEquity, Inc. | |
| Ensign Group, Inc. | |
| Top 10 Total |
1 | "Holdings Diversification (Market Exposure as a % of Net Assets)" excludes any temporary cash investments, investments in Guggenheim Strategy Funds Trust mutual funds, or investments in Guggenheim Ultra Short Duration Fund. |
2 | "10 Largest Holdings (as a % of Net Assets)" excludes any temporary cash or derivative investments. |
| Top 10 | % of Net Assets |
|---|---|
| Vanguard Russell 2000 ETF | |
| iShares Russell 2000 Index ETF | |
| Guggenheim Ultra Short Duration Fund — Institutional Class | |
| Guggenheim Strategy Fund II | |
| Credo Technology Group Holding Ltd. | |
| Fabrinet | |
| IonQ, Inc. | |
| Hims & Hers Health, Inc. | |
| HealthEquity, Inc. | |
| Ensign Group, Inc. | |
| Top 10 Total |
2 | "10 Largest Holdings (as a % of Net Assets)" excludes any temporary cash or derivative investments. |
There were no changes in or disagreements with fund accountants for the period.
| Class | Costs of a $10,000 Investment | Costs Paid as a % of a $10,000 Investment |
|---|---|---|
| Variable Annuity | $87 | 1.85%2 |
For the period of January 1, 2025 to June 30, 2025, the fund returned -10.37%, underperforming the fund's broad-based securities market index, the S&P 500 Index, which returned 6.20% for the same period and underperforming the fund's secondary index, the Russell 2000 Index, which returned -1.79% for the same period.
What factors materially affected the fund's performance over the last six months?
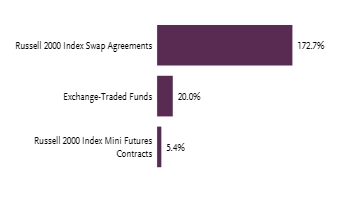
The sectors that contributed the most to the return of the underlying index were industrials, financials, and materials. The sectors that detracted the most were health care, energy, and consumer discretionary. The holdings that contributed the most to the return of the underlying index were Carpenter Technology Corp., Insmed, Inc., and Hims & Hers Health, Inc. Those that detracted the most were Vaxcyte, Inc., Abercrombie & Fitch Co.—Class A, and FTAI Aviation, Ltd. The fund maintained a daily correlation of over 99% to its benchmark of 200% of the daily price movement of the Russell 2000 Index.
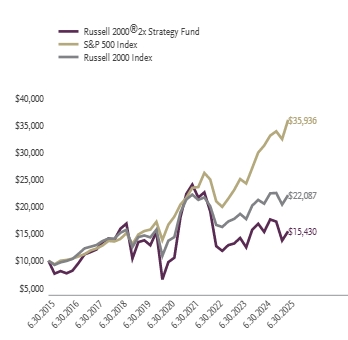
| 6 Month‡ | One Year | Five Years | Ten Years | |
|---|---|---|---|---|
| Russell 2000® 2x Strategy Fund | -10.37% | 0.71% | 9.62% | 4.43% |
| S&P 500 Index | 6.20% | 15.16% | 16.64% | 13.65% |
| Russell 2000 Index | -1.79% | 7.68% | 10.04% | 8.25% |
| Net Assets | $2,015,002 |
| Total Number of Portfolio Holdings | |
| Portfolio Turnover Rate | 0% |
| Top 10 | % of Net Assets |
|---|---|
| Vanguard Russell 2000 ETF | |
| iShares Russell 2000 Index ETF | |
| Total |
1 | "Holdings Diversification (Market Exposure as a % of Net Assets)" excludes any temporary cash investments, investments in Guggenheim Strategy Funds Trust mutual funds, or investments in Guggenheim Ultra Short Duration Fund. |
2 | "Largest Holdings (as a % of Net Assets)" excludes any temporary cash or derivative investments. |
| Top 10 | % of Net Assets |
|---|---|
| Vanguard Russell 2000 ETF | |
| iShares Russell 2000 Index ETF | |
| Total |
2 | "Largest Holdings (as a % of Net Assets)" excludes any temporary cash or derivative investments. |
There were no changes in or disagreements with fund accountants for the period.
| Class | Costs of a $10,000 Investment | Costs Paid as a % of a $10,000 Investment |
|---|---|---|
| Variable Annuity | $92 | 1.83%2 |
For the period of January 1, 2025 to June 30, 2025, the fund returned 2.34%, underperforming the fund's broad-based securities market index, the S&P 500 Index, which returned 6.20% for the same period and outperforming the fund's secondary index, the Russell 2000 Index, which returned -1.79% for the same period.
What factors materially affected the fund's performance over the last six months?
The sectors that contributed the most to the return of the underlying index were industrials, financials, and materials. The sectors that detracted the most were health care, energy, and consumer discretionary. The holdings that contributed the most to the return of the underlying index were Carpenter Technology Corp., Insmed, Inc. and Hims & Hers Health, Inc. Those that detracted the most were Vaxcyte, Inc., Abercrombie & Fitch Co.—Class A, and FTAI Aviation, Ltd. The fund maintained a daily correlation of over 99% to its benchmark of -100% of the daily price movement of the Russell 2000 Index.
| 6 Month‡ | One Year | Five Years | Ten Years | |
|---|---|---|---|---|
| Inverse Russell 2000® Strategy Fund | 2.34% | -4.66% | -10.40% | -9.50% |
| S&P 500 Index | 6.20% | 15.16% | 16.64% | 13.65% |
| Russell 2000 Index | -1.79% | 7.68% | 10.04% | 8.25% |
| Net Assets | $881,224 |
| Total Number of Portfolio Holdings | |
| Portfolio Turnover Rate | 0% |
| Top 10 | % of Net Assets |
|---|---|
| Guggenheim Ultra Short Duration Fund — Institutional Class | |
| Guggenheim Strategy Fund II | |
| Total |
1 | "Holdings Diversification (Market Exposure as a % of Net Assets)" excludes any temporary cash investments, investments in Guggenheim Strategy Funds Trust mutual funds, or investments in Guggenheim Ultra Short Duration Fund. |
2 | "Largest Holdings (as a % of Net Assets)" excludes any temporary cash or derivative investments. |
| Top 10 | % of Net Assets |
|---|---|
| Guggenheim Ultra Short Duration Fund — Institutional Class | |
| Guggenheim Strategy Fund II | |
| Total |
2 | "Largest Holdings (as a % of Net Assets)" excludes any temporary cash or derivative investments. |
There were no changes in or disagreements with fund accountants for the period.
| Class | Costs of a $10,000 Investment | Costs Paid as a % of a $10,000 Investment |
|---|---|---|
| Variable Annuity | $87 | 1.70%2 |
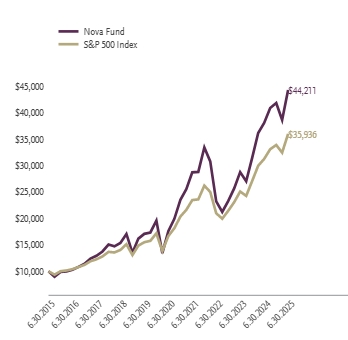
For the period of January 1, 2025 to June 30, 2025, the fund returned 5.89%, underperforming the fund's broad-based securities market index, the S&P 500 Index, which returned 6.20% for the same period.
What factors materially affected the fund's performance over the last six months?
The sectors that contributed the most to the return of the underlying index were information technology, financials, and industrials. Those that detracted the most were consumer discretionary, health care, and energy. The holdings that contributed the most to the return of the underlying index were Microsoft Corp., NVIDIA Corp., and Meta Platforms, Inc., Class A. Those that detracted the most were Apple, Inc, Tesla, Inc. and UnitedHealth Group, Inc. The fund maintained a daily correlation of over 99% to its benchmark of 150% of the daily price movement of the S&P 500 Index.
| 6 Month‡ | One Year | Five Years | Ten Years | |
|---|---|---|---|---|
| Nova Fund | 5.89% | 16.40% | 20.25% | 16.03% |
| S&P 500 Index | 6.20% | 15.16% | 16.64% | 13.65% |
| Net Assets | $37,060,913 |
| Total Number of Portfolio Holdings | |
| Portfolio Turnover Rate | 80% |
| Guggenheim Ultra Short Duration Fund — Institutional Class | |
| Guggenheim Strategy Fund II | |
| NVIDIA Corp. | |
| Microsoft Corp. | |
| Apple, Inc. | |
| Amazon.com, Inc. | |
| Meta Platforms, Inc. — Class A | |
| Broadcom, Inc. | |
| Alphabet, Inc. — Class A | |
| Berkshire Hathaway, Inc. — Class B | |
| Top 10 Total |
1 | "Holdings Diversification (Market Exposure as a % of Net Assets)" excludes any temporary cash investments, investments in Guggenheim Strategy Funds Trust mutual funds, or investments in Guggenheim Ultra Short Duration Fund. |
2 | "10 Largest Holdings (as a % of Net Assets)" excludes any temporary cash or derivative investments. |
| Guggenheim Ultra Short Duration Fund — Institutional Class | |
| Guggenheim Strategy Fund II | |
| NVIDIA Corp. | |
| Microsoft Corp. | |
| Apple, Inc. | |
| Amazon.com, Inc. | |
| Meta Platforms, Inc. — Class A | |
| Broadcom, Inc. | |
| Alphabet, Inc. — Class A | |
| Berkshire Hathaway, Inc. — Class B | |
| Top 10 Total |
2 | "10 Largest Holdings (as a % of Net Assets)" excludes any temporary cash or derivative investments. |
There were no changes in or disagreements with fund accountants for the period.
| Class | Costs of a $10,000 Investment | Costs Paid as a % of a $10,000 Investment |
|---|---|---|
| Variable Annuity | $99 | 1.93%2 |
For the period of January 1, 2025 to June 30, 2025, the fund returned 5.93%, underperforming the fund's broad-based securities market index, the S&P 500 Index, which returned 6.20% for the same period.
What factors materially affected the fund's performance over the last six months?
The sectors that contributed the most to the return of the underlying index were information technology, financials, and industrials. Those that detracted the most were consumer discretionary, health care, and energy. The holdings that contributed the most to the return of the underlying index were Microsoft Corp., NVIDIA Corp., and Meta Platforms, Inc.- Class A. Those that detracted the most were Apple, Inc, Tesla, Inc. and UnitedHealth Group, Inc. The fund maintained a daily correlation of over 99% to its benchmark of 200% of the daily price movement of the S&P 500 Index.
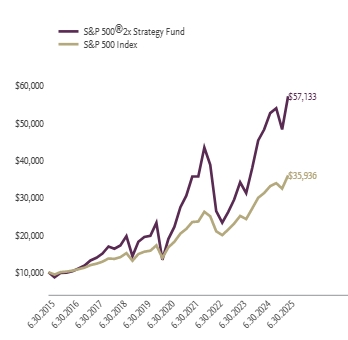
| 6 Month‡ | One Year | Five Years | Ten Years | |
|---|---|---|---|---|
| S&P 500® 2x Strategy Fund | 5.93% | 18.51% | 24.82% | 19.04% |
| S&P 500 Index | 6.20% | 15.16% | 16.64% | 13.65% |
| Net Assets | $97,647,562 |
| Total Number of Portfolio Holdings | |
| Portfolio Turnover Rate | 67% |
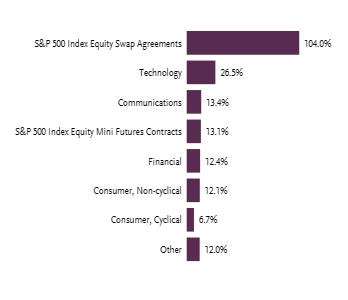
| Top 10 | % of Net Assets |
|---|---|
| NVIDIA Corp. | |
| Microsoft Corp. | |
| Apple, Inc. | |
| Amazon.com, Inc. | |
| Meta Platforms, Inc. — Class A | |
| Broadcom, Inc. | |
| Alphabet, Inc. — Class A | |
| Berkshire Hathaway, Inc. — Class B | |
| Tesla, Inc. | |
| Alphabet, Inc. — Class C | |
| Top 10 Total |
1 | "Holdings Diversification (Market Exposure as a % of Net Assets)" excludes any temporary cash investments, investments in Guggenheim Strategy Funds Trust mutual funds, or investments in Guggenheim Ultra Short Duration Fund. |
2 | "10 Largest Holdings (as a % of Net Assets)" excludes any temporary cash or derivative investments. |
| Top 10 | % of Net Assets |
|---|---|
| NVIDIA Corp. | |
| Microsoft Corp. | |
| Apple, Inc. | |
| Amazon.com, Inc. | |
| Meta Platforms, Inc. — Class A | |
| Broadcom, Inc. | |
| Alphabet, Inc. — Class A | |
| Berkshire Hathaway, Inc. — Class B | |
| Tesla, Inc. | |
| Alphabet, Inc. — Class C | |
| Top 10 Total |
2 | "10 Largest Holdings (as a % of Net Assets)" excludes any temporary cash or derivative investments. |
There were no changes in or disagreements with fund accountants for the period.
| Class | Costs of a $10,000 Investment | Costs Paid as a % of a $10,000 Investment |
|---|---|---|
| Variable Annuity | $87 | 1.80%2 |
For the period of January 1, 2025 to June 30, 2025, the fund returned -4.87%, underperforming the fund's broad-based securities market index, the S&P 500 Index, which returned 6.20% for the same period.
What factors materially affected the fund's performance over the last six months?
The sectors that contributed the most to the return of the underlying index were information technology, financials, and industrials. Those that detracted the most were consumer discretionary, health care, and energy. The holdings that contributed the most to the return of the underlying index were Microsoft Corp., NVIDIA Corp., and Meta Platforms, Inc.—Class A. Those that detracted the most were Apple, Inc, Tesla, Inc. and UnitedHealth Group, Inc. The fund maintained a daily correlation of over 99% to its benchmark of -100% of the daily price movement of the S&P 500 Index.
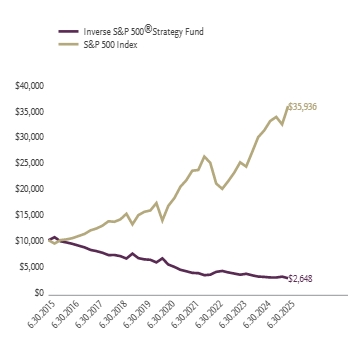
| 6 Month‡ | One Year | Five Years | Ten Years | |
|---|---|---|---|---|
| Inverse S&P 500® Strategy Fund | -4.87% | -8.66% | -12.94% | -12.44% |
| S&P 500 Index | 6.20% | 15.16% | 16.64% | 13.65% |
| Net Assets | $1,154,354 |
| Total Number of Portfolio Holdings | |
| Portfolio Turnover Rate | 0% |
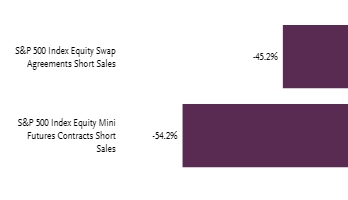
| Top 10 | % of Net Assets |
|---|---|
| Guggenheim Ultra Short Duration Fund — Institutional Class | |
| Guggenheim Strategy Fund II | |
| Total |
1 | "Holdings Diversification (Market Exposure as a % of Net Assets)" excludes any temporary cash investments, investments in Guggenheim Strategy Funds Trust mutual funds, or investments in Guggenheim Ultra Short Duration Fund. |
2 | "Largest Holdings (as a % of Net Assets)" excludes any temporary cash or derivative investments. |
| Top 10 | % of Net Assets |
|---|---|
| Guggenheim Ultra Short Duration Fund — Institutional Class | |
| Guggenheim Strategy Fund II | |
| Total |
2 | "Largest Holdings (as a % of Net Assets)" excludes any temporary cash or derivative investments. |
There were no changes in or disagreements with fund accountants for the period.
| Class | Costs of a $10,000 Investment | Costs Paid as a % of a $10,000 Investment |
|---|---|---|
| Variable Annuity | $89 | 1.70%2 |
For the period of January 1, 2025 to June 30, 2025, the fund returned 10.35%, outperforming the fund's broad-based securities market index, the S&P 500 Index, which returned 6.20% for the same period and underperforming the fund's secondary index, the S&P 500 Pure Growth Index, which returned 11.42% for the same period.
What factors materially affected the fund's performance over the last six months?
The sectors that contributed the most to the return of the underlying index for the reporting period were information technology, industrials, and utilities. The sectors that detracted were financials and energy. The holdings that contributed the most to the return of the underlying index for the reporting period were Palantir Technologies, Inc. — Class A, Howmet Aerospace, Inc. and NRG Energy, Inc. Those that detracted the most were Deckers Outdoor Corp., Norwegian Cruise Line Holdings Ltd., and United Airlines Holdings, Inc. The fund maintained a daily correlation of over 99% to the S&P 500 Pure Growth Index for the reporting period.
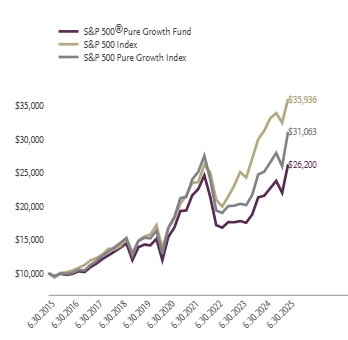
| 6 Month‡ | One Year | Five Years | Ten Years | |
|---|---|---|---|---|
| S&P 500® Pure Growth Fund | 10.35% | 21.68% | 11.20% | 10.11% |
| S&P 500 Index | 6.20% | 15.16% | 16.64% | 13.65% |
| S&P 500 Pure Growth Index | 11.42% | 23.89% | 13.11% | 12.01% |
| Net Assets | $34,163,549 |
| Total Number of Portfolio Holdings | |
| Portfolio Turnover Rate | 99% |
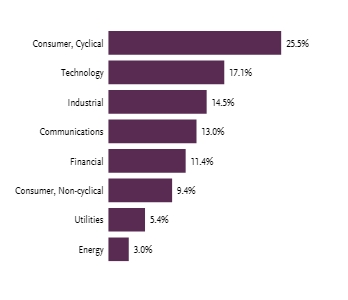
| Top 10 | % of Net Assets |
|---|---|
| Royal Caribbean Cruises Ltd. | |
| Vistra Corp. | |
| Palantir Technologies, Inc. — Class A | |
| Axon Enterprise, Inc. | |
| Carnival Corp. | |
| NVIDIA Corp. | |
| Howmet Aerospace, Inc. | |
| NRG Energy, Inc. | |
| TKO Group Holdings, Inc. | |
| Crowdstrike Holdings, Inc. — Class A | |
| Top 10 Total |
1 | "Holdings Diversification (Market Exposure as a % of Net Assets)" excludes any temporary cash investments, investments in Guggenheim Strategy Funds Trust mutual funds, or investments in Guggenheim Ultra Short Duration Fund. |
2 | "10 Largest Holdings (as a % of Net Assets)" excludes any temporary cash or derivative investments. |
| Top 10 | % of Net Assets |
|---|---|
| Royal Caribbean Cruises Ltd. | |
| Vistra Corp. | |
| Palantir Technologies, Inc. — Class A | |
| Axon Enterprise, Inc. | |
| Carnival Corp. | |
| NVIDIA Corp. | |
| Howmet Aerospace, Inc. | |
| NRG Energy, Inc. | |
| TKO Group Holdings, Inc. | |
| Crowdstrike Holdings, Inc. — Class A | |
| Top 10 Total |
2 | "10 Largest Holdings (as a % of Net Assets)" excludes any temporary cash or derivative investments. |
There were no changes in or disagreements with fund accountants for the period.
| Class | Costs of a $10,000 Investment | Costs Paid as a % of a $10,000 Investment |
|---|---|---|
| Variable Annuity | $86 | 1.70%2 |
For the period of January 1, 2025 to June 30, 2025, the fund returned 4.65%, underperforming the fund's broad-based securities market index, the S&P 500 Index, which returned 6.20% for the same period and underperforming the fund's secondary index, the S&P 500 Pure Value Index, which returned 5.42% for the same period.
What factors materially affected the fund's performance over the last six months?
The sectors that contributed the most to the return of the underlying index for the reporting period were health care, consumer staples, and financials. Those that detracted the most were consumer discretionary and real estate. The holdings that contributed the most to the return of the underlying index for the reporting period were CVS Health Corporation, Mosaic Co., and Dollar General Corp. Those that detracted the most were Viatris, Inc., Dow, Inc. and Centene Corp. The fund maintained a daily correlation of over 99% to the S&P 500 Pure Value Index for the reporting period.
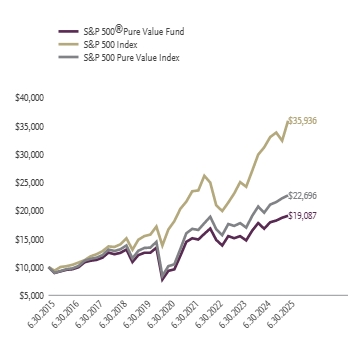
| 6 Month‡ | One Year | Five Years | Ten Years | |
|---|---|---|---|---|
| S&P 500® Pure Value Fund | 4.65% | 13.65% | 15.41% | 6.68% |
| S&P 500 Index | 6.20% | 15.16% | 16.64% | 13.65% |
| S&P 500 Pure Value Index | 5.42% | 15.52% | 17.47% | 8.55% |
| Net Assets | $16,874,793 |
| Total Number of Portfolio Holdings | |
| Portfolio Turnover Rate | 127% |
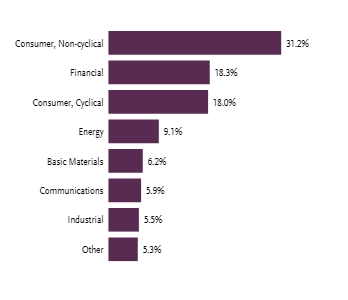
| Top 10 | % of Net Assets |
|---|---|
| CVS Health Corp. | |
| Mosaic Co. | |
| Ford Motor Co. | |
| General Motors Co. | |
| Archer-Daniels-Midland Co. | |
| Centene Corp. | |
| Bunge Global S.A. | |
| Paramount Global — Class B | |
| Dollar General Corp. | |
| Valero Energy Corp. | |
| Top 10 Total |
1 | "Holdings Diversification (Market Exposure as a % of Net Assets)" excludes any temporary cash investments, investments in Guggenheim Strategy Funds Trust mutual funds, or investments in Guggenheim Ultra Short Duration Fund. |
2 | "10 Largest Holdings (as a % of Net Assets)" excludes any temporary cash or derivative investments. |
| Top 10 | % of Net Assets |
|---|---|
| CVS Health Corp. | |
| Mosaic Co. | |
| Ford Motor Co. | |
| General Motors Co. | |
| Archer-Daniels-Midland Co. | |
| Centene Corp. | |
| Bunge Global S.A. | |
| Paramount Global — Class B | |
| Dollar General Corp. | |
| Valero Energy Corp. | |
| Top 10 Total |
2 | "10 Largest Holdings (as a % of Net Assets)" excludes any temporary cash or derivative investments. |
There were no changes in or disagreements with fund accountants for the period.
| Class | Costs of a $10,000 Investment | Costs Paid as a % of a $10,000 Investment |
|---|---|---|
| Variable Annuity | $84 | 1.70%2 |
For the period of January 1, 2025 to June 30, 2025, the fund returned 0.18%, underperforming the fund's broad-based securities market index, the S&P 500 Index, which returned 6.20% for the same period and underperforming the fund's secondary index, the S&P MidCap 400 Pure Growth Index, which returned 1.13% for the same period.
What factors materially affected the fund's performance over the last six months?
The sectors that contributed the most to the return of the underlying index for the reporting period were materials, industrials, and financials. Those that detracted the most from the return of the underlying index were health care, consumer discretionary, and energy. The holdings that contributed the most to the return of the underlying index for the reporting period were Carpenter Technology Corp., Hims & Hers Health, Inc., and ATI, Inc. Those that detracted the most were Sarepta Therapeutics, Inc., Abercrombie & Fitch Co. — Class A, and American Airlines Group, Inc. The fund maintained a daily correlation of over 99% to the S&P MidCap 400 Pure Growth Index for the reporting period.
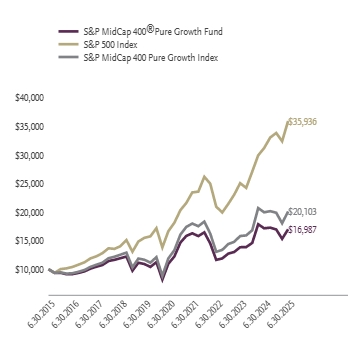
| 6 Month‡ | One Year | Five Years | Ten Years | |
|---|---|---|---|---|
| S&P MidCap 400® Pure Growth Fund | 0.18% | -1.00% | 9.17% | 5.44% |
| S&P 500 Index | 6.20% | 15.16% | 16.64% | 13.65% |
| S&P MidCap 400 Pure Growth Index | 1.13% | 0.84% | 11.08% | 7.24% |
| Net Assets | $9,362,147 |
| Total Number of Portfolio Holdings | |
| Portfolio Turnover Rate | 58% |
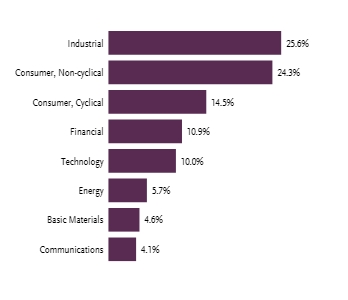
| Top 10 | % of Net Assets |
|---|---|
| Carpenter Technology Corp. | |
| Hims & Hers Health, Inc. | |
| Comfort Systems USA, Inc. | |
| Roivant Sciences Ltd. | |
| EMCOR Group, Inc. | |
| Valaris Ltd. | |
| Exelixis, Inc. | |
| Shift4 Payments, Inc. — Class A | |
| Interactive Brokers Group, Inc. — Class A | |
| ATI, Inc. | |
| Top 10 Total |
1 | "Holdings Diversification (Market Exposure as a % of Net Assets)" excludes any temporary cash investments, investments in Guggenheim Strategy Funds Trust mutual funds, or investments in Guggenheim Ultra Short Duration Fund. |
2 | "10 Largest Holdings (as a % of Net Assets)" excludes any temporary cash or derivative investments. |
| Top 10 | % of Net Assets |
|---|---|
| Carpenter Technology Corp. | |
| Hims & Hers Health, Inc. | |
| Comfort Systems USA, Inc. | |
| Roivant Sciences Ltd. | |
| EMCOR Group, Inc. | |
| Valaris Ltd. | |
| Exelixis, Inc. | |
| Shift4 Payments, Inc. — Class A | |
| Interactive Brokers Group, Inc. — Class A | |
| ATI, Inc. | |
| Top 10 Total |
2 | "10 Largest Holdings (as a % of Net Assets)" excludes any temporary cash or derivative investments. |
There were no changes in or disagreements with fund accountants for the period.
| Class | Costs of a $10,000 Investment | Costs Paid as a % of a $10,000 Investment |
|---|---|---|
| Variable Annuity | $85 | 1.71%2 |
For the period of January 1, 2025 to June 30, 2025, the fund returned 0.18%, underperforming the fund's broad-based securities market index, the S&P 500 Index, which returned 6.20% for the same period and underperforming the fund's secondary index, the S&P MidCap 400 Pure Value Index, which returned 1.01% for the same period.
What factors materially affected the fund's performance over the last six months?
The sectors that contributed the most to the return of the underlying index for the reporting period were industrials, materials, and information technology. Those that detracted the most were energy, consumer discretionary, and health care. The holdings that contributed the most to the return of the underlying index for the reporting period were United States Steel Corp., Avis Budget Group, Inc., and Concentrix Corp. Those that detracted the most were Macy's, Inc., Manpower Group, Inc. and Civitas Resources, Inc. The fund maintained a daily correlation of over 99% to the S&P MidCap 400 Pure Value Index for the reporting period.
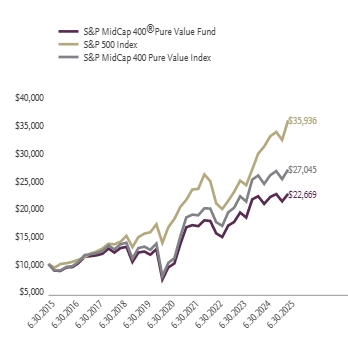
| 6 Month‡ | One Year | Five Years | Ten Years | |
|---|---|---|---|---|
| S&P MidCap 400® Pure Value Fund | 0.18% | 8.68% | 19.26% | 8.53% |
| S&P 500 Index | 6.20% | 15.16% | 16.64% | 13.65% |
| S&P MidCap 400 Pure Value Index | 1.01% | 10.47% | 21.50% | 10.46% |
| Net Assets | $6,422,714 |
| Total Number of Portfolio Holdings | |
| Portfolio Turnover Rate | 122% |
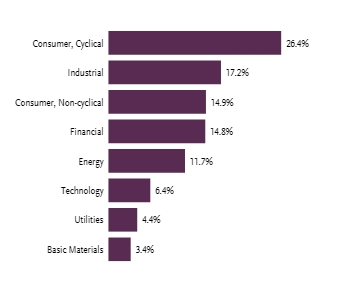
| Top 10 | % of Net Assets |
|---|---|
| Concentrix Corp. | |
| HF Sinclair Corp. | |
| Goodyear Tire & Rubber Co. | |
| Avnet, Inc. | |
| Arrow Electronics, Inc. | |
| TD SYNNEX Corp. | |
| Lear Corp. | |
| PBF Energy, Inc. — Class A | |
| Avis Budget Group, Inc. | |
| AutoNation, Inc. | |
| Top 10 Total |
1 | "Holdings Diversification (Market Exposure as a % of Net Assets)" excludes any temporary cash investments, investments in Guggenheim Strategy Funds Trust mutual funds, or investments in Guggenheim Ultra Short Duration Fund. |
2 | "10 Largest Holdings (as a % of Net Assets)" excludes any temporary cash or derivative investments. |
| Top 10 | % of Net Assets |
|---|---|
| Concentrix Corp. | |
| HF Sinclair Corp. | |
| Goodyear Tire & Rubber Co. | |
| Avnet, Inc. | |
| Arrow Electronics, Inc. | |
| TD SYNNEX Corp. | |
| Lear Corp. | |
| PBF Energy, Inc. — Class A | |
| Avis Budget Group, Inc. | |
| AutoNation, Inc. | |
| Top 10 Total |
2 | "10 Largest Holdings (as a % of Net Assets)" excludes any temporary cash or derivative investments. |
There were no changes in or disagreements with fund accountants for the period.
| Class | Costs of a $10,000 Investment | Costs Paid as a % of a $10,000 Investment |
|---|---|---|
| Variable Annuity | $85 | 1.70%2 |
For the period of January 1, 2025 to June 30, 2025, the fund returned 1.61%, underperforming the fund's broad-based securities market index, the S&P 500 Index, which returned 6.20% for the same period and underperforming the fund's secondary index, the S&P SmallCap 600 Pure Growth Index, which returned 2.34% for the same period.
What factors materially affected the fund's performance over the last six months?
The sectors that contributed the most to the return of the underlying index for the reporting period were financials, health care, and consumer discretionary. The sectors that detracted were energy, real estate, and communication services. The holdings that contributed the most to the return of the underlying index for the reporting period were TransMedics Group, Inc., Palomar Holdings, Inc. and Protagonist Therapeutics, Inc. Those that detracted the most were Atlas Energy Solutions, Inc., Pursuit Attractions and Hospitality, Inc., and Greenbrier Companies, Inc. The fund maintained a daily correlation of over 99% to the S&P 600 Pure Growth Index for the reporting period.
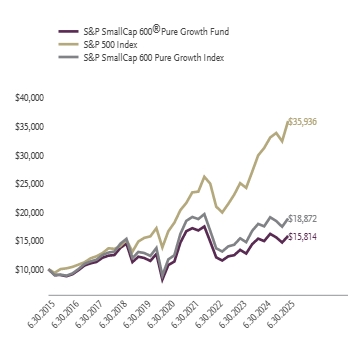
| 6 Month‡ | One Year | Five Years | Ten Years | |
|---|---|---|---|---|
| S&P SmallCap 600® Pure Growth Fund | 1.61% | 6.00% | 8.07% | 4.69% |
| S&P 500 Index | 6.20% | 15.16% | 16.64% | 13.65% |
| S&P SmallCap 600 Pure Growth Index | 2.34% | 7.87% | 10.01% | 6.55% |
| Net Assets | $8,337,547 |
| Total Number of Portfolio Holdings | |
| Portfolio Turnover Rate | 164% |
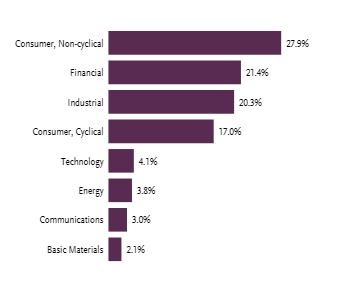
| Top 10 | % of Net Assets |
|---|---|
| Protagonist Therapeutics, Inc. | |
| Palomar Holdings, Inc. | |
| Corcept Therapeutics, Inc. | |
| TG Therapeutics, Inc. | |
| InterDigital, Inc. | |
| Adtalem Global Education, Inc. | |
| Chefs' Warehouse, Inc. | |
| DXP Enterprises, Inc. | |
| TransMedics Group, Inc. | |
| Cinemark Holdings, Inc. | |
| Top 10 Total |
1 | "Holdings Diversification (Market Exposure as a % of Net Assets)" excludes any temporary cash investments, investments in Guggenheim Strategy Funds Trust mutual funds, or investments in Guggenheim Ultra Short Duration Fund. |
2 | "10 Largest Holdings (as a % of Net Assets)" excludes any temporary cash or derivative investments. |
| Top 10 | % of Net Assets |
|---|---|
| Protagonist Therapeutics, Inc. | |
| Palomar Holdings, Inc. | |
| Corcept Therapeutics, Inc. | |
| TG Therapeutics, Inc. | |
| InterDigital, Inc. | |
| Adtalem Global Education, Inc. | |
| Chefs' Warehouse, Inc. | |
| DXP Enterprises, Inc. | |
| TransMedics Group, Inc. | |
| Cinemark Holdings, Inc. | |
| Top 10 Total |
2 | "10 Largest Holdings (as a % of Net Assets)" excludes any temporary cash or derivative investments. |
There were no changes in or disagreements with fund accountants for the period.
| Class | Costs of a $10,000 Investment | Costs Paid as a % of a $10,000 Investment |
|---|---|---|
| Variable Annuity | $82 | 1.70%2 |
For the period of January 1, 2025 to June 30, 2025, the fund returned -5.86%, underperforming the fund's broad-based securities market index, the S&P 500 Index, which returned 6.20% for the same period and underperforming the fund's secondary index, the S&P SmallCap 600 Pure Value Index, which returned -5.13% for the same period.
What factors materially affected the fund's performance over the last six months?
The sectors that contributed the most to the return of the underlying index for the reporting period were information technology and communication services. Those that detracted the most were health care, consumer discretionary, and consumer staples. The holdings that contributed the most to the return of the underlying index for the reporting period were Par Pacific Holdings, Inc., National Vision Holdings, Inc., and ViaSat, Inc. Those that detracted the most were Kohl's Corp., B&G Foods, Inc., and Vital Energy, Inc. The fund maintained a daily correlation of over 99% to the S&P 600 Pure Value Index for the reporting period.
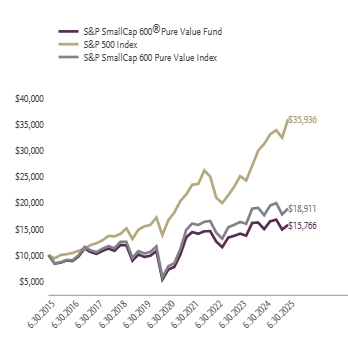
| 6 Month‡ | One Year | Five Years | Ten Years | |
|---|---|---|---|---|
| S&P SmallCap 600® Pure Value Fund | -5.86% | 5.46% | 16.87% | 4.66% |
| S&P 500 Index | 6.20% | 15.16% | 16.64% | 13.65% |
| S&P SmallCap 600 Pure Value Index | -5.13% | 7.44% | 19.17% | 6.58% |
| Net Assets | $8,090,401 |
| Total Number of Portfolio Holdings | |
| Portfolio Turnover Rate | 18% |
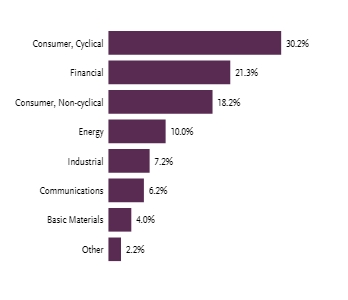
| Top 10 | % of Net Assets |
|---|---|
| Par Pacific Holdings, Inc. | |
| SpartanNash Co. | |
| Viasat, Inc. | |
| Titan International, Inc. | |
| Dana, Inc. | |
| National Vision Holdings, Inc. | |
| Adient plc | |
| World Kinect Corp. | |
| Foot Locker, Inc. | |
| Topgolf Callaway Brands Corp. | |
| Top 10 Total |
1 | "Holdings Diversification (Market Exposure as a % of Net Assets)" excludes any temporary cash investments, investments in Guggenheim Strategy Funds Trust mutual funds, or investments in Guggenheim Ultra Short Duration Fund. |
2 | "10 Largest Holdings (as a % of Net Assets)" excludes any temporary cash or derivative investments. |
| Top 10 | % of Net Assets |
|---|---|
| Par Pacific Holdings, Inc. | |
| SpartanNash Co. | |
| Viasat, Inc. | |
| Titan International, Inc. | |
| Dana, Inc. | |
| National Vision Holdings, Inc. | |
| Adient plc | |
| World Kinect Corp. | |
| Foot Locker, Inc. | |
| Topgolf Callaway Brands Corp. | |
| Top 10 Total |
2 | "10 Largest Holdings (as a % of Net Assets)" excludes any temporary cash or derivative investments. |
There were no changes in or disagreements with fund accountants for the period.
| Class | Costs of a $10,000 Investment | Costs Paid as a % of a $10,000 Investment |
|---|---|---|
| Variable Annuity | $72 | 1.44%2 |
For the period of January 1, 2025 to June 30, 2025, the fund returned 1.20%, underperforming the fund's broad-based securities market index, the Bloomberg U.S. Aggregate Bond Index, which returned 4.02% for the same period and underperforming the fund's secondary index, the Bloomberg U.S. Treasury 30 Year Bellwether Index, which returned 2.11% for the same period.
What factors materially affected the fund's performance over the last six months?
Despite volatility during the period, yields of long-term Treasury bonds ended the period relatively unchanged. The treasury bond market exhibited volatility throughout the period in response to tariff concerns and shifts in expectations regarding Federal Reserve policy decisions. Uncertainty about the long-term economic impacts of tariffs and fiscal policy have led to the volatility in long term treasury yields over the period. Long-term treasury yields reached their lows in April 2025 before rising steadily through the end of the period and ended the first half of the year mostly unchanged.
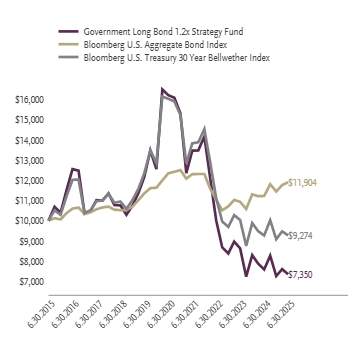
| 6 Month‡ | One Year | Five Years | Ten Years | |
|---|---|---|---|---|
| Government Long Bond 1.2x Strategy Fund | 1.20% | -3.06% | -14.66% | -3.03% |
| Bloomberg U.S. Aggregate Bond Index | 4.02% | 6.08% | -0.73% | 1.76% |
| Bloomberg U.S. Treasury 30 Year Bellwether Index | 2.11% | 0.05% | -10.37% | -0.75% |
| Net Assets | $5,206,907 |
| Total Number of Portfolio Holdings | |
| Portfolio Turnover Rate | 5,528% |
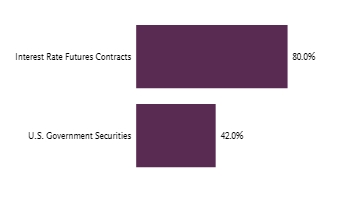
| Top 10 | % of Net Assets |
|---|---|
| U.S. Treasury Bonds | |
| Guggenheim Strategy Fund II | |
| Guggenheim Ultra Short Duration Fund — Institutional Class | |
| Total |
1 | "Holdings Diversification (Market Exposure as a % of Net Assets)" excludes any temporary cash investments, investments in Guggenheim Strategy Funds Trust mutual funds, or investments in Guggenheim Ultra Short Duration Fund. |
2 | "Largest Holdings (as a % of Net Assets)" excludes any temporary cash or derivative investments. |
| Top 10 | % of Net Assets |
|---|---|
| U.S. Treasury Bonds | |
| Guggenheim Strategy Fund II | |
| Guggenheim Ultra Short Duration Fund — Institutional Class | |
| Total |
2 | "Largest Holdings (as a % of Net Assets)" excludes any temporary cash or derivative investments. |
There were no changes in or disagreements with fund accountants for the period.
| Class | Costs of a $10,000 Investment | Costs Paid as a % of a $10,000 Investment |
|---|---|---|
| Variable Annuity | $280 | 5.63%2 |
For the period of January 1, 2025 to June 30, 2025, the fund returned 0.40%, underperforming the fund's broad-based securities market index, the Bloomberg U.S. Aggregate Bond Index, which returned 4.02% for the same period and underperforming the fund's secondary index, the Bloomberg U.S. Treasury 30 Year Bellwether Index, which returned 2.11% for the same period.
What factors materially affected the fund's performance over the last six months?
Despite volatility during the period, yields of long-term Treasury bonds ended the period relatively unchanged. The treasury bond market exhibited volatility throughout the period in response to tariff concerns and shifts in expectations regarding Federal Reserve policy decisions. Uncertainty about the long-term economic impacts of tariffs and fiscal policy have led to the volatility in long term treasury yields over the period. Long-term treasury yields reached their lows in April 2025 before rising steadily through the end of the period and ended the first half of the year mostly unchanged.
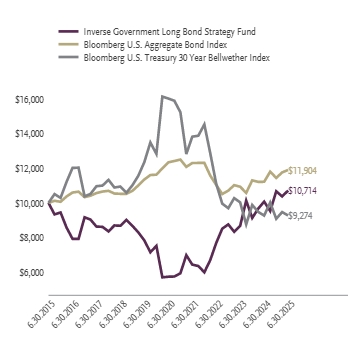
| 6 Month‡ | One Year | Five Years | Ten Years | |
|---|---|---|---|---|
| Inverse Government Long Bond Strategy Fund | 0.40% | 6.34% | 13.32% | 0.69% |
| Bloomberg U.S. Aggregate Bond Index | 4.02% | 6.08% | -0.73% | 1.76% |
| Bloomberg U.S. Treasury 30 Year Bellwether Index | 2.11% | 0.05% | -10.37% | -0.75% |
| Net Assets | $1,563,884 |
| Total Number of Portfolio Holdings | |
| Portfolio Turnover Rate | 512% |
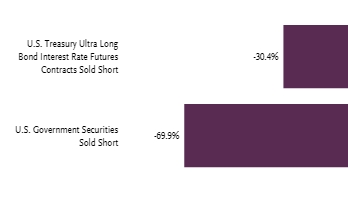
| Top 10 | % of Net Assets |
|---|---|
| Guggenheim Strategy Fund II | |
| Guggenheim Ultra Short Duration Fund — Institutional Class | |
| Total |
1 | "Holdings Diversification (Market Exposure as a % of Net Assets)" excludes any temporary cash investments, investments in Guggenheim Strategy Funds Trust mutual funds, or investments in Guggenheim Ultra Short Duration Fund. |
2 | "Largest Holdings (as a % of Net Assets)" excludes any temporary cash or derivative investments. |
| Top 10 | % of Net Assets |
|---|---|
| Guggenheim Strategy Fund II | |
| Guggenheim Ultra Short Duration Fund — Institutional Class | |
| Total |
2 | "Largest Holdings (as a % of Net Assets)" excludes any temporary cash or derivative investments. |
There were no changes in or disagreements with fund accountants for the period.
| Class | Costs of a $10,000 Investment | Costs Paid as a % of a $10,000 Investment |
|---|---|---|
| Variable Annuity | $86 | 1.68%2 |
For the period of January 1, 2025 to June 30, 2025, the fund returned 5.86%, outperforming the fund's broad-based securities market index, the Bloomberg U.S. Aggregate Bond Index, which returned 4.02% for the same period and outperforming the fund's secondary index, the Bloomberg U.S. Corporate High Yield Index, which returned 4.57% for the same period.
What factors materially affected the fund's performance over the last six months?
High yield continued to generate positive returns for the reporting period. During the period, risk assets experienced some volatility due to macro-economic factors stemming from trade negotiations and tariffs. After the initial market shock of increased tariffs on trading partners, risk assets rebounded and continued to generate positive total returns. All sectors contributed positively to the Bloomberg U.S. Corporate High Yield Index (the "Index") with notable positive contribution from communications and consumer discretionary. On the ratings side, BB-rated holdings led contribution to returns of the Index.
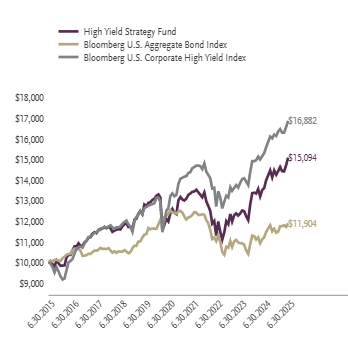
| 6 Month‡ | One Year | Five Years | Ten Years | |
|---|---|---|---|---|
| High Yield Strategy Fund | 5.86% | 10.87% | 4.71% | 4.20% |
| Bloomberg U.S. Aggregate Bond Index | 4.02% | 6.08% | -0.73% | 1.76% |
| Bloomberg U.S. Corporate High Yield Index | 4.57% | 10.28% | 5.97% | 5.38% |
| Net Assets | $7,572,421 |
| Total Number of Portfolio Holdings | |
| Portfolio Turnover Rate | 0% |
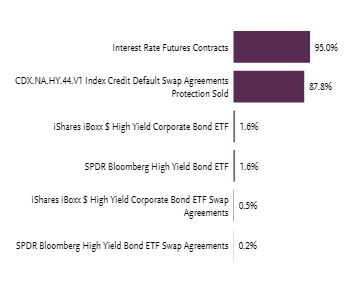
| Top 10 | % of Net Assets |
|---|---|
| Guggenheim Ultra Short Duration Fund — Institutional Class | |
| Guggenheim Strategy Fund II | |
| iShares iBoxx $ High Yield Corporate Bond ETF | |
| SPDR Bloomberg High Yield Bond ETF | |
| Total |
1 | "Holdings Diversification (Market Exposure as a % of Net Assets)" excludes any temporary cash investments, investments in Guggenheim Strategy Funds Trust mutual funds, or investments in Guggenheim Ultra Short Duration Fund. The Fund's target exposure is achieved through a combination of total return swaps, credit default swaps, and interest rate futures contracts. |
2 | "Largest Holdings (as a % of Net Assets)" excludes any temporary cash or derivative investments. |
| Top 10 | % of Net Assets |
|---|---|
| Guggenheim Ultra Short Duration Fund — Institutional Class | |
| Guggenheim Strategy Fund II | |
| iShares iBoxx $ High Yield Corporate Bond ETF | |
| SPDR Bloomberg High Yield Bond ETF | |
| Total |
2 | "Largest Holdings (as a % of Net Assets)" excludes any temporary cash or derivative investments. |
There were no changes in or disagreements with fund accountants for the period.
| Class | Costs of a $10,000 Investment | Costs Paid as a % of a $10,000 Investment |
|---|---|---|
| Variable Annuity | $96 | 1.73%2 |
For the period of January 1, 2025 to June 30, 2025, the fund returned 23.18%, outperforming the fund's broad-based securities market index, the MSCI World ex US Index, which returned 17.02% for the same period and outperforming the fund's secondary index, the STOXX Europe 50 Index, which returned 19.57% for the same period.
What factors materially affected the fund's performance over the last six months?
The sectors that contributed the most to the return of the secondary index for the reporting period were financials, industrials, and consumer staples. No sectors detracted from performance. The holdings that contributed the most to the return of the underlying index for the reporting period were SAP SE, Banco Santander SA, and Novartis AG. Those that detracted the most were Novo Nordisk A/S, LVMH Moet Hennessy Louis Vuitton SE, and Diageo plc. The Fund maintained a daily correlation of over 99% to its benchmark of 125% of the daily price movement of the STOXX Europe 50 Index.
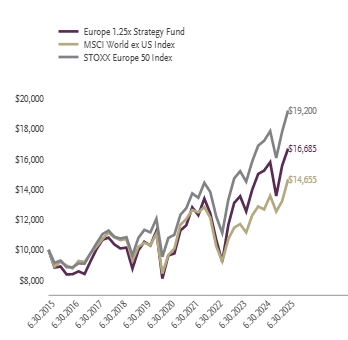
| 6 Month‡ | One Year | Five Years | Ten Years | |
|---|---|---|---|---|
| Europe 1.25x Strategy Fund | 23.18% | 9.54% | 11.62% | 5.25% |
| MSCI World ex US Index | 17.02% | 15.70% | 8.69% | 3.90% |
| STOXX Europe 50 Index | 19.57% | 11.60% | 12.24% | 6.74% |
| Net Assets | $2,673,246 |
| Total Number of Portfolio Holdings | |
| Portfolio Turnover Rate | 167% |
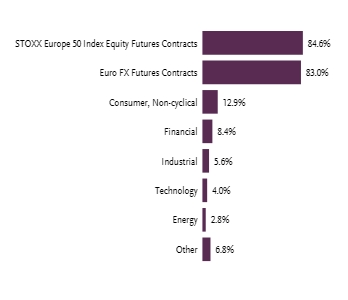
| Geographic Region | % of Net Assets |
|---|---|
| United States | |
| Denmark | |
| France | |
| United Kingdom | |
| Switzerland | |
| Germany | |
| Netherlands | |
| Other |
| Top 10 | % of Net Assets |
|---|---|
| Guggenheim Strategy Fund II | |
| Guggenheim Ultra Short Duration Fund — Institutional Class | |
| ASML Holding N.V. — Class G | |
| SAP SE ADR | |
| Nestle S.A. ADR | |
| Novartis AG ADR | |
| Roche Holding AG ADR | |
| Novo Nordisk A/S ADR | |
| AstraZeneca plc ADR | |
| HSBC Holdings plc ADR | |
| Top 10 Total |
1 | "Holdings Diversification (Market Exposure as a % of Net Assets)" excludes any temporary cash investments, investments in Guggenheim Strategy Funds Trust mutual funds, or investments in Guggenheim Ultra Short Duration Fund. The fund's target exposure is achieved through a combination of equity futures contracts and currency futures contracts. |
2 | "10 Largest Holdings (as a % of Net Assets)" excludes any temporary cash or derivative investments. |
3 | Country Diversification (% of Total Investments) includes temporary cash investments. |
| Top 10 | % of Net Assets |
|---|---|
| Guggenheim Strategy Fund II | |
| Guggenheim Ultra Short Duration Fund — Institutional Class | |
| ASML Holding N.V. — Class G | |
| SAP SE ADR | |
| Nestle S.A. ADR | |
| Novartis AG ADR | |
| Roche Holding AG ADR | |
| Novo Nordisk A/S ADR | |
| AstraZeneca plc ADR | |
| HSBC Holdings plc ADR | |
| Top 10 Total |
2 | "10 Largest Holdings (as a % of Net Assets)" excludes any temporary cash or derivative investments. |
3 | Country Diversification (% of Total Investments) includes temporary cash investments. |
There were no changes in or disagreements with fund accountants for the period.
| Class | Costs of a $10,000 Investment | Costs Paid as a % of a $10,000 Investment |
|---|---|---|
| Variable Annuity | $93 | 1.70%2 |
For the period of January 1, 2025 to June 30, 2025, the fund returned 20.58%, outperforming the fund's broad-based securities market index, the MSCI World ex US Index, which returned 17.02% for the same period and outperforming the fund's secondary index, the Nikkei-225 Stock Average Index, which returned 10.58% for the same period.
What factors materially affected the fund's performance over the last six months?
The sectors that contributed the most to the return of the secondary index for the reporting period were information technology, communication services, and industrials. The sector that detracted the most was energy. The holdings that contributed the most to the return of the underlying index were Tokyo Electron, Ltd., Advantest Corp., and SoftBank Group Corp. Those that detracted the most were Recruit Holdings Co., Ltd, TDK Corp., and Daichi Sankyo Co., Ltd. The Fund maintained a daily correlation of over 99% to its benchmark of 200% of the daily price movement of the fair value of the Nikkei-225 Stock Average Index.
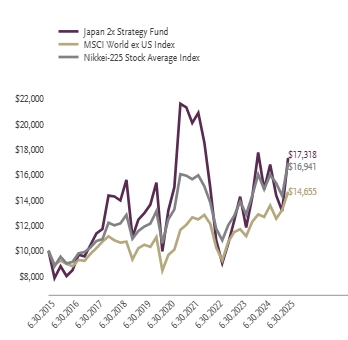
| 6 Month‡ | One Year | Five Years | Ten Years | |
|---|---|---|---|---|
| Japan 2x Strategy Fund | 20.58% | 16.71% | 5.64% | 5.65% |
| MSCI World ex US Index | 17.02% | 15.70% | 8.69% | 3.90% |
| Nikkei-225 Stock Average Index | 10.58% | 14.07% | 6.31% | 5.41% |
| Net Assets | $1,563,031 |
| Total Number of Portfolio Holdings | |
| Portfolio Turnover Rate | 0% |
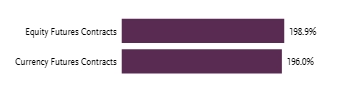
1 | "Holdings Diversification (Market Exposure as a % of Net Assets)" excludes any temporary cash investments, investments in Guggenheim Strategy Funds Trust mutual funds, or investments in Guggenheim Ultra Short Duration Fund. The Fund's target exposure is achieved through a combination of equity futures contracts and currency futures contracts. |
There were no changes in or disagreements with fund accountants for the period.
| Class | Costs of a $10,000 Investment | Costs Paid as a % of a $10,000 Investment |
|---|---|---|
| Variable Annuity | $90 | 2.00%2 |
For the period of January 1, 2025 to June 30, 2025, the fund returned -18.73%, underperforming the fund's broad-based securities market index, the Bloomberg U.S. Aggregate Bond Index, which returned 4.02% for the same period and underperforming the fund's secondary index, the U.S. Dollar Index, which returned -10.70% for the same period.
What factors materially affected the fund's performance over the last six months?
There were no components which positively contributed to the performance of the underlying index for the Reporting Period. The components that detracted from the U.S. Dollar Index performance were the euro, Japanese yen and British pound. The Fund maintained a daily correlation of over 99% to its benchmark of 200% of the daily price movement of the U.S. Dollar Index.
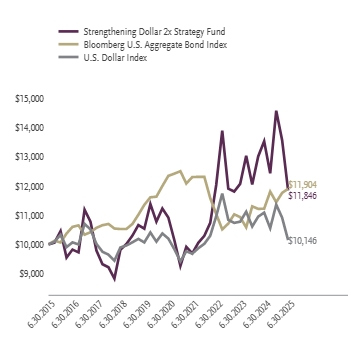
| 6 Month‡ | One Year | Five Years | Ten Years | |
|---|---|---|---|---|
| Strengthening Dollar 2x Strategy Fund | -18.73% | -12.42% | 1.64% | 1.71% |
| Bloomberg U.S. Aggregate Bond Index | 4.02% | 6.08% | -0.73% | 1.76% |
| U.S. Dollar Index | -10.70% | -8.49% | -0.10% | 0.14% |
| Net Assets | $1,173,137 |
| Total Number of Portfolio Holdings | |
| Portfolio Turnover Rate | 0% |
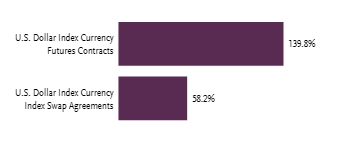
1 | "Holdings Diversification (Market Exposure as a % of Net Assets)" excludes any temporary cash investments, investments in Guggenheim Strategy Funds Trust mutual funds, or investments in Guggenheim Ultra Short Duration Fund. |
There were no changes in or disagreements with fund accountants for the period.
| Class | Costs of a $10,000 Investment | Costs Paid as a % of a $10,000 Investment |
|---|---|---|
| Variable Annuity | $114 | 2.05%2 |
For the period of January 1, 2025 to June 30, 2025, the fund returned 23.81%, outperforming the fund's broad-based securities market index, the Bloomberg U.S. Aggregate Bond Index, which returned 4.02% for the same period and outperforming the fund's secondary index, the U.S. Dollar Index, which returned -10.70% for the same period.
What factors materially affected the fund's performance over the last six months?
There were no components which positively contributed to the performance of the underlying index for the reporting period. The components that detracted from the U.S. Dollar Index performance were the euro, Japanese yen and British pound. The Fund maintained a daily correlation of over 99% to its benchmark of -200% of the daily price movement of the U.S. Dollar Index.
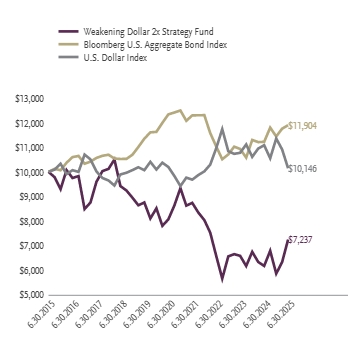
| 6 Month‡ | One Year | Five Years | Ten Years | |
|---|---|---|---|---|
| Weakening Dollar 2x Strategy Fund | 23.81% | 17.49% | -2.13% | -3.18% |
| Bloomberg U.S. Aggregate Bond Index | 4.02% | 6.08% | -0.73% | 1.76% |
| U.S. Dollar Index | -10.70% | -8.49% | -0.10% | 0.14% |
| Net Assets | $1,206,596 |
| Total Number of Portfolio Holdings | |
| Portfolio Turnover Rate | 0% |
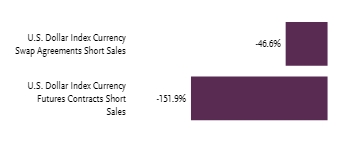
1 | "Holdings Diversification (Market Exposure as a % of Net Assets)" excludes any temporary cash investments, investments in Guggenheim Strategy Funds Trust mutual funds, or investments in Guggenheim Ultra Short Duration Fund. |
There were no changes in or disagreements with fund accountants for the period.
| Class | Costs of a $10,000 Investment | Costs Paid as a % of a $10,000 Investment |
|---|---|---|
| Variable Annuity | $81 | 1.62%2 |
For the period of January 1, 2025 to June 30, 2025, the fund returned 0.42%, underperforming the fund's broad-based securities market index, the S&P 500 Index, which returned 6.20% for the same period and underperforming the fund's secondary index, the S&P Goldman Sachs Commodity Index, which returned 1.94% for the same period.
What factors materially affected the fund's performance over the last six months?
The fund obtained exposure to the commodities markets through futures on the S&P Goldman Sachs Commodity Index. S&P Goldman Sachs Commodity Index futures had a strong first quarter of 2025 but experienced headwinds from energy and agricultural sectors in the second quarter of 2025. Eleven of the twenty-four index components had positive returns for the period. The components with some of the largest positive returns were gold, silver, and live cattle. The components with some of the largest negative returns were cocoa, corn, and Kansas wheat.
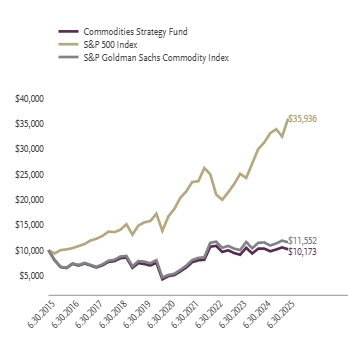
| 6 Month‡ | One Year | Five Years | Ten Years | |
|---|---|---|---|---|
| Commodities Strategy Fund | 0.42% | -1.40% | 15.80% | 0.17% |
| S&P 500 Index | 6.20% | 15.16% | 16.64% | 13.65% |
| S&P Goldman Sachs Commodity Index | 1.94% | 0.25% | 17.69% | 1.45% |
| Net Assets | $5,162,932 |
| Total Number of Portfolio Holdings | |
| Portfolio Turnover Rate | 0% |
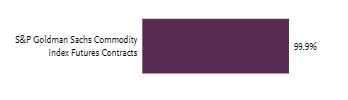
| Top 10 | % of Net Assets |
|---|---|
| Guggenheim Ultra Short Duration Fund — Institutional Class | |
| Guggenheim Strategy Fund II | |
| Total |
1 | "Consolidated Holdings Diversification (Market Exposure as a % of Net Assets)" excludes any temporary cash investments, investments in Guggenheim Strategy Funds Trust mutual funds, or investments in Guggenheim Ultra Short Duration Fund. |
2 | "Largest Holdings (as a % of Net Assets)" excludes any temporary cash or derivative investments. |
| Top 10 | % of Net Assets |
|---|---|
| Guggenheim Ultra Short Duration Fund — Institutional Class | |
| Guggenheim Strategy Fund II | |
| Total |
2 | "Largest Holdings (as a % of Net Assets)" excludes any temporary cash or derivative investments. |
There were no changes in or disagreements with fund accountants for the period.
| Class | Costs of a $10,000 Investment | Costs Paid as a % of a $10,000 Investment |
|---|---|---|
| Variable Annuity | $108 | 2.22%2 |
For the period of January 1, 2025 to June 30, 2025, the fund returned -3.99%, underperforming the fund's broad-based securities market index, the S&P 500 Index, which returned 6.20% for the same period and underperforming the fund's secondary index, the ICE BofA 3-Month U.S. Treasury Bill Index, which returned 2.09% for the same period.
What factors materially affected the fund's performance over the last six months?
In the first half of 2025, futures markets were marked by a mix of reversals and consolidation, presenting a challenging environment for trend-following systems. Global stock index futures saw choppy behavior, with early-year rallies in U.S. and European equities stalling amid shifting central bank policy signals and geopolitical uncertainty. Bond futures were volatile but lacked sustained directional moves, as inflation data and diverging rate expectations kept global yields in flux. In foreign exchange, the U.S. dollar strengthened modestly against major currencies in Q1 before weakening in Q2, driven by changing interest rate differentials and mixed economic signals across regions. Commodity futures were mixed—energy markets, particularly crude oil, saw sharp but short-lived moves tied to supply disruptions and OPEC policy, while metals and agricultural contracts experienced sporadic price swings without sustained trends.
This backdrop of frequent reversals and limited trend persistence across asset classes created a difficult environment for trend-following models, which typically perform best in sustained directional markets. Reflecting these conditions, the fund posted a negative return in Q1, with losses across all asset classes—Currencies and Fixed Income were the largest detractors, while Commodities and Equities also contributed to the decline. In Q2, performance improved, supported by gains in Commodities, Currencies, and Equities, though Fixed Income remained a drag. Despite the recovery in Q2, the fund ended the first half of the year with a net loss.
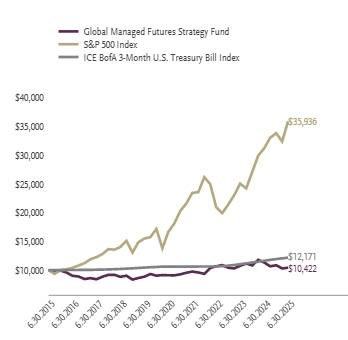
| 6 Month‡ | One Year | Five Years | Ten Years | |
|---|---|---|---|---|
| Global Managed Futures Strategy Fund | -3.99% | -8.02% | 2.74% | 0.41% |
| S&P 500 Index | 6.20% | 15.16% | 16.64% | 13.65% |
| ICE BofA 3-Month U.S. Treasury Bill Index | 2.09% | 4.71% | 2.78% | 1.98% |
| Net Assets | $11,282,019 |
| Total Number of Portfolio Holdings | |
| Portfolio Turnover Rate | 0% |
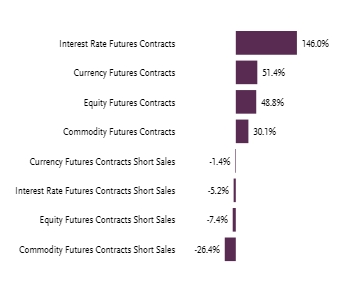
| Top 10 | % of Net Assets |
|---|---|
| Guggenheim Variable Insurance Strategy Fund III | |
| Guggenheim Strategy Fund III | |
| Guggenheim Strategy Fund II | |
| Guggenheim Ultra Short Duration Fund — Institutional Class | |
| Total |
1 | "Consolidated Holdings Diversification (Market Exposure as a % of Net Assets)" excludes any temporary cash investments, investments in Guggenheim Strategy Funds Trust mutual funds, or investments in Guggenheim Ultra Short Duration Fund. |
2 | "Largest Holdings (as a % of Net Assets)" excludes any temporary cash or derivative investments. |
| Top 10 | % of Net Assets |
|---|---|
| Guggenheim Variable Insurance Strategy Fund III | |
| Guggenheim Strategy Fund III | |
| Guggenheim Strategy Fund II | |
| Guggenheim Ultra Short Duration Fund — Institutional Class | |
| Total |
2 | "Largest Holdings (as a % of Net Assets)" excludes any temporary cash or derivative investments. |
There were no changes in or disagreements with fund accountants for the period.
| Class | Costs of a $10,000 Investment | Costs Paid as a % of a $10,000 Investment |
|---|---|---|
| Variable Annuity | $78 | 1.59%2 |
For the period of January 1, 2025 to June 30, 2025, the fund returned -2.10%, underperforming the fund's broad-based securities market index, the S&P 500 Index, which returned 6.20% for the same period and underperforming the fund's secondary index, the HFRX Global Hedge Fund Index, which returned 2.38% for the same period.
What factors materially affected the fund's performance over the last six months?
The fund's merger arbitrage strategy was the largest positive contributor in the first half of the year as several notable deals closed (e.g. Capital One / Discover). Closed-end fund arbitrage and the long/short equity strategy also made modest positive contributions. The fund's global macro strategies were a net detractor during the period as positive contributions from Flow (driven primarily by fixed income) did not make up for poor performance in value (primarily commodities and fixed income) and Momentum (hurt by equities and currency). Flow strategies take positions based on expected capital flows in markets which are determined through economic theory or statistical observation of market behavior. Momentum is a systematic trend-following strategy that seeks to capture momentum premia in futures markets. Carry strategies seek to capture inefficiencies in the futures curves of different markets and asset classes including commodities, fixed income, and implied volatility. Value premia strategies take positions based on expected future prices in markets as derived from economic and/or non-price data and include strategies applied to commodities, currencies, and fixed income. A market neutral strategy attempts to profit whether the market is going up or down.
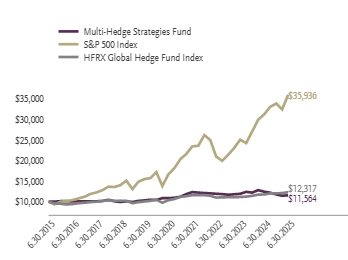
| 6 Month‡ | One Year | Five Years | Ten Years | |
|---|---|---|---|---|
| Multi-Hedge Strategies Fund | -2.10% | -6.97% | 1.25% | 1.46% |
| S&P 500 Index | 6.20% | 15.16% | 16.64% | 13.65% |
| HFRX Global Hedge Fund Index | 2.38% | 4.74% | 3.52% | 2.11% |
| Net Assets | $26,770,973 |
| Total Number of Portfolio Holdings | |
| Portfolio Turnover Rate | 75% |
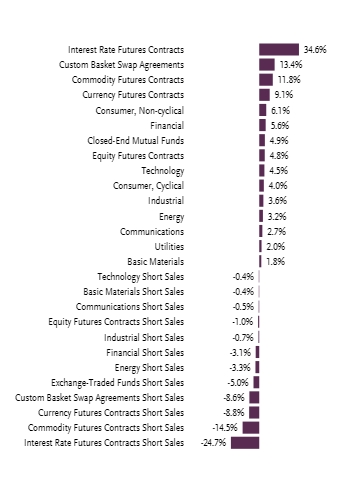
| Top 10 | % of Net Assets |
|---|---|
| Guggenheim Strategy Fund III | |
| Guggenheim Variable Insurance Strategy Fund III | |
| Guggenheim Strategy Fund II | |
| Guggenheim Ultra Short Duration Fund — Institutional Class | |
| Kellanova | |
| Everi Holdings, Inc. | |
| Hess Corp. | |
| Redfin Corp. | |
| Dun & Bradstreet Holdings, Inc. | |
| Enstar Group Ltd. | |
| Top 10 Total |
1 | "Consolidated Holdings Diversification (Market Exposure as a % of Net Assets)" excludes any temporary cash investments, investments in Guggenheim Strategy Funds Trust mutual funds, or investments in Guggenheim Ultra Short Duration Fund. |
2 | "10 Largest Holdings (as a % of Net Assets)" excludes any temporary cash or derivative investments. |
| Top 10 | % of Net Assets |
|---|---|
| Guggenheim Strategy Fund III | |
| Guggenheim Variable Insurance Strategy Fund III | |
| Guggenheim Strategy Fund II | |
| Guggenheim Ultra Short Duration Fund — Institutional Class | |
| Kellanova | |
| Everi Holdings, Inc. | |
| Hess Corp. | |
| Redfin Corp. | |
| Dun & Bradstreet Holdings, Inc. | |
| Enstar Group Ltd. | |
| Top 10 Total |
2 | "10 Largest Holdings (as a % of Net Assets)" excludes any temporary cash or derivative investments. |
There were no changes in or disagreements with fund accountants for the period.
| Class | Costs of a $10,000 Investment | Costs Paid as a % of a $10,000 Investment |
|---|---|---|
| Variable Annuity | $75 | 1.50%2 |
For the period of January 1, 2025 to June 30, 2025, the fund returned 1.43%.
What factors materially affected the fund's performance over the last six months?
For the first half of 2025, resilient economic data delayed the timing of expected rate cuts and inflation remained slightly above the U.S. Federal Reserve's (the "Fed") target level. At its June 2025 meeting, the Fed noted that economic activity continued to expand at a solid pace, the labor market is solid and inflation remains somewhat elevated. Uncertainty about the economic impacts of tariffs and fiscal policy has resulted in the market pricing in two 25 basis point rate cuts for the remainder of 2025.
| 6 Month‡ | One Year | Five Years | Ten Years | |
|---|---|---|---|---|
| U.S. Government Money Market Fund | 1.43% | 3.32% | 1.94% | 1.12% |
| Net Assets | $48,760,695 |
| Total Number of Portfolio Holdings |
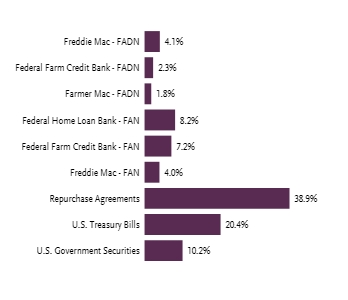
FADN - Federal Agency Discount Note
FAN - Federal Agency Note
There were no changes in or disagreements with fund accountants for the period.