Shareholder Report
Jun. 30, 2025
USD ($)
Holding
This report describes material changes to the Fund that occurred during the reporting period.
What were the Fund costs for the last year?
(based on a hypothetical $10,000 investment)
| Fund (Class) | Costs of a $10,000 investment |
Costs paid as a percentage of a $10,000 investment |
| JPMorgan Mid Cap Growth Fund (Class A Shares) |
$119 | 1.10% |
How did the Fund Perform?
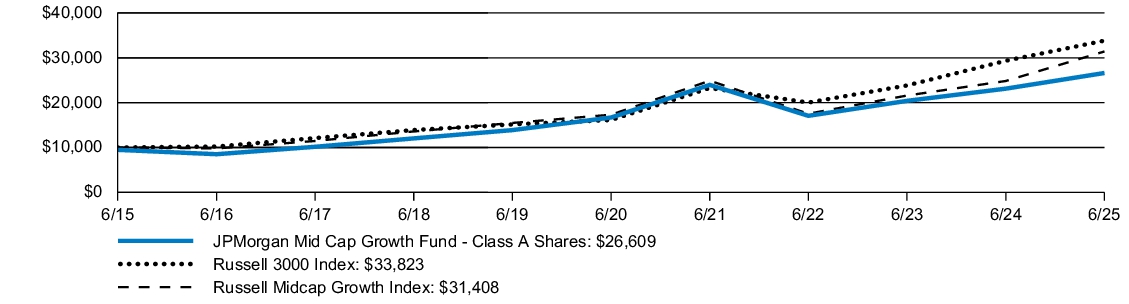
The JPMorgan Mid Cap Growth Fund's Class A Shares, without a sales charge, returned 15.09% for the twelve months ended June 30, 2025. The Russell 3000 Index returned 15.30% and the Russell Midcap Growth Index (the "Index") returned 26.49% for the twelve months ended June 30, 2025.
- The Fund’s security selection in the information technology and consumer discretionary sectors overweight detracted from performance.
- The Fund’s underweight allocation to Palantir Technologies Inc. and overweight allocation to e.l.f. Beauty, Inc. detracted from performance.
- The Fund’s security selection in the financials and energy sectors contributed to performance.
- The Fund’s overweight allocation to Robinhood Markets, Inc. and DoorDash, Inc. contributed to performance.
Fund Performance
| AVERAGE ANNUAL TOTAL RETURNS | INCEPTION DATE |
1 YEAR | 5 YEAR | 10 YEAR | |||
| JPMorgan Mid Cap Growth Fund (Class A Shares) | February 18, 1992 | 9.05 | % | 8.60 | % | 10.28 | % |
| JPMorgan Mid Cap Growth Fund (Class A Shares) - excluding sales charge | 15.09 | 9.78 | 10.88 | ||||
| Russell 3000 Index | 15.30 | 15.96 | 12.96 | ||||
| Russell Midcap Growth Index | 26.49 | 12.65 | 12.13 |
KEY FUND STATISTICS
| Fund net assets (000's) | $12,591,027 | |
| Total number of portfolio holdings | 111 | |
| Portfolio turnover rate | 67 | % |
| Total advisory fees paid (000's) | $67,189 |
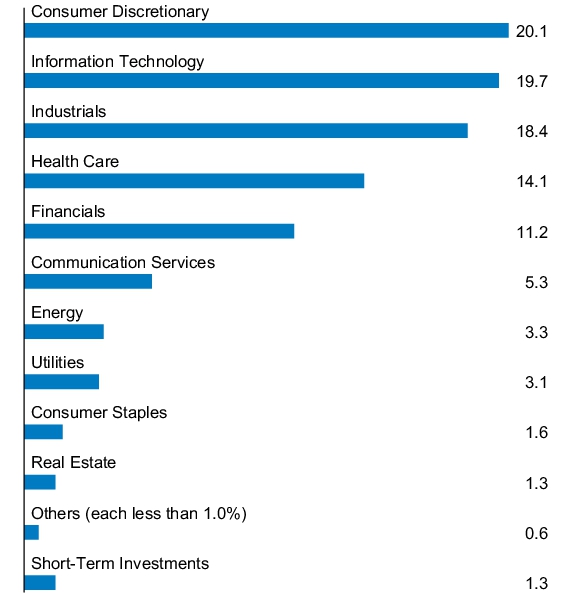
PORTFOLIO COMPOSITION - SECTOR
(% of Total Investments)
(% of Total Investments)

Material changes to the Fund during the period
Effective November 1, 2024, the Fund’s reduced its advisory fee from 0.65% of the Fund’s average daily net assets to 0.60% of the Fund’s average daily net assets.
Effective November 1, 2024, the Fund’s Adviser, Administrator and/or Principal Underwriter reduced the amount they have contractually agreed to waive fees and/or reimburse the Fund to the extent that total annual operating expenses (excluding acquired fund fees and expenses other than certain money market fund fees, dividend and interest expenses related to short sales, interest, taxes, expenses related to litigation and potential litigation, expenses related to trustee elections and extraordinary expenses) exceed 1.14% of the Fund's Class A Shares average daily net assets to 1.09% of the Fund's Class A Shares average daily net assets.
.
This is a summary of certain changes to the Fund since July 1, 2024. For more complete information, you may review the Fund’s prospectus at www.jpmorganfunds.com/funddocuments or upon request at 1-800-480-4111.
Effective November 1, 2024, the Fund’s reduced its advisory fee from 0.65% of the Fund’s average daily net assets to 0.60% of the Fund’s average daily net assets.
Effective November 1, 2024, the Fund’s Adviser, Administrator and/or Principal Underwriter reduced the amount they have contractually agreed to waive fees and/or reimburse the Fund to the extent that total annual operating expenses (excluding acquired fund fees and expenses other than certain money market fund fees, dividend and interest expenses related to short sales, interest, taxes, expenses related to litigation and potential litigation, expenses related to trustee elections and extraordinary expenses) exceed 1.14% of the Fund's Class A Shares average daily net assets to 1.09% of the Fund's Class A Shares average daily net assets.
This is a summary of certain changes to the Fund since July 1, 2024. For more complete information, you may review the Fund’s prospectus at www.jpmorganfunds.com/funddocuments or upon request at 1-800-480-4111.
This report describes material changes to the Fund that occurred during the reporting period.
What were the Fund costs for the last year?
(based on a hypothetical $10,000 investment)
| Fund (Class) | Costs of a $10,000 investment |
Costs paid as a percentage of a $10,000 investment |
| JPMorgan Mid Cap Growth Fund (Class C Shares) |
$172 | 1.60% |
How did the Fund Perform?
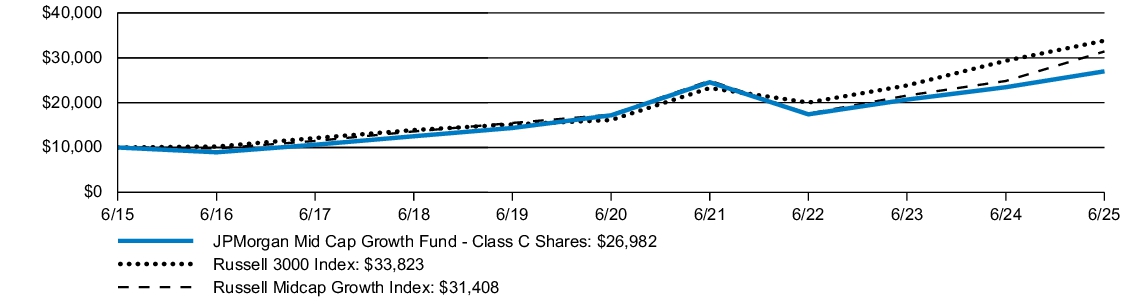
The JPMorgan Mid Cap Growth Fund's Class C Shares, without a sales charge, returned 14.52% for the twelve months ended June 30, 2025. The Russell 3000 Index returned 15.30% and the Russell Midcap Growth Index (the "Index") returned 26.49% for the twelve months ended June 30, 2025.
- The Fund’s security selection in the information technology and consumer discretionary sectors overweight detracted from performance.
- The Fund’s underweight allocation to Palantir Technologies Inc. and overweight allocation to e.l.f. Beauty, Inc. detracted from performance.
- The Fund’s security selection in the financials and energy sectors contributed to performance.
- The Fund’s overweight allocation to Robinhood Markets, Inc. and DoorDash, Inc. contributed to performance.
Fund Performance
| AVERAGE ANNUAL TOTAL RETURNS | INCEPTION DATE |
1 YEAR | 5 YEAR | 10 YEAR | |||
| JPMorgan Mid Cap Growth Fund (Class C Shares) | November 4, 1997 | 13.52 | % | 9.23 | % | 10.43 | % |
| JPMorgan Mid Cap Growth Fund (Class C Shares) - excluding sales charge | 14.52 | 9.23 | 10.43 | ||||
| Russell 3000 Index | 15.30 | 15.96 | 12.96 | ||||
| Russell Midcap Growth Index | 26.49 | 12.65 | 12.13 |
KEY FUND STATISTICS
| Fund net assets (000's) | $12,591,027 | |
| Total number of portfolio holdings | 111 | |
| Portfolio turnover rate | 67 | % |
| Total advisory fees paid (000's) | $67,189 |
PORTFOLIO COMPOSITION - SECTOR
(% of Total Investments)
(% of Total Investments)

Material changes to the Fund during the period
Effective November 1, 2024, the Fund’s reduced its advisory fee from 0.65% of the Fund’s average daily net assets to 0.60% of the Fund’s average daily net assets.
Effective November 1, 2024, the Fund’s Adviser, Administrator and/or Principal Underwriter reduced the amount they have contractually agreed to waive fees and/or reimburse the Fund to the extent that total annual operating expenses (excluding acquired fund fees and expenses other than certain money market fund fees, dividend and interest expenses related to short sales, interest, taxes, expenses related to litigation and potential litigation, expenses related to trustee elections and extraordinary expenses) exceed 1.64% of the Fund's Class C Shares average daily net assets to 1.59% of the Fund's Class C Shares average daily net assets.
.
This is a summary of certain changes to the Fund since July 1, 2024. For more complete information, you may review the Fund’s prospectus at www.jpmorganfunds.com/funddocuments or upon request at 1-800-480-4111.
Effective November 1, 2024, the Fund’s reduced its advisory fee from 0.65% of the Fund’s average daily net assets to 0.60% of the Fund’s average daily net assets.
Effective November 1, 2024, the Fund’s Adviser, Administrator and/or Principal Underwriter reduced the amount they have contractually agreed to waive fees and/or reimburse the Fund to the extent that total annual operating expenses (excluding acquired fund fees and expenses other than certain money market fund fees, dividend and interest expenses related to short sales, interest, taxes, expenses related to litigation and potential litigation, expenses related to trustee elections and extraordinary expenses) exceed 1.64% of the Fund's Class C Shares average daily net assets to 1.59% of the Fund's Class C Shares average daily net assets.
This is a summary of certain changes to the Fund since July 1, 2024. For more complete information, you may review the Fund’s prospectus at www.jpmorganfunds.com/funddocuments or upon request at 1-800-480-4111.
This report describes material changes to the Fund that occurred during the reporting period.
What were the Fund costs for the last year?
(based on a hypothetical $10,000 investment)
| Fund (Class) | Costs of a $10,000 investment |
Costs paid as a percentage of a $10,000 investment |
| JPMorgan Mid Cap Growth Fund (Class I Shares) |
$92 | 0.85% |
How did the Fund Perform?
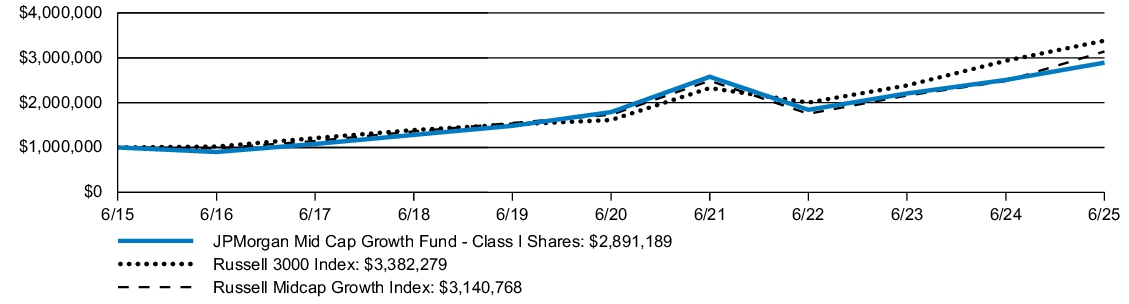
The JPMorgan Mid Cap Growth Fund's Class I Shares returned 15.37% for the twelve months ended June 30, 2025. The Russell 3000 Index returned 15.30% and the Russell Midcap Growth Index (the "Index") returned 26.49% for the twelve months ended June 30, 2025.
- The Fund’s security selection in the information technology and consumer discretionary sectors overweight detracted from performance.
- The Fund’s underweight allocation to Palantir Technologies Inc. and overweight allocation to e.l.f. Beauty, Inc. detracted from performance.
- The Fund’s security selection in the financials and energy sectors contributed to performance.
- The Fund’s overweight allocation to Robinhood Markets, Inc. and DoorDash, Inc. contributed to performance.
Fund Performance
| AVERAGE ANNUAL TOTAL RETURNS | INCEPTION DATE |
1 YEAR | 5 YEAR | 10 YEAR | |||
| JPMorgan Mid Cap Growth Fund (Class I Shares) | March 2, 1989 | 15.37 | % | 10.07 | % | 11.20 | % |
| Russell 3000 Index | 15.30 | 15.96 | 12.96 | ||||
| Russell Midcap Growth Index | 26.49 | 12.65 | 12.13 |
KEY FUND STATISTICS
| Fund net assets (000's) | $12,591,027 | |
| Total number of portfolio holdings | 111 | |
| Portfolio turnover rate | 67 | % |
| Total advisory fees paid (000's) | $67,189 |
PORTFOLIO COMPOSITION - SECTOR
(% of Total Investments)
(% of Total Investments)

Material changes to the Fund during the period
Effective November 1, 2024, the Fund’s reduced its advisory fee from 0.65% of the Fund’s average daily net assets to 0.60% of the Fund’s average daily net assets.
Effective November 1, 2024, the Fund’s Adviser, Administrator and/or Principal Underwriter reduced the amount they have contractually agreed to waive fees and/or reimburse the Fund to the extent that total annual operating expenses (excluding acquired fund fees and expenses other than certain money market fund fees, dividend and interest expenses related to short sales, interest, taxes, expenses related to litigation and potential litigation, expenses related to trustee elections and extraordinary expenses) exceed 0.89% of the Fund's Class I Shares average daily net assets to 0.84% of the Fund's Class I Shares average daily net assets.
.
This is a summary of certain changes to the Fund since July 1, 2024. For more complete information, you may review the Fund’s prospectus at www.jpmorganfunds.com/funddocuments or upon request at 1-800-480-4111.
Effective November 1, 2024, the Fund’s reduced its advisory fee from 0.65% of the Fund’s average daily net assets to 0.60% of the Fund’s average daily net assets.
Effective November 1, 2024, the Fund’s Adviser, Administrator and/or Principal Underwriter reduced the amount they have contractually agreed to waive fees and/or reimburse the Fund to the extent that total annual operating expenses (excluding acquired fund fees and expenses other than certain money market fund fees, dividend and interest expenses related to short sales, interest, taxes, expenses related to litigation and potential litigation, expenses related to trustee elections and extraordinary expenses) exceed 0.89% of the Fund's Class I Shares average daily net assets to 0.84% of the Fund's Class I Shares average daily net assets.
This is a summary of certain changes to the Fund since July 1, 2024. For more complete information, you may review the Fund’s prospectus at www.jpmorganfunds.com/funddocuments or upon request at 1-800-480-4111.
This report describes material changes to the Fund that occurred during the reporting period.
What were the Fund costs for the last year?
(based on a hypothetical $10,000 investment)
| Fund (Class) | Costs of a $10,000 investment |
Costs paid as a percentage of a $10,000 investment |
| JPMorgan Mid Cap Growth Fund (Class R2 Shares) |
$152 | 1.41% |
How did the Fund Perform?
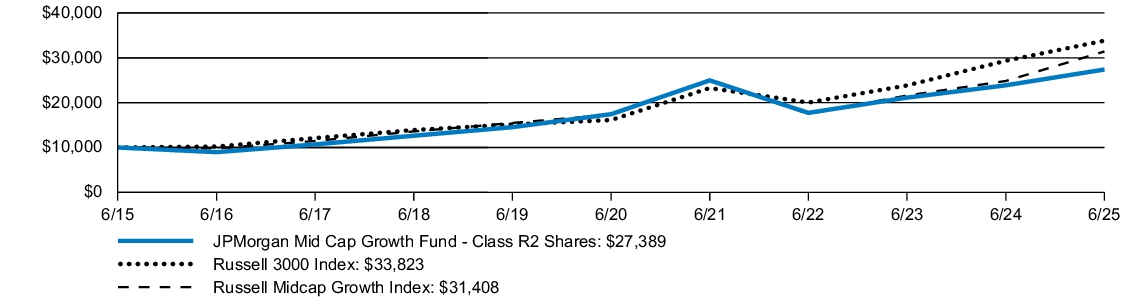
The JPMorgan Mid Cap Growth Fund's Class R2 Shares returned 14.75% for the twelve months ended June 30, 2025. The Russell 3000 Index returned 15.30% and the Russell Midcap Growth Index (the "Index") returned 26.49% for the twelve months ended June 30, 2025.
- The Fund’s security selection in the information technology and consumer discretionary sectors overweight detracted from performance.
- The Fund’s underweight allocation to Palantir Technologies Inc. and overweight allocation to e.l.f. Beauty, Inc. detracted from performance.
- The Fund’s security selection in the financials and energy sectors contributed to performance.
- The Fund’s overweight allocation to Robinhood Markets, Inc. and DoorDash, Inc. contributed to performance.
Fund Performance
| AVERAGE ANNUAL TOTAL RETURNS | INCEPTION DATE |
1 YEAR | 5 YEAR | 10 YEAR | |||
| JPMorgan Mid Cap Growth Fund (Class R2 Shares) | June 19, 2009 | 14.75 | % | 9.46 | % | 10.60 | % |
| Russell 3000 Index | 15.30 | 15.96 | 12.96 | ||||
| Russell Midcap Growth Index | 26.49 | 12.65 | 12.13 |
KEY FUND STATISTICS
| Fund net assets (000's) | $12,591,027 | |
| Total number of portfolio holdings | 111 | |
| Portfolio turnover rate | 67 | % |
| Total advisory fees paid (000's) | $67,189 |
PORTFOLIO COMPOSITION - SECTOR
(% of Total Investments)
(% of Total Investments)
Material changes to the Fund during the period
Effective November 1, 2024, the Fund’s reduced its advisory fee from 0.65% of the Fund’s average daily net assets to 0.60% of the Fund’s average daily net assets.
Effective November 1, 2024, the Fund’s Adviser, Administrator and/or Principal Underwriter reduced the amount they have contractually agreed to waive fees and/or reimburse the Fund to the extent that total annual operating expenses (excluding acquired fund fees and expenses other than certain money market fund fees, dividend and interest expenses related to short sales, interest, taxes, expenses related to litigation and potential litigation, expenses related to trustee elections and extraordinary expenses) exceed 1.45% of the Fund's Class R2 Shares average daily net assets to 1.40% of the Fund's Class R2 Shares average daily net assets.
.
This is a summary of certain changes to the Fund since July 1, 2024. For more complete information, you may review the Fund’s prospectus at www.jpmorganfunds.com/funddocuments or upon request at 1-800-480-4111.
Effective November 1, 2024, the Fund’s reduced its advisory fee from 0.65% of the Fund’s average daily net assets to 0.60% of the Fund’s average daily net assets.
Effective November 1, 2024, the Fund’s Adviser, Administrator and/or Principal Underwriter reduced the amount they have contractually agreed to waive fees and/or reimburse the Fund to the extent that total annual operating expenses (excluding acquired fund fees and expenses other than certain money market fund fees, dividend and interest expenses related to short sales, interest, taxes, expenses related to litigation and potential litigation, expenses related to trustee elections and extraordinary expenses) exceed 1.45% of the Fund's Class R2 Shares average daily net assets to 1.40% of the Fund's Class R2 Shares average daily net assets.
This is a summary of certain changes to the Fund since July 1, 2024. For more complete information, you may review the Fund’s prospectus at www.jpmorganfunds.com/funddocuments or upon request at 1-800-480-4111.
This report describes material changes to the Fund that occurred during the reporting period.
What were the Fund costs for the last year?
(based on a hypothetical $10,000 investment)
| Fund (Class) | Costs of a $10,000 investment |
Costs paid as a percentage of a $10,000 investment |
| JPMorgan Mid Cap Growth Fund (Class R3 Shares) |
$125 | 1.16% |
How did the Fund Perform?
The JPMorgan Mid Cap Growth Fund's Class R3 Shares returned 15.02% for the twelve months ended June 30, 2025. The Russell 3000 Index returned 15.30% and the Russell Midcap Growth Index (the "Index") returned 26.49% for the twelve months ended June 30, 2025.
- The Fund’s security selection in the information technology and consumer discretionary sectors overweight detracted from performance.
- The Fund’s underweight allocation to Palantir Technologies Inc. and overweight allocation to e.l.f. Beauty, Inc. detracted from performance.
- The Fund’s security selection in the financials and energy sectors contributed to performance.
- The Fund’s overweight allocation to Robinhood Markets, Inc. and DoorDash, Inc. contributed to performance.
Fund Performance

| AVERAGE ANNUAL TOTAL RETURNS | INCEPTION DATE |
1 YEAR | 5 YEAR | 10 YEAR | |||
| JPMorgan Mid Cap Growth Fund (Class R3 Shares) | September 9, 2016 | 15.02 | % | 9.73 | % | 10.86 | % |
| Russell 3000 Index | 15.30 | 15.96 | 12.96 | ||||
| Russell Midcap Growth Index | 26.49 | 12.65 | 12.13 |
KEY FUND STATISTICS
| Fund net assets (000's) | $12,591,027 | |
| Total number of portfolio holdings | 111 | |
| Portfolio turnover rate | 67 | % |
| Total advisory fees paid (000's) | $67,189 |
PORTFOLIO COMPOSITION - SECTOR
(% of Total Investments)
(% of Total Investments)

Material changes to the Fund during the period
Effective November 1, 2024, the Fund’s reduced its advisory fee from 0.65% of the Fund’s average daily net assets to 0.60% of the Fund’s average daily net assets.
Effective November 1, 2024, the Fund’s Adviser, Administrator and/or Principal Underwriter reduced the amount they have contractually agreed to waive fees and/or reimburse the Fund to the extent that total annual operating expenses (excluding acquired fund fees and expenses other than certain money market fund fees, dividend and interest expenses related to short sales, interest, taxes, expenses related to litigation and potential litigation, expenses related to trustee elections and extraordinary expenses) exceed 1.20% of the Fund's Class R3 Shares average daily net assets to 1.15% of the Fund's Class R3 Shares average daily net assets.
.
This is a summary of certain changes to the Fund since July 1, 2024. For more complete information, you may review the Fund’s prospectus at www.jpmorganfunds.com/funddocuments or upon request at 1-800-480-4111.
Effective November 1, 2024, the Fund’s reduced its advisory fee from 0.65% of the Fund’s average daily net assets to 0.60% of the Fund’s average daily net assets.
Effective November 1, 2024, the Fund’s Adviser, Administrator and/or Principal Underwriter reduced the amount they have contractually agreed to waive fees and/or reimburse the Fund to the extent that total annual operating expenses (excluding acquired fund fees and expenses other than certain money market fund fees, dividend and interest expenses related to short sales, interest, taxes, expenses related to litigation and potential litigation, expenses related to trustee elections and extraordinary expenses) exceed 1.20% of the Fund's Class R3 Shares average daily net assets to 1.15% of the Fund's Class R3 Shares average daily net assets.
This is a summary of certain changes to the Fund since July 1, 2024. For more complete information, you may review the Fund’s prospectus at www.jpmorganfunds.com/funddocuments or upon request at 1-800-480-4111.
This report describes material changes to the Fund that occurred during the reporting period.
What were the Fund costs for the last year?
(based on a hypothetical $10,000 investment)
| Fund (Class) | Costs of a $10,000 investment |
Costs paid as a percentage of a $10,000 investment |
| JPMorgan Mid Cap Growth Fund (Class R4 Shares) |
$98 | 0.91% |
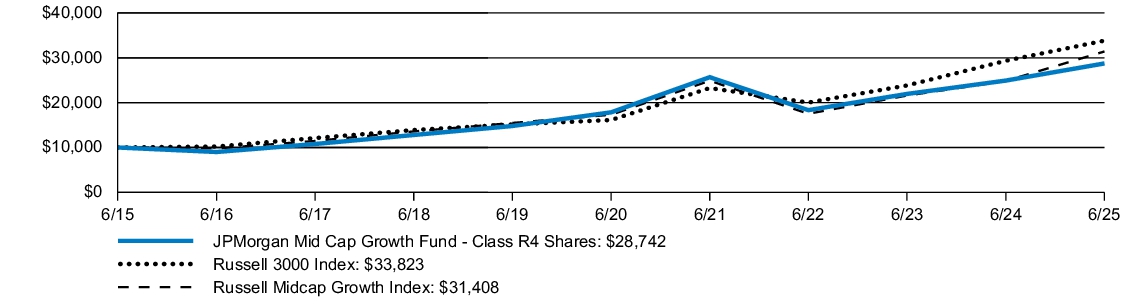
How did the Fund Perform?
The JPMorgan Mid Cap Growth Fund's Class R4 Shares returned 15.33% for the twelve months ended June 30, 2025. The Russell 3000 Index returned 15.30% and the Russell Midcap Growth Index (the "Index") returned 26.49% for the twelve months ended June 30, 2025.
- The Fund’s security selection in the information technology and consumer discretionary sectors overweight detracted from performance.
- The Fund’s underweight allocation to Palantir Technologies Inc. and overweight allocation to e.l.f. Beauty, Inc. detracted from performance.
- The Fund’s security selection in the financials and energy sectors contributed to performance.
- The Fund’s overweight allocation to Robinhood Markets, Inc. and DoorDash, Inc. contributed to performance.
Fund Performance
| AVERAGE ANNUAL TOTAL RETURNS | INCEPTION DATE |
1 YEAR | 5 YEAR | 10 YEAR | |||
| JPMorgan Mid Cap Growth Fund (Class R4 Shares) | September 9, 2016 | 15.33 | % | 10.00 | % | 11.14 | % |
| Russell 3000 Index | 15.30 | 15.96 | 12.96 | ||||
| Russell Midcap Growth Index | 26.49 | 12.65 | 12.13 |
KEY FUND STATISTICS
| Fund net assets (000's) | $12,591,027 | |
| Total number of portfolio holdings | 111 | |
| Portfolio turnover rate | 67 | % |
| Total advisory fees paid (000's) | $67,189 |
PORTFOLIO COMPOSITION - SECTOR
(% of Total Investments)
(% of Total Investments)

Material changes to the Fund during the period
Effective November 1, 2024, the Fund’s reduced its advisory fee from 0.65% of the Fund’s average daily net assets to 0.60% of the Fund’s average daily net assets.
Effective November 1, 2024, the Fund’s Adviser, Administrator and/or Principal Underwriter reduced the amount they have contractually agreed to waive fees and/or reimburse the Fund to the extent that total annual operating expenses (excluding acquired fund fees and expenses other than certain money market fund fees, dividend and interest expenses related to short sales, interest, taxes, expenses related to litigation and potential litigation, expenses related to trustee elections and extraordinary expenses) exceed 0.95% of the Fund's Class R4 Shares average daily net assets to 0.90% of the Fund's Class R4 Shares average daily net assets.
.
This is a summary of certain changes to the Fund since July 1, 2024. For more complete information, you may review the Fund’s prospectus at www.jpmorganfunds.com/funddocuments or upon request at 1-800-480-4111.
Effective November 1, 2024, the Fund’s reduced its advisory fee from 0.65% of the Fund’s average daily net assets to 0.60% of the Fund’s average daily net assets.
Effective November 1, 2024, the Fund’s Adviser, Administrator and/or Principal Underwriter reduced the amount they have contractually agreed to waive fees and/or reimburse the Fund to the extent that total annual operating expenses (excluding acquired fund fees and expenses other than certain money market fund fees, dividend and interest expenses related to short sales, interest, taxes, expenses related to litigation and potential litigation, expenses related to trustee elections and extraordinary expenses) exceed 0.95% of the Fund's Class R4 Shares average daily net assets to 0.90% of the Fund's Class R4 Shares average daily net assets.
This is a summary of certain changes to the Fund since July 1, 2024. For more complete information, you may review the Fund’s prospectus at www.jpmorganfunds.com/funddocuments or upon request at 1-800-480-4111.
This report describes material changes to the Fund that occurred during the reporting period.
What were the Fund costs for the last year?
(based on a hypothetical $10,000 investment)
| Fund (Class) | Costs of a $10,000 investment |
Costs paid as a percentage of a $10,000 investment |
| JPMorgan Mid Cap Growth Fund (Class R5 Shares) |
$81 | 0.75% |
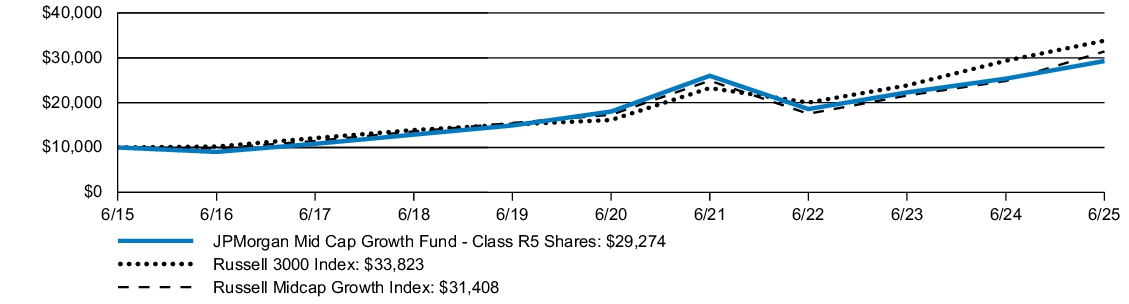
How did the Fund Perform?
The JPMorgan Mid Cap Growth Fund's Class R5 Shares returned 15.49% for the twelve months ended June 30, 2025. The Russell 3000 Index returned 15.30% and the Russell Midcap Growth Index (the "Index") returned 26.49% for the twelve months ended June 30, 2025.
- The Fund’s security selection in the information technology and consumer discretionary sectors overweight detracted from performance.
- The Fund’s underweight allocation to Palantir Technologies Inc. and overweight allocation to e.l.f. Beauty, Inc. detracted from performance.
- The Fund’s security selection in the financials and energy sectors contributed to performance.
- The Fund’s overweight allocation to Robinhood Markets, Inc. and DoorDash, Inc. contributed to performance.
Fund Performance
| AVERAGE ANNUAL TOTAL RETURNS | INCEPTION DATE |
1 YEAR | 5 YEAR | 10 YEAR | |||
| JPMorgan Mid Cap Growth Fund (Class R5 Shares) | November 1, 2011 | 15.49 | % | 10.19 | % | 11.34 | % |
| Russell 3000 Index | 15.30 | 15.96 | 12.96 | ||||
| Russell Midcap Growth Index | 26.49 | 12.65 | 12.13 |
KEY FUND STATISTICS
| Fund net assets (000's) | $12,591,027 | |
| Total number of portfolio holdings | 111 | |
| Portfolio turnover rate | 67 | % |
| Total advisory fees paid (000's) | $67,189 |
PORTFOLIO COMPOSITION - SECTOR
(% of Total Investments)
(% of Total Investments)

Material changes to the Fund during the period
Effective November 1, 2024, the Fund’s reduced its advisory fee from 0.65% of the Fund’s average daily net assets to 0.60% of the Fund’s average daily net assets.
Effective November 1, 2024, the Fund’s Adviser, Administrator and/or Principal Underwriter reduced the amount they have contractually agreed to waive fees and/or reimburse the Fund to the extent that total annual operating expenses (excluding acquired fund fees and expenses other than certain money market fund fees, dividend and interest expenses related to short sales, interest, taxes, expenses related to litigation and potential litigation, expenses related to trustee elections and extraordinary expenses) exceed 0.79% of the Fund's Class R5 Shares average daily net assets to 0.74% of the Fund's Class R5 Shares average daily net assets.
.
This is a summary of certain changes to the Fund since July 1, 2024. For more complete information, you may review the Fund’s prospectus at www.jpmorganfunds.com/funddocuments or upon request at 1-800-480-4111.
Effective November 1, 2024, the Fund’s reduced its advisory fee from 0.65% of the Fund’s average daily net assets to 0.60% of the Fund’s average daily net assets.
Effective November 1, 2024, the Fund’s Adviser, Administrator and/or Principal Underwriter reduced the amount they have contractually agreed to waive fees and/or reimburse the Fund to the extent that total annual operating expenses (excluding acquired fund fees and expenses other than certain money market fund fees, dividend and interest expenses related to short sales, interest, taxes, expenses related to litigation and potential litigation, expenses related to trustee elections and extraordinary expenses) exceed 0.79% of the Fund's Class R5 Shares average daily net assets to 0.74% of the Fund's Class R5 Shares average daily net assets.
This is a summary of certain changes to the Fund since July 1, 2024. For more complete information, you may review the Fund’s prospectus at www.jpmorganfunds.com/funddocuments or upon request at 1-800-480-4111.
This report describes material changes to the Fund that occurred during the reporting period.
What were the Fund costs for the last year?
(based on a hypothetical $10,000 investment)
| Fund (Class) | Costs of a $10,000 investment |
Costs paid as a percentage of a $10,000 investment |
| JPMorgan Mid Cap Growth Fund (Class R6 Shares) |
$71 | 0.66% |
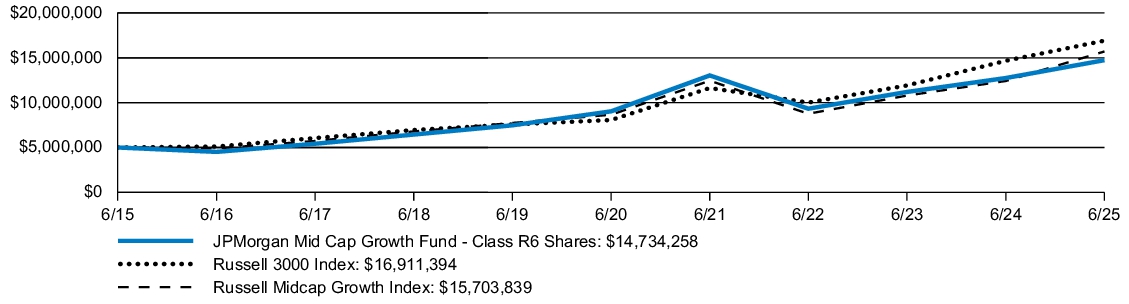
How did the Fund Perform?
The JPMorgan Mid Cap Growth Fund's Class R6 Shares returned 15.61% for the twelve months ended June 30, 2025. The Russell 3000 Index returned 15.30% and the Russell Midcap Growth Index (the "Index") returned 26.49% for the twelve months ended June 30, 2025.
- The Fund’s security selection in the information technology and consumer discretionary sectors overweight detracted from performance.
- The Fund’s underweight allocation to Palantir Technologies Inc. and overweight allocation to e.l.f. Beauty, Inc. detracted from performance.
- The Fund’s security selection in the financials and energy sectors contributed to performance.
- The Fund’s overweight allocation to Robinhood Markets, Inc. and DoorDash, Inc. contributed to performance.
Fund Performance
| AVERAGE ANNUAL TOTAL RETURNS | INCEPTION DATE |
1 YEAR | 5 YEAR | 10 YEAR | |||
| JPMorgan Mid Cap Growth Fund (Class R6 Shares) | November 1, 2011 | 15.61 | % | 10.28 | % | 11.41 | % |
| Russell 3000 Index | 15.30 | 15.96 | 12.96 | ||||
| Russell Midcap Growth Index | 26.49 | 12.65 | 12.13 |
KEY FUND STATISTICS
| Fund net assets (000's) | $12,591,027 | |
| Total number of portfolio holdings | 111 | |
| Portfolio turnover rate | 67 | % |
| Total advisory fees paid (000's) | $67,189 |
PORTFOLIO COMPOSITION - SECTOR
(% of Total Investments)
(% of Total Investments)

Material changes to the Fund during the period
Effective November 1, 2024, the Fund’s reduced its advisory fee from 0.65% of the Fund’s average daily net assets to 0.60% of the Fund’s average daily net assets.
Effective November 1, 2024, the Fund’s Adviser, Administrator and/or Principal Underwriter reduced the amount they have contractually agreed to waive fees and/or reimburse the Fund to the extent that total annual operating expenses (excluding acquired fund fees and expenses other than certain money market fund fees, dividend and interest expenses related to short sales, interest, taxes, expenses related to litigation and potential litigation, expenses related to trustee elections and extraordinary expenses) exceed 0.70% of the Fund's Class R6 Shares average daily net assets to 0.65% of the Fund's Class R6 Shares average daily net assets.
.
This is a summary of certain changes to the Fund since July 1, 2024. For more complete information, you may review the Fund’s prospectus at www.jpmorganfunds.com/funddocuments or upon request at 1-800-480-4111.
Effective November 1, 2024, the Fund’s reduced its advisory fee from 0.65% of the Fund’s average daily net assets to 0.60% of the Fund’s average daily net assets.
Effective November 1, 2024, the Fund’s Adviser, Administrator and/or Principal Underwriter reduced the amount they have contractually agreed to waive fees and/or reimburse the Fund to the extent that total annual operating expenses (excluding acquired fund fees and expenses other than certain money market fund fees, dividend and interest expenses related to short sales, interest, taxes, expenses related to litigation and potential litigation, expenses related to trustee elections and extraordinary expenses) exceed 0.70% of the Fund's Class R6 Shares average daily net assets to 0.65% of the Fund's Class R6 Shares average daily net assets.
This is a summary of certain changes to the Fund since July 1, 2024. For more complete information, you may review the Fund’s prospectus at www.jpmorganfunds.com/funddocuments or upon request at 1-800-480-4111.
What were the Fund costs for the last year?
(based on a hypothetical $10,000 investment)
| Fund (Class) | Costs of a $10,000 investment |
Costs paid as a percentage of a $10,000 investment |
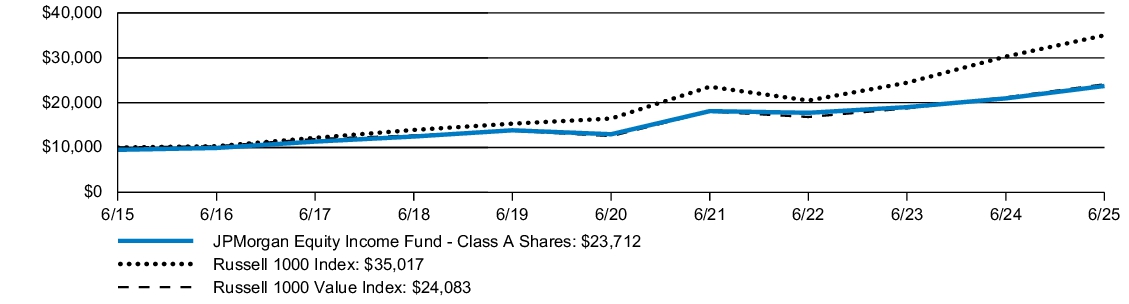
| JPMorgan Equity Income Fund (Class A Shares) |
$101 | 0.95% |
How did the Fund Perform?
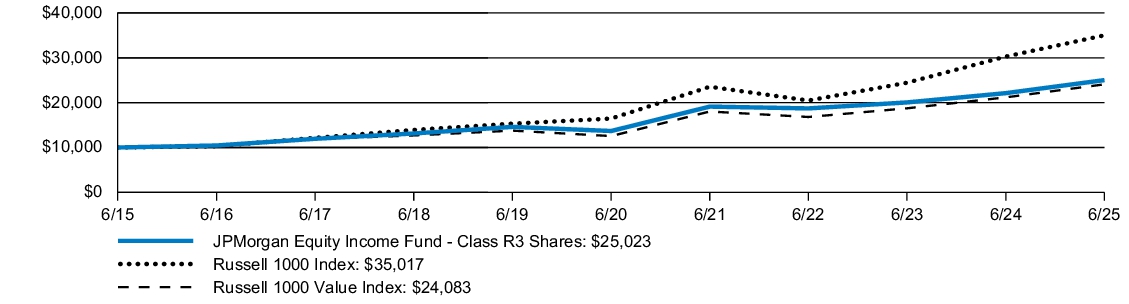
The JPMorgan Equity Income Fund's Class A Shares, without a sales charge, returned 13.17% for the twelve months ended June 30, 2025. The Russell 1000 Index returned 15.66% and the Russell 1000 Value Index (the "Index") returned 13.70% for the twelve months ended June 30, 2025.
- The Fund’s security selection in the industrials and communication services detracted from performance.
- The Fund’s underweight allocation to JPMorgan Chase & Co. and Berkshire Hathaway detracted from performance.
- The Fund’s security selection in the financials and consumer staples sectors contributed to performance.
- The Fund’s overweight allocation to Wells Fargo & Company and Philip Morris International Inc. contributed to performance.
Fund Performance
| AVERAGE ANNUAL TOTAL RETURNS | INCEPTION DATE |
1 YEAR | 5 YEAR | 10 YEAR | |||
| JPMorgan Equity Income Fund (Class A Shares) | February 18, 1992 | 7.23 | % | 11.64 | % | 9.02 | % |
| JPMorgan Equity Income Fund (Class A Shares) - excluding sales charge | 13.17 | 12.85 | 9.61 | ||||
| Russell 1000 Index | 15.66 | 16.30 | 13.35 | ||||
| Russell 1000 Value Index | 13.70 | 13.93 | 9.19 |
KEY FUND STATISTICS
| Fund net assets (000's) | $43,836,022 | |
| Total number of portfolio holdings | 85 | |
| Portfolio turnover rate | 20 | % |
| Total advisory fees paid (000's) | $178,869 |
PORTFOLIO COMPOSITION - SECTOR
(% of Total Investments)
(% of Total Investments)

What were the Fund costs for the last year?
(based on a hypothetical $10,000 investment)
| Fund (Class) | Costs of a $10,000 investment |
Costs paid as a percentage of a $10,000 investment |
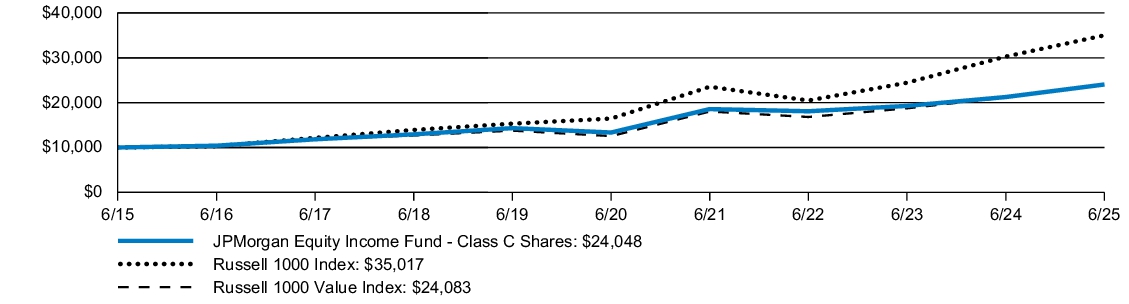
| JPMorgan Equity Income Fund (Class C Shares) |
$154 | 1.45% |
How did the Fund Perform?
The JPMorgan Equity Income Fund's Class C Shares, without a sales charge, returned 12.63% for the twelve months ended June 30, 2025. The Russell 1000 Index returned 15.66% and the Russell 1000 Value Index (the "Index") returned 13.70% for the twelve months ended June 30, 2025.
- The Fund’s security selection in the industrials and communication services detracted from performance.
- The Fund’s underweight allocation to JPMorgan Chase & Co. and Berkshire Hathaway detracted from performance.
- The Fund’s security selection in the financials and consumer staples sectors contributed to performance.
- The Fund’s overweight allocation to Wells Fargo & Company and Philip Morris International Inc. contributed to performance.
Fund Performance
| AVERAGE ANNUAL TOTAL RETURNS | INCEPTION DATE |
1 YEAR | 5 YEAR | 10 YEAR | |||
| JPMorgan Equity Income Fund (Class C Shares) | November 4, 1997 | 11.63 | % | 12.29 | % | 9.17 | % |
| JPMorgan Equity Income Fund (Class C Shares) - excluding sales charge | 12.63 | 12.29 | 9.17 | ||||
| Russell 1000 Index | 15.66 | 16.30 | 13.35 | ||||
| Russell 1000 Value Index | 13.70 | 13.93 | 9.19 |
KEY FUND STATISTICS
| Fund net assets (000's) | $43,836,022 | |
| Total number of portfolio holdings | 85 | |
| Portfolio turnover rate | 20 | % |
| Total advisory fees paid (000's) | $178,869 |
PORTFOLIO COMPOSITION - SECTOR
(% of Total Investments)
(% of Total Investments)

What were the Fund costs for the last year?
(based on a hypothetical $10,000 investment)
| Fund (Class) | Costs of a $10,000 investment |
Costs paid as a percentage of a $10,000 investment |
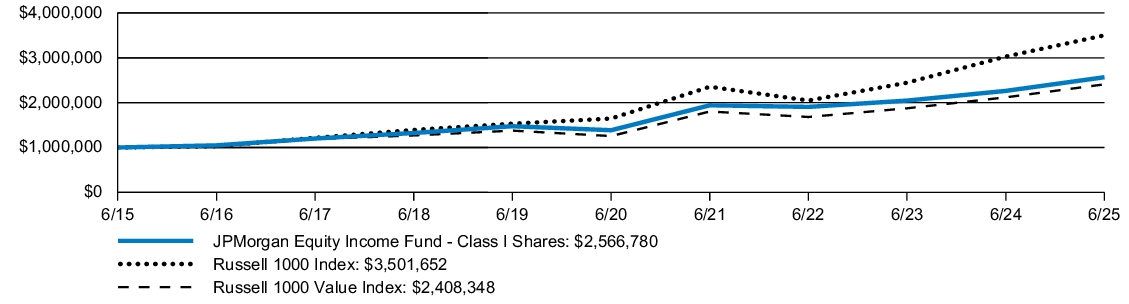
| JPMorgan Equity Income Fund (Class I Shares) |
$74 | 0.70% |
How did the Fund Perform?
The JPMorgan Equity Income Fund's Class I Shares returned 13.46% for the twelve months ended June 30, 2025. The Russell 1000 Index returned 15.66% and the Russell 1000 Value Index (the "Index") returned 13.70% for the twelve months ended June 30, 2025.
- The Fund’s security selection in the industrials and communication services detracted from performance.
- The Fund’s underweight allocation to JPMorgan Chase & Co. and Berkshire Hathaway detracted from performance.
- The Fund’s security selection in the financials and consumer staples sectors contributed to performance.
- The Fund’s overweight allocation to Wells Fargo & Company and Philip Morris International Inc. contributed to performance.
Fund Performance
| AVERAGE ANNUAL TOTAL RETURNS | INCEPTION DATE |
1 YEAR | 5 YEAR | 10 YEAR | |||
| JPMorgan Equity Income Fund (Class I Shares) | July 2, 1987 | 13.46 | % | 13.14 | % | 9.89 | % |
| Russell 1000 Index | 15.66 | 16.30 | 13.35 | ||||
| Russell 1000 Value Index | 13.70 | 13.93 | 9.19 |
KEY FUND STATISTICS
| Fund net assets (000's) | $43,836,022 | |
| Total number of portfolio holdings | 85 | |
| Portfolio turnover rate | 20 | % |
| Total advisory fees paid (000's) | $178,869 |
PORTFOLIO COMPOSITION - SECTOR
(% of Total Investments)
(% of Total Investments)

What were the Fund costs for the last year?
(based on a hypothetical $10,000 investment)
| Fund (Class) | Costs of a $10,000 investment |
Costs paid as a percentage of a $10,000 investment |
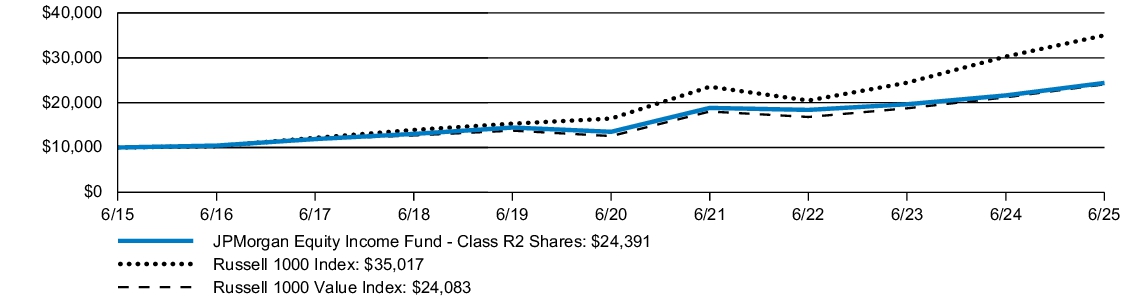
| JPMorgan Equity Income Fund (Class R2 Shares) |
$128 | 1.20% |
How did the Fund Perform?
The JPMorgan Equity Income Fund's Class R2 Shares returned 12.87% for the twelve months ended June 30, 2025. The Russell 1000 Index returned 15.66% and the Russell 1000 Value Index (the "Index") returned 13.70% for the twelve months ended June 30, 2025.
- The Fund’s security selection in the industrials and communication services detracted from performance.
- The Fund’s underweight allocation to JPMorgan Chase & Co. and Berkshire Hathaway detracted from performance.
- The Fund’s security selection in the financials and consumer staples sectors contributed to performance.
- The Fund’s overweight allocation to Wells Fargo & Company and Philip Morris International Inc. contributed to performance.
Fund Performance
| AVERAGE ANNUAL TOTAL RETURNS | INCEPTION DATE |
1 YEAR | 5 YEAR | 10 YEAR | |||
| JPMorgan Equity Income Fund (Class R2 Shares) | February 28, 2011 | 12.87 | % | 12.56 | % | 9.33 | % |
| Russell 1000 Index | 15.66 | 16.30 | 13.35 | ||||
| Russell 1000 Value Index | 13.70 | 13.93 | 9.19 |
KEY FUND STATISTICS
| Fund net assets (000's) | $43,836,022 | |
| Total number of portfolio holdings | 85 | |
| Portfolio turnover rate | 20 | % |
| Total advisory fees paid (000's) | $178,869 |
PORTFOLIO COMPOSITION - SECTOR
(% of Total Investments)
(% of Total Investments)

What were the Fund costs for the last year?
(based on a hypothetical $10,000 investment)
| Fund (Class) | Costs of a $10,000 investment |
Costs paid as a percentage of a $10,000 investment |
| JPMorgan Equity Income Fund (Class R3 Shares) |
$101 | 0.95% |
How did the Fund Perform?
The JPMorgan Equity Income Fund's Class R3 Shares returned 13.13% for the twelve months ended June 30, 2025. The Russell 1000 Index returned 15.66% and the Russell 1000 Value Index (the "Index") returned 13.70% for the twelve months ended June 30, 2025.
- The Fund’s security selection in the industrials and communication services detracted from performance.
- The Fund’s underweight allocation to JPMorgan Chase & Co. and Berkshire Hathaway detracted from performance.
- The Fund’s security selection in the financials and consumer staples sectors contributed to performance.
- The Fund’s overweight allocation to Wells Fargo & Company and Philip Morris International Inc. contributed to performance.
Fund Performance
| AVERAGE ANNUAL TOTAL RETURNS | INCEPTION DATE |
1 YEAR | 5 YEAR | 10 YEAR | |||
| JPMorgan Equity Income Fund (Class R3 Shares) | September 9, 2016 | 13.13 | % | 12.84 | % | 9.61 | % |
| Russell 1000 Index | 15.66 | 16.30 | 13.35 | ||||
| Russell 1000 Value Index | 13.70 | 13.93 | 9.19 |
KEY FUND STATISTICS
| Fund net assets (000's) | $43,836,022 | |
| Total number of portfolio holdings | 85 | |
| Portfolio turnover rate | 20 | % |
| Total advisory fees paid (000's) | $178,869 |
PORTFOLIO COMPOSITION - SECTOR
(% of Total Investments)
(% of Total Investments)

What were the Fund costs for the last year?
(based on a hypothetical $10,000 investment)
| Fund (Class) | Costs of a $10,000 investment |
Costs paid as a percentage of a $10,000 investment |
| JPMorgan Equity Income Fund (Class R4 Shares) |
$74 | 0.70% |
How did the Fund Perform?
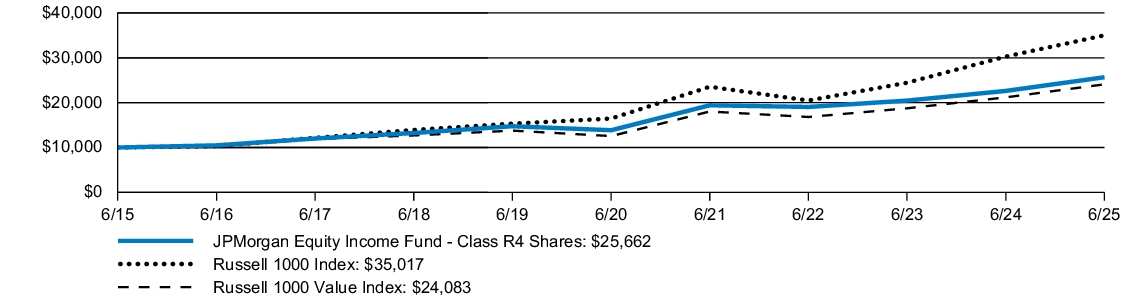
The JPMorgan Equity Income Fund's Class R4 Shares returned 13.47% for the twelve months ended June 30, 2025. The Russell 1000 Index returned 15.66% and the Russell 1000 Value Index (the "Index") returned 13.70% for the twelve months ended June 30, 2025.
- The Fund’s security selection in the industrials and communication services detracted from performance.
- The Fund’s underweight allocation to JPMorgan Chase & Co. and Berkshire Hathaway detracted from performance.
- The Fund’s security selection in the financials and consumer staples sectors contributed to performance.
- The Fund’s overweight allocation to Wells Fargo & Company and Philip Morris International Inc. contributed to performance.
Fund Performance
| AVERAGE ANNUAL TOTAL RETURNS | INCEPTION DATE |
1 YEAR | 5 YEAR | 10 YEAR | |||
| JPMorgan Equity Income Fund (Class R4 Shares) | September 9, 2016 | 13.47 | % | 13.13 | % | 9.88 | % |
| Russell 1000 Index | 15.66 | 16.30 | 13.35 | ||||
| Russell 1000 Value Index | 13.70 | 13.93 | 9.19 |
KEY FUND STATISTICS
| Fund net assets (000's) | $43,836,022 | |
| Total number of portfolio holdings | 85 | |
| Portfolio turnover rate | 20 | % |
| Total advisory fees paid (000's) | $178,869 |
PORTFOLIO COMPOSITION - SECTOR
(% of Total Investments)
(% of Total Investments)

What were the Fund costs for the last year?
(based on a hypothetical $10,000 investment)
| Fund (Class) | Costs of a $10,000 investment |
Costs paid as a percentage of a $10,000 investment |
| JPMorgan Equity Income Fund (Class R5 Shares) |
$58 | 0.55% |
How did the Fund Perform?
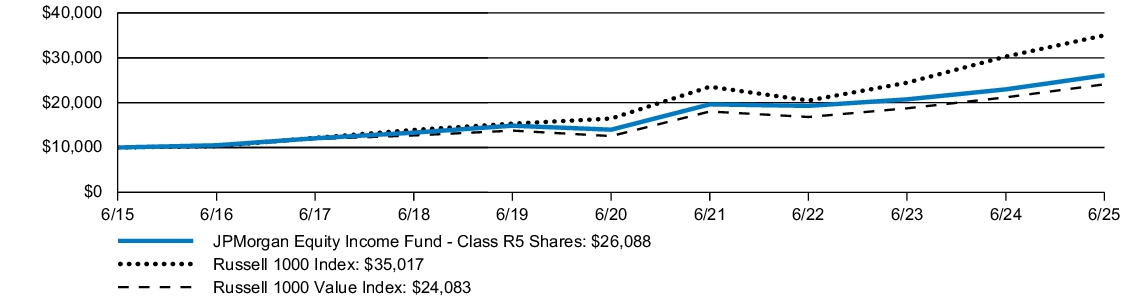
The JPMorgan Equity Income Fund's Class R5 Shares returned 13.62% for the twelve months ended June 30, 2025. The Russell 1000 Index returned 15.66% and the Russell 1000 Value Index (the "Index") returned 13.70% for the twelve months ended June 30, 2025.
- The Fund’s security selection in the industrials and communication services detracted from performance.
- The Fund’s underweight allocation to JPMorgan Chase & Co. and Berkshire Hathaway detracted from performance.
- The Fund’s security selection in the financials and consumer staples sectors contributed to performance.
- The Fund’s overweight allocation to Wells Fargo & Company and Philip Morris International Inc. contributed to performance.
Fund Performance
| AVERAGE ANNUAL TOTAL RETURNS | INCEPTION DATE |
1 YEAR | 5 YEAR | 10 YEAR | |||
| JPMorgan Equity Income Fund (Class R5 Shares) | February 28, 2011 | 13.62 | % | 13.31 | % | 10.06 | % |
| Russell 1000 Index | 15.66 | 16.30 | 13.35 | ||||
| Russell 1000 Value Index | 13.70 | 13.93 | 9.19 |
KEY FUND STATISTICS
| Fund net assets (000's) | $43,836,022 | |
| Total number of portfolio holdings | 85 | |
| Portfolio turnover rate | 20 | % |
| Total advisory fees paid (000's) | $178,869 |
PORTFOLIO COMPOSITION - SECTOR
(% of Total Investments)
(% of Total Investments)

What were the Fund costs for the last year?
(based on a hypothetical $10,000 investment)
| Fund (Class) | Costs of a $10,000 investment |
Costs paid as a percentage of a $10,000 investment |
| JPMorgan Equity Income Fund (Class R6 Shares) |
$48 | 0.45% |
How did the Fund Perform?
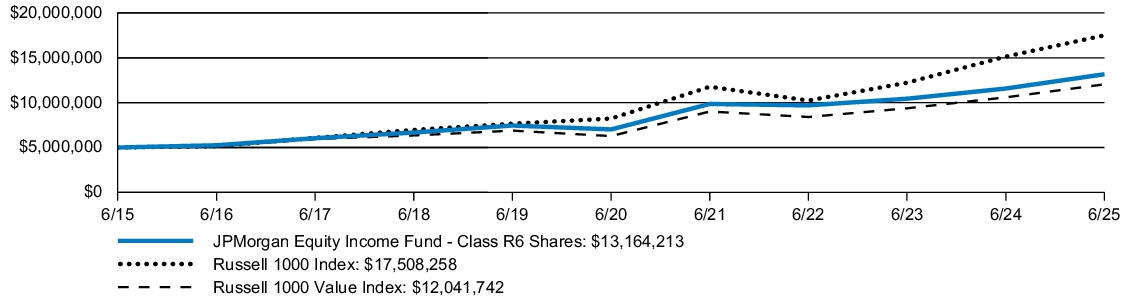
The JPMorgan Equity Income Fund's Class R6 Shares returned 13.74% for the twelve months ended June 30, 2025. The Russell 1000 Index returned 15.66% and the Russell 1000 Value Index (the "Index") returned 13.70% for the twelve months ended June 30, 2025.
- The Fund’s security selection in the industrials and communication services detracted from performance.
- The Fund’s underweight allocation to JPMorgan Chase & Co. and Berkshire Hathaway detracted from performance.
- The Fund’s security selection in the financials and consumer staples sectors contributed to performance.
- The Fund’s overweight allocation to Wells Fargo & Company and Philip Morris International Inc. contributed to performance.
Fund Performance
| AVERAGE ANNUAL TOTAL RETURNS | INCEPTION DATE |
1 YEAR | 5 YEAR | 10 YEAR | |||
| JPMorgan Equity Income Fund (Class R6 Shares) | January 31, 2012 | 13.74 | % | 13.42 | % | 10.16 | % |
| Russell 1000 Index | 15.66 | 16.30 | 13.35 | ||||
| Russell 1000 Value Index | 13.70 | 13.93 | 9.19 |
KEY FUND STATISTICS
| Fund net assets (000's) | $43,836,022 | |
| Total number of portfolio holdings | 85 | |
| Portfolio turnover rate | 20 | % |
| Total advisory fees paid (000's) | $178,869 |
PORTFOLIO COMPOSITION - SECTOR
(% of Total Investments)
(% of Total Investments)
What were the Fund costs for the last year?
(based on a hypothetical $10,000 investment)
| Fund (Class) | Costs of a $10,000 investment |
Costs paid as a percentage of a $10,000 investment |
| JPMorgan Equity Index Fund (Class A Shares) |
$48 | 0.45% |
How did the Fund Perform?
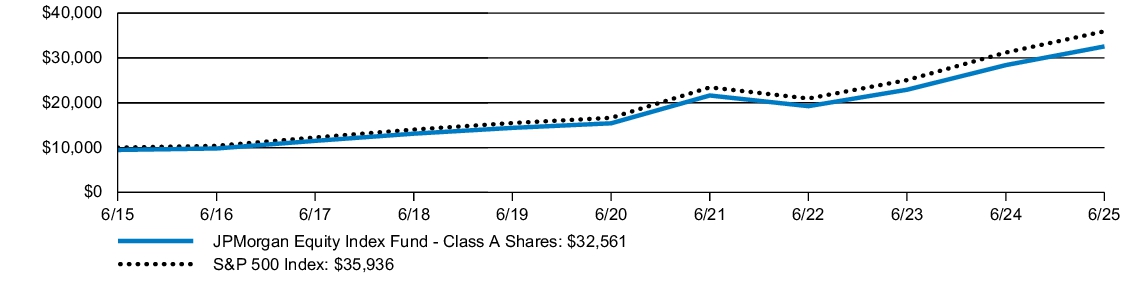
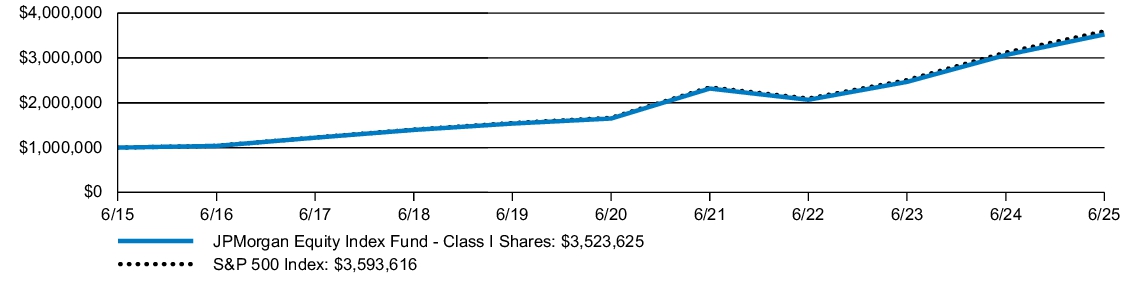
The JPMorgan Equity Index Fund's Class A Shares, without a sales charge, returned 14.66% for the twelve months ended June 30, 2025. The S&P 500 Index (the "Index") returned 15.16% for the twelve months ended June 30, 2025.
- Consistent with its indexing strategy, the Fund closely tracked the total return of the Index.
- During the period, solid earnings growth provided good returns for U.S. large-cap equities. The first half of 2025 was characterized by high levels of market volatility. Concerns around trade policy and the effects on growth caused a sizeable sell-off late in the first quarter and into the second quarter. However, advancements in trade discussions and a temporary postponement of tariff increases alleviated recession fears, fueling a broad-based market rally to close out the period.
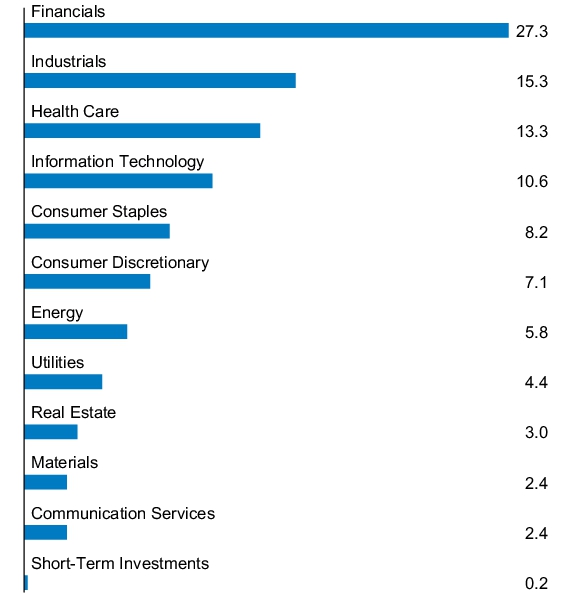
- The majority of sectors in the Index produced positive returns. Financials and utilities were the best-performing sectors with both providing returns of over 20%. Health care and energy were the only sectors with negative returns, with both producing returns in the mid-single digit negative range.
- The Fund achieved its indexing objective by following a full replication approach, owning all stocks in the Index in nearly the same weights. Additional cash was minimized, and cash held was equitized with futures to limit any drag on performance.
Fund Performance
| AVERAGE ANNUAL TOTAL RETURNS | INCEPTION DATE |
1 YEAR | 5 YEAR | 10 YEAR | |||
| JPMorgan Equity Index Fund (Class A Shares) | February 18, 1992 | 8.65 | % | 14.87 | % | 12.53 | % |
| JPMorgan Equity Index Fund (Class A Shares) - excluding sales charge | 14.66 | 16.12 | 13.14 | ||||
| S&P 500 Index | 15.16 | 16.64 | 13.65 |
KEY FUND STATISTICS
| Fund net assets (000's) | $11,412,730 | |
| Total number of portfolio holdings | 507 | |
| Portfolio turnover rate | 12 | % |
| Total advisory fees paid (000's) | $0 |
PORTFOLIO COMPOSITION - SECTOR
(% of Total Investments)
(% of Total Investments)
What were the Fund costs for the last year?
(based on a hypothetical $10,000 investment)
| Fund (Class) | Costs of a $10,000 investment |
Costs paid as a percentage of a $10,000 investment |
| JPMorgan Equity Index Fund (Class C Shares) |
$112 | 1.05% |
How did the Fund Perform?
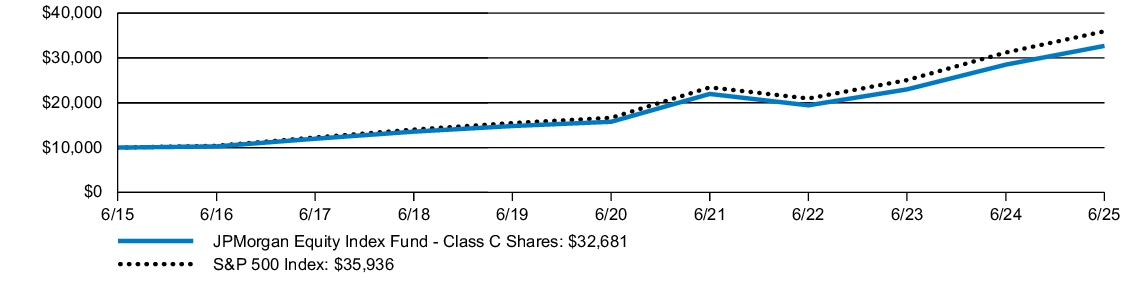
The JPMorgan Equity Index Fund's Class C Shares, without a sales charge, returned 13.98% for the twelve months ended June 30, 2025. The S&P 500 Index (the "Index") returned 15.16% for the twelve months ended June 30, 2025.
- Consistent with its indexing strategy, the Fund closely tracked the total return of the Index.
- During the period, solid earnings growth provided good returns for U.S. large-cap equities. The first half of 2025 was characterized by high levels of market volatility. Concerns around trade policy and the effects on growth caused a sizeable sell-off late in the first quarter and into the second quarter. However, advancements in trade discussions and a temporary postponement of tariff increases alleviated recession fears, fueling a broad-based market rally to close out the period.
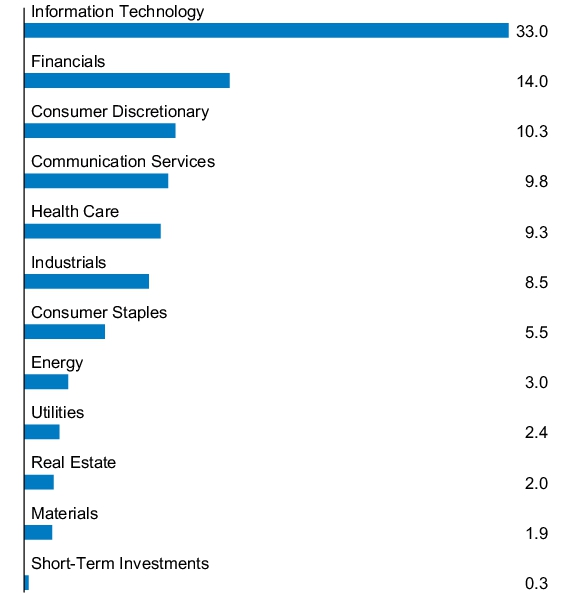
- The majority of sectors in the Index produced positive returns. Financials and utilities were the best-performing sectors with both providing returns of over 20%. Health care and energy were the only sectors with negative returns, with both producing returns in the mid-single digit negative range.
- The Fund achieved its indexing objective by following a full replication approach, owning all stocks in the Index in nearly the same weights. Additional cash was minimized, and cash held was equitized with futures to limit any drag on performance.
Fund Performance
| AVERAGE ANNUAL TOTAL RETURNS | INCEPTION DATE |
1 YEAR | 5 YEAR | 10 YEAR | |||
| JPMorgan Equity Index Fund (Class C Shares) | November 4, 1997 | 12.98 | % | 15.42 | % | 12.57 | % |
| JPMorgan Equity Index Fund (Class C Shares) - excluding sales charge | 13.98 | 15.42 | 12.57 | ||||
| S&P 500 Index | 15.16 | 16.64 | 13.65 |
KEY FUND STATISTICS
| Fund net assets (000's) | $11,412,730 | |
| Total number of portfolio holdings | 507 | |
| Portfolio turnover rate | 12 | % |
| Total advisory fees paid (000's) | $0 |
PORTFOLIO COMPOSITION - SECTOR
(% of Total Investments)
(% of Total Investments)

What were the Fund costs for the last year?
(based on a hypothetical $10,000 investment)
| Fund (Class) | Costs of a $10,000 investment |
Costs paid as a percentage of a $10,000 investment |
| JPMorgan Equity Index Fund (Class I Shares) |
$21 | 0.20% |
How did the Fund Perform?
The JPMorgan Equity Index Fund's Class I Shares returned 14.95% for the twelve months ended June 30, 2025. The S&P 500 Index (the "Index") returned 15.16% for the twelve months ended June 30, 2025.
- Consistent with its indexing strategy, the Fund closely tracked the total return of the Index.
- During the period, solid earnings growth provided good returns for U.S. large-cap equities. The first half of 2025 was characterized by high levels of market volatility. Concerns around trade policy and the effects on growth caused a sizeable sell-off late in the first quarter and into the second quarter. However, advancements in trade discussions and a temporary postponement of tariff increases alleviated recession fears, fueling a broad-based market rally to close out the period.
- The majority of sectors in the Index produced positive returns. Financials and utilities were the best-performing sectors with both providing returns of over 20%. Health care and energy were the only sectors with negative returns, with both producing returns in the mid-single digit negative range.
- The Fund achieved its indexing objective by following a full replication approach, owning all stocks in the Index in nearly the same weights. Additional cash was minimized, and cash held was equitized with futures to limit any drag on performance.
Fund Performance
| AVERAGE ANNUAL TOTAL RETURNS | INCEPTION DATE |
1 YEAR | 5 YEAR | 10 YEAR | |||
| JPMorgan Equity Index Fund (Class I Shares) | July 2, 1991 | 14.95 | % | 16.40 | % | 13.42 | % |
| S&P 500 Index | 15.16 | 16.64 | 13.65 |
KEY FUND STATISTICS
| Fund net assets (000's) | $11,412,730 | |
| Total number of portfolio holdings | 507 | |
| Portfolio turnover rate | 12 | % |
| Total advisory fees paid (000's) | $0 |
PORTFOLIO COMPOSITION - SECTOR
(% of Total Investments)
(% of Total Investments)

What were the Fund costs for the last year?
(based on a hypothetical $10,000 investment)
| Fund (Class) | Costs of a $10,000 investment |
Costs paid as a percentage of a $10,000 investment |
| JPMorgan Equity Index Fund (Class R6 Shares) |
$5 | 0.04% |
How did the Fund Perform?
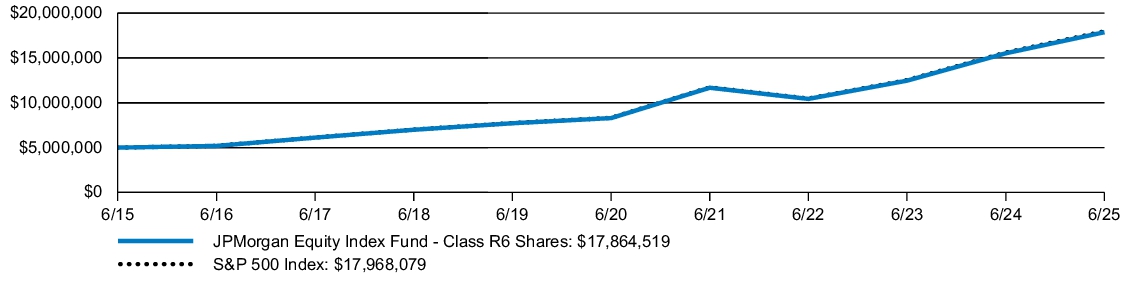
The JPMorgan Equity Index Fund's Class R6 Shares returned 15.12% for the twelve months ended June 30, 2025. The S&P 500 Index (the "Index") returned 15.16% for the twelve months ended June 30, 2025.
- Consistent with its indexing strategy, the Fund closely tracked the total return of the Index.
- During the period, solid earnings growth provided good returns for U.S. large-cap equities. The first half of 2025 was characterized by high levels of market volatility. Concerns around trade policy and the effects on growth caused a sizeable sell-off late in the first quarter and into the second quarter. However, advancements in trade discussions and a temporary postponement of tariff increases alleviated recession fears, fueling a broad-based market rally to close out the period.
- The majority of sectors in the Index produced positive returns. Financials and utilities were the best-performing sectors with both providing returns of over 20%. Health care and energy were the only sectors with negative returns, with both producing returns in the mid-single digit negative range.
- The Fund achieved its indexing objective by following a full replication approach, owning all stocks in the Index in nearly the same weights. Additional cash was minimized, and cash held was equitized with futures to limit any drag on performance.
Fund Performance
| AVERAGE ANNUAL TOTAL RETURNS | INCEPTION DATE |
1 YEAR | 5 YEAR | 10 YEAR | |||
| JPMorgan Equity Index Fund (Class R6 Shares) | September 1, 2016 | 15.12 | % | 16.59 | % | 13.58 | % |
| S&P 500 Index | 15.16 | 16.64 | 13.65 |
KEY FUND STATISTICS
| Fund net assets (000's) | $11,412,730 | |
| Total number of portfolio holdings | 507 | |
| Portfolio turnover rate | 12 | % |
| Total advisory fees paid (000's) | $0 |
PORTFOLIO COMPOSITION - SECTOR
(% of Total Investments)
(% of Total Investments)

What were the Fund costs for the last year?
(based on a hypothetical $10,000 investment)
| Fund (Class) | Costs of a $10,000 investment |
Costs paid as a percentage of a $10,000 investment |
| JPMorgan SMID Cap Equity Fund (Class A Shares) |
$112 | 1.09% |
How did the Fund Perform?
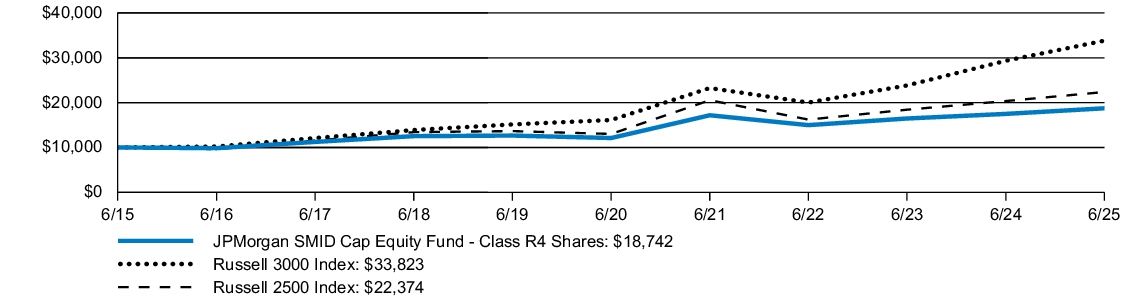
The JPMorgan SMID Cap Equity Fund's Class A Shares, without a sales charge, returned 6.85% for the twelve months ended June 30, 2025. The Russell 3000 Index returned 15.30% and the Russell 2500 Index (the "Index") returned 9.91% for the twelve months ended June 30, 2025.
- The Fund not owning Robinhood Markets and an overweight allocation to Entegris, Inc. detracted from performance.
- The Fund’s security selection in the industrials and telecommunications sectors detracted from performance.
- The Fund’s security selection in the health care and basic materials sectors contributed to performance.
- The Fund’s overweight allocations to Performance Food Group Co. and Planet Fitness Inc. contributed to performance.
Fund Performance

| AVERAGE ANNUAL TOTAL RETURNS | INCEPTION DATE |
1 YEAR | 5 YEAR | 10 YEAR | |||
| JPMorgan SMID Cap Equity Fund (Class A Shares) | May 1, 1992 | 1.22 | % | 7.69 | % | 5.65 | % |
| JPMorgan SMID Cap Equity Fund (Class A Shares) - excluding sales charge | 6.85 | 8.86 | 6.22 | ||||
| Russell 3000 Index | 15.30 | 15.96 | 12.96 | ||||
| Russell 2500 Index | 9.91 | 11.44 | 8.39 |
KEY FUND STATISTICS
| Fund net assets (000's) | $334,157 | |
| Total number of portfolio holdings | 106 | |
| Portfolio turnover rate | 40 | % |
| Total advisory fees paid (000's) | $1,952 |
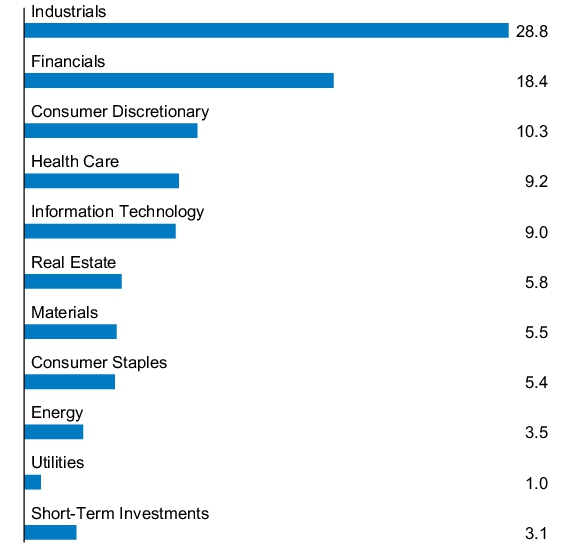
PORTFOLIO COMPOSITION - SECTOR
(% of Total Investments)
(% of Total Investments)

What were the Fund costs for the last year?
(based on a hypothetical $10,000 investment)
| Fund (Class) | Costs of a $10,000 investment |
Costs paid as a percentage of a $10,000 investment |
| JPMorgan SMID Cap Equity Fund (Class C Shares) |
$164 | 1.58% |
How did the Fund Perform?
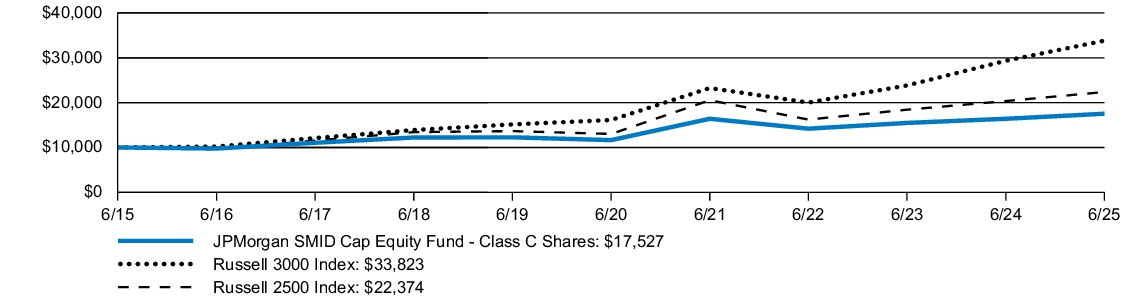
The JPMorgan SMID Cap Equity Fund's Class C Shares, without a sales charge, returned 6.34% for the twelve months ended June 30, 2025. The Russell 3000 Index returned 15.30% and the Russell 2500 Index (the "Index") returned 9.91% for the twelve months ended June 30, 2025.
- The Fund not owning Robinhood Markets and an overweight allocation to Entegris, Inc. detracted from performance.
- The Fund’s security selection in the industrials and telecommunications sectors detracted from performance.
- The Fund’s security selection in the health care and basic materials sectors contributed to performance.
- The Fund’s overweight allocations to Performance Food Group Co. and Planet Fitness Inc. contributed to performance.
Fund Performance
| AVERAGE ANNUAL TOTAL RETURNS | INCEPTION DATE |
1 YEAR | 5 YEAR | 10 YEAR | |||
| JPMorgan SMID Cap Equity Fund (Class C Shares) | March 22, 1999 | 5.34 | % | 8.33 | % | 5.77 | % |
| JPMorgan SMID Cap Equity Fund (Class C Shares) - excluding sales charge | 6.34 | 8.33 | 5.77 | ||||
| Russell 3000 Index | 15.30 | 15.96 | 12.96 | ||||
| Russell 2500 Index | 9.91 | 11.44 | 8.39 |
KEY FUND STATISTICS
| Fund net assets (000's) | $334,157 | |
| Total number of portfolio holdings | 106 | |
| Portfolio turnover rate | 40 | % |
| Total advisory fees paid (000's) | $1,952 |
PORTFOLIO COMPOSITION - SECTOR
(% of Total Investments)
(% of Total Investments)

What were the Fund costs for the last year?
(based on a hypothetical $10,000 investment)
| Fund (Class) | Costs of a $10,000 investment |
Costs paid as a percentage of a $10,000 investment |
| JPMorgan SMID Cap Equity Fund (Class I Shares) |
$87 | 0.84% |
How did the Fund Perform?
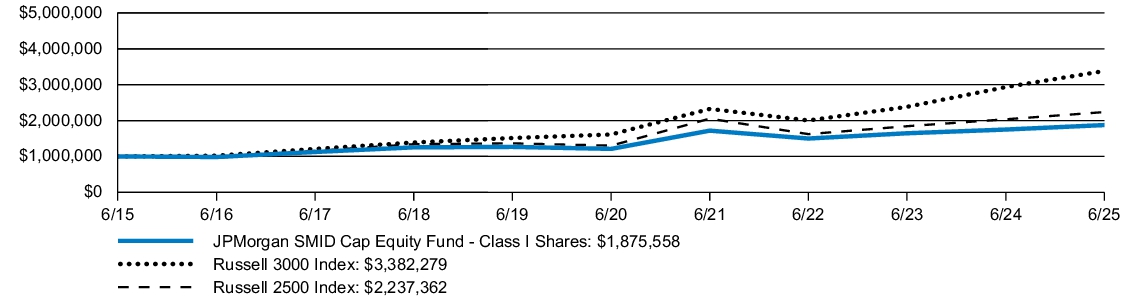
The JPMorgan SMID Cap Equity Fund's Class I Shares returned 7.16% for the twelve months ended June 30, 2025. The Russell 3000 Index returned 15.30% and the Russell 2500 Index (the "Index") returned 9.91% for the twelve months ended June 30, 2025.
- The Fund not owning Robinhood Markets and an overweight allocation to Entegris, Inc. detracted from performance.
- The Fund’s security selection in the industrials and telecommunications sectors detracted from performance.
- The Fund’s security selection in the health care and basic materials sectors contributed to performance.
- The Fund’s overweight allocations to Performance Food Group Co. and Planet Fitness Inc. contributed to performance.
Fund Performance
| AVERAGE ANNUAL TOTAL RETURNS | INCEPTION DATE |
1 YEAR | 5 YEAR | 10 YEAR | |||
| JPMorgan SMID Cap Equity Fund (Class I Shares) | June 1, 1991 | 7.16 | % | 9.14 | % | 6.49 | % |
| Russell 3000 Index | 15.30 | 15.96 | 12.96 | ||||
| Russell 2500 Index | 9.91 | 11.44 | 8.39 |
KEY FUND STATISTICS
| Fund net assets (000's) | $334,157 | |
| Total number of portfolio holdings | 106 | |
| Portfolio turnover rate | 40 | % |
| Total advisory fees paid (000's) | $1,952 |
PORTFOLIO COMPOSITION - SECTOR
(% of Total Investments)
(% of Total Investments)

What were the Fund costs for the last year?
(based on a hypothetical $10,000 investment)
| Fund (Class) | Costs of a $10,000 investment |
Costs paid as a percentage of a $10,000 investment |
| JPMorgan SMID Cap Equity Fund (Class R3 Shares) |
$112 | 1.09% |
How did the Fund Perform?
The JPMorgan SMID Cap Equity Fund's Class R3 Shares returned 6.88% for the twelve months ended June 30, 2025. The Russell 3000 Index returned 15.30% and the Russell 2500 Index (the "Index") returned 9.91% for the twelve months ended June 30, 2025.
- The Fund not owning Robinhood Markets and an overweight allocation to Entegris, Inc. detracted from performance.
- The Fund’s security selection in the industrials and telecommunications sectors detracted from performance.
- The Fund’s security selection in the health care and basic materials sectors contributed to performance.
- The Fund’s overweight allocations to Performance Food Group Co. and Planet Fitness Inc. contributed to performance.
Fund Performance

| AVERAGE ANNUAL TOTAL RETURNS | INCEPTION DATE |
1 YEAR | 5 YEAR | 10 YEAR | |||
| JPMorgan SMID Cap Equity Fund (Class R3 Shares) | September 9, 2016 | 6.88 | % | 8.86 | % | 6.22 | % |
| Russell 3000 Index | 15.30 | 15.96 | 12.96 | ||||
| Russell 2500 Index | 9.91 | 11.44 | 8.39 |
KEY FUND STATISTICS
| Fund net assets (000's) | $334,157 | |
| Total number of portfolio holdings | 106 | |
| Portfolio turnover rate | 40 | % |
| Total advisory fees paid (000's) | $1,952 |
PORTFOLIO COMPOSITION - SECTOR
(% of Total Investments)
(% of Total Investments)
What were the Fund costs for the last year?
(based on a hypothetical $10,000 investment)
| Fund (Class) | Costs of a $10,000 investment |
Costs paid as a percentage of a $10,000 investment |
| JPMorgan SMID Cap Equity Fund (Class R4 Shares) |
$87 | 0.84% |
How did the Fund Perform?
The JPMorgan SMID Cap Equity Fund's Class R4 Shares returned 7.15% for the twelve months ended June 30, 2025. The Russell 3000 Index returned 15.30% and the Russell 2500 Index (the "Index") returned 9.91% for the twelve months ended June 30, 2025.
- The Fund not owning Robinhood Markets and an overweight allocation to Entegris, Inc. detracted from performance.
- The Fund’s security selection in the industrials and telecommunications sectors detracted from performance.
- The Fund’s security selection in the health care and basic materials sectors contributed to performance.
- The Fund’s overweight allocations to Performance Food Group Co. and Planet Fitness Inc. contributed to performance.
Fund Performance
| AVERAGE ANNUAL TOTAL RETURNS | INCEPTION DATE |
1 YEAR | 5 YEAR | 10 YEAR | |||
| JPMorgan SMID Cap Equity Fund (Class R4 Shares) | September 9, 2016 | 7.15 | % | 9.13 | % | 6.48 | % |
| Russell 3000 Index | 15.30 | 15.96 | 12.96 | ||||
| Russell 2500 Index | 9.91 | 11.44 | 8.39 |
KEY FUND STATISTICS
| Fund net assets (000's) | $334,157 | |
| Total number of portfolio holdings | 106 | |
| Portfolio turnover rate | 40 | % |
| Total advisory fees paid (000's) | $1,952 |
PORTFOLIO COMPOSITION - SECTOR
(% of Total Investments)
(% of Total Investments)

What were the Fund costs for the last year?
(based on a hypothetical $10,000 investment)
| Fund (Class) | Costs of a $10,000 investment |
Costs paid as a percentage of a $10,000 investment |
| JPMorgan SMID Cap Equity Fund (Class R6 Shares) |
$61 | 0.59% |
How did the Fund Perform?
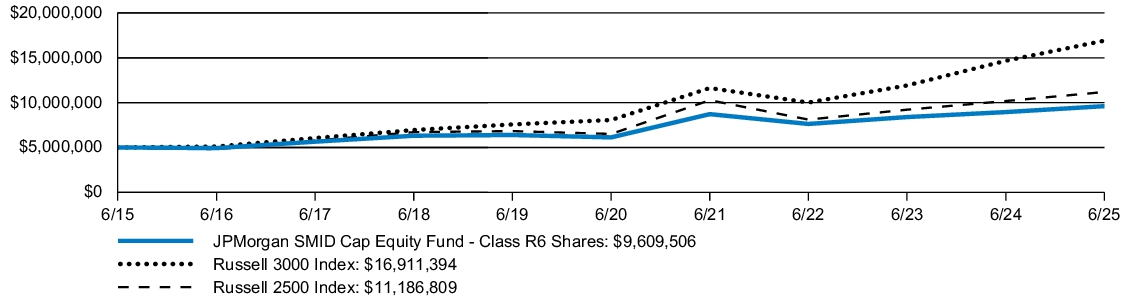
The JPMorgan SMID Cap Equity Fund's Class R6 Shares returned 7.40% for the twelve months ended June 30, 2025. The Russell 3000 Index returned 15.30% and the Russell 2500 Index (the "Index") returned 9.91% for the twelve months ended June 30, 2025.
- The Fund not owning Robinhood Markets and an overweight allocation to Entegris, Inc. detracted from performance.
- The Fund’s security selection in the industrials and telecommunications sectors detracted from performance.
- The Fund’s security selection in the health care and basic materials sectors contributed to performance.
- The Fund’s overweight allocations to Performance Food Group Co. and Planet Fitness Inc. contributed to performance.
Fund Performance
| AVERAGE ANNUAL TOTAL RETURNS | INCEPTION DATE |
1 YEAR | 5 YEAR | 10 YEAR | |||
| JPMorgan SMID Cap Equity Fund (Class R6 Shares) | November 2, 2015 | 7.40 | % | 9.42 | % | 6.75 | % |
| Russell 3000 Index | 15.30 | 15.96 | 12.96 | ||||
| Russell 2500 Index | 9.91 | 11.44 | 8.39 |
KEY FUND STATISTICS
| Fund net assets (000's) | $334,157 | |
| Total number of portfolio holdings | 106 | |
| Portfolio turnover rate | 40 | % |
| Total advisory fees paid (000's) | $1,952 |
PORTFOLIO COMPOSITION - SECTOR
(% of Total Investments)
(% of Total Investments)

This report describes material changes to the Fund that occurred during the reporting period.
What were the Fund costs for the last year?
(based on a hypothetical $10,000 investment)
| Fund (Class) | Costs of a $10,000 investment |
Costs paid as a percentage of a $10,000 investment |
| JPMorgan Large Cap Growth Fund (Class A Shares) |
$100 | 0.93% |
How did the Fund Perform?
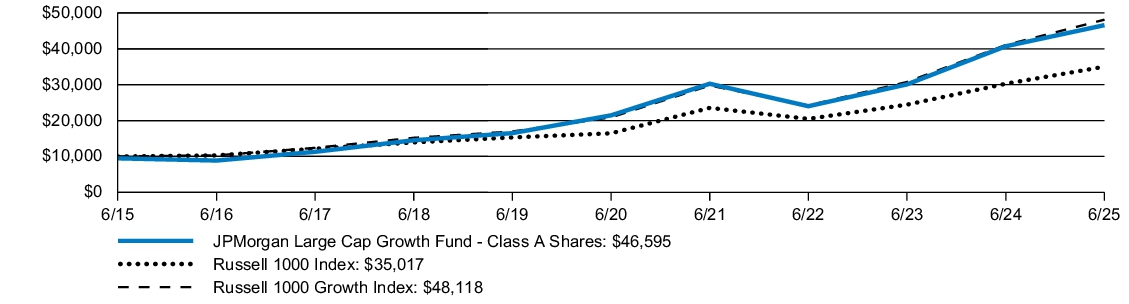
The JPMorgan Large Cap Growth Fund's Class A Shares, without a sales charge, returned 14.44% for the twelve months ended June 30, 2025. The Russell 1000 Index returned 15.66% and the Russell 1000 Growth Index (the "Index") returned 17.22% for the twelve months ended June 30, 2025.
- The Fund’s security selection in the industrials sector and an overweight allocation in the health care sector detracted from performance.
- The Fund’s underweight allocation to Tesla, Inc. and not owning Palantir Technologies Inc. detracted from performance.
- The Fund’s security selection in the information technology sector contributed to performance.
- The Fund’s underweight allocation to Apple, Inc. and an overweight allocation to Netflix, Inc. contributed to performance.
Fund Performance
| AVERAGE ANNUAL TOTAL RETURNS | INCEPTION DATE |
1 YEAR | 5 YEAR | 10 YEAR | |||
| JPMorgan Large Cap Growth Fund (Class A Shares) | February 22, 1994 | 8.43 | % | 15.52 | % | 16.64 | % |
| JPMorgan Large Cap Growth Fund (Class A Shares) - excluding sales charge | 14.44 | 16.77 | 17.27 | ||||
| Russell 1000 Index | 15.66 | 16.30 | 13.35 | ||||
| Russell 1000 Growth Index | 17.22 | 18.15 | 17.01 |
KEY FUND STATISTICS
| Fund net assets (000's) | $114,064,398 | |
| Total number of portfolio holdings | 74 | |
| Portfolio turnover rate | 52 | % |
| Total advisory fees paid (000's) | $422,369 |
PORTFOLIO COMPOSITION - SECTOR
(% of Total Investments)
(% of Total Investments)

Material changes to the Fund during the period
Effective March 5, 2025, the Fund began operating as a non-diversified company. In connection with this change, the Fund added "Non-Diversified Fund Risk" disclosure to its summary prospectus as of March 5, 2025. As a non-diversified company, the Fund may invest a greater percentage of its assets in a particular issuer or group of issuers than a diversified fund would. This increased investment in fewer issuers may result in the Fund’s Shares being more sensitive to economic results among those issuing the securities. The value of the Fund’s Shares may also be more volatile than the value of the Fund which invests in more securities.
This is a summary of certain changes to the Fund since July 1, 2024. For more complete information, you may review the Fund’s prospectus at www.jpmorganfunds.com/funddocuments or upon request at 1-800-480-4111.
This report describes material changes to the Fund that occurred during the reporting period.
What were the Fund costs for the last year?
(based on a hypothetical $10,000 investment)
| Fund (Class) | Costs of a $10,000 investment |
Costs paid as a percentage of a $10,000 investment |
| JPMorgan Large Cap Growth Fund (Class C Shares) |
$153 | 1.43% |
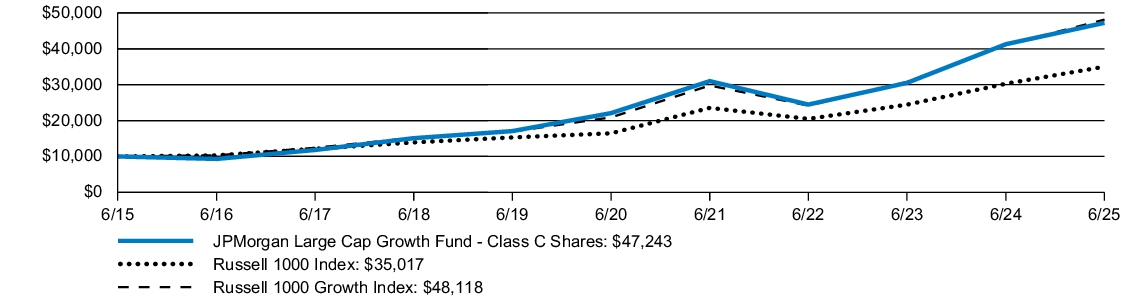
How did the Fund Perform?
The JPMorgan Large Cap Growth Fund's Class C Shares, without a sales charge, returned 13.86% for the twelve months ended June 30, 2025. The Russell 1000 Index returned 15.66% and the Russell 1000 Growth Index (the "Index") returned 17.22% for the twelve months ended June 30, 2025.
- The Fund’s security selection in the industrials sector and an overweight allocation in the health care sector detracted from performance.
- The Fund’s underweight allocation to Tesla, Inc. and not owning Palantir Technologies Inc. detracted from performance.
- The Fund’s security selection in the information technology sector contributed to performance.
- The Fund’s underweight allocation to Apple, Inc. and an overweight allocation to Netflix, Inc. contributed to performance.
Fund Performance
| AVERAGE ANNUAL TOTAL RETURNS | INCEPTION DATE |
1 YEAR | 5 YEAR | 10 YEAR | |||
| JPMorgan Large Cap Growth Fund (Class C Shares) | November 4, 1997 | 12.86 | % | 16.19 | % | 16.80 | % |
| JPMorgan Large Cap Growth Fund (Class C Shares) - excluding sales charge | 13.86 | 16.19 | 16.80 | ||||
| Russell 1000 Index | 15.66 | 16.30 | 13.35 | ||||
| Russell 1000 Growth Index | 17.22 | 18.15 | 17.01 |
KEY FUND STATISTICS
| Fund net assets (000's) | $114,064,398 | |
| Total number of portfolio holdings | 74 | |
| Portfolio turnover rate | 52 | % |
| Total advisory fees paid (000's) | $422,369 |
PORTFOLIO COMPOSITION - SECTOR
(% of Total Investments)
(% of Total Investments)

Material changes to the Fund during the period
Effective March 5, 2025, the Fund began operating as a non-diversified company. In connection with this change, the Fund added "Non-Diversified Fund Risk" disclosure to its summary prospectus as of March 5, 2025. As a non-diversified company, the Fund may invest a greater percentage of its assets in a particular issuer or group of issuers than a diversified fund would. This increased investment in fewer issuers may result in the Fund’s Shares being more sensitive to economic results among those issuing the securities. The value of the Fund’s Shares may also be more volatile than the value of the Fund which invests in more securities.
This is a summary of certain changes to the Fund since July 1, 2024. For more complete information, you may review the Fund’s prospectus at www.jpmorganfunds.com/funddocuments or upon request at 1-800-480-4111.
Effective March 5, 2025, the Fund began operating as a non-diversified company. In connection with this change, the Fund added "Non-Diversified Fund Risk" disclosure to its summary prospectus as of March 5, 2025. As a non-diversified company, the Fund may invest a greater percentage of its assets in a particular issuer or group of issuers than a diversified fund would. This increased investment in fewer issuers may result in the Fund’s Shares being more sensitive to economic results among those issuing the securities. The value of the Fund’s Shares may also be more volatile than the value of the Fund which invests in more securities.
This is a summary of certain changes to the Fund since July 1, 2024. For more complete information, you may review the Fund’s prospectus at www.jpmorganfunds.com/funddocuments or upon request at 1-800-480-4111.
This report describes material changes to the Fund that occurred during the reporting period.
What were the Fund costs for the last year?
(based on a hypothetical $10,000 investment)
| Fund (Class) | Costs of a $10,000 investment |
Costs paid as a percentage of a $10,000 investment |
| JPMorgan Large Cap Growth Fund (Class I Shares) |
$73 | 0.68% |
How did the Fund Perform?
The JPMorgan Large Cap Growth Fund's Class I Shares returned 14.72% for the twelve months ended June 30, 2025. The Russell 1000 Index returned 15.66% and the Russell 1000 Growth Index (the "Index") returned 17.22% for the twelve months ended June 30, 2025.
- The Fund’s security selection in the industrials sector and an overweight allocation in the health care sector detracted from performance.
- The Fund’s underweight allocation to Tesla, Inc. and not owning Palantir Technologies Inc. detracted from performance.
- The Fund’s security selection in the information technology sector contributed to performance.
- The Fund’s underweight allocation to Apple, Inc. and an overweight allocation to Netflix, Inc. contributed to performance.
Fund Performance

| AVERAGE ANNUAL TOTAL RETURNS | INCEPTION DATE |
1 YEAR | 5 YEAR | 10 YEAR | |||
| JPMorgan Large Cap Growth Fund (Class I Shares) | February 28, 1992 | 14.72 | % | 17.06 | % | 17.53 | % |
| Russell 1000 Index | 15.66 | 16.30 | 13.35 | ||||
| Russell 1000 Growth Index | 17.22 | 18.15 | 17.01 |
KEY FUND STATISTICS
| Fund net assets (000's) | $114,064,398 | |
| Total number of portfolio holdings | 74 | |
| Portfolio turnover rate | 52 | % |
| Total advisory fees paid (000's) | $422,369 |
PORTFOLIO COMPOSITION - SECTOR
(% of Total Investments)
(% of Total Investments)

Material changes to the Fund during the period
Effective March 5, 2025, the Fund began operating as a non-diversified company. In connection with this change, the Fund added "Non-Diversified Fund Risk" disclosure to its summary prospectus as of March 5, 2025. As a non-diversified company, the Fund may invest a greater percentage of its assets in a particular issuer or group of issuers than a diversified fund would. This increased investment in fewer issuers may result in the Fund’s Shares being more sensitive to economic results among those issuing the securities. The value of the Fund’s Shares may also be more volatile than the value of the Fund which invests in more securities.
This is a summary of certain changes to the Fund since July 1, 2024. For more complete information, you may review the Fund’s prospectus at www.jpmorganfunds.com/funddocuments or upon request at 1-800-480-4111.
Effective March 5, 2025, the Fund began operating as a non-diversified company. In connection with this change, the Fund added "Non-Diversified Fund Risk" disclosure to its summary prospectus as of March 5, 2025. As a non-diversified company, the Fund may invest a greater percentage of its assets in a particular issuer or group of issuers than a diversified fund would. This increased investment in fewer issuers may result in the Fund’s Shares being more sensitive to economic results among those issuing the securities. The value of the Fund’s Shares may also be more volatile than the value of the Fund which invests in more securities.
This is a summary of certain changes to the Fund since July 1, 2024. For more complete information, you may review the Fund’s prospectus at www.jpmorganfunds.com/funddocuments or upon request at 1-800-480-4111.
This report describes material changes to the Fund that occurred during the reporting period.
What were the Fund costs for the last year?
(based on a hypothetical $10,000 investment)
| Fund (Class) | Costs of a $10,000 investment |
Costs paid as a percentage of a $10,000 investment |
| JPMorgan Large Cap Growth Fund (Class R2 Shares) |
$127 | 1.18% |
How did the Fund Perform?
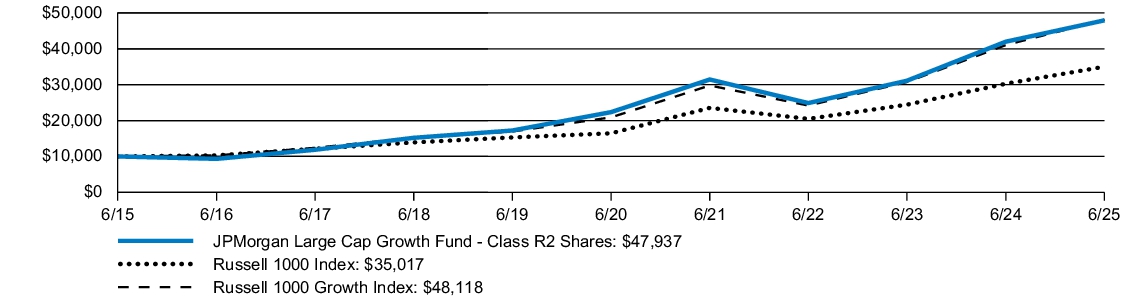
The JPMorgan Large Cap Growth Fund's Class R2 Shares returned 14.16% for the twelve months ended June 30, 2025. The Russell 1000 Index returned 15.66% and the Russell 1000 Growth Index (the "Index") returned 17.22% for the twelve months ended June 30, 2025.
- The Fund’s security selection in the industrials sector and an overweight allocation in the health care sector detracted from performance.
- The Fund’s underweight allocation to Tesla, Inc. and not owning Palantir Technologies Inc. detracted from performance.
- The Fund’s security selection in the information technology sector contributed to performance.
- The Fund’s underweight allocation to Apple, Inc. and an overweight allocation to Netflix, Inc. contributed to performance.
Fund Performance
| AVERAGE ANNUAL TOTAL RETURNS | INCEPTION DATE |
1 YEAR | 5 YEAR | 10 YEAR | |||
| JPMorgan Large Cap Growth Fund (Class R2 Shares) | November 3, 2008 | 14.16 | % | 16.48 | % | 16.97 | % |
| Russell 1000 Index | 15.66 | 16.30 | 13.35 | ||||
| Russell 1000 Growth Index | 17.22 | 18.15 | 17.01 |
KEY FUND STATISTICS
| Fund net assets (000's) | $114,064,398 | |
| Total number of portfolio holdings | 74 | |
| Portfolio turnover rate | 52 | % |
| Total advisory fees paid (000's) | $422,369 |
PORTFOLIO COMPOSITION - SECTOR
(% of Total Investments)
(% of Total Investments)

Material changes to the Fund during the period
Effective March 5, 2025, the Fund began operating as a non-diversified company. In connection with this change, the Fund added "Non-Diversified Fund Risk" disclosure to its summary prospectus as of March 5, 2025. As a non-diversified company, the Fund may invest a greater percentage of its assets in a particular issuer or group of issuers than a diversified fund would. This increased investment in fewer issuers may result in the Fund’s Shares being more sensitive to economic results among those issuing the securities. The value of the Fund’s Shares may also be more volatile than the value of the Fund which invests in more securities.
This is a summary of certain changes to the Fund since July 1, 2024. For more complete information, you may review the Fund’s prospectus at www.jpmorganfunds.com/funddocuments or upon request at 1-800-480-4111.
Effective March 5, 2025, the Fund began operating as a non-diversified company. In connection with this change, the Fund added "Non-Diversified Fund Risk" disclosure to its summary prospectus as of March 5, 2025. As a non-diversified company, the Fund may invest a greater percentage of its assets in a particular issuer or group of issuers than a diversified fund would. This increased investment in fewer issuers may result in the Fund’s Shares being more sensitive to economic results among those issuing the securities. The value of the Fund’s Shares may also be more volatile than the value of the Fund which invests in more securities.
This is a summary of certain changes to the Fund since July 1, 2024. For more complete information, you may review the Fund’s prospectus at www.jpmorganfunds.com/funddocuments or upon request at 1-800-480-4111.
This report describes material changes to the Fund that occurred during the reporting period.
What were the Fund costs for the last year?
(based on a hypothetical $10,000 investment)
| Fund (Class) | Costs of a $10,000 investment |
Costs paid as a percentage of a $10,000 investment |
| JPMorgan Large Cap Growth Fund (Class R3 Shares) |
$100 | 0.93% |
How did the Fund Perform?
The JPMorgan Large Cap Growth Fund's Class R3 Shares returned 14.44% for the twelve months ended June 30, 2025. The Russell 1000 Index returned 15.66% and the Russell 1000 Growth Index (the "Index") returned 17.22% for the twelve months ended June 30, 2025.
- The Fund’s security selection in the industrials sector and an overweight allocation in the health care sector detracted from performance.
- The Fund’s underweight allocation to Tesla, Inc. and not owning Palantir Technologies Inc. detracted from performance.
- The Fund’s security selection in the information technology sector contributed to performance.
- The Fund’s underweight allocation to Apple, Inc. and an overweight allocation to Netflix, Inc. contributed to performance.
Fund Performance
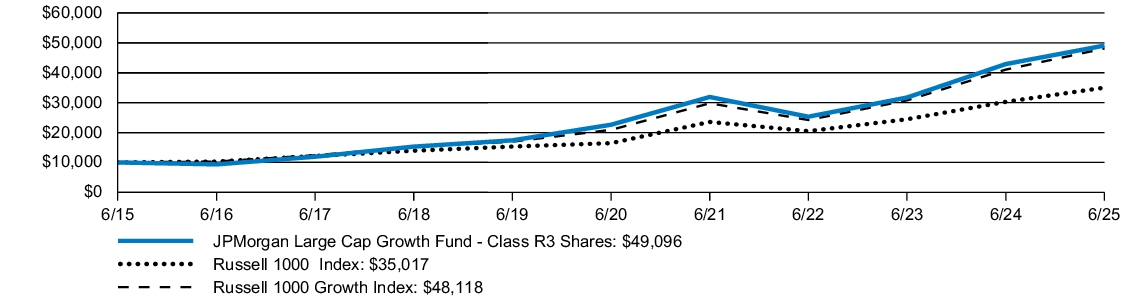
| AVERAGE ANNUAL TOTAL RETURNS | INCEPTION DATE |
1 YEAR | 5 YEAR | 10 YEAR | |||
| JPMorgan Large Cap Growth Fund (Class R3 Shares) | September 9, 2016 | 14.44 | % | 16.77 | % | 17.25 | % |
| Russell 1000 Index | 15.66 | 16.30 | 13.35 | ||||
| Russell 1000 Growth Index | 17.22 | 18.15 | 17.01 |
KEY FUND STATISTICS
| Fund net assets (000's) | $114,064,398 | |
| Total number of portfolio holdings | 74 | |
| Portfolio turnover rate | 52 | % |
| Total advisory fees paid (000's) | $422,369 |
PORTFOLIO COMPOSITION - SECTOR
(% of Total Investments)
(% of Total Investments)

Material changes to the Fund during the period
Effective March 5, 2025, the Fund began operating as a non-diversified company. In connection with this change, the Fund added "Non-Diversified Fund Risk" disclosure to its summary prospectus as of March 5, 2025. As a non-diversified company, the Fund may invest a greater percentage of its assets in a particular issuer or group of issuers than a diversified fund would. This increased investment in fewer issuers may result in the Fund’s Shares being more sensitive to economic results among those issuing the securities. The value of the Fund’s Shares may also be more volatile than the value of the Fund which invests in more securities.
This is a summary of certain changes to the Fund since July 1, 2024. For more complete information, you may review the Fund’s prospectus at www.jpmorganfunds.com/funddocuments or upon request at 1-800-480-4111.
Effective March 5, 2025, the Fund began operating as a non-diversified company. In connection with this change, the Fund added "Non-Diversified Fund Risk" disclosure to its summary prospectus as of March 5, 2025. As a non-diversified company, the Fund may invest a greater percentage of its assets in a particular issuer or group of issuers than a diversified fund would. This increased investment in fewer issuers may result in the Fund’s Shares being more sensitive to economic results among those issuing the securities. The value of the Fund’s Shares may also be more volatile than the value of the Fund which invests in more securities.
This is a summary of certain changes to the Fund since July 1, 2024. For more complete information, you may review the Fund’s prospectus at www.jpmorganfunds.com/funddocuments or upon request at 1-800-480-4111.
This report describes material changes to the Fund that occurred during the reporting period.
What were the Fund costs for the last year?
(based on a hypothetical $10,000 investment)
| Fund (Class) | Costs of a $10,000 investment |
Costs paid as a percentage of a $10,000 investment |
| JPMorgan Large Cap Growth Fund (Class R4 Shares) |
$73 | 0.68% |
How did the Fund Perform?
The JPMorgan Large Cap Growth Fund's Class R4 Shares returned 14.73% for the twelve months ended June 30, 2025. The Russell 1000 Index returned 15.66% and the Russell 1000 Growth Index (the "Index") returned 17.22% for the twelve months ended June 30, 2025.
- The Fund’s security selection in the industrials sector and an overweight allocation in the health care sector detracted from performance.
- The Fund’s underweight allocation to Tesla, Inc. and not owning Palantir Technologies Inc. detracted from performance.
- The Fund’s security selection in the information technology sector contributed to performance.
- The Fund’s underweight allocation to Apple, Inc. and an overweight allocation to Netflix, Inc. contributed to performance.
Fund Performance

| AVERAGE ANNUAL TOTAL RETURNS | INCEPTION DATE |
1 YEAR | 5 YEAR | 10 YEAR | |||
| JPMorgan Large Cap Growth Fund (Class R4 Shares) | September 9, 2016 | 14.73 | % | 17.06 | % | 17.53 | % |
| Russell 1000 Index | 15.66 | 16.30 | 13.35 | ||||
| Russell 1000 Growth Index | 17.22 | 18.15 | 17.01 |
KEY FUND STATISTICS
| Fund net assets (000's) | $114,064,398 | |
| Total number of portfolio holdings | 74 | |
| Portfolio turnover rate | 52 | % |
| Total advisory fees paid (000's) | $422,369 |
PORTFOLIO COMPOSITION - SECTOR
(% of Total Investments)
(% of Total Investments)

Material changes to the Fund during the period
Effective March 5, 2025, the Fund began operating as a non-diversified company. In connection with this change, the Fund added "Non-Diversified Fund Risk" disclosure to its summary prospectus as of March 5, 2025. As a non-diversified company, the Fund may invest a greater percentage of its assets in a particular issuer or group of issuers than a diversified fund would. This increased investment in fewer issuers may result in the Fund’s Shares being more sensitive to economic results among those issuing the securities. The value of the Fund’s Shares may also be more volatile than the value of the Fund which invests in more securities.
This is a summary of certain changes to the Fund since July 1, 2024. For more complete information, you may review the Fund’s prospectus at www.jpmorganfunds.com/funddocuments or upon request at 1-800-480-4111.
Effective March 5, 2025, the Fund began operating as a non-diversified company. In connection with this change, the Fund added "Non-Diversified Fund Risk" disclosure to its summary prospectus as of March 5, 2025. As a non-diversified company, the Fund may invest a greater percentage of its assets in a particular issuer or group of issuers than a diversified fund would. This increased investment in fewer issuers may result in the Fund’s Shares being more sensitive to economic results among those issuing the securities. The value of the Fund’s Shares may also be more volatile than the value of the Fund which invests in more securities.
This is a summary of certain changes to the Fund since July 1, 2024. For more complete information, you may review the Fund’s prospectus at www.jpmorganfunds.com/funddocuments or upon request at 1-800-480-4111.
This report describes material changes to the Fund that occurred during the reporting period.
What were the Fund costs for the last year?
(based on a hypothetical $10,000 investment)
| Fund (Class) | Costs of a $10,000 investment |
Costs paid as a percentage of a $10,000 investment |
| JPMorgan Large Cap Growth Fund (Class R5 Shares) |
$57 | 0.53% |
How did the Fund Perform?
The JPMorgan Large Cap Growth Fund's Class R5 Shares returned 14.89% for the twelve months ended June 30, 2025. The Russell 1000 Index returned 15.66% and the Russell 1000 Growth Index (the "Index") returned 17.22% for the twelve months ended June 30, 2025.
- The Fund’s security selection in the industrials sector and an overweight allocation in the health care sector detracted from performance.
- The Fund’s underweight allocation to Tesla, Inc. and not owning Palantir Technologies Inc. detracted from performance.
- The Fund’s security selection in the information technology sector contributed to performance.
- The Fund’s underweight allocation to Apple, Inc. and an overweight allocation to Netflix, Inc. contributed to performance.
Fund Performance
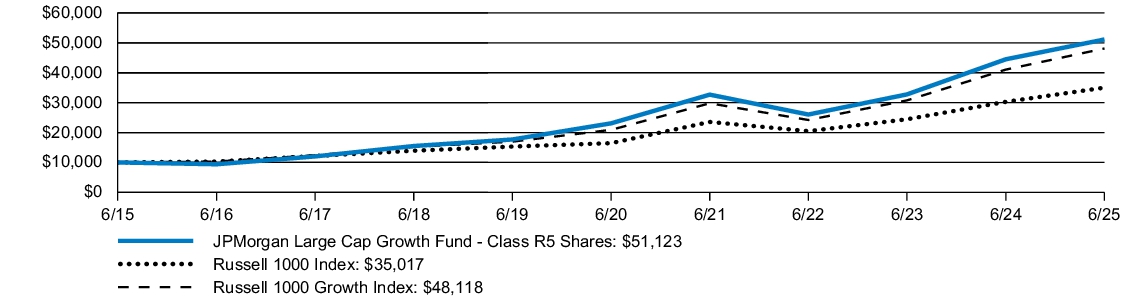
| AVERAGE ANNUAL TOTAL RETURNS | INCEPTION DATE |
1 YEAR | 5 YEAR | 10 YEAR | |||
| JPMorgan Large Cap Growth Fund (Class R5 Shares) | April 14, 2009 | 14.89 | % | 17.23 | % | 17.72 | % |
| Russell 1000 Index | 15.66 | 16.30 | 13.35 | ||||
| Russell 1000 Growth Index | 17.22 | 18.15 | 17.01 |
KEY FUND STATISTICS
| Fund net assets (000's) | $114,064,398 | |
| Total number of portfolio holdings | 74 | |
| Portfolio turnover rate | 52 | % |
| Total advisory fees paid (000's) | $422,369 |
PORTFOLIO COMPOSITION - SECTOR
(% of Total Investments)
(% of Total Investments)
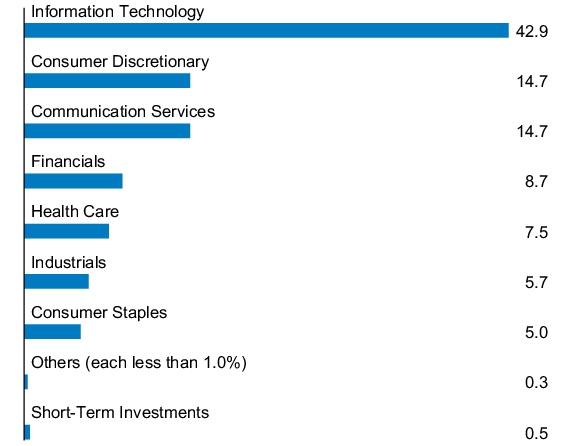
Material changes to the Fund during the period
Effective March 5, 2025, the Fund began operating as a non-diversified company. In connection with this change, the Fund added "Non-Diversified Fund Risk" disclosure to its summary prospectus as of March 5, 2025. As a non-diversified company, the Fund may invest a greater percentage of its assets in a particular issuer or group of issuers than a diversified fund would. This increased investment in fewer issuers may result in the Fund’s Shares being more sensitive to economic results among those issuing the securities. The value of the Fund’s Shares may also be more volatile than the value of the Fund which invests in more securities.
This is a summary of certain changes to the Fund since July 1, 2024. For more complete information, you may review the Fund’s prospectus at www.jpmorganfunds.com/funddocuments or upon request at 1-800-480-4111.
Effective March 5, 2025, the Fund began operating as a non-diversified company. In connection with this change, the Fund added "Non-Diversified Fund Risk" disclosure to its summary prospectus as of March 5, 2025. As a non-diversified company, the Fund may invest a greater percentage of its assets in a particular issuer or group of issuers than a diversified fund would. This increased investment in fewer issuers may result in the Fund’s Shares being more sensitive to economic results among those issuing the securities. The value of the Fund’s Shares may also be more volatile than the value of the Fund which invests in more securities.
This is a summary of certain changes to the Fund since July 1, 2024. For more complete information, you may review the Fund’s prospectus at www.jpmorganfunds.com/funddocuments or upon request at 1-800-480-4111.
This report describes material changes to the Fund that occurred during the reporting period.
What were the Fund costs for the last year?
(based on a hypothetical $10,000 investment)
| Fund (Class) | Costs of a $10,000 investment |
Costs paid as a percentage of a $10,000 investment |
| JPMorgan Large Cap Growth Fund (Class R6 Shares) |
$47 | 0.43% |
How did the Fund Perform?
The JPMorgan Large Cap Growth Fund's Class R6 Shares returned 15.01% for the twelve months ended June 30, 2025. The Russell 1000 Index returned 15.66% and the Russell 1000 Growth Index (the "Index") returned 17.22% for the twelve months ended June 30, 2025.
- The Fund’s security selection in the industrials sector and an overweight allocation in the health care sector detracted from performance.
- The Fund’s underweight allocation to Tesla, Inc. and not owning Palantir Technologies Inc. detracted from performance.
- The Fund’s security selection in the information technology sector contributed to performance.
- The Fund’s underweight allocation to Apple, Inc. and an overweight allocation to Netflix, Inc. contributed to performance.
Fund Performance
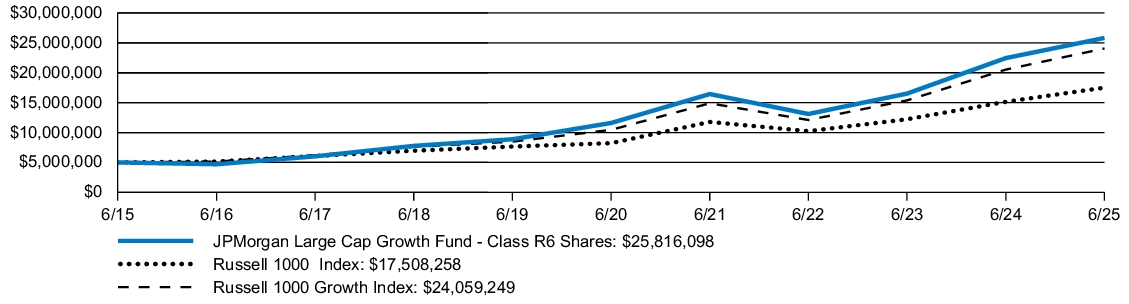
| AVERAGE ANNUAL TOTAL RETURNS | INCEPTION DATE |
1 YEAR | 5 YEAR | 10 YEAR | |||
| JPMorgan Large Cap Growth Fund (Class R6 Shares) | November 30, 2010 | 15.01 | % | 17.35 | % | 17.84 | % |
| Russell 1000 Index | 15.66 | 16.30 | 13.35 | ||||
| Russell 1000 Growth Index | 17.22 | 18.15 | 17.01 |
KEY FUND STATISTICS
| Fund net assets (000's) | $114,064,398 | |
| Total number of portfolio holdings | 74 | |
| Portfolio turnover rate | 52 | % |
| Total advisory fees paid (000's) | $422,369 |
PORTFOLIO COMPOSITION - SECTOR
(% of Total Investments)
(% of Total Investments)

Material changes to the Fund during the period
Effective March 5, 2025, the Fund began operating as a non-diversified company. In connection with this change, the Fund added "Non-Diversified Fund Risk" disclosure to its summary prospectus as of March 5, 2025. As a non-diversified company, the Fund may invest a greater percentage of its assets in a particular issuer or group of issuers than a diversified fund would. This increased investment in fewer issuers may result in the Fund’s Shares being more sensitive to economic results among those issuing the securities. The value of the Fund’s Shares may also be more volatile than the value of the Fund which invests in more securities.
This is a summary of certain changes to the Fund since July 1, 2024. For more complete information, you may review the Fund’s prospectus at www.jpmorganfunds.com/funddocuments or upon request at 1-800-480-4111.
Effective March 5, 2025, the Fund began operating as a non-diversified company. In connection with this change, the Fund added "Non-Diversified Fund Risk" disclosure to its summary prospectus as of March 5, 2025. As a non-diversified company, the Fund may invest a greater percentage of its assets in a particular issuer or group of issuers than a diversified fund would. This increased investment in fewer issuers may result in the Fund’s Shares being more sensitive to economic results among those issuing the securities. The value of the Fund’s Shares may also be more volatile than the value of the Fund which invests in more securities.
This is a summary of certain changes to the Fund since July 1, 2024. For more complete information, you may review the Fund’s prospectus at www.jpmorganfunds.com/funddocuments or upon request at 1-800-480-4111.
What were the Fund costs for the last year?
(based on a hypothetical $10,000 investment)
| Fund (Class) | Costs of a $10,000 investment |
Costs paid as a percentage of a $10,000 investment |
| JPMorgan Large Cap Value Fund (Class A Shares) |
$99 | 0.93% |
How did the Fund Perform?
The JPMorgan Large Cap Value Fund's Class A Shares, without a sales charge, returned 12.83% for the twelve months ended June 30, 2025. The Russell 1000 Index returned 15.66% and the Russell 1000 Value Index (the "Index") returned 13.70% for the twelve months ended June 30, 2025.
- The Fund’s security selection in the materials and health care sectors detracted from performance.
- The Fund’s underweight allocation to JPMorgan Chase & Co. and overweight allocation to Regeneron Pharmaceuticals Inc. detracted from performance.
- The Fund’s security selection in the information technology and consumer staples sectors contributed to performance.
- The Fund’s overweight allocation to Philip Morris International and Seagate Technology Holdings plc contributed to performance.
Fund Performance
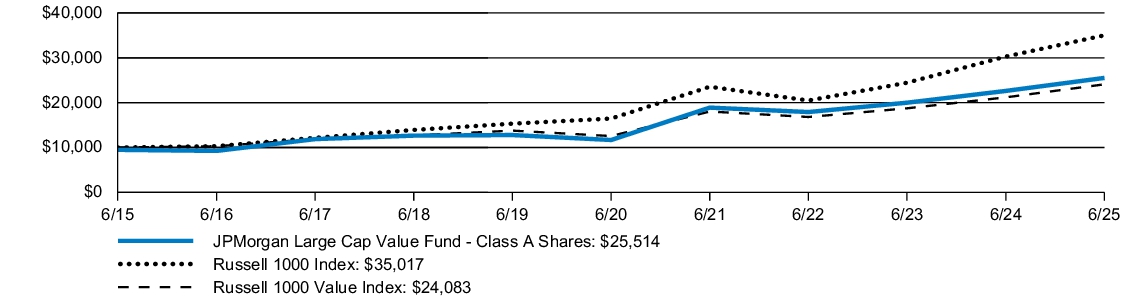
| AVERAGE ANNUAL TOTAL RETURNS | INCEPTION DATE |
1 YEAR | 5 YEAR | 10 YEAR | |||
| JPMorgan Large Cap Value Fund (Class A Shares) | February 18, 1992 | 6.90 | % | 15.69 | % | 9.82 | % |
| JPMorgan Large Cap Value Fund (Class A Shares) - excluding sales charge | 12.83 | 16.93 | 10.41 | ||||
| Russell 1000 Index | 15.66 | 16.30 | 13.35 | ||||
| Russell 1000 Value Index | 13.70 | 13.93 | 9.19 |
KEY FUND STATISTICS
| Fund net assets (000's) | $5,050,019 | |
| Total number of portfolio holdings | 99 | |
| Portfolio turnover rate | 185 | % |
| Total advisory fees paid (000's) | $17,634 |
PORTFOLIO COMPOSITION - SECTOR
(% of Total Investments)
(% of Total Investments)

What were the Fund costs for the last year?
(based on a hypothetical $10,000 investment)
| Fund (Class) | Costs of a $10,000 investment |
Costs paid as a percentage of a $10,000 investment |
| JPMorgan Large Cap Value Fund (Class C Shares) |
$152 | 1.44% |
How did the Fund Perform?
The JPMorgan Large Cap Value Fund's Class C Shares, without a sales charge, returned 12.25% for the twelve months ended June 30, 2025. The Russell 1000 Index returned 15.66% and the Russell 1000 Value Index (the "Index") returned 13.70% for the twelve months ended June 30, 2025.
- The Fund’s security selection in the materials and health care sectors detracted from performance.
- The Fund’s underweight allocation to JPMorgan Chase & Co. and overweight allocation to Regeneron Pharmaceuticals Inc. detracted from performance.
- The Fund’s security selection in the information technology and consumer staples sectors contributed to performance.
- The Fund’s overweight allocation to Philip Morris International and Seagate Technology Holdings plc contributed to performance.
Fund Performance
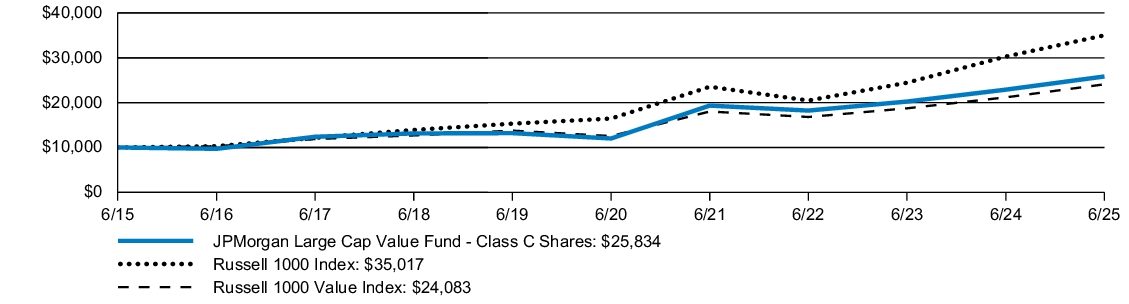
| AVERAGE ANNUAL TOTAL RETURNS | INCEPTION DATE |
1 YEAR | 5 YEAR | 10 YEAR | |||
| JPMorgan Large Cap Value Fund (Class C Shares) | March 22, 1999 | 11.25 | % | 16.33 | % | 9.96 | % |
| JPMorgan Large Cap Value Fund (Class C Shares) - excluding sales charge | 12.25 | 16.33 | 9.96 | ||||
| Russell 1000 Index | 15.66 | 16.30 | 13.35 | ||||
| Russell 1000 Value Index | 13.70 | 13.93 | 9.19 |
KEY FUND STATISTICS
| Fund net assets (000's) | $5,050,019 | |
| Total number of portfolio holdings | 99 | |
| Portfolio turnover rate | 185 | % |
| Total advisory fees paid (000's) | $17,634 |
PORTFOLIO COMPOSITION - SECTOR
(% of Total Investments)
(% of Total Investments)

What were the Fund costs for the last year?
(based on a hypothetical $10,000 investment)
| Fund (Class) | Costs of a $10,000 investment |
Costs paid as a percentage of a $10,000 investment |
| JPMorgan Large Cap Value Fund (Class I Shares) |
$73 | 0.69% |
How did the Fund Perform?
The JPMorgan Large Cap Value Fund's Class I Shares returned 13.05% for the twelve months ended June 30, 2025. The Russell 1000 Index returned 15.66% and the Russell 1000 Value Index (the "Index") returned 13.70% for the twelve months ended June 30, 2025.
- The Fund’s security selection in the materials and health care sectors detracted from performance.
- The Fund’s underweight allocation to JPMorgan Chase & Co. and overweight allocation to Regeneron Pharmaceuticals Inc. detracted from performance.
- The Fund’s security selection in the information technology and consumer staples sectors contributed to performance.
- The Fund’s overweight allocation to Philip Morris International and Seagate Technology Holdings plc contributed to performance.
Fund Performance
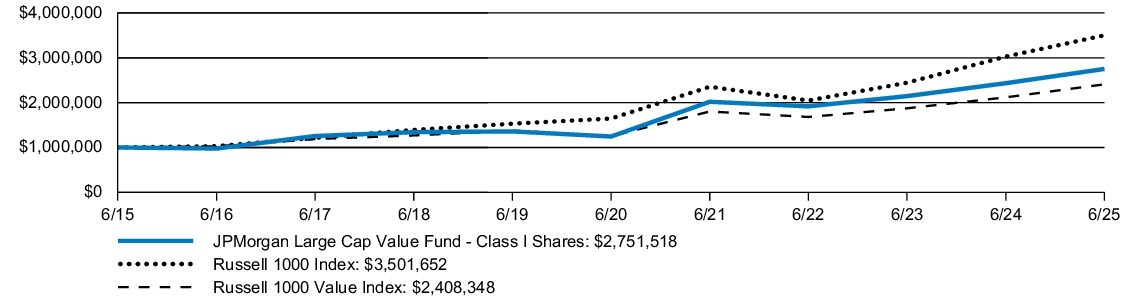
| AVERAGE ANNUAL TOTAL RETURNS | INCEPTION DATE |
1 YEAR | 5 YEAR | 10 YEAR | |||
| JPMorgan Large Cap Value Fund (Class I Shares) | March 1, 1991 | 13.05 | % | 17.19 | % | 10.65 | % |
| Russell 1000 Index | 15.66 | 16.30 | 13.35 | ||||
| Russell 1000 Value Index | 13.70 | 13.93 | 9.19 |
KEY FUND STATISTICS
| Fund net assets (000's) | $5,050,019 | |
| Total number of portfolio holdings | 99 | |
| Portfolio turnover rate | 185 | % |
| Total advisory fees paid (000's) | $17,634 |
PORTFOLIO COMPOSITION - SECTOR
(% of Total Investments)
(% of Total Investments)

What were the Fund costs for the last year?
(based on a hypothetical $10,000 investment)
| Fund (Class) | Costs of a $10,000 investment |
Costs paid as a percentage of a $10,000 investment |
| JPMorgan Large Cap Value Fund (Class R2 Shares) |
$126 | 1.19% |
How did the Fund Perform?
The JPMorgan Large Cap Value Fund's Class R2 Shares returned 12.55% for the twelve months ended June 30, 2025. The Russell 1000 Index returned 15.66% and the Russell 1000 Value Index (the "Index") returned 13.70% for the twelve months ended June 30, 2025.
- The Fund’s security selection in the materials and health care sectors detracted from performance.
- The Fund’s underweight allocation to JPMorgan Chase & Co. and overweight allocation to Regeneron Pharmaceuticals Inc. detracted from performance.
- The Fund’s security selection in the information technology and consumer staples sectors contributed to performance.
- The Fund’s overweight allocation to Philip Morris International and Seagate Technology Holdings plc contributed to performance.
Fund Performance

| AVERAGE ANNUAL TOTAL RETURNS | INCEPTION DATE |
1 YEAR | 5 YEAR | 10 YEAR | |||
| JPMorgan Large Cap Value Fund (Class R2 Shares) | November 3, 2008 | 12.55 | % | 16.61 | % | 10.11 | % |
| Russell 1000 Index | 15.66 | 16.30 | 13.35 | ||||
| Russell 1000 Value Index | 13.70 | 13.93 | 9.19 |
KEY FUND STATISTICS
| Fund net assets (000's) | $5,050,019 | |
| Total number of portfolio holdings | 99 | |
| Portfolio turnover rate | 185 | % |
| Total advisory fees paid (000's) | $17,634 |
PORTFOLIO COMPOSITION - SECTOR
(% of Total Investments)
(% of Total Investments)

What were the Fund costs for the last year?
(based on a hypothetical $10,000 investment)
| Fund (Class) | Costs of a $10,000 investment |
Costs paid as a percentage of a $10,000 investment |
| JPMorgan Large Cap Value Fund (Class R3 Shares) |
$100 | 0.94% |
How did the Fund Perform?
The JPMorgan Large Cap Value Fund's Class R3 Shares returned 12.82% for the twelve months ended June 30, 2025. The Russell 1000 Index returned 15.66% and the Russell 1000 Value Index (the "Index") returned 13.70% for the twelve months ended June 30, 2025.
- The Fund’s security selection in the materials and health care sectors detracted from performance.
- The Fund’s underweight allocation to JPMorgan Chase & Co. and overweight allocation to Regeneron Pharmaceuticals Inc. detracted from performance.
- The Fund’s security selection in the information technology and consumer staples sectors contributed to performance.
- The Fund’s overweight allocation to Philip Morris International and Seagate Technology Holdings plc contributed to performance.
Fund Performance

| AVERAGE ANNUAL TOTAL RETURNS | INCEPTION DATE |
1 YEAR | 5 YEAR | 10 YEAR | |||
| JPMorgan Large Cap Value Fund (Class R3 Shares) | October 1, 2018 | 12.82 | % | 16.91 | % | 10.40 | % |
| Russell 1000 Index | 15.66 | 16.30 | 13.35 | ||||
| Russell 1000 Value Index | 13.70 | 13.93 | 9.19 |
KEY FUND STATISTICS
| Fund net assets (000's) | $5,050,019 | |
| Total number of portfolio holdings | 99 | |
| Portfolio turnover rate | 185 | % |
| Total advisory fees paid (000's) | $17,634 |
PORTFOLIO COMPOSITION - SECTOR
(% of Total Investments)
(% of Total Investments)

What were the Fund costs for the last year?
(based on a hypothetical $10,000 investment)
| Fund (Class) | Costs of a $10,000 investment |
Costs paid as a percentage of a $10,000 investment |
| JPMorgan Large Cap Value Fund (Class R4 Shares) |
$73 | 0.69% |
How did the Fund Perform?
The JPMorgan Large Cap Value Fund's Class R4 Shares returned 13.06% for the twelve months ended June 30, 2025. The Russell 1000 Index returned 15.66% and the Russell 1000 Value Index (the "Index") returned 13.70% for the twelve months ended June 30, 2025.
- The Fund’s security selection in the materials and health care sectors detracted from performance.
- The Fund’s underweight allocation to JPMorgan Chase & Co. and overweight allocation to Regeneron Pharmaceuticals Inc. detracted from performance.
- The Fund’s security selection in the information technology and consumer staples sectors contributed to performance.
- The Fund’s overweight allocation to Philip Morris International and Seagate Technology Holdings plc contributed to performance.
Fund Performance
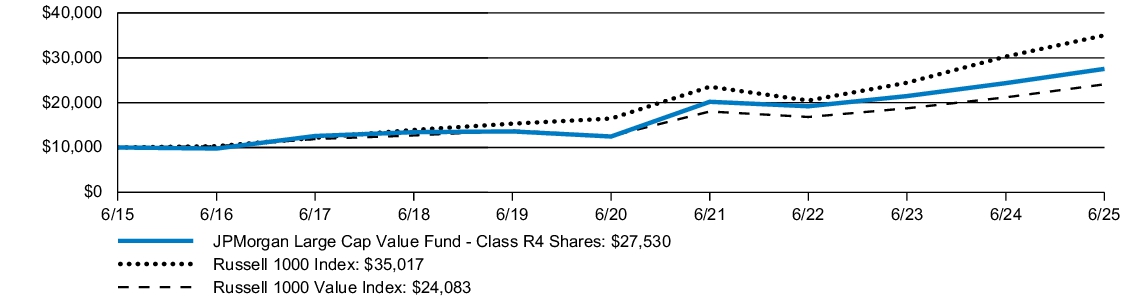
| AVERAGE ANNUAL TOTAL RETURNS | INCEPTION DATE |
1 YEAR | 5 YEAR | 10 YEAR | |||
| JPMorgan Large Cap Value Fund (Class R4 Shares) | October 1, 2018 | 13.06 | % | 17.20 | % | 10.66 | % |
| Russell 1000 Index | 15.66 | 16.30 | 13.35 | ||||
| Russell 1000 Value Index | 13.70 | 13.93 | 9.19 |
KEY FUND STATISTICS
| Fund net assets (000's) | $5,050,019 | |
| Total number of portfolio holdings | 99 | |
| Portfolio turnover rate | 185 | % |
| Total advisory fees paid (000's) | $17,634 |
PORTFOLIO COMPOSITION - SECTOR
(% of Total Investments)
(% of Total Investments)

What were the Fund costs for the last year?
(based on a hypothetical $10,000 investment)
| Fund (Class) | Costs of a $10,000 investment |
Costs paid as a percentage of a $10,000 investment |
| JPMorgan Large Cap Value Fund (Class R5 Shares) |
$57 | 0.54% |
How did the Fund Perform?
The JPMorgan Large Cap Value Fund's Class R5 Shares returned 13.29% for the twelve months ended June 30, 2025. The Russell 1000 Index returned 15.66% and the Russell 1000 Value Index (the "Index") returned 13.70% for the twelve months ended June 30, 2025.
- The Fund’s security selection in the materials and health care sectors detracted from performance.
- The Fund’s underweight allocation to JPMorgan Chase & Co. and overweight allocation to Regeneron Pharmaceuticals Inc. detracted from performance.
- The Fund’s security selection in the information technology and consumer staples sectors contributed to performance.
- The Fund’s overweight allocation to Philip Morris International and Seagate Technology Holdings plc contributed to performance.
Fund Performance
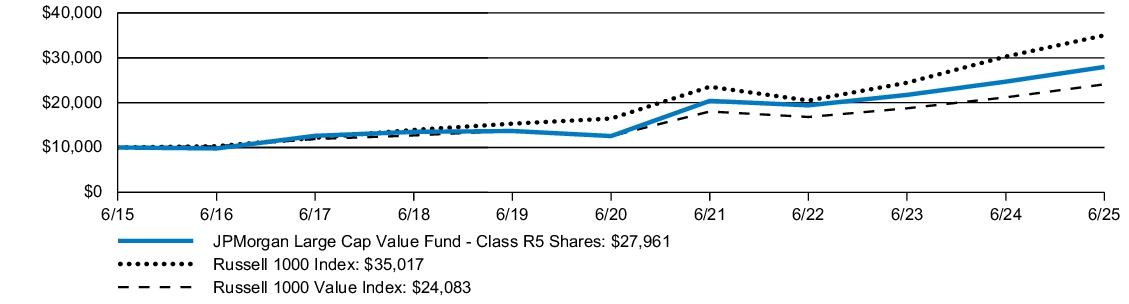
| AVERAGE ANNUAL TOTAL RETURNS | INCEPTION DATE |
1 YEAR | 5 YEAR | 10 YEAR | |||
| JPMorgan Large Cap Value Fund (Class R5 Shares) | May 15, 2006 | 13.29 | % | 17.38 | % | 10.83 | % |
| Russell 1000 Index | 15.66 | 16.30 | 13.35 | ||||
| Russell 1000 Value Index | 13.70 | 13.93 | 9.19 |
KEY FUND STATISTICS
| Fund net assets (000's) | $5,050,019 | |
| Total number of portfolio holdings | 99 | |
| Portfolio turnover rate | 185 | % |
| Total advisory fees paid (000's) | $17,634 |
PORTFOLIO COMPOSITION - SECTOR
(% of Total Investments)
(% of Total Investments)
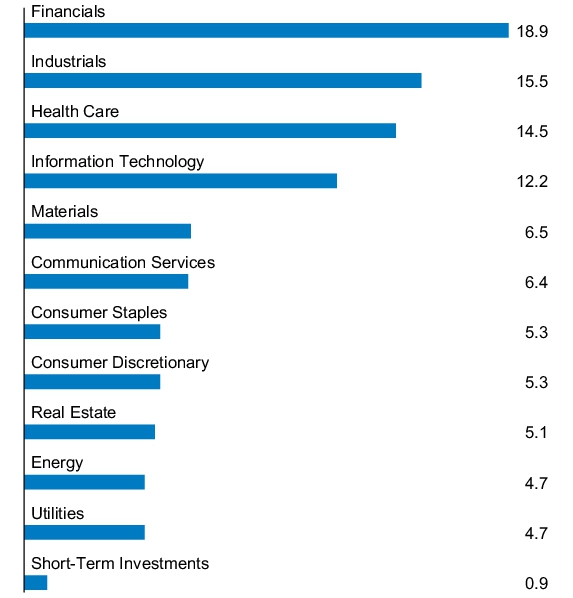
What were the Fund costs for the last year?
(based on a hypothetical $10,000 investment)
| Fund (Class) | Costs of a $10,000 investment |
Costs paid as a percentage of a $10,000 investment |
| JPMorgan Large Cap Value Fund (Class R6 Shares) |
$47 | 0.44% |
How did the Fund Perform?
The JPMorgan Large Cap Value Fund's Class R6 Shares returned 13.36% for the twelve months ended June 30, 2025. The Russell 1000 Index returned 15.66% and the Russell 1000 Value Index (the "Index") returned 13.70% for the twelve months ended June 30, 2025.
- The Fund’s security selection in the materials and health care sectors detracted from performance.
- The Fund’s underweight allocation to JPMorgan Chase & Co. and overweight allocation to Regeneron Pharmaceuticals Inc. detracted from performance.
- The Fund’s security selection in the information technology and consumer staples sectors contributed to performance.
- The Fund’s overweight allocation to Philip Morris International and Seagate Technology Holdings plc contributed to performance.
Fund Performance
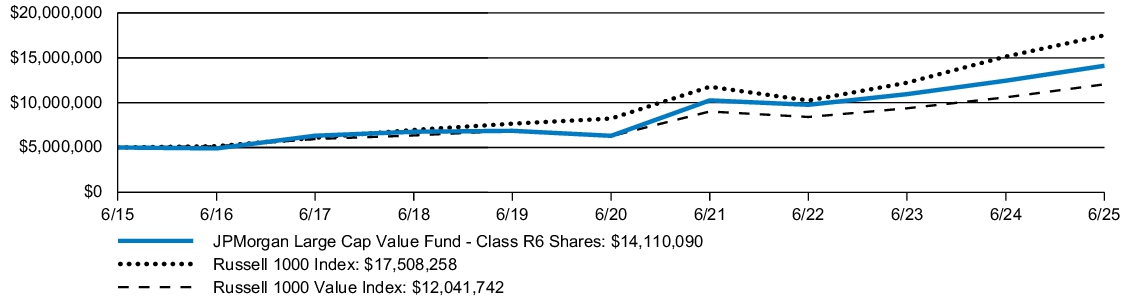
| AVERAGE ANNUAL TOTAL RETURNS | INCEPTION DATE |
1 YEAR | 5 YEAR | 10 YEAR | |||
| JPMorgan Large Cap Value Fund (Class R6 Shares) | November 30, 2010 | 13.36 | % | 17.50 | % | 10.93 | % |
| Russell 1000 Index | 15.66 | 16.30 | 13.35 | ||||
| Russell 1000 Value Index | 13.70 | 13.93 | 9.19 |
KEY FUND STATISTICS
| Fund net assets (000's) | $5,050,019 | |
| Total number of portfolio holdings | 99 | |
| Portfolio turnover rate | 185 | % |
| Total advisory fees paid (000's) | $17,634 |
PORTFOLIO COMPOSITION - SECTOR
(% of Total Investments)
(% of Total Investments)

What were the Fund costs for the last year?
(based on a hypothetical $10,000 investment)
| Fund (Class) | Costs of a $10,000 investment |
Costs paid as a percentage of a $10,000 investment |
| JPMorgan Small Cap Growth Fund (Class A Shares) |
$125 | 1.24% |
How did the Fund Perform?
The JPMorgan Small Cap Growth Fund's Class A Shares, without a sales charge, returned 2.55% for the twelve months ended June 30, 2025. The Russell 3000 Index returned 15.30% and the Russell 2000 Growth Index (the "Index") returned 9.73% for the twelve months ended June 30, 2025.
- The Fund’s security selection in the health care and consumer discretionary sectors detracted from performance.
- The Fund’s overweight allocation to Six Flags and Biohaven detracted from performance.
- The Fund’s security selection in the energy and consumer staples sectors contributed to performance.
- The Fund’s overweight allocation to Intra-Cellular Therapies and Karman Holdings contributed to performance.
Fund Performance
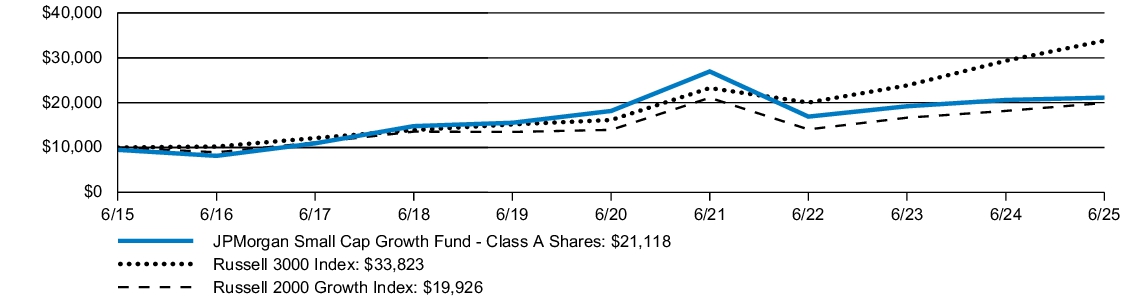
| AVERAGE ANNUAL TOTAL RETURNS | INCEPTION DATE |
1 YEAR | 5 YEAR | 10 YEAR | |||
| JPMorgan Small Cap Growth Fund (Class A Shares) | July 1, 1991 | (2.85 | )% | 1.97 | % | 7.76 | % |
| JPMorgan Small Cap Growth Fund (Class A Shares) - excluding sales charge | 2.55 | 3.08 | 8.34 | ||||
| Russell 3000 Index | 15.30 | 15.96 | 12.96 | ||||
| Russell 2000 Growth Index | 9.73 | 7.42 | 7.14 |
KEY FUND STATISTICS
| Fund net assets (000's) | $3,233,053 | |
| Total number of portfolio holdings | 134 | |
| Portfolio turnover rate | 48 | % |
| Total advisory fees paid (000's) | $22,426 |
PORTFOLIO COMPOSITION - SECTOR
(% of Total Investments)
(% of Total Investments)

What were the Fund costs for the last year?
(based on a hypothetical $10,000 investment)
| Fund (Class) | Costs of a $10,000 investment |
Costs paid as a percentage of a $10,000 investment |
| JPMorgan Small Cap Growth Fund (Class C Shares) |
$175 | 1.74% |
How did the Fund Perform?
The JPMorgan Small Cap Growth Fund's Class C Shares, without a sales charge, returned 2.03% for the twelve months ended June 30, 2025. The Russell 3000 Index returned 15.30% and the Russell 2000 Growth Index (the "Index") returned 9.73% for the twelve months ended June 30, 2025.
- The Fund’s security selection in the health care and consumer discretionary sectors detracted from performance.
- The Fund’s overweight allocation to Six Flags and Biohaven detracted from performance.
- The Fund’s security selection in the energy and consumer staples sectors contributed to performance.
- The Fund’s overweight allocation to Intra-Cellular Therapies and Karman Holdings contributed to performance.
Fund Performance
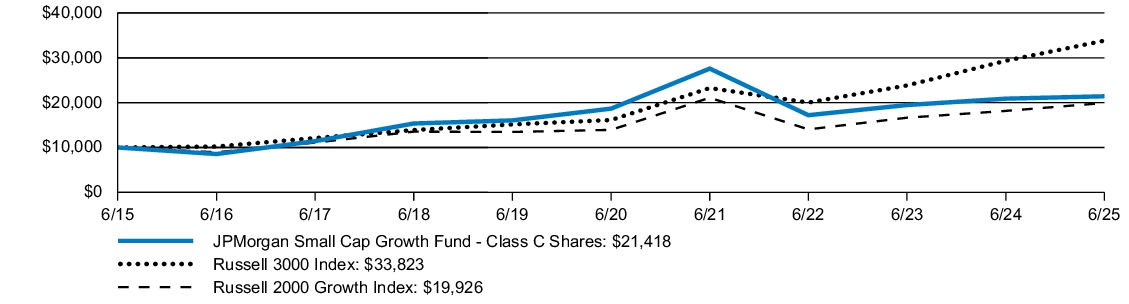
| AVERAGE ANNUAL TOTAL RETURNS | INCEPTION DATE |
1 YEAR | 5 YEAR | 10 YEAR | |||
| JPMorgan Small Cap Growth Fund (Class C Shares) | November 4, 1997 | 1.03 | % | 2.57 | % | 7.91 | % |
| JPMorgan Small Cap Growth Fund (Class C Shares) - excluding sales charge | 2.03 | 2.57 | 7.91 | ||||
| Russell 3000 Index | 15.30 | 15.96 | 12.96 | ||||
| Russell 2000 Growth Index | 9.73 | 7.42 | 7.14 |
KEY FUND STATISTICS
| Fund net assets (000's) | $3,233,053 | |
| Total number of portfolio holdings | 134 | |
| Portfolio turnover rate | 48 | % |
| Total advisory fees paid (000's) | $22,426 |
PORTFOLIO COMPOSITION - SECTOR
(% of Total Investments)
(% of Total Investments)

What were the Fund costs for the last year?
(based on a hypothetical $10,000 investment)
| Fund (Class) | Costs of a $10,000 investment |
Costs paid as a percentage of a $10,000 investment |
| JPMorgan Small Cap Growth Fund (Class I Shares) |
$100 | 0.99% |
How did the Fund Perform?
The JPMorgan Small Cap Growth Fund's Class I Shares returned 2.85% for the twelve months ended June 30, 2025. The Russell 3000 Index returned 15.30% and the Russell 2000 Growth Index (the "Index") returned 9.73% for the twelve months ended June 30, 2025.
- The Fund’s security selection in the health care and consumer discretionary sectors detracted from performance.
- The Fund’s overweight allocation to Six Flags and Biohaven detracted from performance.
- The Fund’s security selection in the energy and consumer staples sectors contributed to performance.
- The Fund’s overweight allocation to Intra-Cellular Therapies and Karman Holdings contributed to performance.
Fund Performance
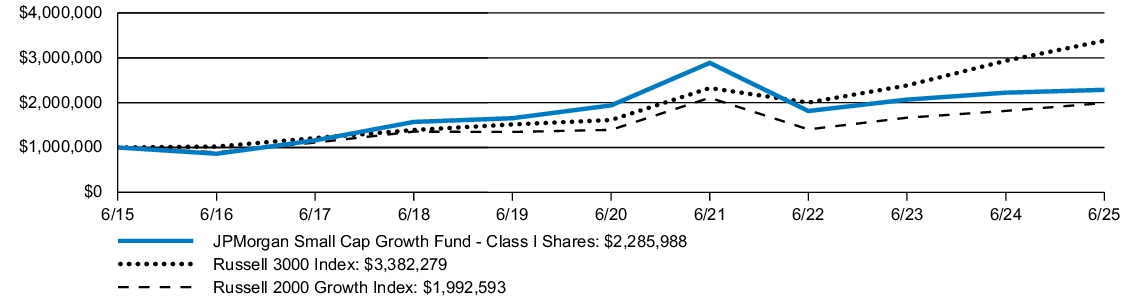
| AVERAGE ANNUAL TOTAL RETURNS | INCEPTION DATE |
1 YEAR | 5 YEAR | 10 YEAR | |||
| JPMorgan Small Cap Growth Fund (Class I Shares) | March 26, 1996 | 2.85 | % | 3.35 | % | 8.62 | % |
| Russell 3000 Index | 15.30 | 15.96 | 12.96 | ||||
| Russell 2000 Growth Index | 9.73 | 7.42 | 7.14 |
KEY FUND STATISTICS
| Fund net assets (000's) | $3,233,053 | |
| Total number of portfolio holdings | 134 | |
| Portfolio turnover rate | 48 | % |
| Total advisory fees paid (000's) | $22,426 |
PORTFOLIO COMPOSITION - SECTOR
(% of Total Investments)
(% of Total Investments)

What were the Fund costs for the last year?
(based on a hypothetical $10,000 investment)
| Fund (Class) | Costs of a $10,000 investment |
Costs paid as a percentage of a $10,000 investment |
| JPMorgan Small Cap Growth Fund (Class L Shares) |
$85 | 0.84% |
How did the Fund Perform?
The JPMorgan Small Cap Growth Fund's Class L Shares returned 3.01% for the twelve months ended June 30, 2025. The Russell 3000 Index returned 15.30% and the Russell 2000 Growth Index (the "Index") returned 9.73% for the twelve months ended June 30, 2025.
- The Fund’s security selection in the health care and consumer discretionary sectors detracted from performance.
- The Fund’s overweight allocation to Six Flags and Biohaven detracted from performance.
- The Fund’s security selection in the energy and consumer staples sectors contributed to performance.
- The Fund’s overweight allocation to Intra-Cellular Therapies and Karman Holdings contributed to performance.
Fund Performance

| AVERAGE ANNUAL TOTAL RETURNS | INCEPTION DATE |
1 YEAR | 5 YEAR | 10 YEAR | |||
| JPMorgan Small Cap Growth Fund (Class L Shares) | February 19, 2005 | 3.01 | % | 3.50 | % | 8.78 | % |
| Russell 3000 Index | 15.30 | 15.96 | 12.96 | ||||
| Russell 2000 Growth Index | 9.73 | 7.42 | 7.14 |
KEY FUND STATISTICS
| Fund net assets (000's) | $3,233,053 | |
| Total number of portfolio holdings | 134 | |
| Portfolio turnover rate | 48 | % |
| Total advisory fees paid (000's) | $22,426 |
PORTFOLIO COMPOSITION - SECTOR
(% of Total Investments)
(% of Total Investments)
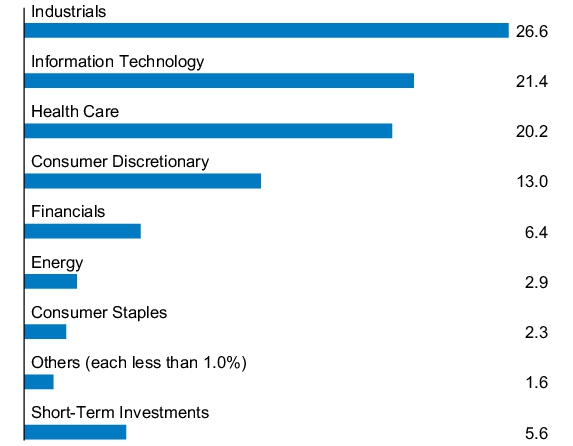
What were the Fund costs for the last year?
(based on a hypothetical $10,000 investment)
| Fund (Class) | Costs of a $10,000 investment |
Costs paid as a percentage of a $10,000 investment |
| JPMorgan Small Cap Growth Fund (Class R2 Shares) |
$150 | 1.49% |
How did the Fund Perform?
The JPMorgan Small Cap Growth Fund's Class R2 Shares returned 2.37% for the twelve months ended June 30, 2025. The Russell 3000 Index returned 15.30% and the Russell 2000 Growth Index (the "Index") returned 9.73% for the twelve months ended June 30, 2025.
- The Fund’s security selection in the health care and consumer discretionary sectors detracted from performance.
- The Fund’s overweight allocation to Six Flags and Biohaven detracted from performance.
- The Fund’s security selection in the energy and consumer staples sectors contributed to performance.
- The Fund’s overweight allocation to Intra-Cellular Therapies and Karman Holdings contributed to performance.
Fund Performance
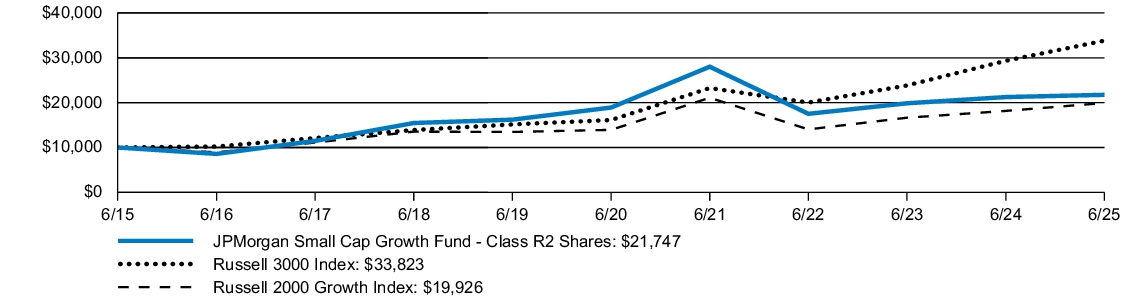
| AVERAGE ANNUAL TOTAL RETURNS | INCEPTION DATE |
1 YEAR | 5 YEAR | 10 YEAR | |||
| JPMorgan Small Cap Growth Fund (Class R2 Shares) | November 3, 2008 | 2.37 | % | 2.83 | % | 8.08 | % |
| Russell 3000 Index | 15.30 | 15.96 | 12.96 | ||||
| Russell 2000 Growth Index | 9.73 | 7.42 | 7.14 |
KEY FUND STATISTICS
| Fund net assets (000's) | $3,233,053 | |
| Total number of portfolio holdings | 134 | |
| Portfolio turnover rate | 48 | % |
| Total advisory fees paid (000's) | $22,426 |
PORTFOLIO COMPOSITION - SECTOR
(% of Total Investments)
(% of Total Investments)

What were the Fund costs for the last year?
(based on a hypothetical $10,000 investment)
| Fund (Class) | Costs of a $10,000 investment |
Costs paid as a percentage of a $10,000 investment |
| JPMorgan Small Cap Growth Fund (Class R3 Shares) |
$125 | 1.24% |
How did the Fund Perform?
The JPMorgan Small Cap Growth Fund's Class R3 Shares returned 2.55% for the twelve months ended June 30, 2025. The Russell 3000 Index returned 15.30% and the Russell 2000 Growth Index (the "Index") returned 9.73% for the twelve months ended June 30, 2025.
- The Fund’s security selection in the health care and consumer discretionary sectors detracted from performance.
- The Fund’s overweight allocation to Six Flags and Biohaven detracted from performance.
- The Fund’s security selection in the energy and consumer staples sectors contributed to performance.
- The Fund’s overweight allocation to Intra-Cellular Therapies and Karman Holdings contributed to performance.
Fund Performance
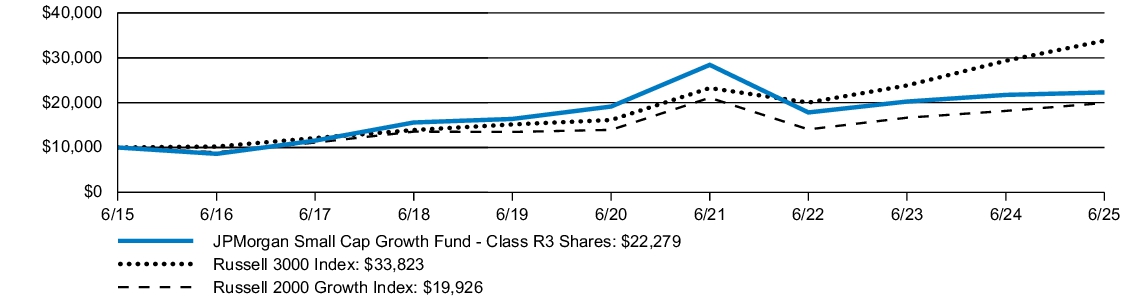
| AVERAGE ANNUAL TOTAL RETURNS | INCEPTION DATE |
1 YEAR | 5 YEAR | 10 YEAR | |||
| JPMorgan Small Cap Growth Fund (Class R3 Shares) | July 31, 2017 | 2.55 | % | 3.09 | % | 8.34 | % |
| Russell 3000 Index | 15.30 | 15.96 | 12.96 | ||||
| Russell 2000 Growth Index | 9.73 | 7.42 | 7.14 |
KEY FUND STATISTICS
| Fund net assets (000's) | $3,233,053 | |
| Total number of portfolio holdings | 134 | |
| Portfolio turnover rate | 48 | % |
| Total advisory fees paid (000's) | $22,426 |
PORTFOLIO COMPOSITION - SECTOR
(% of Total Investments)
(% of Total Investments)

What were the Fund costs for the last year?
(based on a hypothetical $10,000 investment)
| Fund (Class) | Costs of a $10,000 investment |
Costs paid as a percentage of a $10,000 investment |
| JPMorgan Small Cap Growth Fund (Class R4 Shares) |
$100 | 0.99% |
How did the Fund Perform?
The JPMorgan Small Cap Growth Fund's Class R4 Shares returned 2.85% for the twelve months ended June 30, 2025. The Russell 3000 Index returned 15.30% and the Russell 2000 Growth Index (the "Index") returned 9.73% for the twelve months ended June 30, 2025.
- The Fund’s security selection in the health care and consumer discretionary sectors detracted from performance.
- The Fund’s overweight allocation to Six Flags and Biohaven detracted from performance.
- The Fund’s security selection in the energy and consumer staples sectors contributed to performance.
- The Fund’s overweight allocation to Intra-Cellular Therapies and Karman Holdings contributed to performance.
Fund Performance

| AVERAGE ANNUAL TOTAL RETURNS | INCEPTION DATE |
1 YEAR | 5 YEAR | 10 YEAR | |||
| JPMorgan Small Cap Growth Fund (Class R4 Shares) | July 31, 2017 | 2.85 | % | 3.35 | % | 8.62 | % |
| Russell 3000 Index | 15.30 | 15.96 | 12.96 | ||||
| Russell 2000 Growth Index | 9.73 | 7.42 | 7.14 |
KEY FUND STATISTICS
| Fund net assets (000's) | $3,233,053 | |
| Total number of portfolio holdings | 134 | |
| Portfolio turnover rate | 48 | % |
| Total advisory fees paid (000's) | $22,426 |
PORTFOLIO COMPOSITION - SECTOR
(% of Total Investments)
(% of Total Investments)

What were the Fund costs for the last year?
(based on a hypothetical $10,000 investment)
| Fund (Class) | Costs of a $10,000 investment |
Costs paid as a percentage of a $10,000 investment |
| JPMorgan Small Cap Growth Fund (Class R5 Shares) |
$85 | 0.84% |
How did the Fund Perform?
The JPMorgan Small Cap Growth Fund's Class R5 Shares returned 2.95% for the twelve months ended June 30, 2025. The Russell 3000 Index returned 15.30% and the Russell 2000 Growth Index (the "Index") returned 9.73% for the twelve months ended June 30, 2025.
- The Fund’s security selection in the health care and consumer discretionary sectors detracted from performance.
- The Fund’s overweight allocation to Six Flags and Biohaven detracted from performance.
- The Fund’s security selection in the energy and consumer staples sectors contributed to performance.
- The Fund’s overweight allocation to Intra-Cellular Therapies and Karman Holdings contributed to performance.
Fund Performance
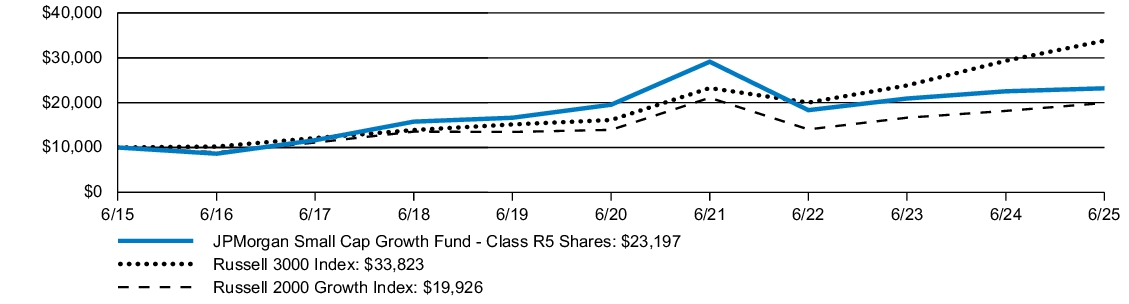
| AVERAGE ANNUAL TOTAL RETURNS | INCEPTION DATE |
1 YEAR | 5 YEAR | 10 YEAR | |||
| JPMorgan Small Cap Growth Fund (Class R5 Shares) | September 9, 2016 | 2.95 | % | 3.49 | % | 8.78 | % |
| Russell 3000 Index | 15.30 | 15.96 | 12.96 | ||||
| Russell 2000 Growth Index | 9.73 | 7.42 | 7.14 |
KEY FUND STATISTICS
| Fund net assets (000's) | $3,233,053 | |
| Total number of portfolio holdings | 134 | |
| Portfolio turnover rate | 48 | % |
| Total advisory fees paid (000's) | $22,426 |
PORTFOLIO COMPOSITION - SECTOR
(% of Total Investments)
(% of Total Investments)

What were the Fund costs for the last year?
(based on a hypothetical $10,000 investment)
| Fund (Class) | Costs of a $10,000 investment |
Costs paid as a percentage of a $10,000 investment |
| JPMorgan Small Cap Growth Fund (Class R6 Shares) |
$75 | 0.74% |
How did the Fund Perform?
The JPMorgan Small Cap Growth Fund's Class R6 Shares returned 3.06% for the twelve months ended June 30, 2025. The Russell 3000 Index returned 15.30% and the Russell 2000 Growth Index (the "Index") returned 9.73% for the twelve months ended June 30, 2025.
- The Fund’s security selection in the health care and consumer discretionary sectors detracted from performance.
- The Fund’s overweight allocation to Six Flags and Biohaven detracted from performance.
- The Fund’s security selection in the energy and consumer staples sectors contributed to performance.
- The Fund’s overweight allocation to Intra-Cellular Therapies and Karman Holdings contributed to performance.
Fund Performance
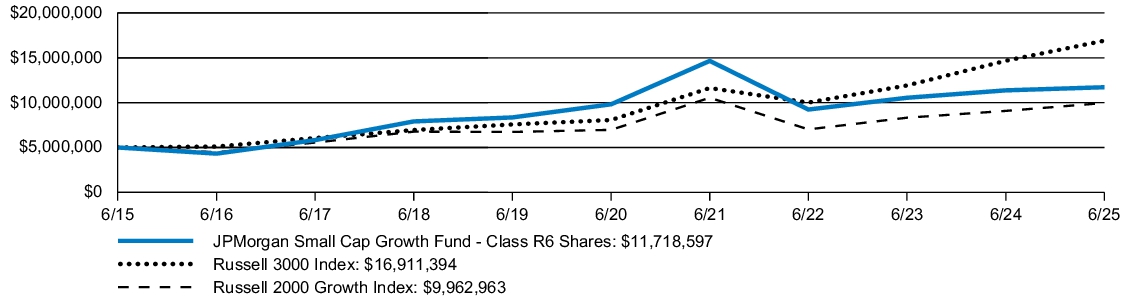
| AVERAGE ANNUAL TOTAL RETURNS | INCEPTION DATE |
1 YEAR | 5 YEAR | 10 YEAR | |||
| JPMorgan Small Cap Growth Fund (Class R6 Shares) | November 30, 2010 | 3.06 | % | 3.60 | % | 8.89 | % |
| Russell 3000 Index | 15.30 | 15.96 | 12.96 | ||||
| Russell 2000 Growth Index | 9.73 | 7.42 | 7.14 |
KEY FUND STATISTICS
| Fund net assets (000's) | $3,233,053 | |
| Total number of portfolio holdings | 134 | |
| Portfolio turnover rate | 48 | % |
| Total advisory fees paid (000's) | $22,426 |
PORTFOLIO COMPOSITION - SECTOR
(% of Total Investments)
(% of Total Investments)

What were the Fund costs for the last year?
(based on a hypothetical $10,000 investment)
| Fund (Class) | Costs of a $10,000 investment |
Costs paid as a percentage of a $10,000 investment |
| JPMorgan Small Cap Value Fund (Class A Shares) |
$121 | 1.19% |
How did the Fund Perform?
The JPMorgan Small Cap Value Fund's Class A Shares, without a sales charge, returned 3.63% for the twelve months ended June 30, 2025. The Russell 3000 Index returned 15.30% and the Russell 2000 Value Index (the "Index") returned 5.54% for the twelve months ended June 30, 2025.
- The Fund’s security selection in the pharmaceuticals and telecommunications subsectors detracted from performance.
- An allocation overweight in Liberty Latin America Ltd. and an allocation underweight in Lumen Technologies, Inc. were among the top detractors from performance.
- The Fund’s security selection in the health services & systems and finance subsectors contributed to performance
- Allocation overweights in Rigetti Computing, Inc. and Pediatrix Medical Group, Inc. were among the top contributors to performance.
Fund Performance
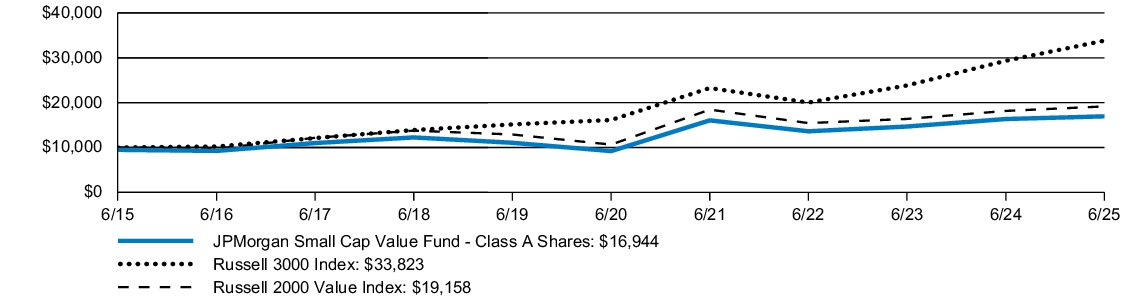
| AVERAGE ANNUAL TOTAL RETURNS | INCEPTION DATE |
1 YEAR | 5 YEAR | 10 YEAR | |||
| JPMorgan Small Cap Value Fund (Class A Shares) | January 27, 1995 | (1.79 | )% | 11.79 | % | 5.41 | % |
| JPMorgan Small Cap Value Fund (Class A Shares) - excluding sales charge | 3.63 | 13.00 | 5.99 | ||||
| Russell 3000 Index | 15.30 | 15.96 | 12.96 | ||||
| Russell 2000 Value Index | 5.54 | 12.47 | 6.72 |
KEY FUND STATISTICS
| Fund net assets (000's) | $1,183,140 | |
| Total number of portfolio holdings | 426 | |
| Portfolio turnover rate | 72 | % |
| Total advisory fees paid (000's) | $7,940 |
PORTFOLIO COMPOSITION - SECTOR
(% of Total Investments)
(% of Total Investments)

What were the Fund costs for the last year?
(based on a hypothetical $10,000 investment)
| Fund (Class) | Costs of a $10,000 investment |
Costs paid as a percentage of a $10,000 investment |
| JPMorgan Small Cap Value Fund (Class C Shares) |
$171 | 1.69% |
How did the Fund Perform?
The JPMorgan Small Cap Value Fund's Class C Shares, without a sales charge, returned 3.08% for the twelve months ended June 30, 2025. The Russell 3000 Index returned 15.30% and the Russell 2000 Value Index (the "Index") returned 5.54% for the twelve months ended June 30, 2025.
- The Fund’s security selection in the pharmaceuticals and telecommunications subsectors detracted from performance.
- An allocation overweight in Liberty Latin America Ltd. and an allocation underweight in Lumen Technologies, Inc. were among the top detractors from performance.
- The Fund’s security selection in the health services & systems and finance subsectors contributed to performance
- Allocation overweights in Rigetti Computing, Inc. and Pediatrix Medical Group, Inc. were among the top contributors to performance.
Fund Performance
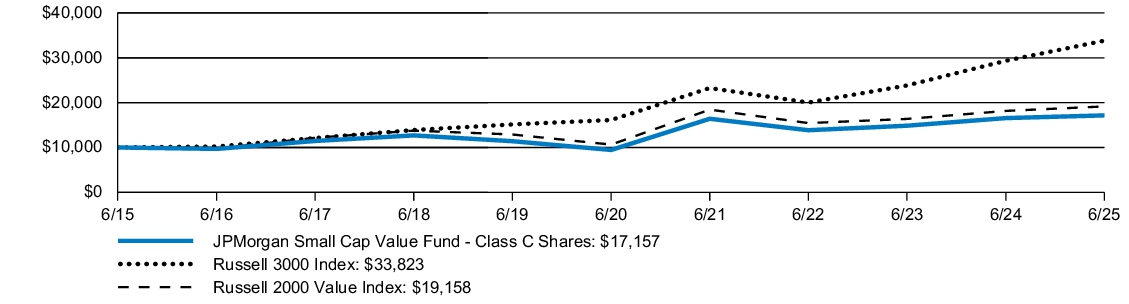
| AVERAGE ANNUAL TOTAL RETURNS | INCEPTION DATE |
1 YEAR | 5 YEAR | 10 YEAR | |||
| JPMorgan Small Cap Value Fund (Class C Shares) | March 22, 1999 | 2.08 | % | 12.43 | % | 5.55 | % |
| JPMorgan Small Cap Value Fund (Class C Shares) - excluding sales charge | 3.08 | 12.43 | 5.55 | ||||
| Russell 3000 Index | 15.30 | 15.96 | 12.96 | ||||
| Russell 2000 Value Index | 5.54 | 12.47 | 6.72 |
KEY FUND STATISTICS
| Fund net assets (000's) | $1,183,140 | |
| Total number of portfolio holdings | 426 | |
| Portfolio turnover rate | 72 | % |
| Total advisory fees paid (000's) | $7,940 |
PORTFOLIO COMPOSITION - SECTOR
(% of Total Investments)
(% of Total Investments)

What were the Fund costs for the last year?
(based on a hypothetical $10,000 investment)
| Fund (Class) | Costs of a $10,000 investment |
Costs paid as a percentage of a $10,000 investment |
| JPMorgan Small Cap Value Fund (Class I Shares) |
$95 | 0.94% |
How did the Fund Perform?
The JPMorgan Small Cap Value Fund's Class I Shares returned 3.90% for the twelve months ended June 30, 2025. The Russell 3000 Index returned 15.30% and the Russell 2000 Value Index (the "Index") returned 5.54% for the twelve months ended June 30, 2025.
- The Fund’s security selection in the pharmaceuticals and telecommunications subsectors detracted from performance.
- An allocation overweight in Liberty Latin America Ltd. and an allocation underweight in Lumen Technologies, Inc. were among the top detractors from performance.
- The Fund’s security selection in the health services & systems and finance subsectors contributed to performance
- Allocation overweights in Rigetti Computing, Inc. and Pediatrix Medical Group, Inc. were among the top contributors to performance.
Fund Performance
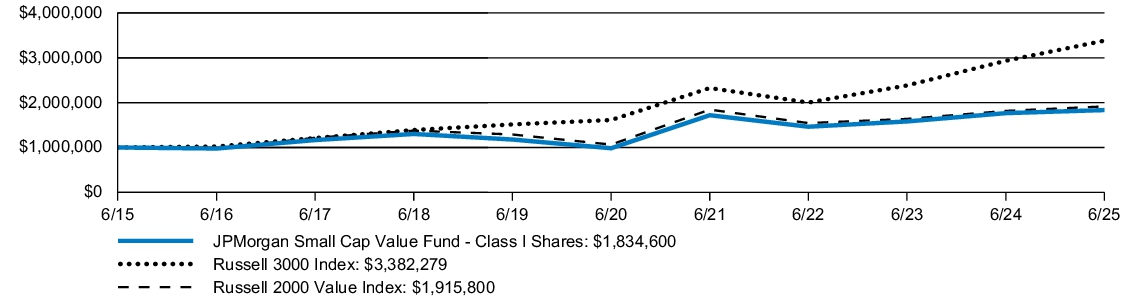
| AVERAGE ANNUAL TOTAL RETURNS | INCEPTION DATE |
1 YEAR | 5 YEAR | 10 YEAR | |||
| JPMorgan Small Cap Value Fund (Class I Shares) | January 27, 1995 | 3.90 | % | 13.29 | % | 6.26 | % |
| Russell 3000 Index | 15.30 | 15.96 | 12.96 | ||||
| Russell 2000 Value Index | 5.54 | 12.47 | 6.72 |
KEY FUND STATISTICS
| Fund net assets (000's) | $1,183,140 | |
| Total number of portfolio holdings | 426 | |
| Portfolio turnover rate | 72 | % |
| Total advisory fees paid (000's) | $7,940 |
PORTFOLIO COMPOSITION - SECTOR
(% of Total Investments)
(% of Total Investments)

What were the Fund costs for the last year?
(based on a hypothetical $10,000 investment)
| Fund (Class) | Costs of a $10,000 investment |
Costs paid as a percentage of a $10,000 investment |
| JPMorgan Small Cap Value Fund (Class R2 Shares) |
$151 | 1.49% |
How did the Fund Perform?
The JPMorgan Small Cap Value Fund's Class R2 Shares returned 3.31% for the twelve months ended June 30, 2025. The Russell 3000 Index returned 15.30% and the Russell 2000 Value Index (the "Index") returned 5.54% for the twelve months ended June 30, 2025.
- The Fund’s security selection in the pharmaceuticals and telecommunications subsectors detracted from performance.
- An allocation overweight in Liberty Latin America Ltd. and an allocation underweight in Lumen Technologies, Inc. were among the top detractors from performance.
- The Fund’s security selection in the health services & systems and finance subsectors contributed to performance
- Allocation overweights in Rigetti Computing, Inc. and Pediatrix Medical Group, Inc. were among the top contributors to performance.
Fund Performance

| AVERAGE ANNUAL TOTAL RETURNS | INCEPTION DATE |
1 YEAR | 5 YEAR | 10 YEAR | |||
| JPMorgan Small Cap Value Fund (Class R2 Shares) | November 3, 2008 | 3.31 | % | 12.69 | % | 5.71 | % |
| Russell 3000 Index | 15.30 | 15.96 | 12.96 | ||||
| Russell 2000 Value Index | 5.54 | 12.47 | 6.72 |
KEY FUND STATISTICS
| Fund net assets (000's) | $1,183,140 | |
| Total number of portfolio holdings | 426 | |
| Portfolio turnover rate | 72 | % |
| Total advisory fees paid (000's) | $7,940 |
PORTFOLIO COMPOSITION - SECTOR
(% of Total Investments)
(% of Total Investments)

What were the Fund costs for the last year?
(based on a hypothetical $10,000 investment)
| Fund (Class) | Costs of a $10,000 investment |
Costs paid as a percentage of a $10,000 investment |
| JPMorgan Small Cap Value Fund (Class R3 Shares) |
$126 | 1.24% |
How did the Fund Perform?
The JPMorgan Small Cap Value Fund's Class R3 Shares returned 3.57% for the twelve months ended June 30, 2025. The Russell 3000 Index returned 15.30% and the Russell 2000 Value Index (the "Index") returned 5.54% for the twelve months ended June 30, 2025.
- The Fund’s security selection in the pharmaceuticals and telecommunications subsectors detracted from performance.
- An allocation overweight in Liberty Latin America Ltd. and an allocation underweight in Lumen Technologies, Inc. were among the top detractors from performance.
- The Fund’s security selection in the health services & systems and finance subsectors contributed to performance
- Allocation overweights in Rigetti Computing, Inc. and Pediatrix Medical Group, Inc. were among the top contributors to performance.
Fund Performance
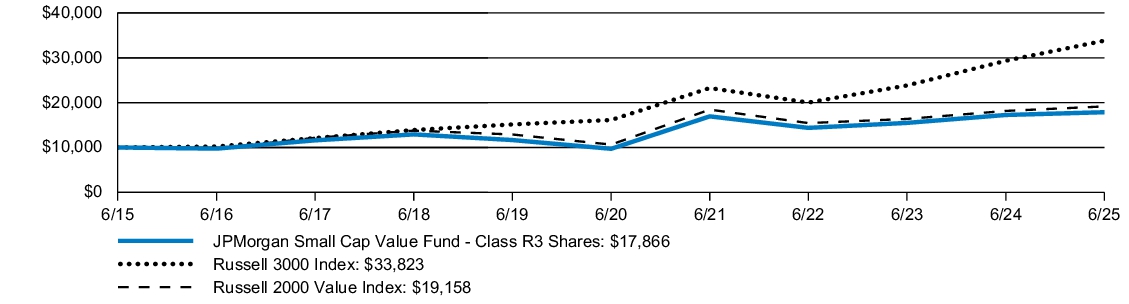
| AVERAGE ANNUAL TOTAL RETURNS | INCEPTION DATE |
1 YEAR | 5 YEAR | 10 YEAR | |||
| JPMorgan Small Cap Value Fund (Class R3 Shares) | September 9, 2016 | 3.57 | % | 12.97 | % | 5.97 | % |
| Russell 3000 Index | 15.30 | 15.96 | 12.96 | ||||
| Russell 2000 Value Index | 5.54 | 12.47 | 6.72 |
KEY FUND STATISTICS
| Fund net assets (000's) | $1,183,140 | |
| Total number of portfolio holdings | 426 | |
| Portfolio turnover rate | 72 | % |
| Total advisory fees paid (000's) | $7,940 |
PORTFOLIO COMPOSITION - SECTOR
(% of Total Investments)
(% of Total Investments)

What were the Fund costs for the last year?
(based on a hypothetical $10,000 investment)
| Fund (Class) | Costs of a $10,000 investment |
Costs paid as a percentage of a $10,000 investment |
| JPMorgan Small Cap Value Fund (Class R4 Shares) |
$100 | 0.99% |
How did the Fund Perform?
The JPMorgan Small Cap Value Fund's Class R4 Shares returned 3.83% for the twelve months ended June 30, 2025. The Russell 3000 Index returned 15.30% and the Russell 2000 Value Index (the "Index") returned 5.54% for the twelve months ended June 30, 2025.
- The Fund’s security selection in the pharmaceuticals and telecommunications subsectors detracted from performance.
- An allocation overweight in Liberty Latin America Ltd. and an allocation underweight in Lumen Technologies, Inc. were among the top detractors from performance.
- The Fund’s security selection in the health services & systems and finance subsectors contributed to performance
- Allocation overweights in Rigetti Computing, Inc. and Pediatrix Medical Group, Inc. were among the top contributors to performance.
Fund Performance

| AVERAGE ANNUAL TOTAL RETURNS | INCEPTION DATE |
1 YEAR | 5 YEAR | 10 YEAR | |||
| JPMorgan Small Cap Value Fund (Class R4 Shares) | September 9, 2016 | 3.83 | % | 13.26 | % | 6.23 | % |
| Russell 3000 Index | 15.30 | 15.96 | 12.96 | ||||
| Russell 2000 Value Index | 5.54 | 12.47 | 6.72 |
KEY FUND STATISTICS
| Fund net assets (000's) | $1,183,140 | |
| Total number of portfolio holdings | 426 | |
| Portfolio turnover rate | 72 | % |
| Total advisory fees paid (000's) | $7,940 |
PORTFOLIO COMPOSITION - SECTOR
(% of Total Investments)
(% of Total Investments)
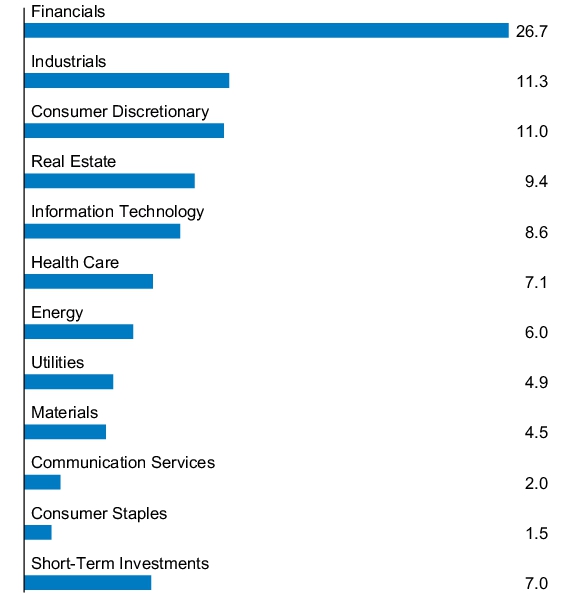
What were the Fund costs for the last year?
(based on a hypothetical $10,000 investment)
| Fund (Class) | Costs of a $10,000 investment |
Costs paid as a percentage of a $10,000 investment |
| JPMorgan Small Cap Value Fund (Class R5 Shares) |
$85 | 0.84% |
How did the Fund Perform?
The JPMorgan Small Cap Value Fund's Class R5 Shares returned 3.99% for the twelve months ended June 30, 2025. The Russell 3000 Index returned 15.30% and the Russell 2000 Value Index (the "Index") returned 5.54% for the twelve months ended June 30, 2025.
- The Fund’s security selection in the pharmaceuticals and telecommunications subsectors detracted from performance.
- An allocation overweight in Liberty Latin America Ltd. and an allocation underweight in Lumen Technologies, Inc. were among the top detractors from performance.
- The Fund’s security selection in the health services & systems and finance subsectors contributed to performance
- Allocation overweights in Rigetti Computing, Inc. and Pediatrix Medical Group, Inc. were among the top contributors to performance.
Fund Performance
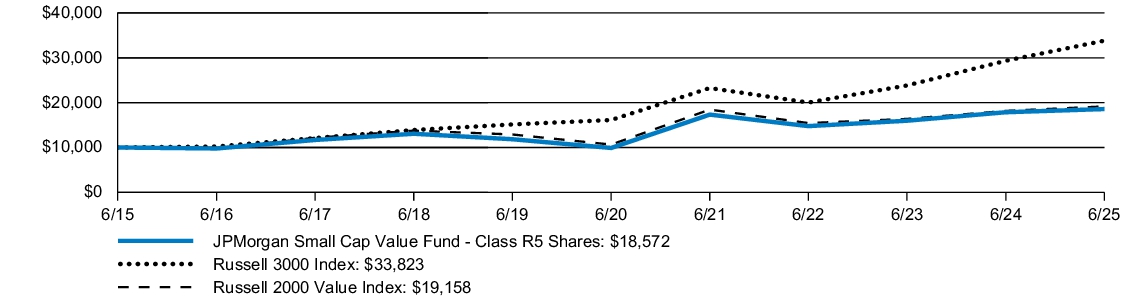
| AVERAGE ANNUAL TOTAL RETURNS | INCEPTION DATE |
1 YEAR | 5 YEAR | 10 YEAR | |||
| JPMorgan Small Cap Value Fund (Class R5 Shares) | May 15, 2006 | 3.99 | % | 13.42 | % | 6.39 | % |
| Russell 3000 Index | 15.30 | 15.96 | 12.96 | ||||
| Russell 2000 Value Index | 5.54 | 12.47 | 6.72 |
KEY FUND STATISTICS
| Fund net assets (000's) | $1,183,140 | |
| Total number of portfolio holdings | 426 | |
| Portfolio turnover rate | 72 | % |
| Total advisory fees paid (000's) | $7,940 |
PORTFOLIO COMPOSITION - SECTOR
(% of Total Investments)
(% of Total Investments)

What were the Fund costs for the last year?
(based on a hypothetical $10,000 investment)
| Fund (Class) | Costs of a $10,000 investment |
Costs paid as a percentage of a $10,000 investment |
| JPMorgan Small Cap Value Fund (Class R6 Shares) |
$75 | 0.74% |
How did the Fund Perform?
The JPMorgan Small Cap Value Fund's Class R6 Shares returned 4.09% for the twelve months ended June 30, 2025. The Russell 3000 Index returned 15.30% and the Russell 2000 Value Index (the "Index") returned 5.54% for the twelve months ended June 30, 2025.
- The Fund’s security selection in the pharmaceuticals and telecommunications subsectors detracted from performance.
- An allocation overweight in Liberty Latin America Ltd. and an allocation underweight in Lumen Technologies, Inc. were among the top detractors from performance.
- The Fund’s security selection in the health services & systems and finance subsectors contributed to performance
- Allocation overweights in Rigetti Computing, Inc. and Pediatrix Medical Group, Inc. were among the top contributors to performance.
Fund Performance
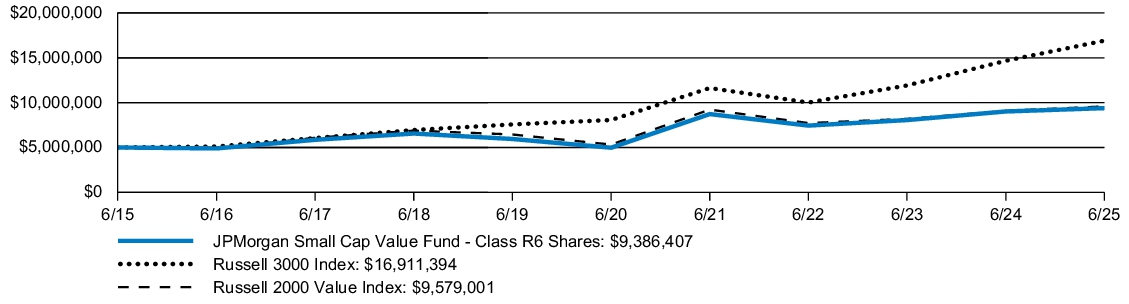
| AVERAGE ANNUAL TOTAL RETURNS | INCEPTION DATE |
1 YEAR | 5 YEAR | 10 YEAR | |||
| JPMorgan Small Cap Value Fund (Class R6 Shares) | February 22, 2005 | 4.09 | % | 13.53 | % | 6.50 | % |
| Russell 3000 Index | 15.30 | 15.96 | 12.96 | ||||
| Russell 2000 Value Index | 5.54 | 12.47 | 6.72 |
KEY FUND STATISTICS
| Fund net assets (000's) | $1,183,140 | |
| Total number of portfolio holdings | 426 | |
| Portfolio turnover rate | 72 | % |
| Total advisory fees paid (000's) | $7,940 |
PORTFOLIO COMPOSITION - SECTOR
(% of Total Investments)
(% of Total Investments)

What were the Fund costs for the last year?
(based on a hypothetical $10,000 investment)
| Fund (Class) | Costs of a $10,000 investment |
Costs paid as a percentage of a $10,000 investment |
| JPMorgan Investor Growth Fund (Class A Shares) |
$58 | 0.55% |
How did the Fund Perform?
The JPMorgan Investor Growth Fund's Class A Shares, without a sales charge, returned 12.28% for the twelve months ended June 30, 2025. The Russell 3000 Index (the "Index") returned 15.30%, the Bloomberg U.S. Intermediate Aggregate Index returned 6.69%, the MSCI EAFE Index (net total return) returned 17.73% and the Lipper Mixed-Asset Target Allocation Aggressive Growth Funds returned 13.22% for the twelve months ended June 30, 2025.
- Relative to the Index, which is an all-equity index, the Fund’s allocation to fixed income was a detractor, as equity markets outperformed fixed-income markets during the period.
- The allocation to equities contributed the most to overall performance, as global growth continued to power through — with overall economic growth remaining resilient and inflation continuing its move downward. Within equities, we preferred U.S. large-cap and international developed equities, which contributed to performance.
- Our allocation to corporate credit, including high-yield and investment-grade bonds, also contributed positively.
- The Fund’s longer overall duration from its allocation to the JPMorgan Core Bond Fund detracted from overall performance as credit outpaced Treasuries.
Fund Performance
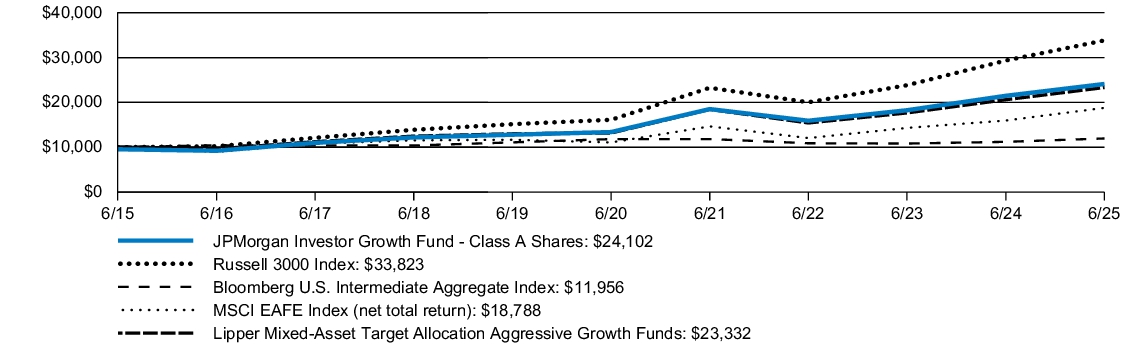
| AVERAGE ANNUAL TOTAL RETURNS | INCEPTION DATE |
1 YEAR | 5 YEAR | 10 YEAR | |||
| JPMorgan Investor Growth Fund (Class A Shares) | December 10, 1996 | 7.21 | % | 11.45 | % | 9.20 | % |
| JPMorgan Investor Growth Fund (Class A Shares) - excluding sales charge | 12.28 | 12.48 | 9.70 | ||||
| Russell 3000 Index | 15.30 | 15.96 | 12.96 | ||||
| Bloomberg U.S. Intermediate Aggregate Index | 6.69 | 0.23 | 1.80 | ||||
| MSCI EAFE Index (net total return) | 17.73 | 11.16 | 6.51 | ||||
| Lipper Mixed-Asset Target Allocation Aggressive Growth Funds | 13.22 | 12.08 | 8.83 |
KEY FUND STATISTICS
| Fund net assets (000's) | $6,066,502 | |
| Total number of portfolio holdings | 24 | |
| Portfolio turnover rate | 3 | % |
| Total advisory fees paid (000's) | $2,724 |
PORTFOLIO COMPOSITION - ASSET CLASS
(% of Total Investments)
(% of Total Investments)

What were the Fund costs for the last year?
(based on a hypothetical $10,000 investment)
| Fund (Class) | Costs of a $10,000 investment |
Costs paid as a percentage of a $10,000 investment |
| JPMorgan Investor Growth Fund (Class C Shares) |
$113 | 1.07% |
How did the Fund Perform?
The JPMorgan Investor Growth Fund's Class C Shares, without a sales charge, returned 11.64% for the twelve months ended June 30, 2025. The Russell 3000 Index (the "Index") returned 15.30%, the Bloomberg U.S. Intermediate Aggregate Index returned 6.69%, the MSCI EAFE Index (net total return) returned 17.73% and the Lipper Mixed-Asset Target Allocation Aggressive Growth Funds returned 13.22% for the twelve months ended June 30, 2025.
- Relative to the Index, which is an all-equity index, the Fund’s allocation to fixed income was a detractor, as equity markets outperformed fixed-income markets during the period.
- The allocation to equities contributed the most to overall performance, as global growth continued to power through — with overall economic growth remaining resilient and inflation continuing its move downward. Within equities, we preferred U.S. large-cap and international developed equities, which contributed to performance.
- Our allocation to corporate credit, including high-yield and investment-grade bonds, also contributed positively.
- The Fund’s longer overall duration from its allocation to the JPMorgan Core Bond Fund detracted from overall performance as credit outpaced Treasuries.
Fund Performance
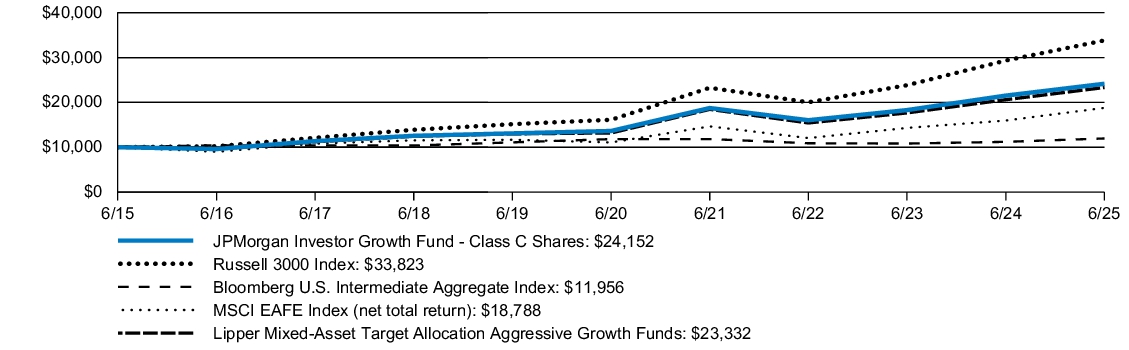
| AVERAGE ANNUAL TOTAL RETURNS | INCEPTION DATE |
1 YEAR | 5 YEAR | 10 YEAR | |||
| JPMorgan Investor Growth Fund (Class C Shares) | July 1, 1997 | 10.64 | % | 11.89 | % | 9.22 | % |
| JPMorgan Investor Growth Fund (Class C Shares) - excluding sales charge | 11.64 | 11.89 | 9.22 | ||||
| Russell 3000 Index | 15.30 | 15.96 | 12.96 | ||||
| Bloomberg U.S. Intermediate Aggregate Index | 6.69 | 0.23 | 1.80 | ||||
| MSCI EAFE Index (net total return) | 17.73 | 11.16 | 6.51 | ||||
| Lipper Mixed-Asset Target Allocation Aggressive Growth Funds | 13.22 | 12.08 | 8.83 |
KEY FUND STATISTICS
| Fund net assets (000's) | $6,066,502 | |
| Total number of portfolio holdings | 24 | |
| Portfolio turnover rate | 3 | % |
| Total advisory fees paid (000's) | $2,724 |
PORTFOLIO COMPOSITION - ASSET CLASS
(% of Total Investments)
(% of Total Investments)

What were the Fund costs for the last year?
(based on a hypothetical $10,000 investment)
| Fund (Class) | Costs of a $10,000 investment |
Costs paid as a percentage of a $10,000 investment |
| JPMorgan Investor Growth Fund (Class I Shares) |
$33 | 0.31% |
How did the Fund Perform?
The JPMorgan Investor Growth Fund's Class I Shares returned 12.52% for the twelve months ended June 30, 2025. The Russell 3000 Index (the "Index") returned 15.30%, the Bloomberg U.S. Intermediate Aggregate Index returned 6.69%, the MSCI EAFE Index (net total return) returned 17.73% and the Lipper Mixed-Asset Target Allocation Aggressive Growth Funds returned 13.22% for the twelve months ended June 30, 2025.
- Relative to the Index, which is an all-equity index, the Fund’s allocation to fixed income was a detractor, as equity markets outperformed fixed-income markets during the period.
- The allocation to equities contributed the most to overall performance, as global growth continued to power through — with overall economic growth remaining resilient and inflation continuing its move downward. Within equities, we preferred U.S. large-cap and international developed equities, which contributed to performance.
- Our allocation to corporate credit, including high-yield and investment-grade bonds, also contributed positively.
- The Fund’s longer overall duration from its allocation to the JPMorgan Core Bond Fund detracted from overall performance as credit outpaced Treasuries.
Fund Performance
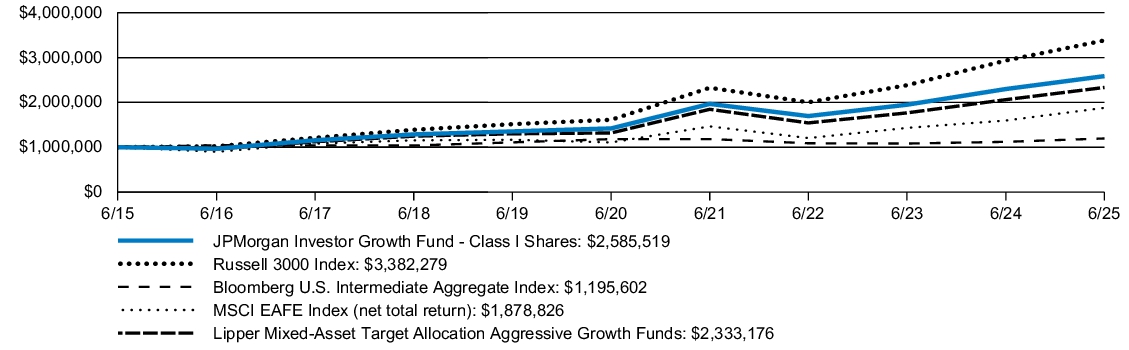
| AVERAGE ANNUAL TOTAL RETURNS | INCEPTION DATE |
1 YEAR | 5 YEAR | 10 YEAR | |||
| JPMorgan Investor Growth Fund (Class I Shares) | December 10, 1996 | 12.52 | % | 12.74 | % | 9.97 | % |
| Russell 3000 Index | 15.30 | 15.96 | 12.96 | ||||
| Bloomberg U.S. Intermediate Aggregate Index | 6.69 | 0.23 | 1.80 | ||||
| MSCI EAFE Index (net total return) | 17.73 | 11.16 | 6.51 | ||||
| Lipper Mixed-Asset Target Allocation Aggressive Growth Funds | 13.22 | 12.08 | 8.83 |
KEY FUND STATISTICS
| Fund net assets (000's) | $6,066,502 | |
| Total number of portfolio holdings | 24 | |
| Portfolio turnover rate | 3 | % |
| Total advisory fees paid (000's) | $2,724 |
PORTFOLIO COMPOSITION - ASSET CLASS
(% of Total Investments)
(% of Total Investments)

What were the Fund costs for the last year?
(based on a hypothetical $10,000 investment)
| Fund (Class) | Costs of a $10,000 investment |
Costs paid as a percentage of a $10,000 investment |
| JPMorgan Investor Growth Fund (Class R6 Shares) |
$7 | 0.07% |
How did the Fund Perform?
The JPMorgan Investor Growth Fund's Class R6 Shares returned 12.80% for the twelve months ended June 30, 2025. The Russell 3000 Index (the "Index") returned 15.30%, the Bloomberg U.S. Intermediate Aggregate Index returned 6.69%, the MSCI EAFE Index (net total return) returned 17.73% and the Lipper Mixed-Asset Target Allocation Aggressive Growth Funds returned 13.22% for the twelve months ended June 30, 2025.
- Relative to the Index, which is an all-equity index, the Fund’s allocation to fixed income was a detractor, as equity markets outperformed fixed-income markets during the period.
- The allocation to equities contributed the most to overall performance, as global growth continued to power through — with overall economic growth remaining resilient and inflation continuing its move downward. Within equities, we preferred U.S. large-cap and international developed equities, which contributed to performance.
- Our allocation to corporate credit, including high-yield and investment-grade bonds, also contributed positively.
- The Fund’s longer overall duration from its allocation to the JPMorgan Core Bond Fund detracted from overall performance as credit outpaced Treasuries.
Fund Performance
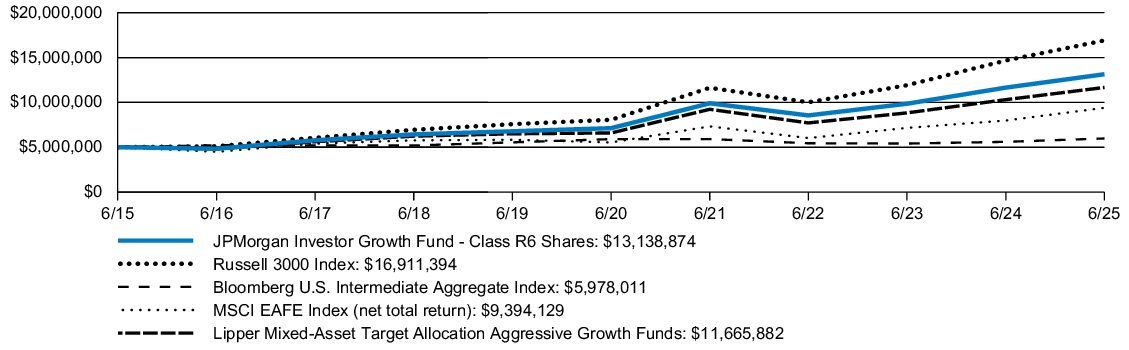
| AVERAGE ANNUAL TOTAL RETURNS | INCEPTION DATE |
1 YEAR | 5 YEAR | 10 YEAR | |||
| JPMorgan Investor Growth Fund (Class R6 Shares) | July 31, 2017 | 12.80 | % | 13.01 | % | 10.14 | % |
| Russell 3000 Index | 15.30 | 15.96 | 12.96 | ||||
| Bloomberg U.S. Intermediate Aggregate Index | 6.69 | 0.23 | 1.80 | ||||
| MSCI EAFE Index (net total return) | 17.73 | 11.16 | 6.51 | ||||
| Lipper Mixed-Asset Target Allocation Aggressive Growth Funds | 13.22 | 12.08 | 8.83 |
KEY FUND STATISTICS
| Fund net assets (000's) | $6,066,502 | |
| Total number of portfolio holdings | 24 | |
| Portfolio turnover rate | 3 | % |
| Total advisory fees paid (000's) | $2,724 |
PORTFOLIO COMPOSITION - ASSET CLASS
(% of Total Investments)
(% of Total Investments)
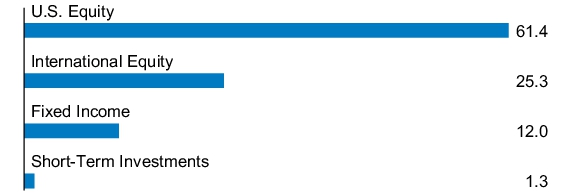
What were the Fund costs for the last year?
(based on a hypothetical $10,000 investment)
| Fund (Class) | Costs of a $10,000 investment |
Costs paid as a percentage of a $10,000 investment |
| JPMorgan Investor Growth & Income Fund (Class A Shares) |
$58 | 0.55% |
How did the Fund Perform?
The JPMorgan Investor Growth & Income Fund's Class A Shares, without a sales charge, returned 11.05% for the twelve months ended June 30, 2025. The Russell 3000 Index (the "Index") returned 15.30%, the Bloomberg U.S. Intermediate Aggregate Index returned 6.69%, the MSCI EAFE Index (net total return) returned 17.73% and the Lipper Mixed-Asset Target Allocation Growth Funds Index returned 11.89% for the twelve months ended June 30, 2025.
- Relative to the Index, which is an all-equity index, the Fund’s allocation to fixed income was a detractor, as equity markets outperformed fixed-income markets during the period.
- The allocation to equities contributed the most to overall performance, as global growth continued to power through — with overall economic growth remaining resilient and inflation continuing its move downward. Within equities, we preferred U.S. large-cap and international developed equities, which contributed to performance.
- Our allocation to corporate credit, including high-yield and investment-grade bonds, also contributed positively.
- The Fund’s longer overall duration from its allocation to the JPMorgan Core Bond Fund detracted from overall performance as credit outpaced Treasuries.
Fund Performance
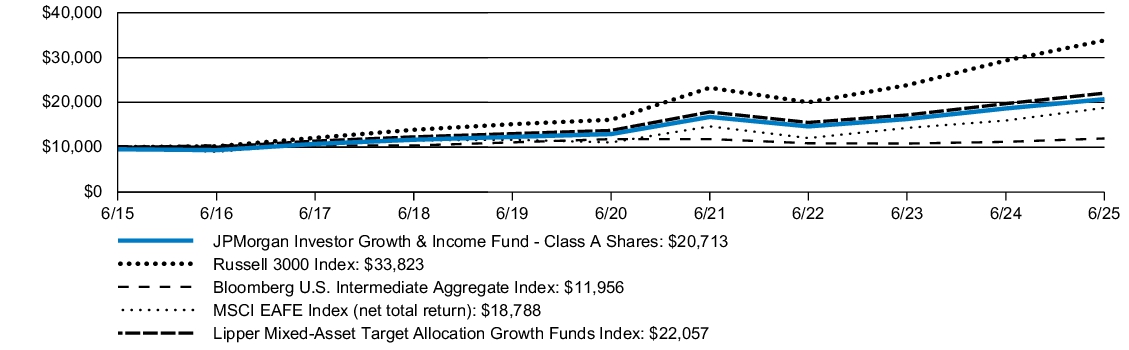
| AVERAGE ANNUAL TOTAL RETURNS | INCEPTION DATE |
1 YEAR | 5 YEAR | 10 YEAR | |||
| JPMorgan Investor Growth & Income Fund (Class A Shares) | December 10, 1996 | 6.04 | % | 8.86 | % | 7.55 | % |
| JPMorgan Investor Growth & Income Fund (Class A Shares) - excluding sales charge | 11.05 | 9.86 | 8.05 | ||||
| Russell 3000 Index | 15.30 | 15.96 | 12.96 | ||||
| Bloomberg U.S. Intermediate Aggregate Index | 6.69 | 0.23 | 1.80 | ||||
| MSCI EAFE Index (net total return) | 17.73 | 11.16 | 6.51 | ||||
| Lipper Mixed-Asset Target Allocation Growth Funds Index | 11.89 | 9.92 | 8.22 |
KEY FUND STATISTICS
| Fund net assets (000's) | $4,991,111 | |
| Total number of portfolio holdings | 26 | |
| Portfolio turnover rate | 8 | % |
| Total advisory fees paid (000's) | $2,314 |
PORTFOLIO COMPOSITION - ASSET CLASS
(% of Total Investments)
(% of Total Investments)

What were the Fund costs for the last year?
(based on a hypothetical $10,000 investment)
| Fund (Class) | Costs of a $10,000 investment |
Costs paid as a percentage of a $10,000 investment |
| JPMorgan Investor Growth & Income Fund (Class C Shares) |
$112 | 1.07% |
How did the Fund Perform?
The JPMorgan Investor Growth & Income Fund's Class C Shares, without a sales charge, returned 10.48% for the twelve months ended June 30, 2025. The Russell 3000 Index (the "Index") returned 15.30%, the Bloomberg U.S. Intermediate Aggregate Index returned 6.69%, the MSCI EAFE Index (net total return) returned 17.73% and the Lipper Mixed-Asset Target Allocation Growth Funds Index returned 11.89% for the twelve months ended June 30, 2025.
- Relative to the Index, which is an all-equity index, the Fund’s allocation to fixed income was a detractor, as equity markets outperformed fixed-income markets during the period.
- The allocation to equities contributed the most to overall performance, as global growth continued to power through — with overall economic growth remaining resilient and inflation continuing its move downward. Within equities, we preferred U.S. large-cap and international developed equities, which contributed to performance.
- Our allocation to corporate credit, including high-yield and investment-grade bonds, also contributed positively.
- The Fund’s longer overall duration from its allocation to the JPMorgan Core Bond Fund detracted from overall performance as credit outpaced Treasuries.
Fund Performance
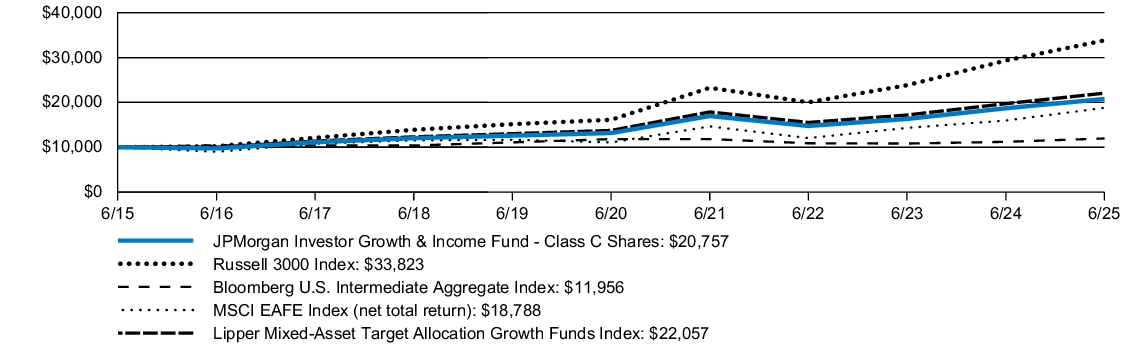
| AVERAGE ANNUAL TOTAL RETURNS | INCEPTION DATE |
1 YEAR | 5 YEAR | 10 YEAR | |||
| JPMorgan Investor Growth & Income Fund (Class C Shares) | July 1, 1997 | 9.48 | % | 9.29 | % | 7.58 | % |
| JPMorgan Investor Growth & Income Fund (Class C Shares) - excluding sales charge | 10.48 | 9.29 | 7.58 | ||||
| Russell 3000 Index | 15.30 | 15.96 | 12.96 | ||||
| Bloomberg U.S. Intermediate Aggregate Index | 6.69 | 0.23 | 1.80 | ||||
| MSCI EAFE Index (net total return) | 17.73 | 11.16 | 6.51 | ||||
| Lipper Mixed-Asset Target Allocation Growth Funds Index | 11.89 | 9.92 | 8.22 |
KEY FUND STATISTICS
| Fund net assets (000's) | $4,991,111 | |
| Total number of portfolio holdings | 26 | |
| Portfolio turnover rate | 8 | % |
| Total advisory fees paid (000's) | $2,314 |
PORTFOLIO COMPOSITION - ASSET CLASS
(% of Total Investments)
(% of Total Investments)

What were the Fund costs for the last year?
(based on a hypothetical $10,000 investment)
| Fund (Class) | Costs of a $10,000 investment |
Costs paid as a percentage of a $10,000 investment |
| JPMorgan Investor Growth & Income Fund (Class I Shares) |
$33 | 0.31% |
How did the Fund Perform?
The JPMorgan Investor Growth & Income Fund's Class I Shares returned 11.32% for the twelve months ended June 30, 2025. The Russell 3000 Index (the "Index") returned 15.30%, the Bloomberg U.S. Intermediate Aggregate Index returned 6.69%, the MSCI EAFE Index (net total return) returned 17.73% and the Lipper Mixed-Asset Target Allocation Growth Funds Index returned 11.89% for the twelve months ended June 30, 2025.
- Relative to the Index, which is an all-equity index, the Fund’s allocation to fixed income was a detractor, as equity markets outperformed fixed-income markets during the period.
- The allocation to equities contributed the most to overall performance, as global growth continued to power through — with overall economic growth remaining resilient and inflation continuing its move downward. Within equities, we preferred U.S. large-cap and international developed equities, which contributed to performance.
- Our allocation to corporate credit, including high-yield and investment-grade bonds, also contributed positively.
- The Fund’s longer overall duration from its allocation to the JPMorgan Core Bond Fund detracted from overall performance as credit outpaced Treasuries.
Fund Performance
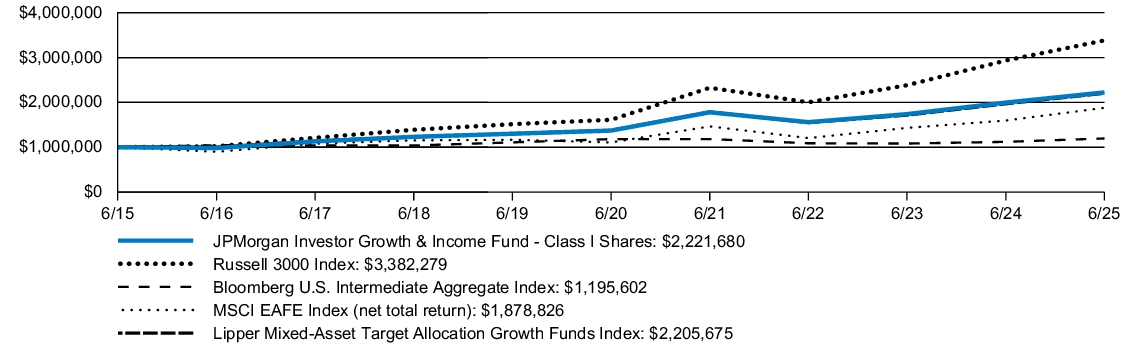
| AVERAGE ANNUAL TOTAL RETURNS | INCEPTION DATE |
1 YEAR | 5 YEAR | 10 YEAR | |||
| JPMorgan Investor Growth & Income Fund (Class I Shares) | December 10, 1996 | 11.32 | % | 10.12 | % | 8.31 | % |
| Russell 3000 Index | 15.30 | 15.96 | 12.96 | ||||
| Bloomberg U.S. Intermediate Aggregate Index | 6.69 | 0.23 | 1.80 | ||||
| MSCI EAFE Index (net total return) | 17.73 | 11.16 | 6.51 | ||||
| Lipper Mixed-Asset Target Allocation Growth Funds Index | 11.89 | 9.92 | 8.22 |
KEY FUND STATISTICS
| Fund net assets (000's) | $4,991,111 | |
| Total number of portfolio holdings | 26 | |
| Portfolio turnover rate | 8 | % |
| Total advisory fees paid (000's) | $2,314 |
PORTFOLIO COMPOSITION - ASSET CLASS
(% of Total Investments)
(% of Total Investments)

What were the Fund costs for the last year?
(based on a hypothetical $10,000 investment)
| Fund (Class) | Costs of a $10,000 investment |
Costs paid as a percentage of a $10,000 investment |
| JPMorgan Investor Growth & Income Fund (Class R6 Shares) |
$7 | 0.06% |
How did the Fund Perform?
The JPMorgan Investor Growth & Income Fund's Class R6 Shares returned 11.54% for the twelve months ended June 30, 2025. The Russell 3000 Index (the "Index") returned 15.30%, the Bloomberg U.S. Intermediate Aggregate Index returned 6.69%, the MSCI EAFE Index (net total return) returned 17.73% and the Lipper Mixed-Asset Target Allocation Growth Funds Index returned 11.89% for the twelve months ended June 30, 2025.
- Relative to the Index, which is an all-equity index, the Fund’s allocation to fixed income was a detractor, as equity markets outperformed fixed-income markets during the period.
- The allocation to equities contributed the most to overall performance, as global growth continued to power through — with overall economic growth remaining resilient and inflation continuing its move downward. Within equities, we preferred U.S. large-cap and international developed equities, which contributed to performance.
- Our allocation to corporate credit, including high-yield and investment-grade bonds, also contributed positively.
- The Fund’s longer overall duration from its allocation to the JPMorgan Core Bond Fund detracted from overall performance as credit outpaced Treasuries.
Fund Performance
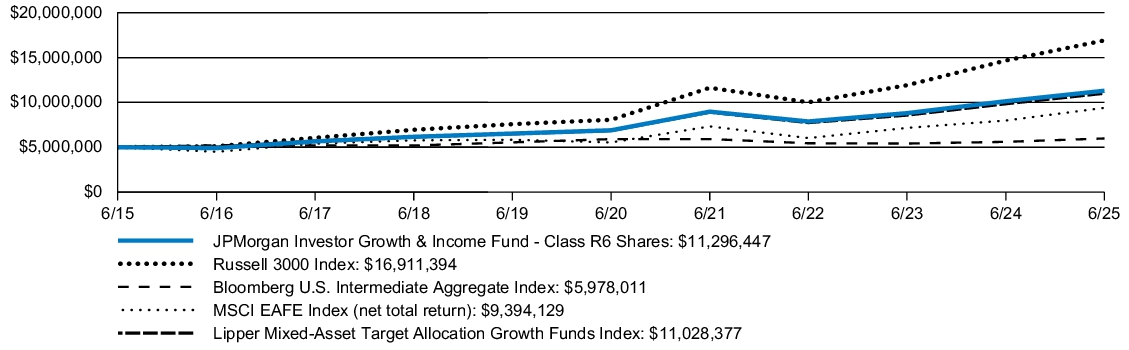
| AVERAGE ANNUAL TOTAL RETURNS | INCEPTION DATE |
1 YEAR | 5 YEAR | 10 YEAR | |||
| JPMorgan Investor Growth & Income Fund (Class R6 Shares) | July 31, 2017 | 11.54 | % | 10.40 | % | 8.49 | % |
| Russell 3000 Index | 15.30 | 15.96 | 12.96 | ||||
| Bloomberg U.S. Intermediate Aggregate Index | 6.69 | 0.23 | 1.80 | ||||
| MSCI EAFE Index (net total return) | 17.73 | 11.16 | 6.51 | ||||
| Lipper Mixed-Asset Target Allocation Growth Funds Index | 11.89 | 9.92 | 8.22 |
KEY FUND STATISTICS
| Fund net assets (000's) | $4,991,111 | |
| Total number of portfolio holdings | 26 | |
| Portfolio turnover rate | 8 | % |
| Total advisory fees paid (000's) | $2,314 |
PORTFOLIO COMPOSITION - ASSET CLASS
(% of Total Investments)
(% of Total Investments)
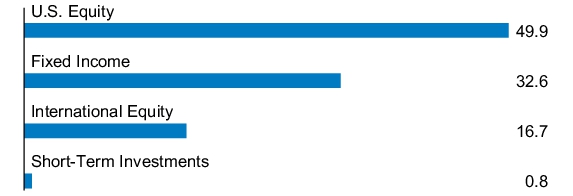
What were the Fund costs for the last year?
(based on a hypothetical $10,000 investment)
| Fund (Class) | Costs of a $10,000 investment |
Costs paid as a percentage of a $10,000 investment |
| JPMorgan Investor Balanced Fund (Class A Shares) |
$59 | 0.56% |
How did the Fund Perform?
The JPMorgan Investor Balanced Fund's Class A Shares, without a sales charge, returned 10.16% for the twelve months ended June 30, 2025. The Bloomberg U.S. Aggregate Index returned 6.08%, the Bloomberg U.S. Intermediate Aggregate Index (the "Index") returned 6.69%, the Russell 3000 Index returned 15.30%, the MSCI EAFE Index (net total return) returned 17.73%, and the Lipper Mixed-Asset Target Allocation Moderate Funds Index returned 10.72% for the twelve months ended June 30, 2025.
- Relative to the Index, which is an all-fixed income index, the Fund’s diverse allocation to both equity and fixed income was a leading contributor, as equity markets outperformed fixed-income markets during the period.
- The allocation to equities contributed the most to overall performance, as global growth continued to power through — with overall economic growth remaining resilient and inflation continuing its move downward. Within equities, we preferred U.S. large-cap and international developed equities, which contributed to performance.
- Our allocation to corporate credit, including high-yield and investment-grade bonds, also contributed positively.
- The Fund’s longer overall duration from its allocation to the JPMorgan Core Bond Fund detracted from overall performance as credit outpaced Treasuries.
Fund Performance
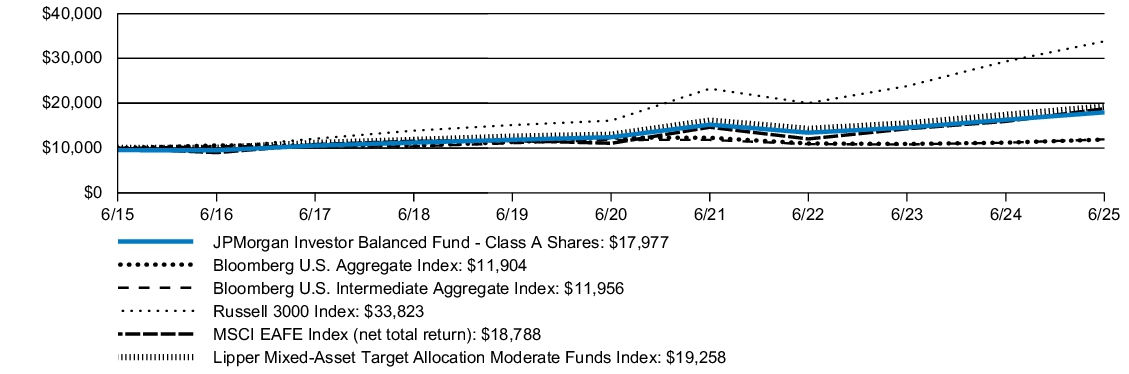
| AVERAGE ANNUAL TOTAL RETURNS | INCEPTION DATE |
1 YEAR | 5 YEAR | 10 YEAR | |||
| JPMorgan Investor Balanced Fund (Class A Shares) | December 10, 1996 | 5.23 | % | 6.64 | % | 6.04 | % |
| JPMorgan Investor Balanced Fund (Class A Shares) - excluding sales charge | 10.16 | 7.63 | 6.53 | ||||
| Bloomberg U.S. Aggregate Index | 6.08 | (0.73 | ) | 1.76 | |||
| Bloomberg U.S. Intermediate Aggregate Index | 6.69 | 0.23 | 1.80 | ||||
| Russell 3000 Index | 15.30 | 15.96 | 12.96 | ||||
| MSCI EAFE Index (net total return) | 17.73 | 11.16 | 6.51 | ||||
| Lipper Mixed-Asset Target Allocation Moderate Funds Index | 10.72 | 8.22 | 6.77 |
KEY FUND STATISTICS
| Fund net assets (000's) | $5,597,054 | |
| Total number of portfolio holdings | 26 | |
| Portfolio turnover rate | 11 | % |
| Total advisory fees paid (000's) | $2,680 |
PORTFOLIO COMPOSITION - ASSET CLASS
(% of Total Investments)
(% of Total Investments)

What were the Fund costs for the last year?
(based on a hypothetical $10,000 investment)
| Fund (Class) | Costs of a $10,000 investment |
Costs paid as a percentage of a $10,000 investment |
| JPMorgan Investor Balanced Fund (Class C Shares) |
$111 | 1.06% |
How did the Fund Perform?
The JPMorgan Investor Balanced Fund's Class C Shares, without a sales charge, returned 9.56% for the twelve months ended June 30, 2025. The Bloomberg U.S. Aggregate Index returned 6.08%, the Bloomberg U.S. Intermediate Aggregate Index (the "Index") returned 6.69%, the Russell 3000 Index returned 15.30%, the MSCI EAFE Index (net total return) returned 17.73%, and the Lipper Mixed-Asset Target Allocation Moderate Funds Index returned 10.72% for the twelve months ended June 30, 2025.
- Relative to the Index, which is an all-fixed income index, the Fund’s diverse allocation to both equity and fixed income was a leading contributor, as equity markets outperformed fixed-income markets during the period.
- The allocation to equities contributed the most to overall performance, as global growth continued to power through — with overall economic growth remaining resilient and inflation continuing its move downward. Within equities, we preferred U.S. large-cap and international developed equities, which contributed to performance.
- Our allocation to corporate credit, including high-yield and investment-grade bonds, also contributed positively.
- The Fund’s longer overall duration from its allocation to the JPMorgan Core Bond Fund detracted from overall performance as credit outpaced Treasuries.
Fund Performance
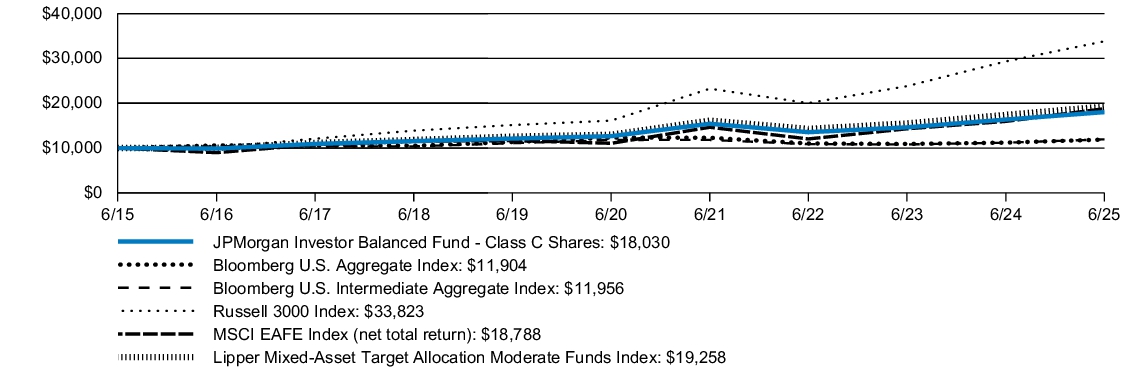
| AVERAGE ANNUAL TOTAL RETURNS | INCEPTION DATE |
1 YEAR | 5 YEAR | 10 YEAR | |||
| JPMorgan Investor Balanced Fund (Class C Shares) | July 1, 1997 | 8.56 | % | 7.09 | % | 6.07 | % |
| JPMorgan Investor Balanced Fund (Class C Shares) - excluding sales charge | 9.56 | 7.09 | 6.07 | ||||
| Bloomberg U.S. Aggregate Index | 6.08 | (0.73 | ) | 1.76 | |||
| Bloomberg U.S. Intermediate Aggregate Index | 6.69 | 0.23 | 1.80 | ||||
| Russell 3000 Index | 15.30 | 15.96 | 12.96 | ||||
| MSCI EAFE Index (net total return) | 17.73 | 11.16 | 6.51 | ||||
| Lipper Mixed-Asset Target Allocation Moderate Funds Index | 10.72 | 8.22 | 6.77 |
KEY FUND STATISTICS
| Fund net assets (000's) | $5,597,054 | |
| Total number of portfolio holdings | 26 | |
| Portfolio turnover rate | 11 | % |
| Total advisory fees paid (000's) | $2,680 |
PORTFOLIO COMPOSITION - ASSET CLASS
(% of Total Investments)
(% of Total Investments)

What were the Fund costs for the last year?
(based on a hypothetical $10,000 investment)
| Fund (Class) | Costs of a $10,000 investment |
Costs paid as a percentage of a $10,000 investment |
| JPMorgan Investor Balanced Fund (Class I Shares) |
$33 | 0.31% |
How did the Fund Perform?
The JPMorgan Investor Balanced Fund's Class I Shares returned 10.40% for the twelve months ended June 30, 2025. The Bloomberg U.S. Aggregate Index returned 6.08%, the Bloomberg U.S. Intermediate Aggregate Index (the "Index") returned 6.69%, the Russell 3000 Index returned 15.30%, the MSCI EAFE Index (net total return) returned 17.73%, and the Lipper Mixed-Asset Target Allocation Moderate Funds Index returned 10.72% for the twelve months ended June 30, 2025.
- Relative to the Index, which is an all-fixed income index, the Fund’s diverse allocation to both equity and fixed income was a leading contributor, as equity markets outperformed fixed-income markets during the period.
- The allocation to equities contributed the most to overall performance, as global growth continued to power through — with overall economic growth remaining resilient and inflation continuing its move downward. Within equities, we preferred U.S. large-cap and international developed equities, which contributed to performance.
- Our allocation to corporate credit, including high-yield and investment-grade bonds, also contributed positively.
- The Fund’s longer overall duration from its allocation to the JPMorgan Core Bond Fund detracted from overall performance as credit outpaced Treasuries.
Fund Performance
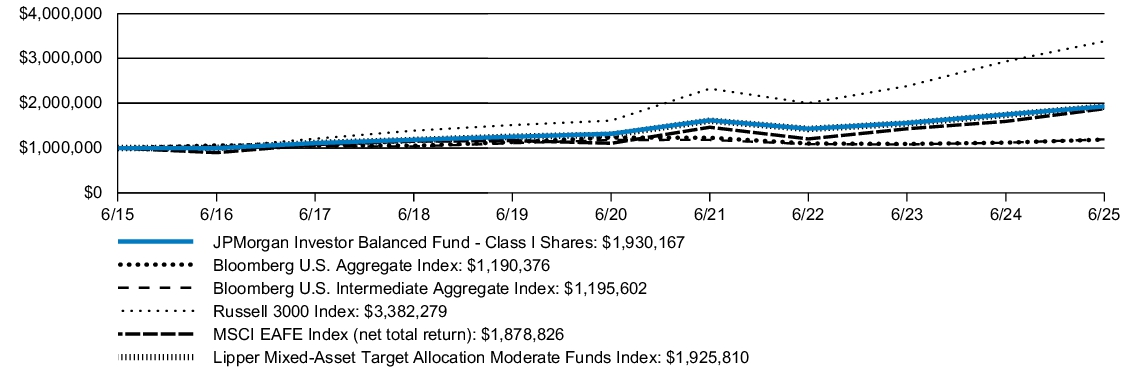
| AVERAGE ANNUAL TOTAL RETURNS | INCEPTION DATE |
1 YEAR | 5 YEAR | 10 YEAR | |||
| JPMorgan Investor Balanced Fund (Class I Shares) | December 10, 1996 | 10.40 | % | 7.91 | % | 6.80 | % |
| Bloomberg U.S. Aggregate Index | 6.08 | (0.73 | ) | 1.76 | |||
| Bloomberg U.S. Intermediate Aggregate Index | 6.69 | 0.23 | 1.80 | ||||
| Russell 3000 Index | 15.30 | 15.96 | 12.96 | ||||
| MSCI EAFE Index (net total return) | 17.73 | 11.16 | 6.51 | ||||
| Lipper Mixed-Asset Target Allocation Moderate Funds Index | 10.72 | 8.22 | 6.77 |
KEY FUND STATISTICS
| Fund net assets (000's) | $5,597,054 | |
| Total number of portfolio holdings | 26 | |
| Portfolio turnover rate | 11 | % |
| Total advisory fees paid (000's) | $2,680 |
PORTFOLIO COMPOSITION - ASSET CLASS
(% of Total Investments)
(% of Total Investments)
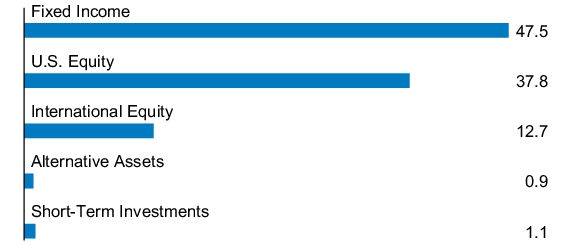
What were the Fund costs for the last year?
(based on a hypothetical $10,000 investment)
| Fund (Class) | Costs of a $10,000 investment |
Costs paid as a percentage of a $10,000 investment |
| JPMorgan Investor Balanced Fund (Class R6 Shares) |
$7 | 0.06% |
How did the Fund Perform?
The JPMorgan Investor Balanced Fund's Class R6 Shares returned 10.75% for the twelve months ended June 30, 2025. The Bloomberg U.S. Aggregate Index returned 6.08%, the Bloomberg U.S. Intermediate Aggregate Index (the "Index") returned 6.69%, the Russell 3000 Index returned 15.30%, the MSCI EAFE Index (net total return) returned 17.73%, and the Lipper Mixed-Asset Target Allocation Moderate Funds Index returned 10.72% for the twelve months ended June 30, 2025.
- Relative to the Index, which is an all-fixed income index, the Fund’s diverse allocation to both equity and fixed income was a leading contributor, as equity markets outperformed fixed-income markets during the period.
- The allocation to equities contributed the most to overall performance, as global growth continued to power through — with overall economic growth remaining resilient and inflation continuing its move downward. Within equities, we preferred U.S. large-cap and international developed equities, which contributed to performance.
- Our allocation to corporate credit, including high-yield and investment-grade bonds, also contributed positively.
- The Fund’s longer overall duration from its allocation to the JPMorgan Core Bond Fund detracted from overall performance as credit outpaced Treasuries.
Fund Performance
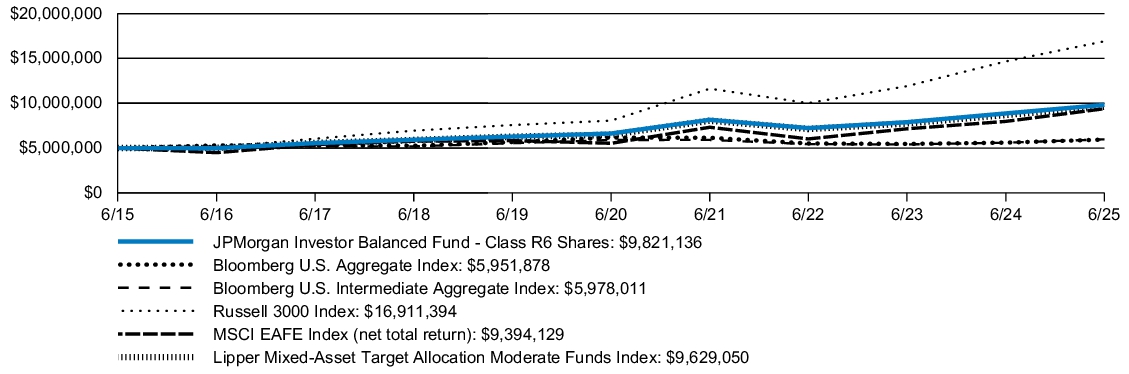
| AVERAGE ANNUAL TOTAL RETURNS | INCEPTION DATE |
1 YEAR | 5 YEAR | 10 YEAR | |||
| JPMorgan Investor Balanced Fund (Class R6 Shares) | July 31, 2017 | 10.75 | % | 8.18 | % | 6.98 | % |
| Bloomberg U.S. Aggregate Index | 6.08 | (0.73 | ) | 1.76 | |||
| Bloomberg U.S. Intermediate Aggregate Index | 6.69 | 0.23 | 1.80 | ||||
| Russell 3000 Index | 15.30 | 15.96 | 12.96 | ||||
| MSCI EAFE Index (net total return) | 17.73 | 11.16 | 6.51 | ||||
| Lipper Mixed-Asset Target Allocation Moderate Funds Index | 10.72 | 8.22 | 6.77 |
KEY FUND STATISTICS
| Fund net assets (000's) | $5,597,054 | |
| Total number of portfolio holdings | 26 | |
| Portfolio turnover rate | 11 | % |
| Total advisory fees paid (000's) | $2,680 |
PORTFOLIO COMPOSITION - ASSET CLASS
(% of Total Investments)
(% of Total Investments)

What were the Fund costs for the last year?
(based on a hypothetical $10,000 investment)
| Fund (Class) | Costs of a $10,000 investment |
Costs paid as a percentage of a $10,000 investment |
| JPMorgan Investor Conservative Growth Fund (Class A Shares) |
$59 | 0.56% |
How did the Fund Perform?
The JPMorgan Investor Conservative Growth Fund's Class A Shares, without a sales charge, returned 8.81% for the twelve months ended June 30, 2025. The Bloomberg U.S. Aggregate Index returned 6.08%, the Bloomberg U.S. Intermediate Aggregate Index (the "Index") returned 6.69%, the Russell 3000 Index returned 15.30%, the MSCI EAFE Index (net total return) returned 17.73%, and the Lipper Mixed-Asset Target Allocation Conservative Funds Index returned 8.70% for the twelve months ended June 30, 2025.
- Relative to the Index, which is an all fixed-income index, the Fund’s diverse allocation to both equity and fixed income was a leading contributor, as equity markets outperformed fixed-income markets during the period.
- The allocation to equities contributed the most to overall performance, as global growth continued to power through — with overall economic growth remaining resilient and inflation continuing its move downward. Within equities, we preferred U.S. large-cap and international developed equities, which contributed to performance.
- Our allocation to corporate credit, including high-yield and investment-grade bonds, also contributed positively.
- The Fund’s longer overall duration from its allocation to the JPMorgan Core Bond Fund detracted from overall performance as credit outpaced Treasuries.
Fund Performance
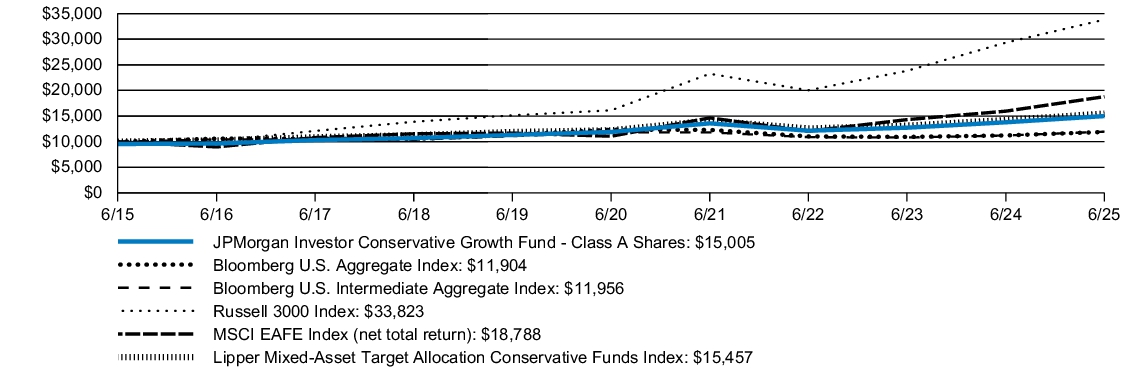
| AVERAGE ANNUAL TOTAL RETURNS | INCEPTION DATE |
1 YEAR | 5 YEAR | 10 YEAR | |||
| JPMorgan Investor Conservative Growth Fund (Class A Shares) | December 10, 1996 | 3.88 | % | 3.78 | % | 4.14 | % |
| JPMorgan Investor Conservative Growth Fund (Class A Shares) - excluding sales charge | 8.81 | 4.74 | 4.62 | ||||
| Bloomberg U.S. Aggregate Index | 6.08 | (0.73 | ) | 1.76 | |||
| Bloomberg U.S. Intermediate Aggregate Index | 6.69 | 0.23 | 1.80 | ||||
| Russell 3000 Index | 15.30 | 15.96 | 12.96 | ||||
| MSCI EAFE Index (net total return) | 17.73 | 11.16 | 6.51 | ||||
| Lipper Mixed-Asset Target Allocation Conservative Funds Index | 8.70 | 4.84 | 4.45 |
KEY FUND STATISTICS
| Fund net assets (000's) | $3,988,962 | |
| Total number of portfolio holdings | 27 | |
| Portfolio turnover rate | 11 | % |
| Total advisory fees paid (000's) | $1,923 |
PORTFOLIO COMPOSITION - ASSET CLASS
(% of Total Investments)
(% of Total Investments)

What were the Fund costs for the last year?
(based on a hypothetical $10,000 investment)
| Fund (Class) | Costs of a $10,000 investment |
Costs paid as a percentage of a $10,000 investment |
| JPMorgan Investor Conservative Growth Fund (Class C Shares) |
$111 | 1.06% |
How did the Fund Perform?
The JPMorgan Investor Conservative Growth Fund's Class C Shares, without a sales charge, returned 8.24% for the twelve months ended June 30, 2025. The Bloomberg U.S. Aggregate Index returned 6.08%, the Bloomberg U.S. Intermediate Aggregate Index (the "Index") returned 6.69%, the Russell 3000 Index returned 15.30%, the MSCI EAFE Index (net total return) returned 17.73%, and the Lipper Mixed-Asset Target Allocation Conservative Funds Index returned 8.70% for the twelve months ended June 30, 2025.
- Relative to the Index, which is an all fixed-income index, the Fund’s diverse allocation to both equity and fixed income was a leading contributor, as equity markets outperformed fixed-income markets during the period.
- The allocation to equities contributed the most to overall performance, as global growth continued to power through — with overall economic growth remaining resilient and inflation continuing its move downward. Within equities, we preferred U.S. large-cap and international developed equities, which contributed to performance.
- Our allocation to corporate credit, including high-yield and investment-grade bonds, also contributed positively.
- The Fund’s longer overall duration from its allocation to the JPMorgan Core Bond Fund detracted from overall performance as credit outpaced Treasuries.
Fund Performance
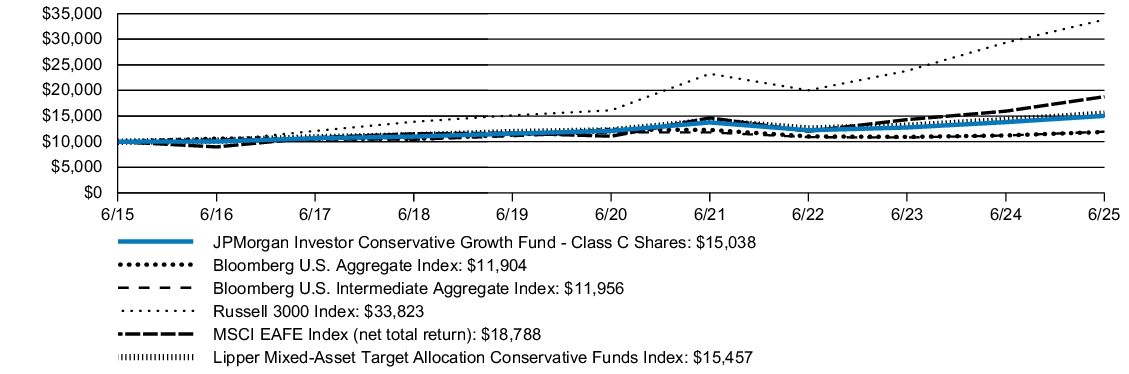
| AVERAGE ANNUAL TOTAL RETURNS | INCEPTION DATE |
1 YEAR | 5 YEAR | 10 YEAR | |||
| JPMorgan Investor Conservative Growth Fund (Class C Shares) | July 1, 1997 | 7.24 | % | 4.21 | % | 4.16 | % |
| JPMorgan Investor Conservative Growth Fund (Class C Shares) - excluding sales charge | 8.24 | 4.21 | 4.16 | ||||
| Bloomberg U.S. Aggregate Index | 6.08 | (0.73 | ) | 1.76 | |||
| Bloomberg U.S. Intermediate Aggregate Index | 6.69 | 0.23 | 1.80 | ||||
| Russell 3000 Index | 15.30 | 15.96 | 12.96 | ||||
| MSCI EAFE Index (net total return) | 17.73 | 11.16 | 6.51 | ||||
| Lipper Mixed-Asset Target Allocation Conservative Funds Index | 8.70 | 4.84 | 4.45 |
KEY FUND STATISTICS
| Fund net assets (000's) | $3,988,962 | |
| Total number of portfolio holdings | 27 | |
| Portfolio turnover rate | 11 | % |
| Total advisory fees paid (000's) | $1,923 |
PORTFOLIO COMPOSITION - ASSET CLASS
(% of Total Investments)
(% of Total Investments)

What were the Fund costs for the last year?
(based on a hypothetical $10,000 investment)
| Fund (Class) | Costs of a $10,000 investment |
Costs paid as a percentage of a $10,000 investment |
| JPMorgan Investor Conservative Growth Fund (Class I Shares) |
$33 | 0.31% |
How did the Fund Perform?
The JPMorgan Investor Conservative Growth Fund's Class I Shares returned 9.09% for the twelve months ended June 30, 2025. The Bloomberg U.S. Aggregate Index returned 6.08%, the Bloomberg U.S. Intermediate Aggregate Index (the "Index") returned 6.69%, the Russell 3000 Index returned 15.30%, the MSCI EAFE Index (net total return) returned 17.73%, and the Lipper Mixed-Asset Target Allocation Conservative Funds Index returned 8.70% for the twelve months ended June 30, 2025.
- Relative to the Index, which is an all fixed-income index, the Fund’s diverse allocation to both equity and fixed income was a leading contributor, as equity markets outperformed fixed-income markets during the period.
- The allocation to equities contributed the most to overall performance, as global growth continued to power through — with overall economic growth remaining resilient and inflation continuing its move downward. Within equities, we preferred U.S. large-cap and international developed equities, which contributed to performance.
- Our allocation to corporate credit, including high-yield and investment-grade bonds, also contributed positively.
- The Fund’s longer overall duration from its allocation to the JPMorgan Core Bond Fund detracted from overall performance as credit outpaced Treasuries.
Fund Performance
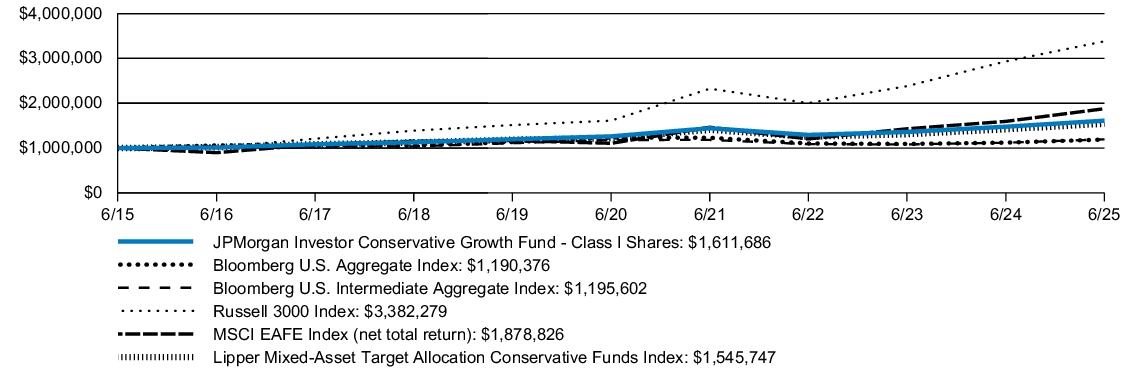
| AVERAGE ANNUAL TOTAL RETURNS | INCEPTION DATE |
1 YEAR | 5 YEAR | 10 YEAR | |||
| JPMorgan Investor Conservative Growth Fund (Class I Shares) | December 10, 1996 | 9.09 | % | 5.02 | % | 4.89 | % |
| Bloomberg U.S. Aggregate Index | 6.08 | (0.73 | ) | 1.76 | |||
| Bloomberg U.S. Intermediate Aggregate Index | 6.69 | 0.23 | 1.80 | ||||
| Russell 3000 Index | 15.30 | 15.96 | 12.96 | ||||
| MSCI EAFE Index (net total return) | 17.73 | 11.16 | 6.51 | ||||
| Lipper Mixed-Asset Target Allocation Conservative Funds Index | 8.70 | 4.84 | 4.45 |
KEY FUND STATISTICS
| Fund net assets (000's) | $3,988,962 | |
| Total number of portfolio holdings | 27 | |
| Portfolio turnover rate | 11 | % |
| Total advisory fees paid (000's) | $1,923 |
PORTFOLIO COMPOSITION - ASSET CLASS
(% of Total Investments)
(% of Total Investments)
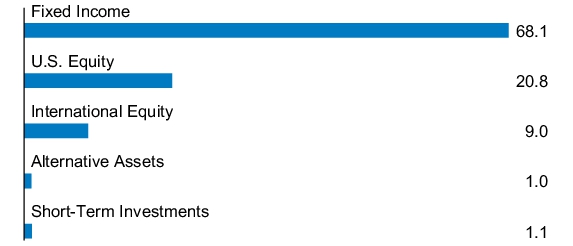
What were the Fund costs for the last year?
(based on a hypothetical $10,000 investment)
| Fund (Class) | Costs of a $10,000 investment |
Costs paid as a percentage of a $10,000 investment |
| JPMorgan Investor Conservative Growth Fund (Class R6 Shares) |
$7 | 0.06% |
How did the Fund Perform?
The JPMorgan Investor Conservative Growth Fund's Class R6 Shares returned 9.37% for the twelve months ended June 30, 2025. The Bloomberg U.S. Aggregate Index returned 6.08%, the Bloomberg U.S. Intermediate Aggregate Index (the "Index") returned 6.69%, the Russell 3000 Index returned 15.30%, the MSCI EAFE Index (net total return) returned 17.73%, and the Lipper Mixed-Asset Target Allocation Conservative Funds Index returned 8.70% for the twelve months ended June 30, 2025.
- Relative to the Index, which is an all fixed-income index, the Fund’s diverse allocation to both equity and fixed income was a leading contributor, as equity markets outperformed fixed-income markets during the period.
- The allocation to equities contributed the most to overall performance, as global growth continued to power through — with overall economic growth remaining resilient and inflation continuing its move downward. Within equities, we preferred U.S. large-cap and international developed equities, which contributed to performance.
- Our allocation to corporate credit, including high-yield and investment-grade bonds, also contributed positively.
- The Fund’s longer overall duration from its allocation to the JPMorgan Core Bond Fund detracted from overall performance as credit outpaced Treasuries.
Fund Performance
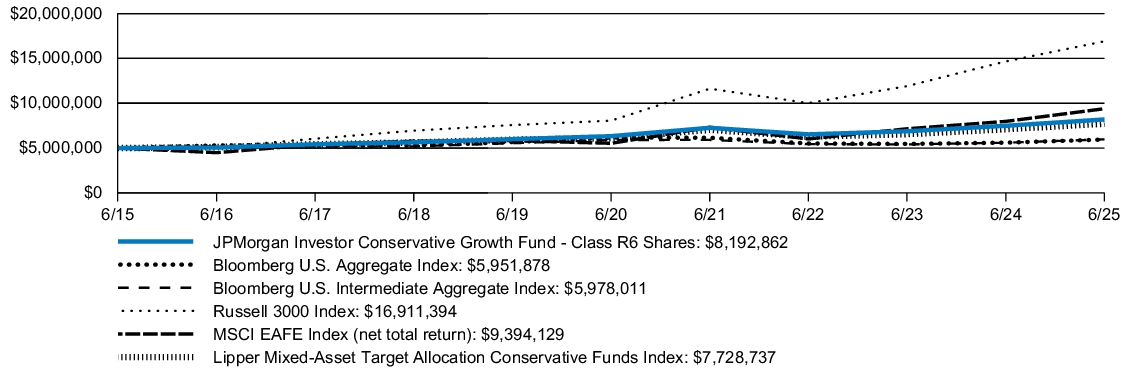
| AVERAGE ANNUAL TOTAL RETURNS | INCEPTION DATE |
1 YEAR | 5 YEAR | 10 YEAR | |||
| JPMorgan Investor Conservative Growth Fund (Class R6 Shares) | July 31, 2017 | 9.37 | % | 5.28 | % | 5.06 | % |
| Bloomberg U.S. Aggregate Index | 6.08 | (0.73 | ) | 1.76 | |||
| Bloomberg U.S. Intermediate Aggregate Index | 6.69 | 0.23 | 1.80 | ||||
| Russell 3000 Index | 15.30 | 15.96 | 12.96 | ||||
| MSCI EAFE Index (net total return) | 17.73 | 11.16 | 6.51 | ||||
| Lipper Mixed-Asset Target Allocation Conservative Funds Index | 8.70 | 4.84 | 4.45 |
KEY FUND STATISTICS
| Fund net assets (000's) | $3,988,962 | |
| Total number of portfolio holdings | 27 | |
| Portfolio turnover rate | 11 | % |
| Total advisory fees paid (000's) | $1,923 |
PORTFOLIO COMPOSITION - ASSET CLASS
(% of Total Investments)
(% of Total Investments)
