What were the Fund costs for the past year?
(based on a hypothetical $10,000 investment)
|
Class
Name
|
Costs
of a $10,000 investment
|
Costs
paid as a percentage of a $10,000 investment
|
|---|---|---|
|
Class
I
|
$22
|
0.44%
|
Expenses are equal to Class I shares' annualized expense ratio (for the six-month period) multiplied by the average account value over the period. The Class' expenses would have been higher had certain expenses not been waived or reimbursed during the period.
Key Fund Statistics (as of June 30, 2025)
|
Net
Assets |
$669,787,765 |
|
Number
of Holdings |
196 |
|
Portfolio
Turnover (for the six months ended 6/30/25) |
19% |
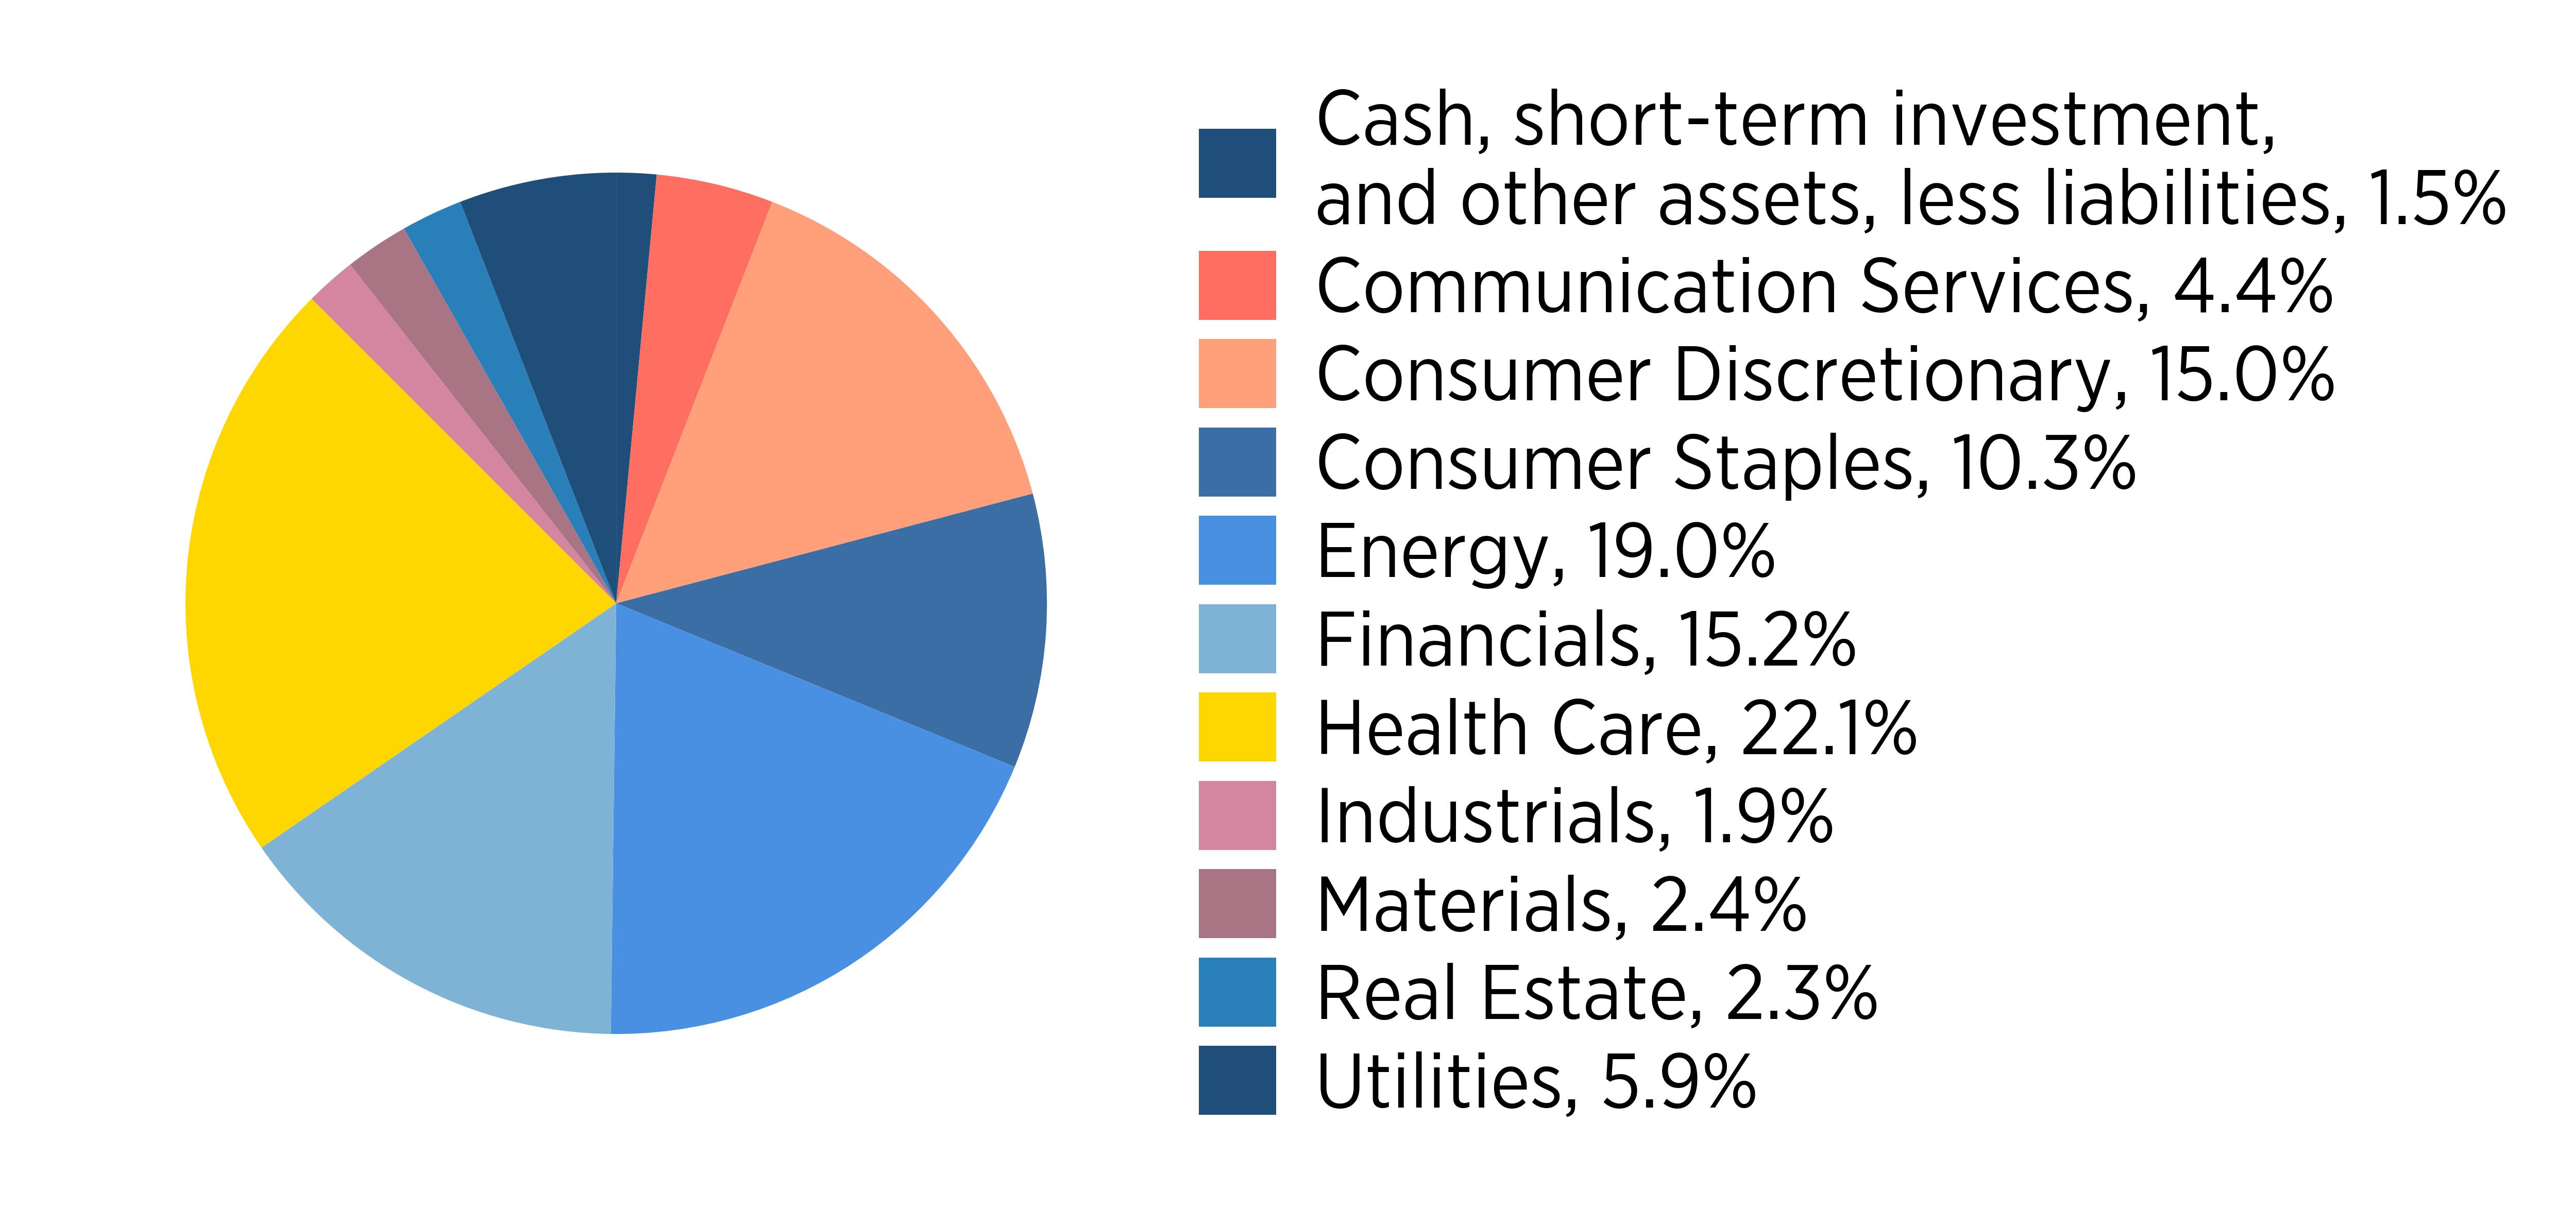
Sector Allocation (% of net assets)
(as of June 30, 2025)
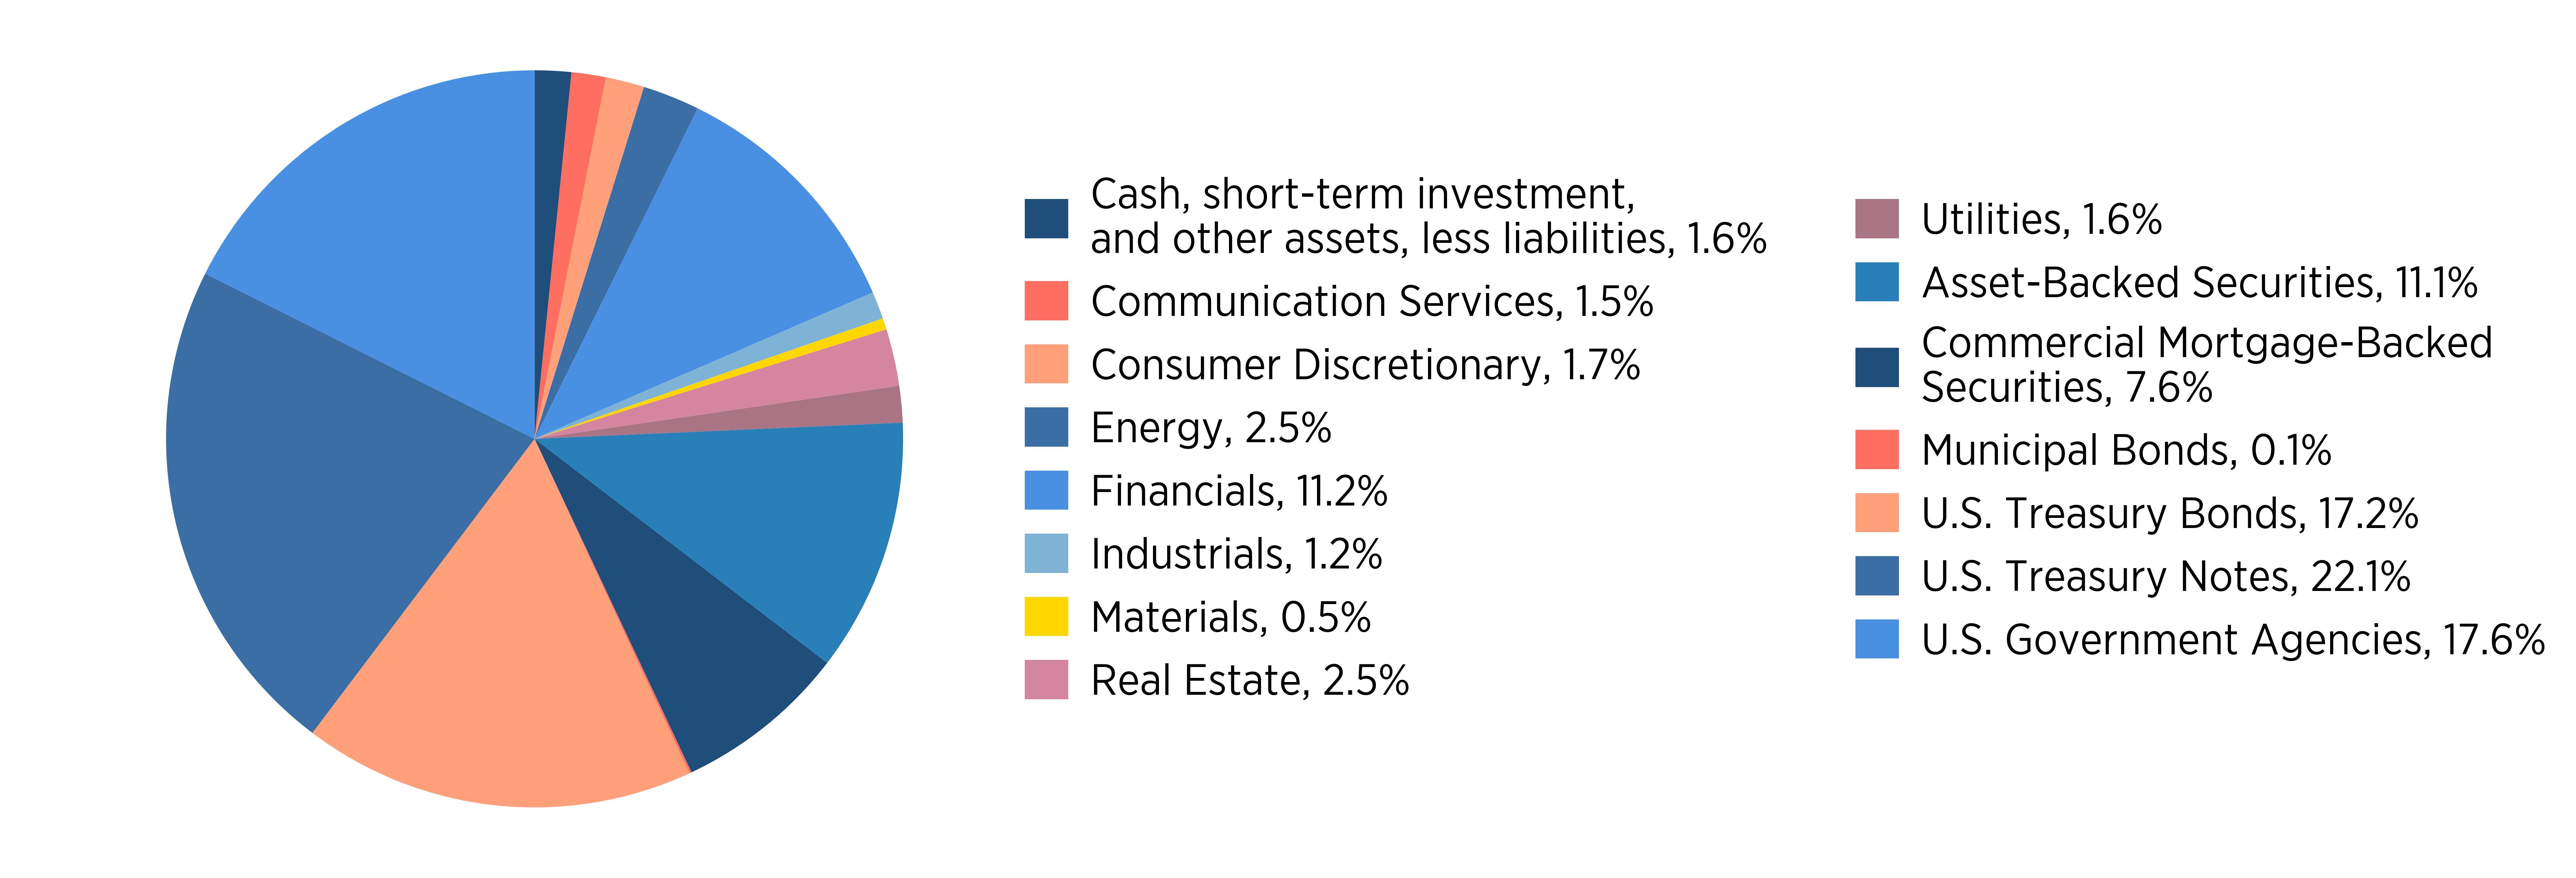
The Global Industry Classification Standard (GICS) was developed by and is exclusive property and a service mark of MSCI Inc. (MSCI) and Standard & Poor's a division of S&P Global Inc. (S&P), and is licensed for use by Manning & Napier when referencing GICS sectors. Neither MSCI, S&P, nor any third party involved in making or compiling the GICS or any GICS classifications makes any express or implied warranties or representations with respect to such standard or classification, nor shall any such party have any liability therefrom.
What were the Fund costs for the past year?
(based on a hypothetical $10,000 investment)
|
Class
Name
|
Costs
of a $10,000 investment
|
Costs
paid as a percentage of a $10,000 investment
|
|---|---|---|
|
Class
S
|
$33
|
0.66%
|
Expenses are equal to Class S shares' annualized expense ratio (for the six-month period) multiplied by the average account value over the period. The Class' expenses would have been higher had certain expenses not been waived or reimbursed during the period.
Key Fund Statistics (as of June 30, 2025)
|
Net
Assets |
$669,787,765 |
|
Number
of Holdings |
196 |
|
Portfolio
Turnover (for the six months ended 6/30/25) |
19% |
Sector Allocation (% of net assets)
(as of June 30, 2025)
The Global Industry Classification Standard (GICS) was developed by and is exclusive property and a service mark of MSCI Inc. (MSCI) and Standard & Poor's a division of S&P Global Inc. (S&P), and is licensed for use by Manning & Napier when referencing GICS sectors. Neither MSCI, S&P, nor any third party involved in making or compiling the GICS or any GICS classifications makes any express or implied warranties or representations with respect to such standard or classification, nor shall any such party have any liability therefrom.
What were the Fund costs for the past year?
(based on a hypothetical $10,000 investment)
|
Class
Name
|
Costs
of a $10,000 investment
|
Costs
paid as a percentage of a $10,000 investment
|
|---|---|---|
|
Class
W
|
$3
|
0.05%
|
Expenses are equal to Class W shares' annualized expense ratio (for the six-month period) multiplied by the average account value over the period. The Class' expenses would have been higher had certain expenses not been waived or reimbursed during the period.
Key Fund Statistics (as of June 30, 2025)
|
Net
Assets |
$669,787,765 |
|
Number
of Holdings |
196 |
|
Portfolio
Turnover (for the six months ended 6/30/25) |
19% |
Sector Allocation (% of net assets)
(as of June 30, 2025)
The Global Industry Classification Standard (GICS) was developed by and is exclusive property and a service mark of MSCI Inc. (MSCI) and Standard & Poor's a division of S&P Global Inc. (S&P), and is licensed for use by Manning & Napier when referencing GICS sectors. Neither MSCI, S&P, nor any third party involved in making or compiling the GICS or any GICS classifications makes any express or implied warranties or representations with respect to such standard or classification, nor shall any such party have any liability therefrom.
What were the Fund costs for the past year?
(based on a hypothetical $10,000 investment)
|
Class
Name
|
Costs
of a $10,000 investment
|
Costs
paid as a percentage of a $10,000 investment
|
|---|---|---|
|
Class
Z
|
$15
|
0.30%
|
Expenses are equal to Class Z shares' annualized expense ratio (for the six-month period) multiplied by the average account value over the period. The Class' expenses would have been higher had certain expenses not been waived or reimbursed during the period.
Key Fund Statistics (as of June 30, 2025)
|
Net
Assets |
$669,787,765 |
|
Number
of Holdings |
196 |
|
Portfolio
Turnover (for the six months ended 6/30/25) |
19% |
Sector Allocation (% of net assets)
(as of June 30, 2025)
The Global Industry Classification Standard (GICS) was developed by and is exclusive property and a service mark of MSCI Inc. (MSCI) and Standard & Poor's a division of S&P Global Inc. (S&P), and is licensed for use by Manning & Napier when referencing GICS sectors. Neither MSCI, S&P, nor any third party involved in making or compiling the GICS or any GICS classifications makes any express or implied warranties or representations with respect to such standard or classification, nor shall any such party have any liability therefrom.
What were the Fund costs for the past year?
(based on a hypothetical $10,000 investment)
|
Class
Name
|
Costs
of a $10,000 investment
|
Costs
paid as a percentage of a $10,000 investment
|
|---|---|---|
|
Class
I
|
$24
|
0.48%
|
Expenses are equal to Class I shares' annualized expense ratio (for the six-month period) multiplied by the average account value over the period. The Class' expenses would have been higher had certain expenses not been waived or reimbursed during the period.
Key Fund Statistics (as of June 30, 2025)
|
Net
Assets |
$827,197,613 |
|
Number
of Holdings |
206 |
|
Portfolio
Turnover (for the six months ended 6/30/25) |
29% |
Sector Allocation (% of net assets)
(as of June 30, 2025)
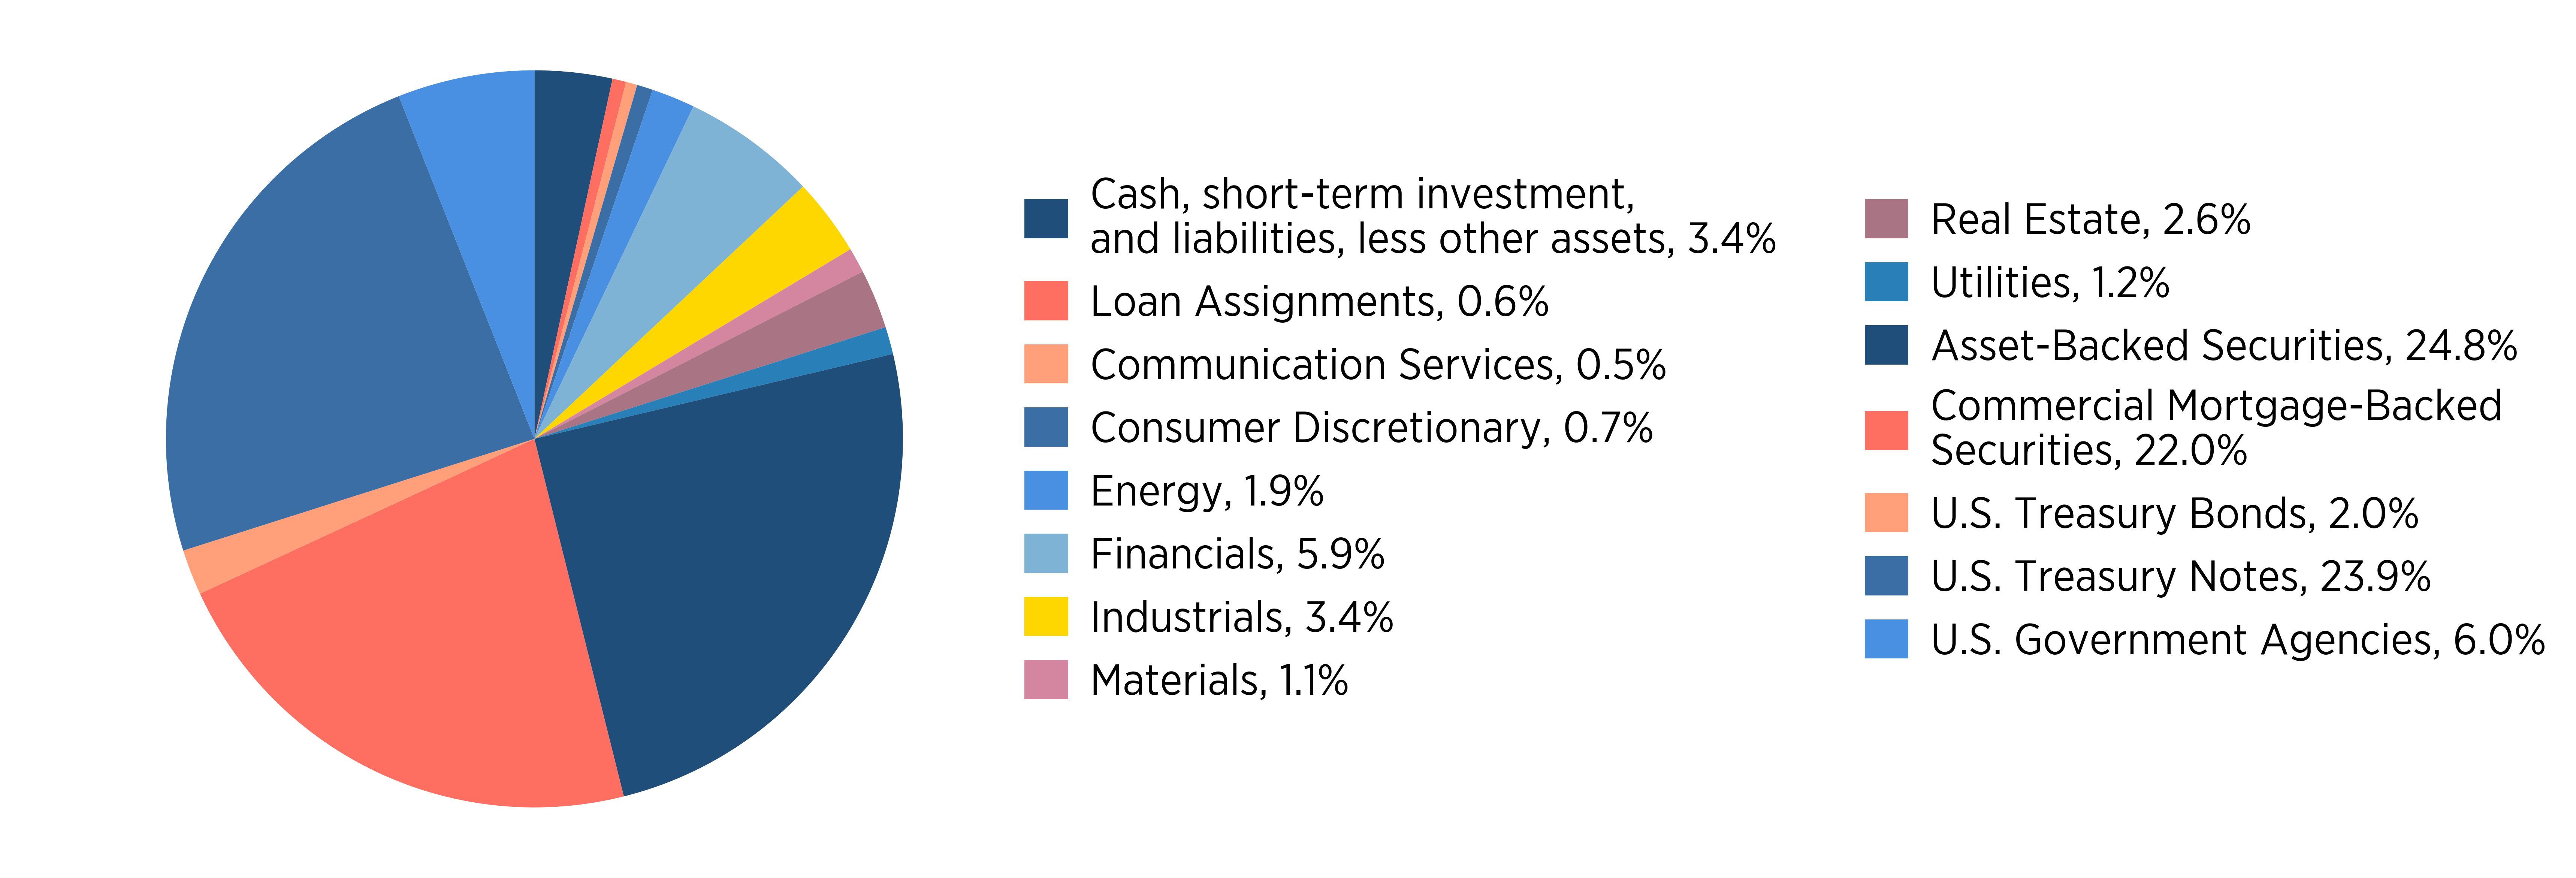
The Global Industry Classification Standard (GICS) was developed by and is exclusive property and a service mark of MSCI Inc. (MSCI) and Standard & Poor's a division of S&P Global Inc. (S&P), and is licensed for use by Manning & Napier when referencing GICS sectors. Neither MSCI, S&P, nor any third party involved in making or compiling the GICS or any GICS classifications makes any express or implied warranties or representations with respect to such standard or classification, nor shall any such party have any liability therefrom.
What were the Fund costs for the past year?
(based on a hypothetical $10,000 investment)
|
Class
Name
|
Costs
of a $10,000 investment
|
Costs
paid as a percentage of a $10,000 investment
|
|---|---|---|
|
Class
S
|
$37
|
0.74%
|
Expenses are equal to Class S shares' annualized expense ratio (for the six-month period) multiplied by the average account value over the period. The Class' expenses would have been higher had certain expenses not been waived or reimbursed during the period.
Key Fund Statistics (as of June 30, 2025)
|
Net
Assets |
$827,197,613 |
|
Number
of Holdings |
206 |
|
Portfolio
Turnover (for the six months ended 6/30/25) |
29% |
Sector Allocation (% of net assets)
(as of June 30, 2025)
The Global Industry Classification Standard (GICS) was developed by and is exclusive property and a service mark of MSCI Inc. (MSCI) and Standard & Poor's a division of S&P Global Inc. (S&P), and is licensed for use by Manning & Napier when referencing GICS sectors. Neither MSCI, S&P, nor any third party involved in making or compiling the GICS or any GICS classifications makes any express or implied warranties or representations with respect to such standard or classification, nor shall any such party have any liability therefrom.
What were the Fund costs for the past year?
(based on a hypothetical $10,000 investment)
|
Class
Name
|
Costs
of a $10,000 investment
|
Costs
paid as a percentage of a $10,000 investment
|
|---|---|---|
|
Class
W
|
$3
|
0.05%
|
Expenses are equal to Class W shares' annualized expense ratio (for the six-month period) multiplied by the average account value over the period. The Class' expenses would have been higher had certain expenses not been waived or reimbursed during the period.
Key Fund Statistics (as of June 30, 2025)
|
Net
Assets |
$827,197,613 |
|
Number
of Holdings |
206 |
|
Portfolio
Turnover (for the six months ended 6/30/25) |
29% |
Sector Allocation (% of net assets)
(as of June 30, 2025)
The Global Industry Classification Standard (GICS) was developed by and is exclusive property and a service mark of MSCI Inc. (MSCI) and Standard & Poor's a division of S&P Global Inc. (S&P), and is licensed for use by Manning & Napier when referencing GICS sectors. Neither MSCI, S&P, nor any third party involved in making or compiling the GICS or any GICS classifications makes any express or implied warranties or representations with respect to such standard or classification, nor shall any such party have any liability therefrom.
What were the Fund costs for the past year?
(based on a hypothetical $10,000 investment)
|
Class
Name
|
Costs
of a $10,000 investment
|
Costs
paid as a percentage of a $10,000 investment
|
|---|---|---|
|
Class
I
|
$30
|
0.59%
|
Expenses are equal to Class I shares' annualized expense ratio (for the six-month period) multiplied by the average account value over the period. The Class' expenses would have been higher had certain expenses not been waived or reimbursed during the period.
Key Fund Statistics (as of June 30, 2025)
|
Net
Assets |
$1,380,545,662 |
|
Number
of Holdings |
94 |
|
Portfolio
Turnover (for the six months ended 6/30/25) |
52% |
Sector Allocation (% of net assets)
(as of June 30, 2025)
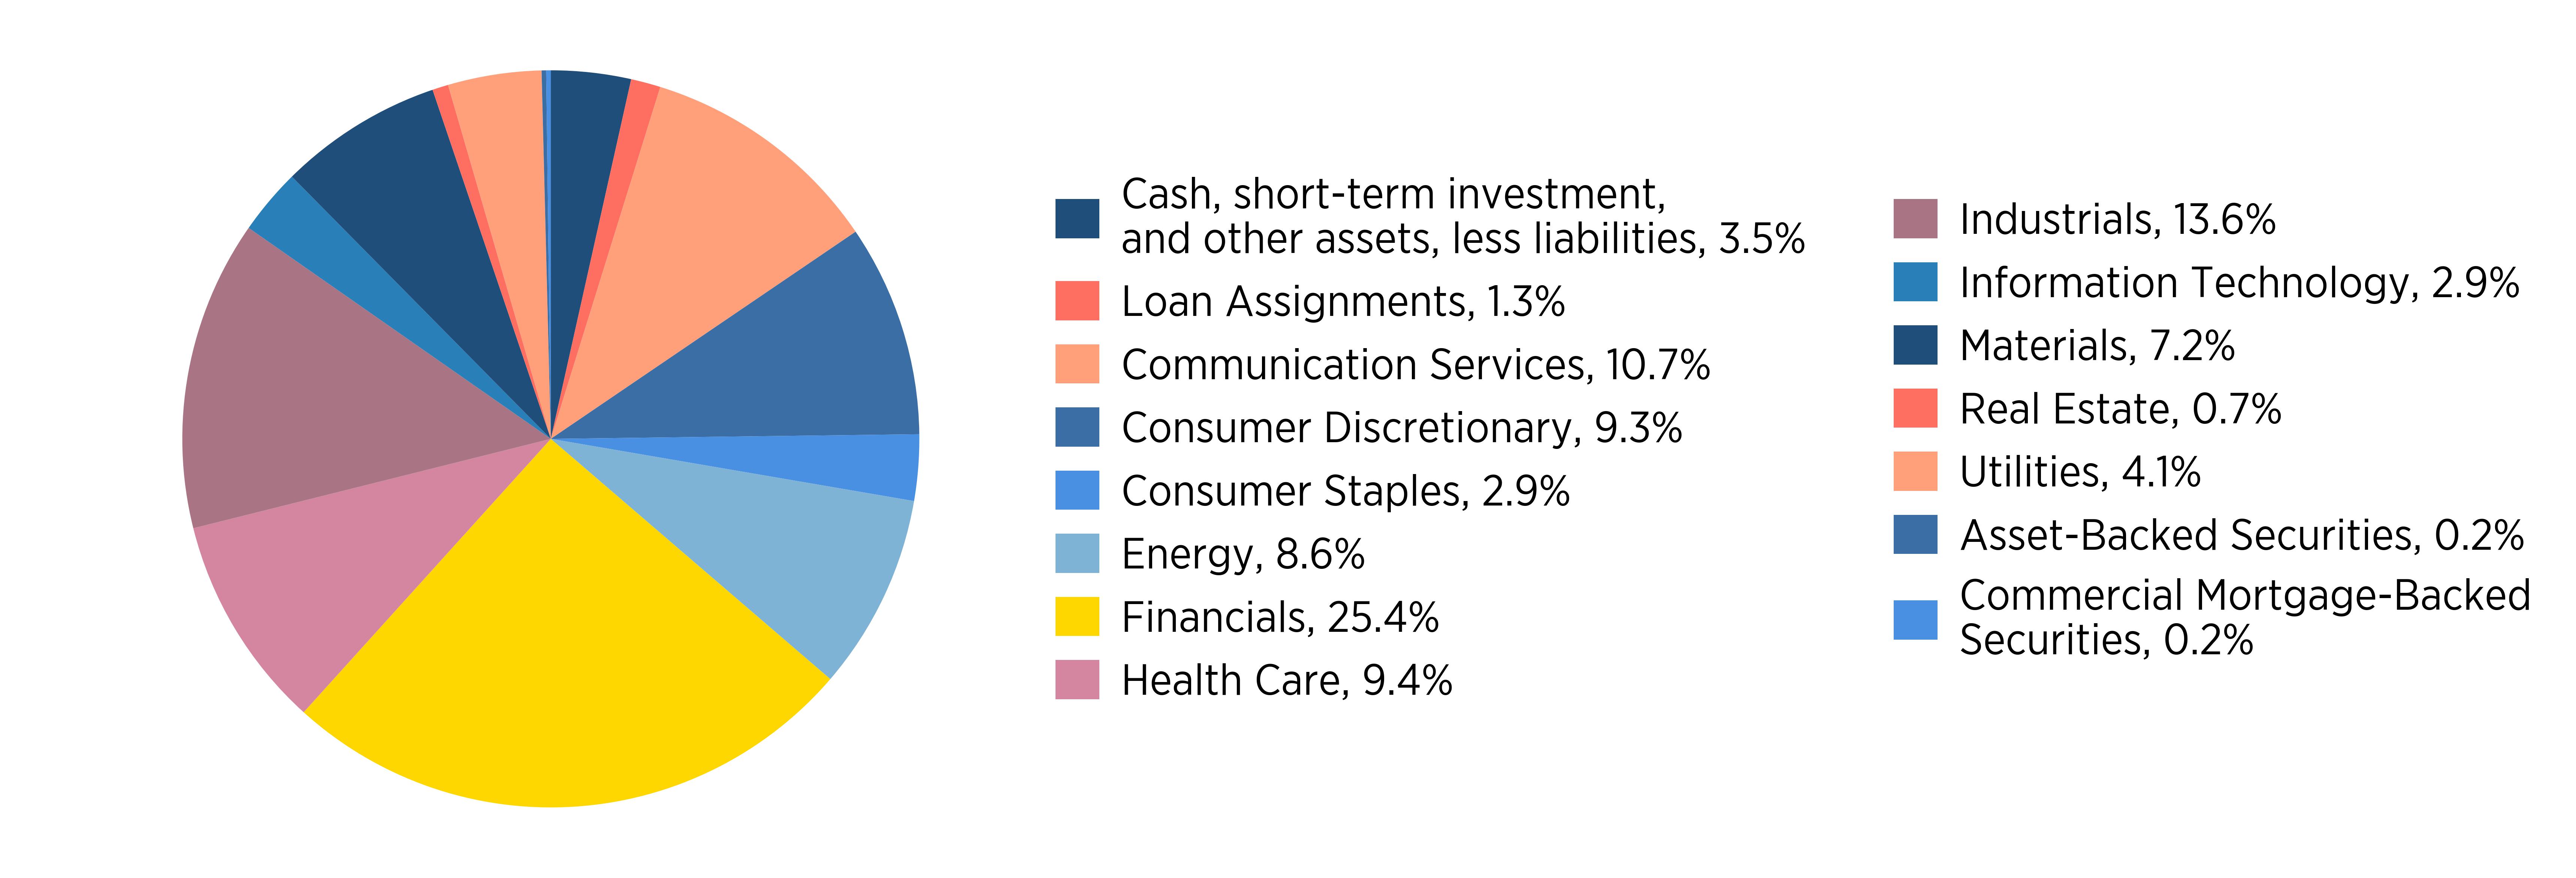
The Global Industry Classification Standard (GICS) was developed by and is exclusive property and a service mark of MSCI Inc. (MSCI) and Standard & Poor's a division of S&P Global Inc. (S&P), and is licensed for use by Manning & Napier when referencing GICS sectors. Neither MSCI, S&P, nor any third party involved in making or compiling the GICS or any GICS classifications makes any express or implied warranties or representations with respect to such standard or classification, nor shall any such party have any liability therefrom.
What were the Fund costs for the past year?
(based on a hypothetical $10,000 investment)
|
Class
Name |
Costs
of a $10,000 Investment |
Costs
paid as a percentage of a $10,000 investment |
|---|---|---|
|
Class
S |
$44 |
0.88% |
Expenses are equal to Class S shares' annualized expense ratio (for the six-month period) multiplied by the average account value over the period. The Class' expenses would have been higher had certain expenses not been waived or reimbursed during the period.
Key Fund Statistics (as of June 30, 2025)
|
Net
Assets |
$1,380,545,662 |
|
Number
of Holdings |
94 |
|
Portfolio
Turnover (for the six months ended 6/30/25) |
52% |
Sector Allocation (% of net assets)
(as of June 30, 2025)
The Global Industry Classification Standard (GICS) was developed by and is exclusive property and a service mark of MSCI Inc. (MSCI) and Standard & Poor's a division of S&P Global Inc. (S&P), and is licensed for use by Manning & Napier when referencing GICS sectors. Neither MSCI, S&P, nor any third party involved in making or compiling the GICS or any GICS classifications makes any express or implied warranties or representations with respect to such standard or classification, nor shall any such party have any liability therefrom.
What were the Fund costs for the past year?
(based on a hypothetical $10,000 investment)
|
Class
Name
|
Costs
of a $10,000 investment
|
Costs
paid as a percentage of a $10,000 investment
|
|---|---|---|
|
Class
W
|
$5
|
0.10%
|
Expenses are equal to Class W shares' annualized expense ratio (for the six-month period) multiplied by the average account value over the period. The Class' expenses would have been higher had certain expenses not been waived or reimbursed during the period.
Key Fund Statistics (as of June 30, 2025)
|
Net
Assets |
$1,380,545,662 |
|
Number
of Holdings |
94 |
|
Portfolio
Turnover (for the six months ended 6/30/25) |
52% |
Sector Allocation (% of net assets)
(as of June 30, 2025)
The Global Industry Classification Standard (GICS) was developed by and is exclusive property and a service mark of MSCI Inc. (MSCI) and Standard & Poor's a division of S&P Global Inc. (S&P), and is licensed for use by Manning & Napier when referencing GICS sectors. Neither MSCI, S&P, nor any third party involved in making or compiling the GICS or any GICS classifications makes any express or implied warranties or representations with respect to such standard or classification, nor shall any such party have any liability therefrom.
What were the Fund costs for the past year?
(based on a hypothetical $10,000 investment)
|
Class
Name
|
Costs
of a $10,000 investment
|
Costs
paid as a percentage of a $10,000 investment
|
|---|---|---|
|
Class
Z
|
$24
|
0.47%
|
Expenses are equal to Class Z shares' annualized expense ratio (for the six-month period) multiplied by the average account value over the period. The Class' expenses would have been higher had certain expenses not been waived or reimbursed during the period.
Key Fund Statistics (as of June 30, 2025)
|
Net
Assets |
$1,380,545,662 |
|
Number
of Holdings |
94 |
|
Portfolio
Turnover (for the six months ended 6/30/25) |
52% |
Sector Allocation (% of net assets)
(as of June 30, 2025)
The Global Industry Classification Standard (GICS) was developed by and is exclusive property and a service mark of MSCI Inc. (MSCI) and Standard & Poor's a division of S&P Global Inc. (S&P), and is licensed for use by Manning & Napier when referencing GICS sectors. Neither MSCI, S&P, nor any third party involved in making or compiling the GICS or any GICS classifications makes any express or implied warranties or representations with respect to such standard or classification, nor shall any such party have any liability therefrom.
What were the Fund costs for the past year?
(based on a hypothetical $10,000 investment)
|
Class
Name
|
Costs
of a $10,000 investment
|
Costs
paid as a percentage of a $10,000 investment
|
|---|---|---|
|
Class
A
|
$25
|
0.50%
|
Expenses are equal to Class A shares' annualized expense ratio (for the six-month period) multiplied by the average account value over the period. The Class' expenses would have been higher had certain expenses not been waived or reimbursed during the period.
Key Fund Statistics (as of June 30, 2025)
|
Net
Assets |
$220,659,013 |
|
Number
of Holdings |
158 |
|
Portfolio
Turnover
(for
the six months ended 6/30/25) |
19% |
Top Ten States (% of total investments)
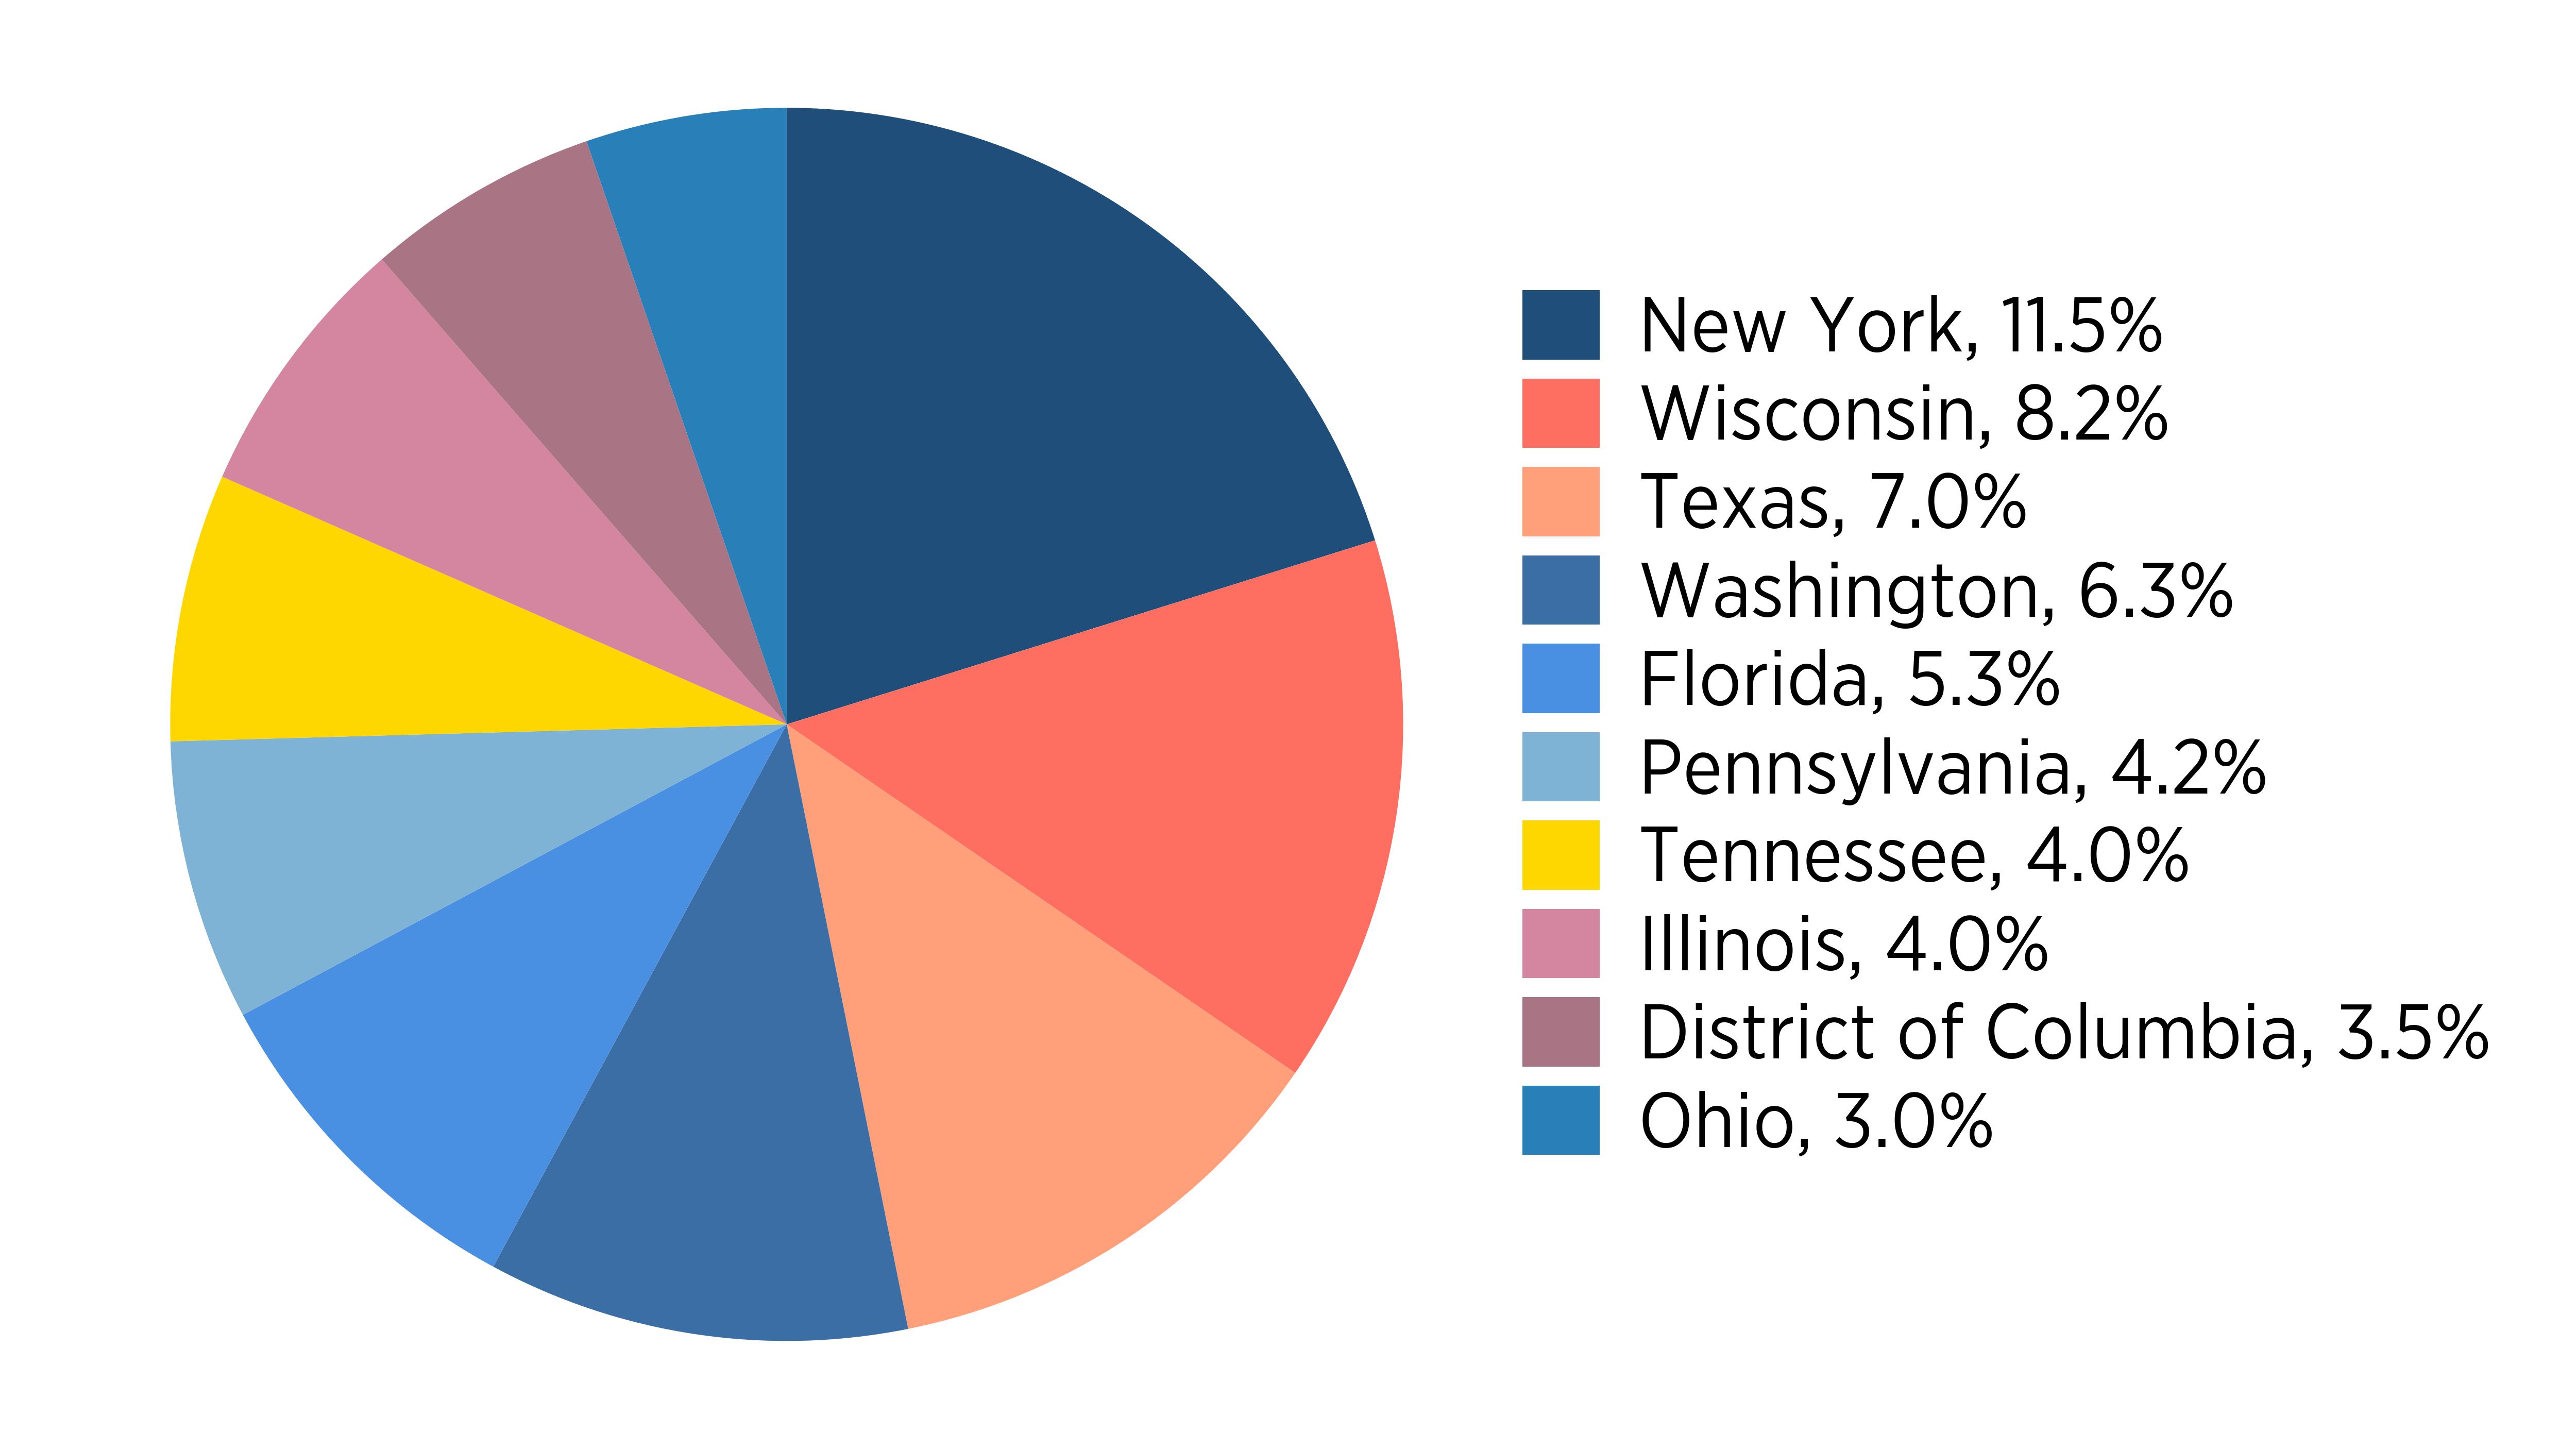
What did the Fund invest in?
(as of June 30, 2025)
|
Top
Investment Types |
% |
|---|---|
|
Cash,
short-term investment, and other assets, less liabilities |
|
|
Revenue
Bonds |
|
|
General
Obligation Bonds |
|
|
Exchange-Traded
Fund |
|
|
U.S.
Treasury Notes |
|
|
Commercial
Mortgage-Backed Securities |
Expressed as a percentage of net assets.
How has the Fund changed?
This is a summary of certain changes to the Series since December 31, 2024. For more complete information, you may review the Series' prospectus, available at www.manning-napier.com/products/mutual-funds or upon request by contacting us at (800) 466‑3863.
Effective March 1, 2025, Diversified Tax Exempt Series' management fee was reduced from 0.50% to 0.30%. Additionally, the Advisor has contractually agreed to limit its fees and reimburse expenses as necessary to ensure that direct annual fund operating expenses for Class A do not exceed 0.60% of average daily net assets.
What were the Fund costs for the past year?
(based on a hypothetical $10,000 investment)
|
Class
Name
|
Costs
of a $10,000 investment
|
Costs
paid as a percentage of a $10,000 investment
|
|---|---|---|
|
Class
W
|
$7
|
0.14%
|
Expenses are equal to Class W shares' annualized expense ratio (for the six-month period) multiplied by the average account value over the period. The Class' expenses would have been higher had certain expenses not been waived or reimbursed during the period.
Key Fund Statistics (as of June 30, 2025)
|
Net
Assets |
$220,659,013 |
|
Number
of Holdings |
158 |
|
Portfolio
Turnover
(for
the six months ended 6/30/25) |
19% |
Top Ten States (% of total investments)
What did the Fund invest in?
(as of June 30, 2025)
|
Top
Investment Types |
% |
|---|---|
|
Cash,
short-term investment, and other assets, less liabilities |
|
|
Revenue
Bonds |
|
|
General
Obligation Bonds |
|
|
Exchange-Traded
Fund |
|
|
U.S.
Treasury Notes |
|
|
Commercial
Mortgage-Backed Securities |
Expressed as a percentage of net assets.
How has the Fund changed?
This is a summary of certain changes to the Series since December 31, 2024. For more complete information, you may review the Series' prospectus, available at www.manning-napier.com/products/mutual-funds or upon request by contacting us at (800) 466‑3863.
Effective March 1, 2025, Diversified Tax Exempt Series' management fee was reduced from 0.50% to 0.30%. The Advisor continues to contractually waive the management fee for Class W shares. Additionally, the Advisor has contractually agreed to limit its fees and reimburse expenses as necessary to ensure that direct annual fund operating expenses of Class W do not exceed 0.30% of average daily net assets.
What were the Fund costs for the past year?
(based on a hypothetical $10,000 investment)
|
Class
Name
|
Costs
of a $10,000 investment
|
Costs
paid as a percentage of a $10,000 investment
|
|---|---|---|
|
Class
I
|
$47
|
0.95%
|
Expenses are equal to Class I shares' annualized expense ratio (for the six-month period) multiplied by the average account value over the period. The Class' expenses would have been higher had certain expenses not been waived or reimbursed during the period.
Key Fund Statistics (as of June 30, 2025)
|
Net
Assets |
$189,034,913 |
|
Number
of Holdings |
32 |
|
Portfolio
Turnover
(for
the six months ended 6/30/25) |
26% |
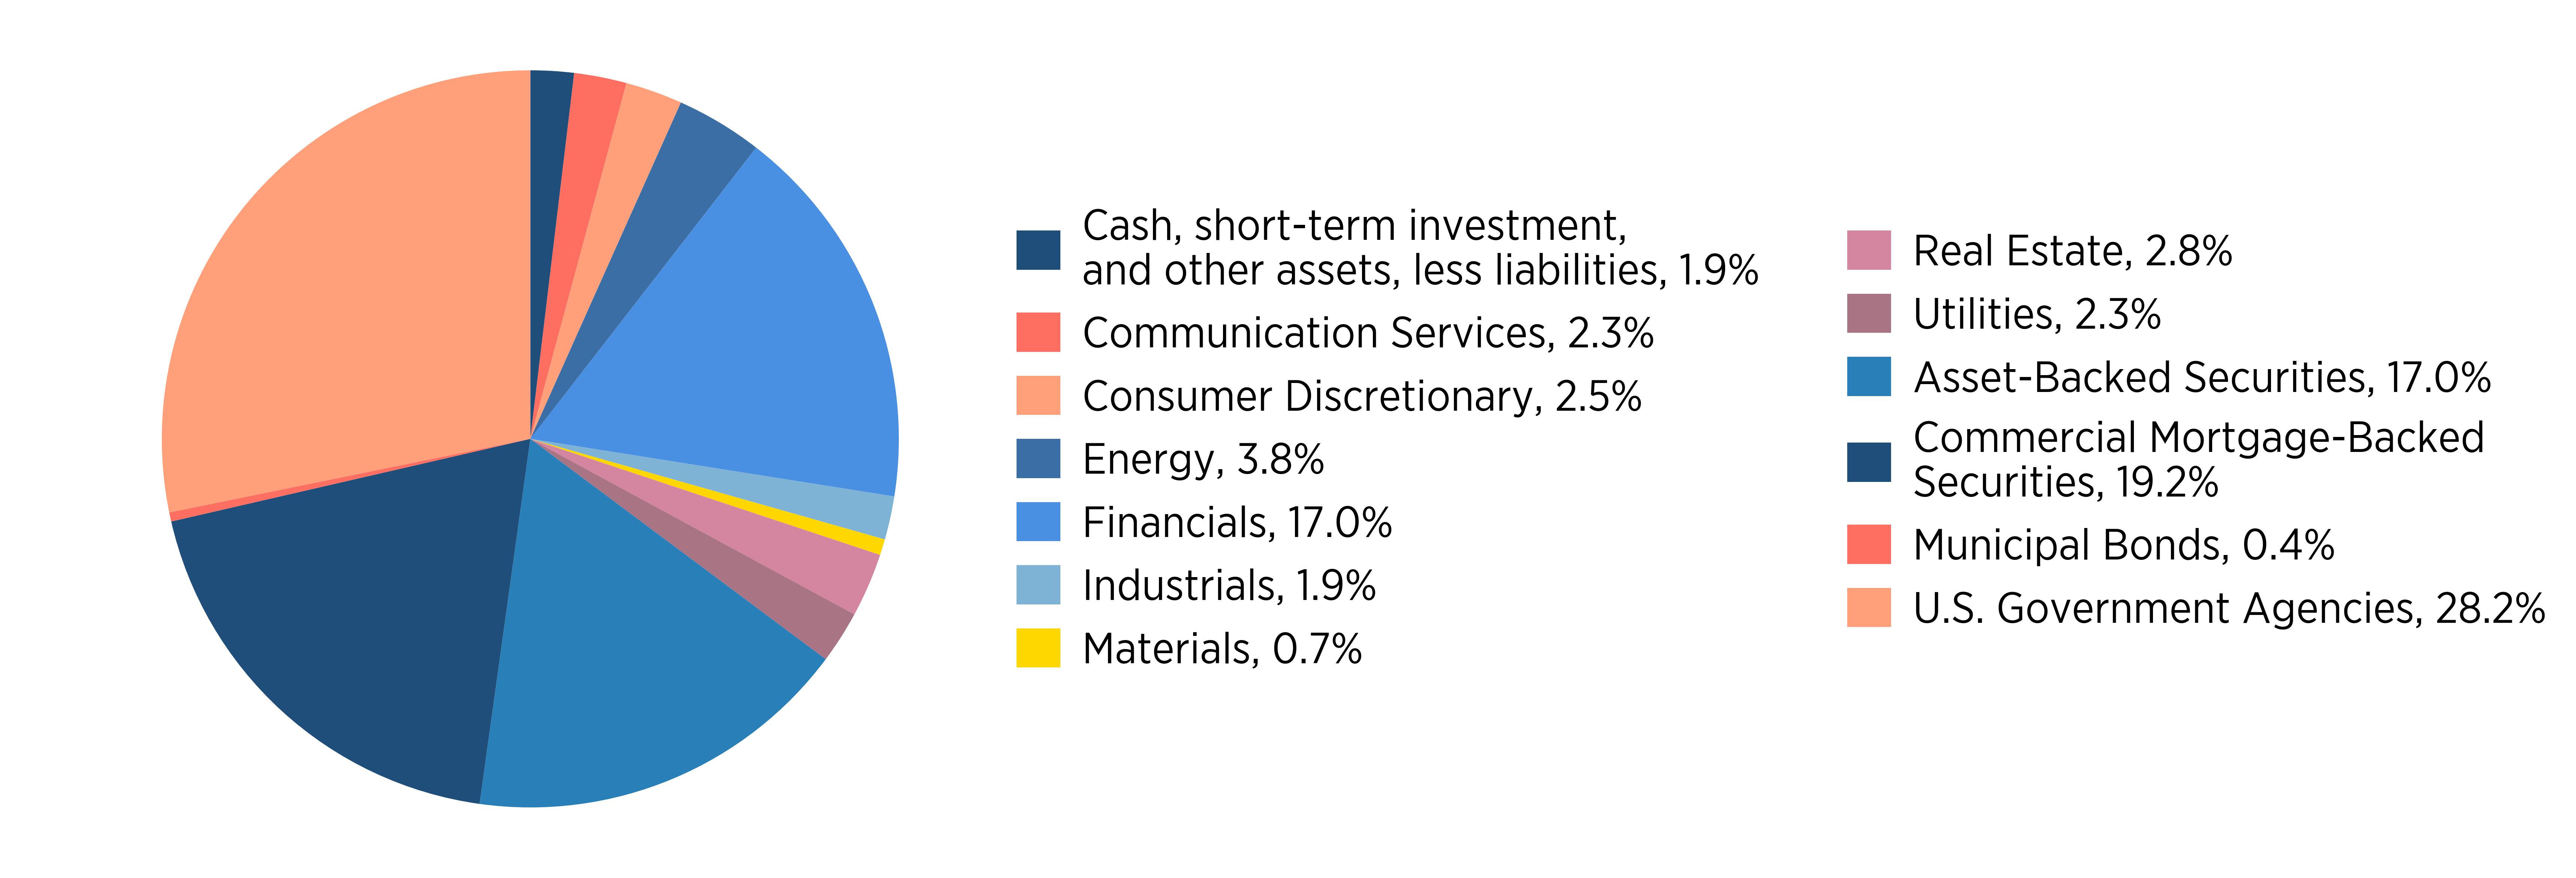
Sector Allocation (% of net assets)
(as of June 30, 2025)
The Global Industry Classification Standard (GICS) was developed by and is exclusive property and a service mark of MSCI Inc. (MSCI) and Standard & Poor's a division of S&P Global Inc. (S&P), and is licensed for use by Manning & Napier when referencing GICS sectors. Neither MSCI, S&P, nor any third party involved in making or compiling the GICS or any GICS classifications makes any express or implied warranties or representations with respect to such standard or classification, nor shall any such party have any liability therefrom.
What did the Fund invest in?
(as of June 30, 2025)
|
Top
Investment Types
|
%
|
|---|---|
|
Cash,
short-term investment, and other assets, less liabilities
|
|
|
Common
Stocks
|
|
Expressed as a percentage of net assets.
What were the Fund costs for the past year?
(based on a hypothetical $10,000 investment)
|
Class
Name
|
Costs
of a $10,000 investment
|
Costs
paid as a percentage of a $10,000 investment
|
|---|---|---|
|
Class
S
|
$57
|
1.16%
|
Expenses are equal to Class S shares' annualized expense ratio (for the six-month period) multiplied by the average account value over the period. The Class' expenses would have been higher had certain expenses not been waived or reimbursed during the period.
Key Fund Statistics (as of June 30, 2025)
|
Net
Assets |
$189,034,913 |
|
Number
of Holdings |
32 |
|
Portfolio
Turnover
(for
the six months ended 6/30/25) |
26% |
Sector Allocation (% of net assets)
(as of June 30, 2025)
The Global Industry Classification Standard (GICS) was developed by and is exclusive property and a service mark of MSCI Inc. (MSCI) and Standard & Poor's a division of S&P Global Inc. (S&P), and is licensed for use by Manning & Napier when referencing GICS sectors. Neither MSCI, S&P, nor any third party involved in making or compiling the GICS or any GICS classifications makes any express or implied warranties or representations with respect to such standard or classification, nor shall any such party have any liability therefrom.
What did the Fund invest in?
(as of June 30, 2025)
|
Top
Investment Types
|
%
|
|---|---|
|
Cash,
short-term investment, and other assets, less liabilities
|
|
|
Common
Stocks
|
|
Expressed as a percentage of net assets.
What were the Fund costs for the past year?
(based on a hypothetical $10,000 investment)
|
Class
Name
|
Costs
of a $10,000 investment
|
Costs
paid as a percentage of a $10,000 investment
|
|---|---|---|
|
Class
Z
|
$40
|
0.80%
|
Expenses are equal to Class Z shares' annualized expense ratio (for the six-month period) multiplied by the average account value over the period. The Class' expenses would have been higher had certain expenses not been waived or reimbursed during the period.
Key Fund Statistics (as of June 30, 2025)
|
Net
Assets |
$189,034,913 |
|
Number
of Holdings |
32 |
|
Portfolio
Turnover
(for
the six months ended 6/30/25) |
26% |
Sector Allocation (% of net assets)
(as of June 30, 2025)
The Global Industry Classification Standard (GICS) was developed by and is exclusive property and a service mark of MSCI Inc. (MSCI) and Standard & Poor's a division of S&P Global Inc. (S&P), and is licensed for use by Manning & Napier when referencing GICS sectors. Neither MSCI, S&P, nor any third party involved in making or compiling the GICS or any GICS classifications makes any express or implied warranties or representations with respect to such standard or classification, nor shall any such party have any liability therefrom.
What did the Fund invest in?
(as of June 30, 2025)
|
Top
Investment Types
|
%
|
|---|---|
|
Cash,
short-term investment, and other assets, less liabilities
|
|
|
Common
Stocks
|
|
Expressed as a percentage of net assets.
What were the Fund costs for the past year?
(based on a hypothetical $10,000 investment)
|
Class
Name
|
Costs
of a $10,000 investment
|
Costs
paid as a percentage of a $10,000 investment
|
|---|---|---|
|
Class
I
|
$25
|
0.50%
|
Expenses are equal to Class I shares' annualized expense ratio (for the six-month period) multiplied by the average account value over the period. The Class' expenses would have been higher had certain expenses not been waived or reimbursed during the period.
Key Fund Statistics (as of June 30, 2025)
|
Net
Assets |
$306,918,759 |
|
Number
of Holdings |
157 |
|
Portfolio
Turnover (for the six months ended 6/30/25) |
14% |
Sector Allocation (% of net assets)
(as of June 30, 2025)
The Global Industry Classification Standard (GICS) was developed by and is exclusive property and a service mark of MSCI Inc. (MSCI) and Standard & Poor's a division of S&P Global Inc. (S&P), and is licensed for use by Manning & Napier when referencing GICS sectors. Neither MSCI, S&P, nor any third party involved in making or compiling the GICS or any GICS classifications makes any express or implied warranties or representations with respect to such standard or classification, nor shall any such party have any liability therefrom.
What were the Fund costs for the past year?
(based on a hypothetical $10,000 investment)
|
Class
Name
|
Costs
of a $10,000 investment
|
Costs
paid as a percentage of a $10,000 investment
|
|---|---|---|
|
Class
S
|
$33
|
0.66%
|
Expenses are equal to Class S shares' annualized expense ratio (for the six-month period) multiplied by the average account value over the period. The Class' expenses would have been higher had certain expenses not been waived or reimbursed during the period.
Key Fund Statistics (as of June 30, 2025)
|
Net
Assets |
$306,918,759 |
|
Number
of Holdings |
157 |
|
Portfolio
Turnover (for the six months ended 6/30/25) |
14% |
Sector Allocation (% of net assets)
(as of June 30, 2025)
The Global Industry Classification Standard (GICS) was developed by and is exclusive property and a service mark of MSCI Inc. (MSCI) and Standard & Poor's a division of S&P Global Inc. (S&P), and is licensed for use by Manning & Napier when referencing GICS sectors. Neither MSCI, S&P, nor any third party involved in making or compiling the GICS or any GICS classifications makes any express or implied warranties or representations with respect to such standard or classification, nor shall any such party have any liability therefrom.
What were the Fund costs for the past year?
(based on a hypothetical $10,000 investment)
|
Class
Name
|
Costs
of a $10,000 investment
|
Costs
paid as a percentage of a $10,000 investment
|
|---|---|---|
|
Class
W
|
$5
|
0.10%
|
Expenses are equal to Class W shares' annualized expense ratio (for the six-month period) multiplied by the average account value over the period. The Class' expenses would have been higher had certain expenses not been waived or reimbursed during the period.
Key Fund Statistics (as of June 30, 2025)
|
Net
Assets |
$306,918,759 |
|
Number
of Holdings |
157 |
|
Portfolio
Turnover (for the six months ended 6/30/25) |
14% |
Sector Allocation (% of net assets)
(as of June 30, 2025)
The Global Industry Classification Standard (GICS) was developed by and is exclusive property and a service mark of MSCI Inc. (MSCI) and Standard & Poor's a division of S&P Global Inc. (S&P), and is licensed for use by Manning & Napier when referencing GICS sectors. Neither MSCI, S&P, nor any third party involved in making or compiling the GICS or any GICS classifications makes any express or implied warranties or representations with respect to such standard or classification, nor shall any such party have any liability therefrom.