The following information provides some indication of the risks of investing in the Fund. The Fund acquired all of the assets and liabilities of the Predecessor Fund in a tax-free reorganization on October 20, 2023. In connection with this acquisition, shares of the Predecessor Fund were exchanged for shares of the Fund. The Predecessor Fund had an investment objective and strategies that were, in all material respects, the same as those of the Fund, and was managed in a manner that, in all material respects, complied with the investment guidelines and restrictions of the Fund. The Fund is a continuation of the Predecessor Fund, and therefore, the performance information includes the performance of the Predecessor Fund. Performance shown below prior to October 20, 2023 is that of the Predecessor Fund.
The bar chart below depicts the change in the performance of the Fund’s Institutional Shares from year to year during the periods indicated. The bar chart figures do not include any applicable sales charges that an investor may pay when they buy or sell shares of the Fund. If sales charges were included, the returns would be lower. The table compares the Fund’s average annual returns for the periods indicated to a broad-based securities market index and a supplemental index. The indices are not actively managed and are not available for direct investment. The bar charts and performance tables assume reinvestment of dividends and distributions. The Fund’s past performance (before and after taxes) does not necessarily indicate how the Fund will perform in the future. Updated performance is available on the Fund’s website www.grandeurpeakglobal.com or by calling 855-377-PEAK(7325).
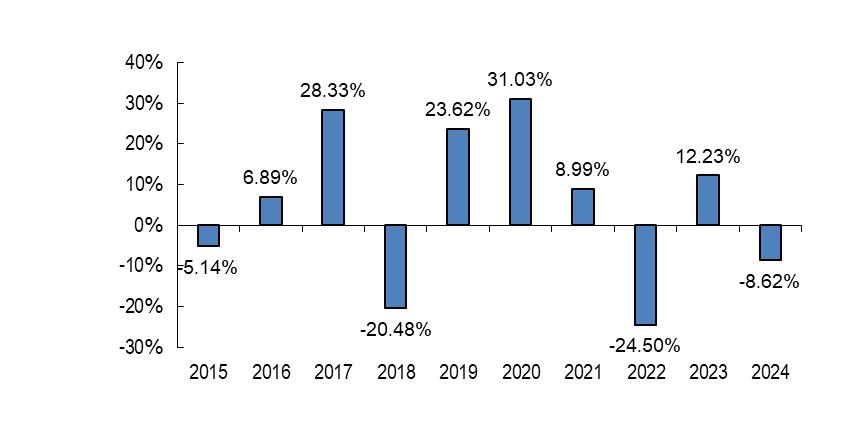
| Best Quarter – June 30, 2020 | 29.37% |
| Worst Quarter – March 31, 2020 | -23.00% |
As of June 30, 2025, the year-to-date return on the Fund’s Institutional Class shares was 9.69%.
| 1 Year | 5 Years | 10 Years | ||||
| Institutional Class | ||||||
| Return Before Taxes | -8.62% | 2.03% | 3.53% | |||
| Return After Taxes on Distributions | -8.24% | 1.41% | 3.07% | |||
| Return After Taxes on Distributions and Sale of Fund Shares | -3.93% | 1.92% | 2.93% | |||
| Investor Class | ||||||
| Return Before Taxes | -8.93% | 1.78% | 3.29% | |||
| Indexes (reflects no deduction for fees, expenses or taxes, other than withholding taxes, as noted)* | ||||||
| MSCI EM SMID Cap Index (Net)** | 3.18% | 5.42% | 4.42% | |||
| MSCI EM IMI Index (Net)** | 7.09% | 2.51% | 3.90% |
| * | The MSCI EM IMI Index is considered the primary benchmark to comply with regulations requiring comparison of the Fund to a broad-based securities market index. The Adviser believes the MSCI EM SMID Cap Index better represents the Fund’s investment strategy. |
| ** | Net performance reflects the reinvestment of dividends after the deduction of withholding taxes, using a tax rate applicable to non-resident individuals who do not benefit from double taxation treaties. |
After-tax returns are calculated using the historically highest individual U.S. federal marginal income tax rates and do not reflect the impact of state and local taxes. Actual after-tax returns depend on your individual tax situation and may differ from those shown in the preceding table. The after-tax return information shown above does not apply to Fund shares held through a tax-advantaged account, such as a 401(k) plan or an IRA.
After-tax returns are shown only for Institutional Class shares of the Fund. After-tax returns for Investor Class shares will vary from those shown for Institutional Class shares due to varying sales charges and expenses among the classes.
The following information provides some indication of the risks of investing in the Fund. The Fund acquired all of the assets and liabilities of the Predecessor Fund in a tax-free reorganization on October 20, 2023. In connection with this acquisition, shares of the Predecessor Fund were exchanged for shares of the Fund. The Predecessor Fund had an investment objective and strategies that were, in all material respects, the same as those of the Fund, and was managed in a manner that, in all material respects, complied with the investment guidelines and restrictions of the Fund. The Fund is a continuation of the Predecessor Fund, and therefore, the performance information includes the performance of the Predecessor Fund. Performance shown below prior to October 20, 2023 is that of the Predecessor Fund.
The bar chart below depicts the change in the Predecessor Fund’s performance from year to year during the periods indicated. The bar chart figures do not include any applicable sales charges that an investor may pay when they buy or sell shares of the Fund. If sales charges were included, the returns would be lower. The table compares the Predecessor Fund’s average annual returns for the periods indicated to a broad-based securities market index and a supplemental index. The indices are not actively managed and are not available for direct investment. The bar charts and performance tables assume reinvestment of dividends and distributions. The Fund’s past performance (before and after taxes) does not necessarily indicate how the Fund will perform in the future. Updated performance is available on the Fund’s website www.grandeurpeakglobal.com or by calling 855-377-PEAK(7325).
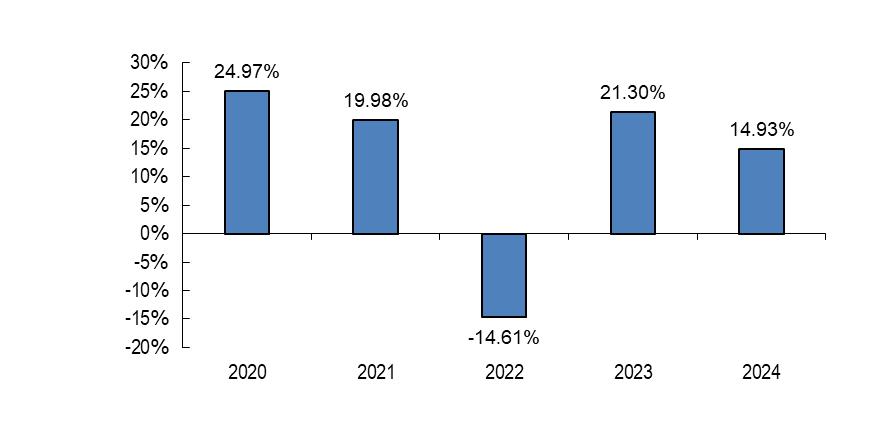
| Best Quarter – December 31, 2020 | 26.01% |
| Worst Quarter – March 31, 2020 | -29.19% |
As of June 30, 2025, the year-to-date return of the Fund’s Institutional Class shares was 10.95%.
| 1 Year | 5 Years | Since Inception (September 17, 2019) | ||||
| Institutional Class | ||||||
| Return Before Taxes | 14.93% | 12.28% | 13.53% | |||
| Return After Taxes on Distributions | 12.56% | 11.02% | 12.31% | |||
| Return After Taxes on Distributions and Sale of Fund Shares | 9.62% | 9.45% | 10.53% | |||
| Indexes (reflects no deduction for fees, expenses or taxes, other than withholding taxes, as noted)* | ||||||
| MSCI ACWI Small Cap Index (Net)** | 7.66% | 6.68% | 7.86% | |||
| MSCI ACWI IMI Index (Net)** | 16.37% | 9.67% | 10.70% |
| * | The MSCI ACWI IMI Index is considered the primary index to comply with regulations requiring comparison of the Fund to a broad-based securities market index. The Adviser believes the MSCI ACWI Small Cap Index better represents the Fund’s investment strategy. |
| ** | Net performance reflects the reinvestment of dividends after the deduction of withholding taxes, using a tax rate applicable to non-resident individuals who do not benefit from double taxation treaties. |
After-tax returns are calculated using the historically highest individual U.S. federal marginal income tax rates and do not reflect the impact of state and local taxes. Actual after-tax returns depend on your individual tax situation and may differ from those shown in the preceding table. The after-tax return information shown above does not apply to Fund shares held through a tax-advantaged account, such as a 401(k) plan or an IRA.
The following information provides some indication of the risks of investing in the Fund. The Fund acquired all of the assets and liabilities of the Predecessor Fund in a tax-free reorganization on October 20, 2023. In connection with this acquisition, shares of the Predecessor Fund were exchanged for shares of the Fund. The Predecessor Fund had an investment objective and strategies that were, in all material respects, the same as those of the Fund, and was managed in a manner that, in all material respects, complied with the investment guidelines and restrictions of the Fund. The Fund is a continuation of the Predecessor Fund, and therefore, the performance information includes the performance of the Predecessor Fund. Performance shown below prior to October 20, 2023 is that of the Predecessor Fund.
The bar chart below depicts the change in the Predecessor Fund’s performance from year to year during the periods indicated. The bar chart figures do not include any applicable sales charges that an investor may pay when they buy or sell shares of the Fund. If sales charges were included, the returns would be lower. The table compares the Predecessor Fund’s average annual returns for the periods indicated to a broad-based securities market index and a supplemental index. The indices are not actively managed and are not available for direct investment. The bar charts and performance tables assume reinvestment of dividends and distributions. The Fund’s past performance (before and after taxes) does not necessarily indicate how the Fund will perform in the future. Updated performance is available on the Fund’s website www.grandeurpeakglobal.com or by calling 855-377-PEAK(7325).
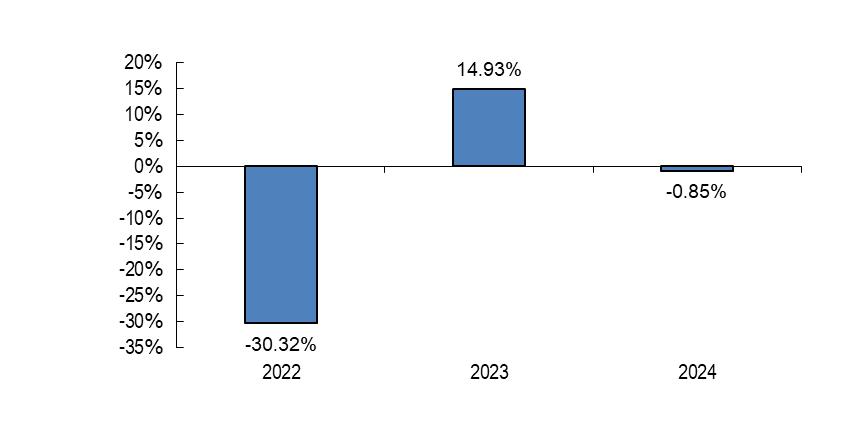
| Best Quarter – December 31, 2023 | 14.13% |
| Worst Quarter – June 30, 2022 | -19.50% |
As of June 30, 2025, the year-to-date return of the Fund’s Institutional Class shares was 8.79%.
| 1 Year | Since Inception (December 16, 2021) | |||
| Institutional Class | ||||
| Return Before Taxes | -0.85% | -6.61% | ||
| Return After Taxes on Distributions | -0.98% | -6.71% | ||
| Return After Taxes on Distributions and Sale of Fund Shares | -0.17% | -4.91% | ||
| Indexes (reflects no deduction for fees, expenses or taxes, other than withholding taxes, as noted)* | ||||
| MSCI ACWI Small-Cap Index (Net)** | 7.66% | 1.92% | ||
| MSCI ACWI Mid Cap Index (Net)** | 9.49% | 1.71% | ||
| MSCI ACWI IMI Index (Net)** | 16.37% | 5.56% |
| * | The MSCI ACWI IMI Index is considered the primary benchmark to comply with regulations requiring comparison of the Fund to a broad-based securities market index. The Adviser believes the MSCI ACWI Small Cap Index better represents the Fund’s investment strategy. | |
| ** | Net performance reflects the reinvestment of dividends after the deduction of withholding taxes, using a tax rate applicable to non-resident individuals who do not benefit from double taxation treaties. |
After-tax returns are calculated using the historically highest individual U.S. federal marginal income tax rates and do not reflect the impact of state and local taxes. Actual after-tax returns depend on your individual tax situation and may differ from those shown in the preceding table. The after-tax return information shown above does not apply to Fund shares held through a tax-advantaged account, such as a 401(k) plan or an IRA.
The following information provides some indication of the risks of investing in the Fund. The Fund acquired all of the assets and liabilities of the Predecessor Fund in a tax-free reorganization on October 20, 2023. In connection with this acquisition, shares of the Predecessor Fund were exchanged for shares of the Fund. The Predecessor Fund had an investment objective and strategies that were, in all material respects, the same as those of the Fund, and was managed in a manner that, in all material respects, complied with the investment guidelines and restrictions of the Fund. The Fund is a continuation of the Predecessor Fund, and therefore, the performance information includes the performance of the Predecessor Fund. Performance shown below prior to October 20, 2023 is that of the Predecessor Fund.
The bar chart below depicts the change in the Predecessor Fund’s performance from year to year during the periods indicated. The bar chart figures do not include any applicable sales charges that an investor may pay when they buy or sell shares of the Fund. If sales charges were included, the returns would be lower. The table compares the Predecessor Fund’s average annual returns for the periods indicated to a broad-based securities market index and two supplemental indices. The indices are not actively managed and are not available for direct investment. The bar charts and performance tables assume reinvestment of dividends and distributions. The Fund’s past performance (before and after taxes) does not necessarily indicate how the Fund will perform in the future. Updated performance is available on the Fund’s website www.grandeurpeakglobal.com or by calling 855-377-PEAK(7325).
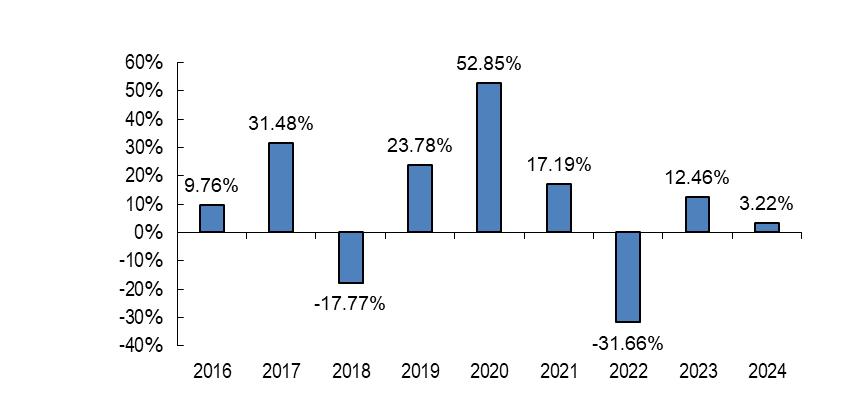
| Best Quarter – June 30, 2020 | 37.61% |
| Worst Quarter – March 31, 2020 | -25.08% |
As of June 30, 2025, the year-to-date return of the Fund’s Institutional Class shares was 12.20%.
| 1 Year | 5 Years | Since Inception (October 21, 2015) | ||||
| Institutional Class | ||||||
| Return Before Taxes | 3.22% | 7.28% | 8.40% | |||
| Return After Taxes on Distributions | 3.41% | 6.17% | 7.34% | |||
| Return After Taxes on Distributions and Sale of Fund Shares | 2.32% | 5.90% | 6.78% | |||
| Indexes (reflects no deduction for fees, expenses or taxes, other than withholding taxes, as noted)* | ||||||
| MSCI World Micro Cap Index (Net)** | 5.71% | 4.50% | 6.30% | |||
| MSCI ACWI Small-Cap Index (Net)** | 7.66% | 6.68% | 7.87% | |||
| MSCI ACWI IMI Index (Net)** | 16.37% | 9.67% | 9.93% |
| * | The MSCI ACWI IMI Index is considered the primary benchmark to comply with regulations requiring comparison of the Fund to a broad-based securities market index. The Adviser believes the MSCI World Micro Cap Index better represents the Fund’s investment strategy. | |
| ** | Net performance reflects the reinvestment of dividends after the deduction of withholding taxes, using a tax rate applicable to non-resident individuals who do not benefit from double taxation treaties. |
After-tax returns are calculated using the historically highest individual U.S. federal marginal income tax rates and do not reflect the impact of state and local taxes. Actual after-tax returns depend on your individual tax situation and may differ from those shown in the preceding table. The after-tax return information shown above does not apply to Fund shares held through a tax-advantaged account, such as a 401(k) plan or an IRA.
The following information provides some indication of the risks of investing in the Fund. The Fund acquired all of the assets and liabilities of the Predecessor Fund in a tax-free reorganization on October 20, 2023. In connection with this acquisition, shares of the Predecessor Fund were exchanged for shares of the Fund. The Predecessor Fund had an investment objective and strategies that were, in all material respects, the same as those of the Fund, and was managed in a manner that, in all material respects, complied with the investment guidelines and restrictions of the Fund. The Fund is a continuation of the Predecessor Fund, and therefore, the performance information includes the performance of the Predecessor Fund. Performance shown below prior to October 20, 2023 is that of the Predecessor Fund.
The bar chart below depicts the change in the performance of the Predecessor Fund’s Institutional Class shares from year to year during the periods indicated. The bar chart figures do not include any applicable sales charges that an investor may pay when they buy or sell shares of the Fund. If sales charges were included, the returns would be lower. The table compares the Predecessor Fund’s average annual returns for the periods indicated to a broad-based securities market index and a supplemental index. The indices are not actively managed and are not available for direct investment. The bar charts and performance tables assume reinvestment of dividends and distributions. The Fund’s past performance (before and after taxes) does not necessarily indicate how the Fund will perform in the future. Updated performance is available on the Fund’s website www.grandeurpeakglobal.com or by calling 855-377-PEAK(7325).
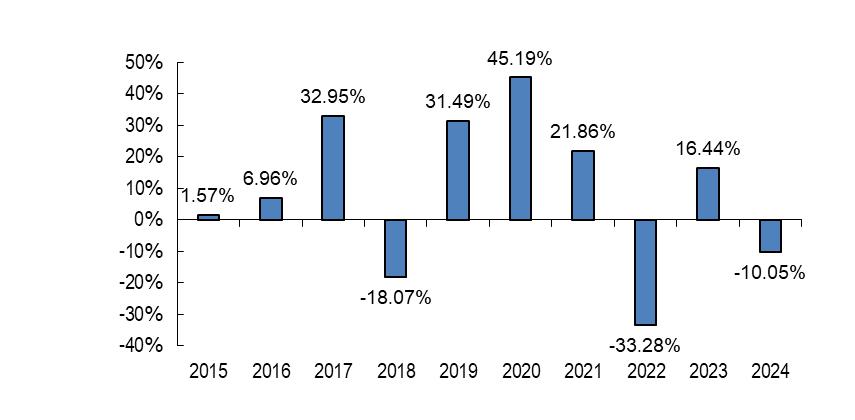
| Best Quarter – June 30, 2020 | 37.50% |
| Worst Quarter – March 31, 2020 | -24.12% |
As of June 30, 2025, the year-to-date return of the Fund’s Institutional Class shares was 8.82%
| 1 Year | 5 Years | 10 Years | ||||
| Institutional Class | ||||||
| Return Before Taxes | -10.05% | 4.33% | 6.76% | |||
| Return After Taxes on Distributions | -10.34% | 2.97% | 5.33% | |||
| Return After Taxes on Distributions and Sale of Fund Shares | -5.57% | 3.69% | 5.43% | |||
| Investor Class | ||||||
| Return Before Taxes | -10.11% | 4.06% | 6.51% | |||
| Indexes (reflects no deduction for fees, expenses or taxes, other than withholding taxes, as noted)* | ||||||
| MSCI ACWI Small Cap Index (Net)** | 7.66% | 6.68% | 7.26% | |||
| MSCI ACWI IMI Index (Net)** | 16.37% | 9.67% | 9.00% |
| * | The MSCI ACWI IMI Index is considered the primary benchmark to comply with regulations requiring comparison of the Fund to a broad-based securities market index. The Adviser believes the MSCI ACWI Small Cap Index better represents the Fund’s investment strategy. | |
| ** | Net performance reflects the reinvestment of dividends after the deduction of withholding taxes, using a tax rate applicable to non-resident individuals who do not benefit from double taxation treaties. |
After-tax returns are calculated using the historically highest individual U.S. federal marginal income tax rates and do not reflect the impact of state and local taxes. Actual after-tax returns depend on your individual tax situation and may differ from those shown in the preceding table. The after-tax return information shown above does not apply to Fund shares held through a tax-advantaged account, such as a 401(k) plan or an IRA.
After-tax returns are only shown for Institutional Class shares of the Fund. After-tax returns for Investor Class shares will vary from those shown for Institutional Class shares due to varying sales charges and expenses among the classes.
The following information provides some indication of the risks of investing in the Fund. The Fund acquired all of the assets and liabilities of the Predecessor Fund in a tax-free reorganization on October 20, 2023. In connection with this acquisition, shares of the Predecessor Fund were exchanged for shares of the Fund. The Predecessor Fund had an investment objective and strategies that were, in all material respects, the same as those of the Fund, and was managed in a manner that, in all material respects, complied with the investment guidelines and restrictions of the Fund. The Fund is a continuation of the Predecessor Fund, and therefore, the performance information includes the performance of the Predecessor Fund. Performance shown below prior to October 20, 2023 is that of the Predecessor Fund.
The bar chart below depicts the change in the performance of the Predecessor Fund’s Institutional Class shares from year to year during the periods indicated. The bar chart figures do not include any applicable sales charges that an investor may pay when they buy or sell shares of the Fund. If sales charges were included, the returns would be lower. The table compares the Predecessor Fund’s average annual returns for the periods indicated to a broad-based securities market index and a supplemental index. The indices are not actively managed and are not available for direct investment. The bar charts and performance tables assume reinvestment of dividends and distributions. The Fund’s past performance (before and after taxes) does not necessarily indicate how the Fund will perform in the future. Updated performance is available on the Fund’s website www.grandeurpeakglobal.com or by calling 855-377-PEAK(7325).
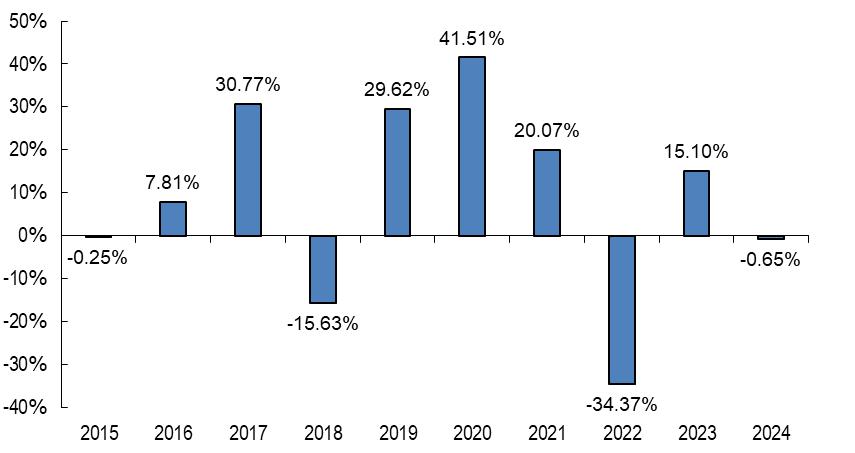
| Best Quarter – June 30, 2020 | 34.12% |
| Worst Quarter – March 31, 2020 | -23.63% |
As of June 30, 2025, the year-to-date return of the Fund’s Institutional Class shares was 8.79%.
| 1 Year | 5 Years | 10 Years | ||||
| Institutional Class | ||||||
| Return Before Taxes | -0.65% | 4.98% | 6.97% | |||
| Return After Taxes on Distributions | -1.85% | 3.65% | 5.81% | |||
| Return After Taxes on Distributions and Sale of Fund Shares | 0.81% | 4.11% | 5.61% | |||
| Investor Class | ||||||
| Return Before Taxes | 0.91% | 4.72% | 6.70% | |||
| Indexes (reflects no deduction for fees, expenses or taxes, other than withholding taxes, as noted)* | ||||||
| MSCI ACWI Small Cap Index (Net)** | 7.66% | 6.68% | 7.26% | |||
| MSCI ACWI IMI Index (Net)** | 16.37% | 9.67% | 9.00% |
| * | The MSCI ACWI IMI Index is considered the primary benchmark to comply with regulations requiring comparison of the Fund to a broad-based securities market index. The Adviser believes the MSCI ACWI Small Cap Index better represents the Fund’s investment strategy. | |
| ** | Net performance reflects the reinvestment of dividends after the deduction of withholding taxes, using a tax rate applicable to non-resident individuals who do not benefit from double taxation treaties. |
After-tax returns are calculated using the historically highest individual U.S. federal marginal income tax rates and do not reflect the impact of state and local taxes. Actual after-tax returns depend on your individual tax situation and may differ from those shown in the preceding table. The after-tax return information shown above does not apply to Fund shares held through a tax-advantaged account, such as a 401(k) plan or an IRA.
After-tax returns are shown only for Institutional Class shares of the Fund. After-tax returns for Investor Class shares will vary from those shown for Institutional Class shares due to varying sales charges and expenses among the classes.
The following information provides some indication of the risks of investing in the Fund. The Fund acquired all of the assets and liabilities of the Predecessor Fund in a tax-free reorganization on October 20, 2023. In connection with this acquisition, shares of the Predecessor Fund were exchanged for shares of the Fund. The Predecessor Fund had an investment objective and strategies that were, in all material respects, the same as those of the Fund, and was managed in a manner that, in all material respects, complied with the investment guidelines and restrictions of the Fund. The Fund is a continuation of the Predecessor Fund, and therefore, the performance information includes the performance of the Predecessor Fund. Performance shown below prior to October 20, 2023 is that of the Predecessor Fund.
The bar chart below depicts the change in the performance of the Predecessor Fund’s Institutional Class shares from year to year during the periods indicated. The bar chart figures do not include any applicable sales charges that an investor may pay when they buy or sell shares of the Fund. If sales charges were included, the returns would be lower. The table compares the Predecessor Fund’s average annual returns for the periods indicated to a broad-based securities market index and two supplemental indices. The indices are not actively managed and are not available for direct investment. The bar charts and performance tables assume reinvestment of dividends and distributions. The Fund’s past performance (before and after taxes) does not necessarily indicate how the Fund will perform in the future. Updated performance is available on the Fund’s website www.grandeurpeakglobal.com or by calling 855-377-PEAK(7325).
| Best Quarter – June 30, 2020 | 37.85% |
| Worst Quarter – June 30, 2022 | -23.33% |
As of June 30, 2025, the year-to-date return of the Fund’s Institutional Class shares was 7.50%
| 1 Year | 5 Years | Since Inception (September 1, 2015) | ||||
| Institutional Class | ||||||
| Return Before Taxes | -4.36% | 3.05% | 7.53% | |||
| Return After Taxes on Distributions | -4.36% | 2.39% | 6.97% | |||
| Return After Taxes on Distributions and Sale of Fund Shares | -2.58% | 2.53% | 6.16% | |||
| Investor Class | ||||||
| Return Before Taxes | -4.60% | 2.78% | 7.26% | |||
| Indexes (reflects no deduction for fees, expenses or taxes, other than withholding taxes, as noted)* | ||||||
| MSCI ACWI Mid Cap Index (Net)** | 9.49% | 6.58% | 8.05% | |||
| MSCI ACWI Small Cap Index (Net)** | 7.66% | 6.68% | 8.21% | |||
| MSCI ACWI IMI Index (Net)** | 16.37% | 9.67% | 10.38% |
| * | The MSCI ACWI IMI Index is considered the primary benchmark to comply with regulations requiring comparison of the Fund to a broad-based securities market index. The Adviser believes the MSCI ACWI Mid Cap Index better represents the Fund’s investment strategy. | |
| ** | Net performance reflects the reinvestment of dividends after the deduction of withholding taxes, using a tax rate applicable to non-resident individuals who do not benefit from double taxation treaties. |
After-tax returns are calculated using the historically highest individual U.S. federal marginal income tax rates and do not reflect the impact of state and local taxes. Actual after-tax returns depend on your individual tax situation and may differ from those shown in the preceding table. The after-tax return information shown above does not apply to Fund shares held through a tax-advantaged account, such as a 401(k) plan or an IRA.
After-tax returns are shown only for Institutional Class shares of the Fund. After-tax returns for Investor Class shares will vary from those shown for Institutional Class shares due to varying sales charges and expenses among the classes.
Because the Fund is not yet operational, no performance information is presented for the Fund at this time. In the future, performance information will be presented in this section of the Prospectus. Updated performance will be available on the Fund’s website www.grandeurpeakglobal.com or by calling 855-377-PEAK (7325).
The following information provides some indication of the risks of investing in the Fund. The Fund acquired all of the assets and liabilities of the Predecessor Fund in a tax-free reorganization on October 20, 2023. In connection with this acquisition, shares of the Predecessor Fund were exchanged for shares of the Fund. The Predecessor Fund had an investment objective and strategies that were, in all material respects, the same as those of the Fund, and was managed in a manner that, in all material respects, complied with the investment guidelines and restrictions of the Fund. The Fund is a continuation of the Predecessor Fund, and therefore, the performance information includes the performance of the Predecessor Fund. Performance shown below prior to October 20, 2023 is that of the Predecessor Fund.
The bar chart below depicts the change in the performance of the Predecessor Fund’s Institutional Class shares from year to year during the periods indicated. The bar chart figures do not include any applicable sales charges that an investor may pay when they buy or sell shares of the Fund. If sales charges were included, the returns would be lower. The table compares the Predecessor Fund’s average annual returns for the periods indicated to a broad-based securities market index and a supplemental index. The indices are not actively managed and are not available for direct investment. The bar charts and performance tables assume reinvestment of dividends and distributions. The Predecessor Fund’s past performance (before and after taxes) does not necessarily indicate how the Fund will perform in the future. Updated performance is available on the Fund’s website www.grandeurpeakglobal.com or by calling 855-377-PEAK(7325).
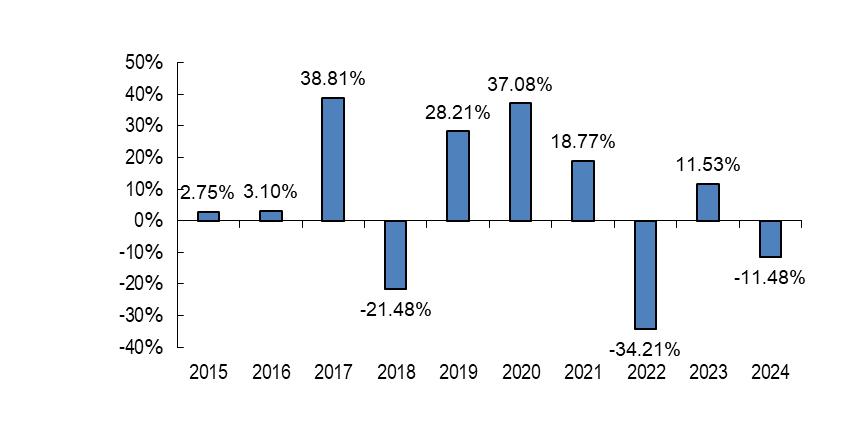
| Best Quarter – June 30, 2020 | 36.23% |
| Worst Quarter – March 31, 2020 | -25.35% |
As of June 30, 2025, the year-to-date return of the Fund’s Institutional Class shares was 14.29%
| 1 Year | 5 Years | 10 Years | ||||
| Institutional Class | ||||||
| Return Before Taxes | -11.48% | 1.12% | 4.58% | |||
| Return After Taxes on Distributions | -12.02% | 0.22% | 3.46% | |||
| Return After Taxes on Distributions and Sale of Fund Shares | -6.42% | 1.13% | 3.66% | |||
| Investor Class | ||||||
| Return Before Taxes | -11.64% | 0.87% | 4.35% | |||
| Indexes (reflects no deduction for fees, expenses or taxes, other than withholding taxes, as noted)* | ||||||
| MSCI ACWI ex USA Small Cap Index (Net)** | 3.36% | 4.30% | 5.66% | |||
| MSCI ACWI ex USA IMI Index (Net)** | 5.23% | 4.12% | 4.91% |
| * | The MSCI ACWI ex USA IMI Index is considered the primary benchmark to comply with regulations requiring comparison of the Fund to a broad-based securities market index. The Adviser believes the MSCI ACWI ex USA Small Cap Index better represents the Fund’s investment strategy. | |
| ** | Net performance reflects the reinvestment of dividends after the deduction of withholding taxes, using a tax rate applicable to non-resident individuals who do not benefit from double taxation treaties. |
After-tax returns are calculated using the historically highest individual U.S. federal marginal income tax rates and do not reflect the impact of state and local taxes. Actual after-tax returns depend on your individual tax situation and may differ from those shown in the preceding table. The after-tax return information shown above does not apply to Fund shares held through a tax-advantaged account, such as a 401(k) plan or an IRA.
After-tax returns are only shown for Institutional Class shares of the Fund. After-tax returns for Investor Class shares will vary from those shown for Institutional Class shares due to varying sales charges and expenses among the classes.
The following information provides some indication of the risks of investing in the Fund. The Fund acquired all of the assets and liabilities of the Predecessor Fund in a tax-free reorganization on October 20, 2023. In connection with this acquisition, shares of the Predecessor Fund were exchanged for shares of the Fund. The Predecessor Fund had an investment objective and strategies that were, in all material respects, the same as those of the Fund, and was managed in a manner that, in all material respects, complied with the investment guidelines and restrictions of the Fund. The Fund is a continuation of the Predecessor Fund, and therefore, the performance information includes the performance of the Predecessor Fund. Performance shown below prior to October 20, 2023 is that of the Predecessor Fund.
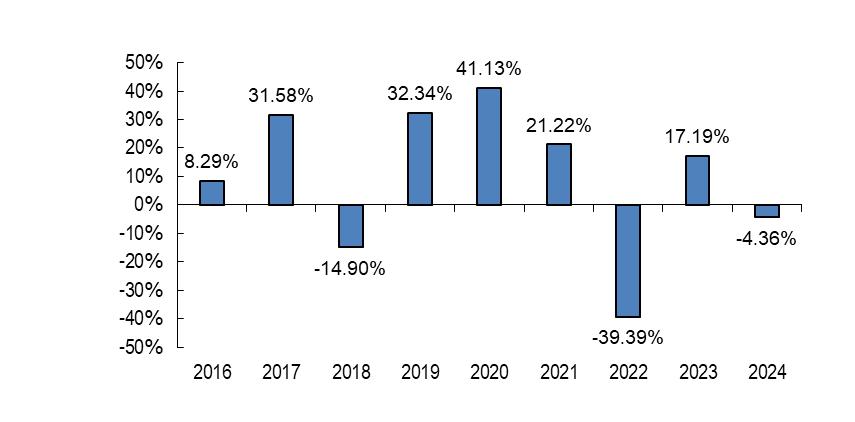
The bar chart depicts the change in the performance of the Predecessor Fund’s Institutional Class shares from year to year during the periods indicated. The bar chart figures do not include any applicable sales charges that an investor may pay when they buy or sell shares of the Fund. If sales charges were included, the returns would be lower. The table compares the Predecessor Fund’s average annual returns for the periods indicated to a broad-based securities market index and two supplemental indices. The indices are not actively managed and are not available for direct investment. The bar charts and performance tables assume reinvestment of dividends and distributions. The Fund’s past performance (before and after taxes) does not necessarily indicate how the Fund will perform in the future. Updated performance is available on the Fund’s website www.grandeurpeakglobal.com or by calling 855-377-PEAK(7325).
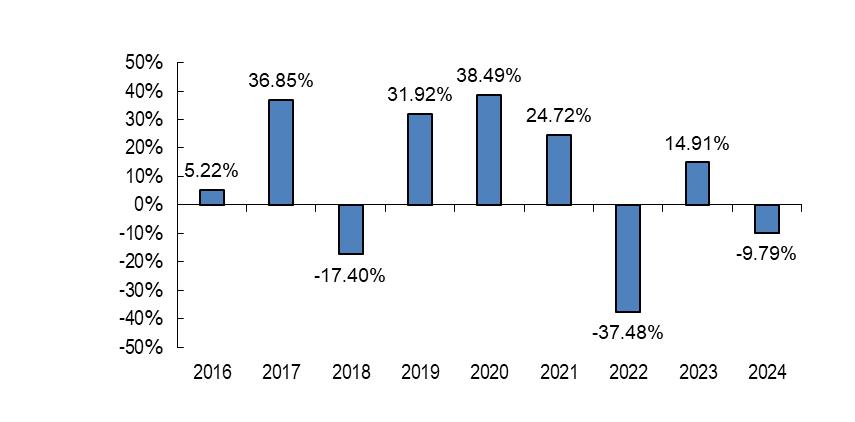
| Best Quarter – June 30, 2020 | 36.28% |
| Worst Quarter – June 30, 2022 | -23.02% |
As of June 30, 2025, the year-to-date return on the Fund’s Institutional Class shares was 14.98%.
| 1 Year | 5 Years | Since Inception (September 1, 2015) | ||||
| Institutional Class | ||||||
| Return Before Taxes | -9.79% | 2.28% | 7.09% | |||
| Return After Taxes on Distributions | -9.76% | 1.85% | 6.70% | |||
| Return After Taxes on Distributions and Sale of Fund Shares | -5.48% | 1.98% | 5.83% | |||
| Investor Class | ||||||
| Return Before Taxes | -10.00% | 2.03% | 6.83% | |||
| Indexes (reflects no deduction for fees, expenses or taxes, other than withholding taxes, as noted)* | ||||||
| MSCI ACWI ex USA Mid Cap Index (Net)** | 3.58% | 2.95% | 5.33% | |||
| MSCI ACWI ex USA Small Cap Index (Net)** | 3.36% | 4.30% | 6.26% | |||
| MSCI ACWI ex USA IMI Index (Net)** | 5.23% | 4.12% | 5.95% |
| * | The MSCI ACWI ex USA IMI Index is considered the primary benchmark to comply with regulations requiring comparison of the Fund to a broad-based securities market index. The Adviser believes the MSCI ACWI ex USA Mid Cap Index better represents the Fund’s investment strategy. | |
| ** | Net performance reflects the reinvestment of dividends after the deduction of withholding taxes, using a tax rate applicable to non-resident individuals who do not benefit from double taxation treaties. |
After-tax returns are calculated using the historically highest individual U.S. federal marginal income tax rates and do not reflect the impact of state and local taxes. Actual after-tax returns depend on your individual tax situation and may differ from those shown in the preceding table. The after-tax return information shown above does not apply to Fund shares held through a tax-advantaged account, such as a 401(k) plan or an IRA.
After-tax returns are shown only for Institutional Class shares of the Fund. After-tax returns for Investor Class shares will vary from those shown for Institutional Class shares due to varying sales charges and expenses among the classes.
The following information provides some indication of the risks of investing in the Fund. The Fund acquired all of the assets and liabilities of the Predecessor Fund in a tax-free reorganization on October 20, 2023. In connection with this acquisition, shares of the Predecessor Fund were exchanged for shares of the Fund. The Predecessor Fund had an investment objective and strategies that were, in all material respects, the same as those of the Fund, and was managed in a manner that, in all material respects, complied with the investment guidelines and restrictions of the Fund. The Fund is a continuation of the Predecessor Fund, and therefore, the performance information includes the performance of the Predecessor Fund. Performance shown below prior to October 20, 2023 is that of the Predecessor Fund.
The bar chart below depicts the change in the Predecessor Fund’s performance from year to year during the periods indicated. The bar chart figures do not include any applicable sales charges that an investor may pay when they buy or sell shares of the Fund. If sales charges were included, the returns would be lower. The table compares the Predecessor Fund’s average annual returns for the periods indicated to a broad-based securities market index and two supplemental indices. The indices are not actively managed and are not available for direct investment. The bar charts and performance tables assume reinvestment of dividends and distributions. The Fund’s past performance (before and after taxes) does not necessarily indicate how the Fund will perform in the future. Updated performance is available on the Fund’s website www.grandeurpeakglobal.com or by calling 855-377-PEAK(7325).
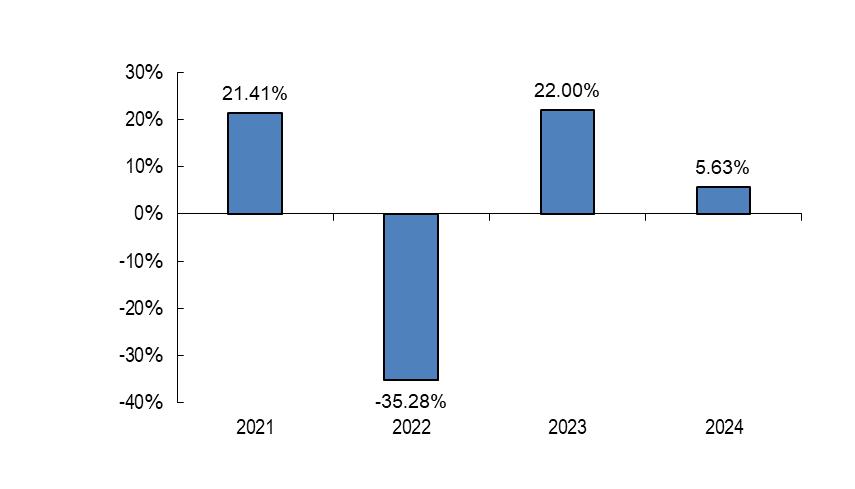
| Best Quarter – December 31, 2023 | 18.75% |
| Worst Quarter – June 30, 2022 | -20.83% |
As of June 30, 2025, the year-to-date return of the Fund’s Institutional Class shares was -1.13%
| 1 Year | Since Inception (March 19, 2020) | |||
| Institutional Class | ||||
| Return Before Taxes | 5.63% | 16.46% | ||
| Return After Taxes on Distributions | 5.63% | 16.30% | ||
| Return After Taxes on Distributions and Sale of Fund Shares | 3.33% | 13.28% | ||
| Indexes (reflects no deduction for fees, expenses or taxes, other than withholding taxes, as noted)* | ||||
| MSCI USA Mid Cap Index (Net)** | 14.75% | 19.93% | ||
| MSCI USA Small-Cap Index (Net)** | 11.57% | 20.47% | ||
| MSCI USA IMI Index (Net)** | 23.32% | 21.82% |
| * | The MSCI USA IMI Index is considered the primary benchmark to comply with regulations requiring comparison of the Fund to a broad-based securities market index. The Adviser believes the MSCI USA Mid-Cap Index better represents the Fund’s investment strategy. | |
| ** | Net performance reflects the reinvestment of dividends after the deduction of withholding taxes, using a tax rate applicable to non-resident individuals who do not benefit from double taxation treaties. |
After-tax returns are calculated using the historically highest individual U.S. federal marginal income tax rates and do not reflect the impact of state and local taxes. Actual after-tax returns depend on your individual tax situation and may differ from those shown in the preceding table. The after-tax return information shown above does not apply to Fund shares held through a tax-advantaged account, such as a 401(k) plan or an IRA.
After-tax returns are shown only for Institutional Class shares of the Fund. After-tax returns for Investor Class shares will vary from those shown for Institutional Class shares due to varying sales charges and expenses among the classes.
| [1] | The MSCI EM IMI Index is considered the primary benchmark to comply with regulations requiring comparison of the Fund to a broad-based securities market index. The Adviser believes the MSCI EM SMID Cap Index better represents the Fund’s investment strategy. |
| [2] | The MSCI ACWI IMI Index is considered the primary index to comply with regulations requiring comparison of the Fund to a broad-based securities market index. The Adviser believes the MSCI ACWI Small Cap Index better represents the Fund’s investment strategy. |
| [3] | The MSCI ACWI IMI Index is considered the primary benchmark to comply with regulations requiring comparison of the Fund to a broad-based securities market index. The Adviser believes the MSCI ACWI Small Cap Index better represents the Fund’s investment strategy. |
| [4] | The MSCI ACWI IMI Index is considered the primary benchmark to comply with regulations requiring comparison of the Fund to a broad-based securities market index. The Adviser believes the MSCI World Micro Cap Index better represents the Fund’s investment strategy. |
| [5] | The MSCI ACWI IMI Index is considered the primary benchmark to comply with regulations requiring comparison of the Fund to a broad-based securities market index. The Adviser believes the MSCI ACWI Small Cap Index better represents the Fund’s investment strategy. |
| [6] | The MSCI ACWI IMI Index is considered the primary benchmark to comply with regulations requiring comparison of the Fund to a broad-based securities market index. The Adviser believes the MSCI ACWI Small Cap Index better represents the Fund’s investment strategy. |
| [7] | The MSCI ACWI IMI Index is considered the primary benchmark to comply with regulations requiring comparison of the Fund to a broad-based securities market index. The Adviser believes the MSCI ACWI Mid Cap Index better represents the Fund’s investment strategy. |
| [8] | The MSCI ACWI ex USA IMI Index is considered the primary benchmark to comply with regulations requiring comparison of the Fund to a broad-based securities market index. The Adviser believes the MSCI ACWI ex USA Small Cap Index better represents the Fund’s investment strategy. |
| [9] | The MSCI ACWI ex USA IMI Index is considered the primary benchmark to comply with regulations requiring comparison of the Fund to a broad-based securities market index. The Adviser believes the MSCI ACWI ex USA Mid Cap Index better represents the Fund’s investment strategy. |
| [10] | The MSCI USA IMI Index is considered the primary benchmark to comply with regulations requiring comparison of the Fund to a broad-based securities market index. The Adviser believes the MSCI USA Mid-Cap Index better represents the Fund’s investment strategy. |