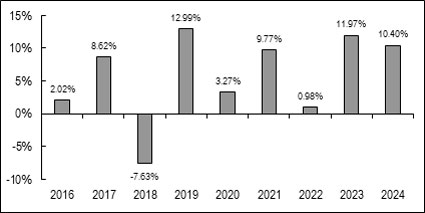
The Fund adopted the accounting history and performance of the predecessor mutual fund, the Main BuyWrite Fund (the “Predecessor Fund”) as the result of a reorganization of the Predecessor Fund into the Fund (the “Reorganization”). Prior to the Reorganization, the Fund had not yet commenced operations. The bar chart and performance table below show the variability of the Fund’s and its Predecessor Fund’s returns, which is some indication of the risks of investing in the Fund. The bar chart shows performance of the Fund’s shares and its Predecessor Fund’s Class I shares for each calendar year since the Predecessor Fund’s inception. The performance table compares the performance of the Fund over time to the performance of a broad-based securities market index and a supplemental index. You should be aware that the Fund’s past performance (before and after taxes) is not necessarily an indication of how the Fund will perform in the future. Updated performance information is available at no cost by visiting www.mainmgtetfs.com or by calling 1-866-ETF-XPRT (1-866-383-9778).
| Best Quarter: | 4th Quarter 2020 | 10.38% |
| Worst Quarter: | 1st Quarter 2020 | (18.91)% |
| One Year | Five Year(1) | Since
Inception of the Fund (12-29-15)(1) | |
| Return before taxes | 10.40% | 7.19% | 5.53% |
| Return after taxes on distributions | 7.98% | 6.25% | 4.94% |
| Return
after taxes on distributions and sale of Fund shares |
6.34% | 5.28% | 4.17% |
| S&P 500 Total Return Index(2) | 25.02% | 14.53% | 14.26% |
| HFRl Equity Hedged Index(3) | 11.87% | 8.07% | 7.13% |
| (1) | Performance returns include the performance of the Predecessor Fund’s Class I Shares. |
| (2) | The S&P 500 Total Return Index (the “Index”) is an unmanaged free-float capitalization-weighted index which measures the performance of 500 large-cap common stocks actively traded in the United States. Index returns assume reinvestment of dividends. Investors may not invest in the Index directly; unlike the Fund’s returns, the Index does not reflect any fees or expenses. |
| (3) | The HFRI Equity Hedged Index returns are reported with a start date of 12/31/15. Equity Hedge (“EH”) managers are investment managers who maintain positions both long and short in primarily equity and equity derivative securities. A wide variety of investment processes can be employed to arrive at an investment decision, including both quantitative and fundamental techniques; strategies can be broadly diversified or narrowly focused on specific sectors and can range broadly in terms of levels of net exposure, leverage employed, holding period, concentrations of market capitalizations and valuation ranges of typical portfolios. EH managers would typically maintain at least 50% exposure to, and may in some cases be entirely invested in, equities, both long and short. Index returns assume reinvestment of dividends. Investors may not invest in the indexes directly; unlike the Fund’s returns, the indexes do not reflect any fees or expenses. Source: Hedge Fund Research. |