Shareholder Report
Jun. 30, 2025
USD ($)
$ / shares
This report describes changes to the Fund that occurred during the reporting period.
WHAT WERE THE FUND COSTS FOR THE PAST YEAR? (based on a hypothetical $10,000 investment)
|
Class Name
|
Costs of a $10,000 investment
|
Costs paid as a percentage of a $10,000 investment
|
|
Class A
|
$112
|
1.06%
|
HOW DID THE FUND PERFORM LAST YEAR? WHAT AFFECTED ITS PERFORMANCE?
PERFORMANCE HIGHLIGHTS
The Large Cap Disciplined Value Fund returned 10.55% for Class A shares at net asset value (NAV) for the 12 months ended June 30, 2025. The Fund underperformed the Russell 3000 Index, which returned 15.30%.
TOP DETRACTORS FROM PERFORMANCE
• Stock selection and an overweight in energy were the primary detractors to performance followed by
stock selection in communication services, industrials, and materials. An overweight in health care also
detracted from performance.
stock selection in communication services, industrials, and materials. An overweight in health care also
detracted from performance.
TOP CONTRIBUTORS TO PERFORMANCE
• Stock selection in information technology and financials, along with an overweight position in financials,
contributed to relative performance.
contributed to relative performance.
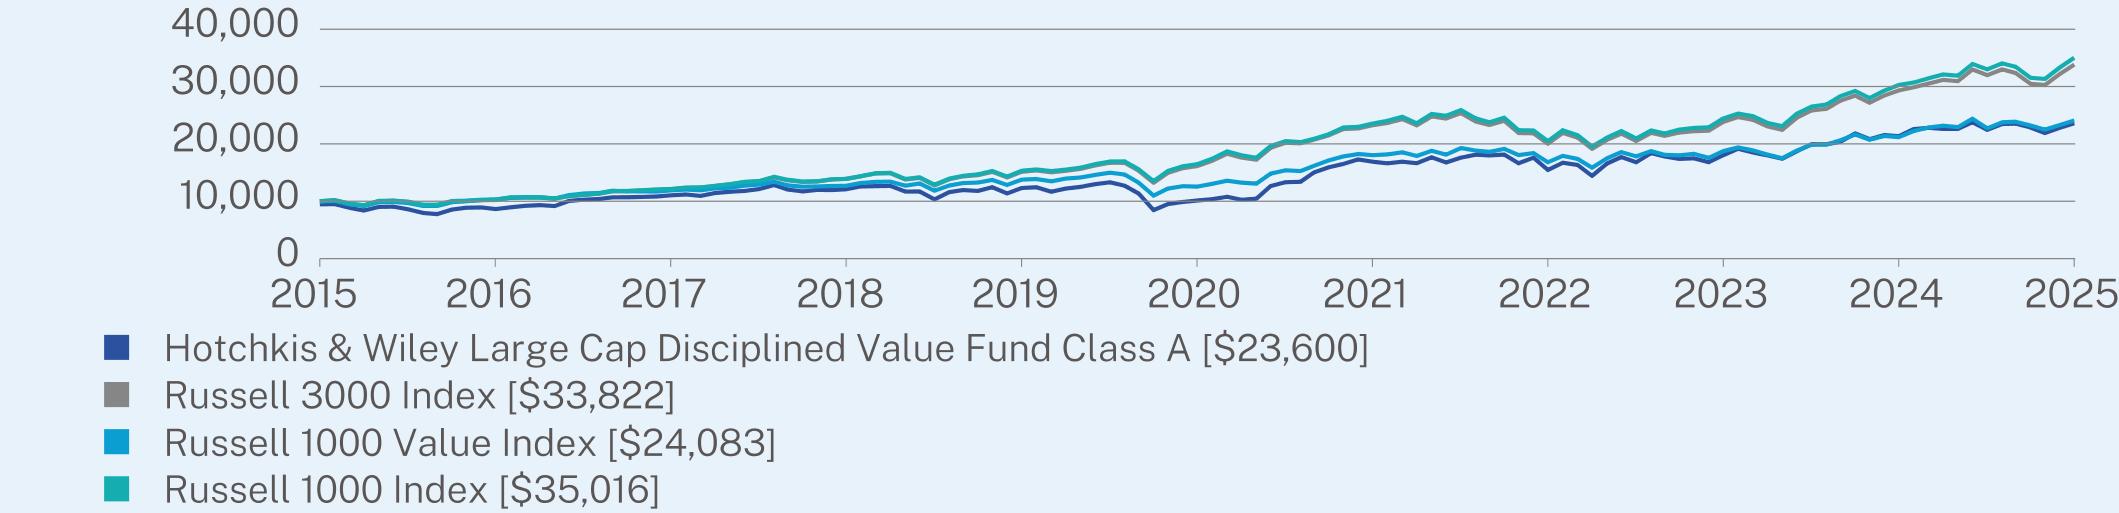
ANNUAL AVERAGE TOTAL RETURN (%)
|
|
1 Year
|
5 Year
|
10 Year
|
|
Class A (without sales charge)
|
10.55
|
18.43
|
9.55
|
|
Class A (with sales charge)
|
4.75
|
17.16
|
8.97
|
|
Russell 3000 Index
|
15.30
|
15.96
|
12.96
|
|
Russell 1000 Value Index
|
13.70
|
13.93
|
9.19
|
|
Russell 1000 Index
|
15.66
|
16.30
|
13.35
|
Visit https://www.hwcm.com/mutual-funds/resources/literature/ for more recent performance information.
Visit https://www.hwcm.com/mutual-funds/resources/literature/ for more recent performance information.
KEY FUND STATISTICS (as of June 30, 2025)
|
Net Assets
|
$80,713,765
|
|
Number of Holdings
|
79
|
|
Net Advisory Fee
|
$466,864
|
|
Portfolio Turnover
|
34%
|

|
Top 10 Issuers
|
(%)
|
|
F5, Inc.
|
5.0%
|
|
Workday, Inc.
|
4.5%
|
|
Citigroup, Inc.
|
3.6%
|
|
Telefonaktiebolaget LM Ericsson
|
2.9%
|
|
Comcast Corp.
|
2.8%
|
|
Wells Fargo & Co.
|
2.8%
|
|
American International Group, Inc.
|
2.7%
|
|
APA Corp.
|
2.4%
|
|
General Motors Co.
|
2.3%
|
|
Dominion Energy, Inc.
|
2.3%
|
Changes to Fund’s Portfolio Manager or Portfolio Management Team:
Effective July 1, 2024, Judd Peters no longer serves as a Portfolio Manager to the Fund and Doug Campbell was added as a Portfolio Manager to the Fund. George H. Davis, Jr., Patricia McKenna, and Scott McBride continue to serve as portfolio managers to the Fund and are jointly responsible for the Fund’s day-to-day management.
Fund Name Change:
Effective August 29, 2024, the Fund changed its name from Hotchkis & Wiley Diversified Value Fund to Hotchkis & Wiley Large Cap Disciplined Value Fund.
This report describes changes to the Fund that occurred during the reporting period.
WHAT WERE THE FUND COSTS FOR THE PAST YEAR? (based on a hypothetical $10,000 investment)
|
Class Name
|
Costs of a $10,000 investment
|
Costs paid as a percentage of a $10,000 investment
|
|
Class I
|
$84
|
0.80%
|
HOW DID THE FUND PERFORM LAST YEAR? WHAT AFFECTED ITS PERFORMANCE?
PERFORMANCE HIGHLIGHTS
The Large Cap Disciplined Value Fund returned 10.81% for Class I shares at net asset value (NAV) for the 12 months ended June 30, 2025. The Fund underperformed the Russell 3000 Index, which returned 15.30%.
TOP DETRACTORS FROM PERFORMANCE
• Stock selection and an overweight in energy were the primary detractors to performance followed by
stock selection in communication services, industrials, and materials. An overweight in health care also
detracted from performance.
stock selection in communication services, industrials, and materials. An overweight in health care also
detracted from performance.
TOP CONTRIBUTORS TO PERFORMANCE
• Stock selection in information technology and financials, along with an overweight position in financials,
contributed to relative performance.
contributed to relative performance.
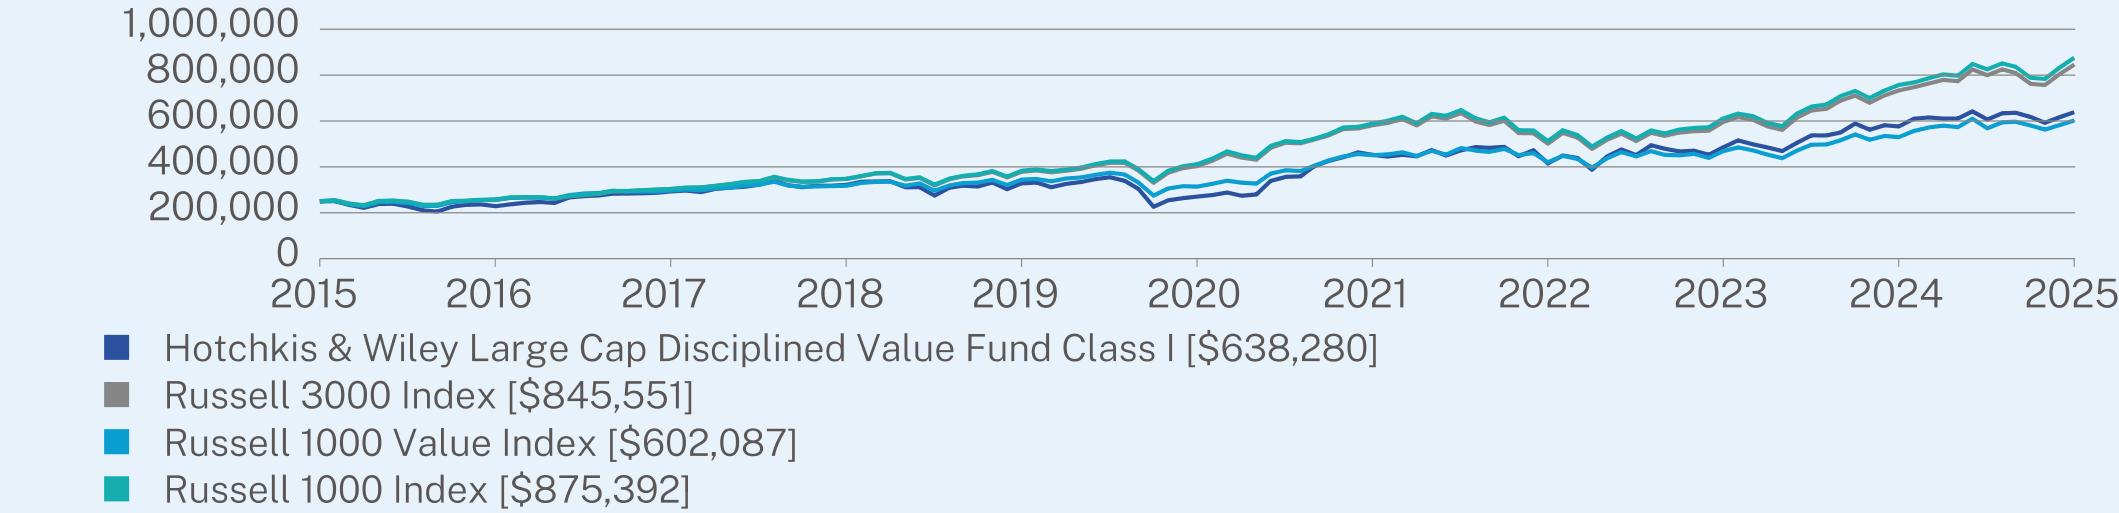
ANNUAL AVERAGE TOTAL RETURN (%)
|
|
1 Year
|
5 Year
|
10 Year
|
|
Class I
|
10.81
|
18.73
|
9.83
|
|
Russell 3000 Index
|
15.30
|
15.96
|
12.96
|
|
Russell 1000 Value Index
|
13.70
|
13.93
|
9.19
|
|
Russell 1000 Index
|
15.66
|
16.30
|
13.35
|
Visit https://www.hwcm.com/mutual-funds/resources/literature/ for more recent performance information.
Visit https://www.hwcm.com/mutual-funds/resources/literature/ for more recent performance information.
KEY FUND STATISTICS (as of June 30, 2025)
|
Net Assets
|
$80,713,765
|
|
Number of Holdings
|
79
|
|
Net Advisory Fee
|
$466,864
|
|
Portfolio Turnover
|
34%
|

|
Top 10 Issuers
|
(%)
|
|
F5, Inc.
|
5.0%
|
|
Workday, Inc.
|
4.5%
|
|
Citigroup, Inc.
|
3.6%
|
|
Telefonaktiebolaget LM Ericsson
|
2.9%
|
|
Comcast Corp.
|
2.8%
|
|
Wells Fargo & Co.
|
2.8%
|
|
American International Group, Inc.
|
2.7%
|
|
APA Corp.
|
2.4%
|
|
General Motors Co.
|
2.3%
|
|
Dominion Energy, Inc.
|
2.3%
|
Changes to Fund’s Portfolio Manager or Portfolio Management Team:
Effective July 1, 2024, Judd Peters no longer serves as a Portfolio Manager to the Fund and Doug Campbell was added as a Portfolio Manager to the Fund. George H. Davis, Jr., Patricia McKenna, and Scott McBride continue to serve as portfolio managers to the Fund and are jointly responsible for the Fund’s day-to-day management.
Fund Name Change:
Effective August 29, 2024, the Fund changed its name from Hotchkis & Wiley Diversified Value Fund to Hotchkis & Wiley Large Cap Disciplined Value Fund.
This report describes changes to the Fund that occurred during the reporting period.
WHAT WERE THE FUND COSTS FOR THE PAST YEAR? (based on a hypothetical $10,000 investment)
|
Class Name
|
Costs of a $10,000 investment
|
Costs paid as a percentage of a $10,000 investment
|
|
Class A
|
$124
|
1.18%
|
HOW DID THE FUND PERFORM LAST YEAR? WHAT AFFECTED ITS PERFORMANCE?
PERFORMANCE HIGHLIGHTS
The Large Cap Fundamental Value Fund returned 9.62% for Class A shares at net asset value (NAV) for the 12 months ended June 30, 2025. The Fund underperformed the Russell 3000 Index, which returned 15.30%.
TOP DETRACTORS FROM PERFORMANCE
•Stock selection and an overweight in energy were the primary detractors to performance followed by
stock selection in communication services, industrials, and materials. An overweight in health care also detracted from performance.
stock selection in communication services, industrials, and materials. An overweight in health care also detracted from performance.
TOP CONTRIBUTORS TO PERFORMANCE
• Stock selection in information technology and financials, along with an overweight position in financials, contributed to relative performance.
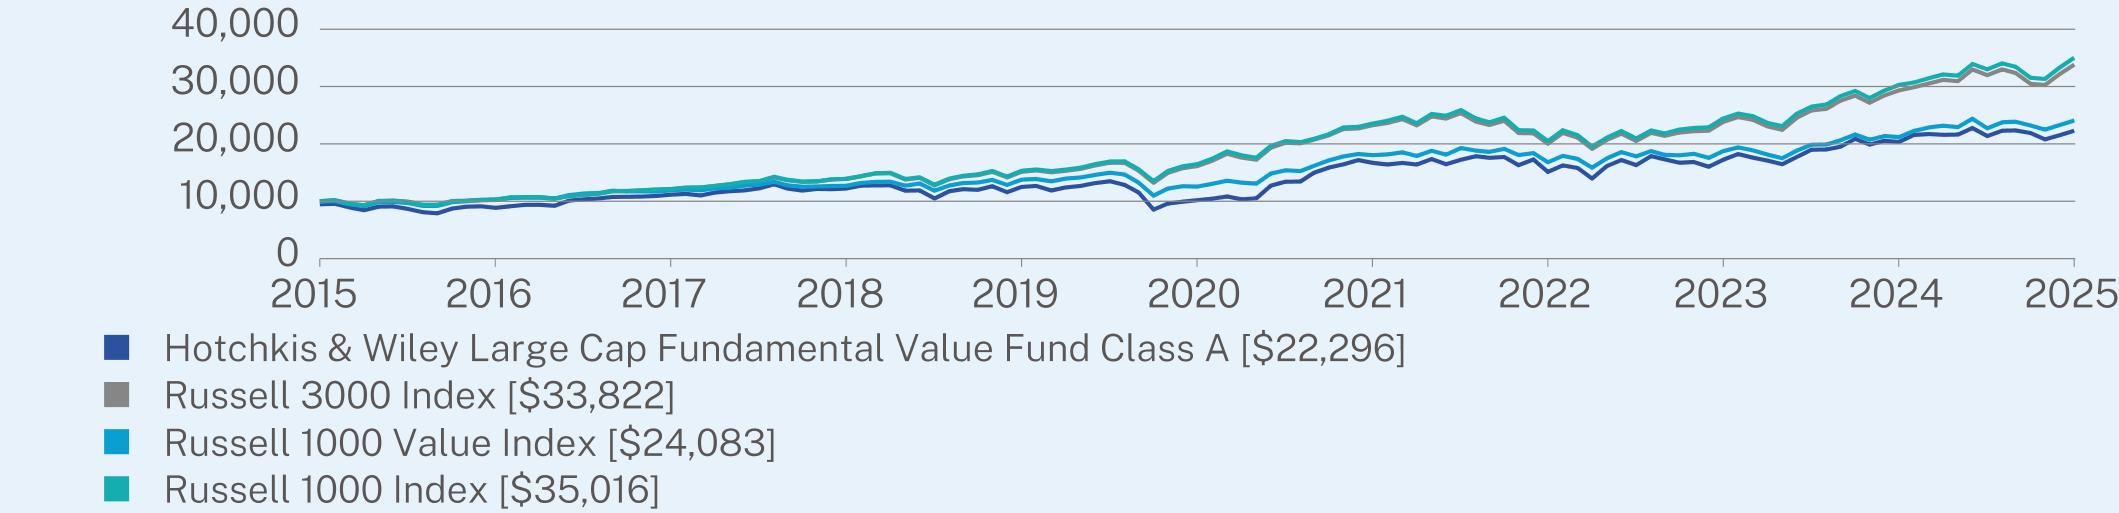
ANNUAL AVERAGE TOTAL RETURN (%)
|
|
1 Year
|
5 Year
|
10 Year
|
|
Class A (without sales charge)
|
9.62
|
16.95
|
8.94
|
|
Class A (with sales charge)
|
3.87
|
15.69
|
8.35
|
|
Russell 3000 Index
|
15.30
|
15.96
|
12.96
|
|
Russell 1000 Value Index
|
13.70
|
13.93
|
9.19
|
|
Russell 1000 Index
|
15.66
|
16.30
|
13.35
|
Visit https://www.hwcm.com/mutual-funds/resources/literature/ for more recent performance information.
Visit https://www.hwcm.com/mutual-funds/resources/literature/ for more recent performance information.
KEY FUND STATISTICS (as of June 30, 2025)
|
Net Assets
|
$369,481,018
|
|
Number of Holdings
|
67
|
|
Net Advisory Fee
|
$2,592,818
|
|
Portfolio Turnover
|
40%
|

|
Top Holdings
|
(%)
|
|
F5, Inc.
|
5.0%
|
|
Citigroup, Inc.
|
3.8%
|
|
Wells Fargo & Co.
|
3.1%
|
|
Telefonaktiebolaget LM Ericsson
|
3.0%
|
|
Comcast Corp. - Class A
|
3.0%
|
|
American International Group, Inc.
|
2.9%
|
|
General Motors Co.
|
2.8%
|
|
Dominion Energy, Inc.
|
2.5%
|
|
Elevance Health, Inc.
|
2.3%
|
|
APA Corp.
|
2.3%
|
Changes to Fund’s Portfolio Manager or Portfolio Management Team:
Effective July 1, 2024, Judd Peters no longer serves as a Portfolio Manager to the Fund and Doug Campbell was added as a Portfolio Manager to the Fund. George H. Davis, Jr., Patricia McKenna, and Scott McBride continue to serve as portfolio managers to the Fund and are jointly responsible for the Fund’s day-to-day management.
Fund Name Change:
Effective August 29, 2024, the Fund changed its name from Hotchkis & Wiley Large Cap Value Fund to Hotchkis & Wiley Large Cap Fundamental Value Fund.
This report describes changes to the Fund that occurred during the reporting period.
WHAT WERE THE FUND COSTS FOR THE PAST YEAR? (based on a hypothetical $10,000 investment)
|
Class Name
|
Costs of a $10,000 investment
|
Costs paid as a percentage of a $10,000 investment
|
|
Class I
|
$100
|
0.95%
|
HOW DID THE FUND PERFORM LAST YEAR? WHAT AFFECTED ITS PERFORMANCE?
PERFORMANCE HIGHLIGHTS
The Large Cap Fundamental Value Fund returned 9.89% for Class I shares at net asset value (NAV) for the 12 months ended June 30, 2025. The Fund underperformed the Russell 3000 Index, which returned 15.30%.
TOP DETRACTORS FROM PERFORMANCE
•Stock selection and an overweight in energy were the primary detractors to performance followed by
stock selection in communication services, industrials, and materials. An overweight in health care also detracted from performance.
stock selection in communication services, industrials, and materials. An overweight in health care also detracted from performance.
TOP CONTRIBUTORS TO PERFORMANCE
• Stock selection in information technology and financials, along with an overweight position in financials, contributed to relative performance.
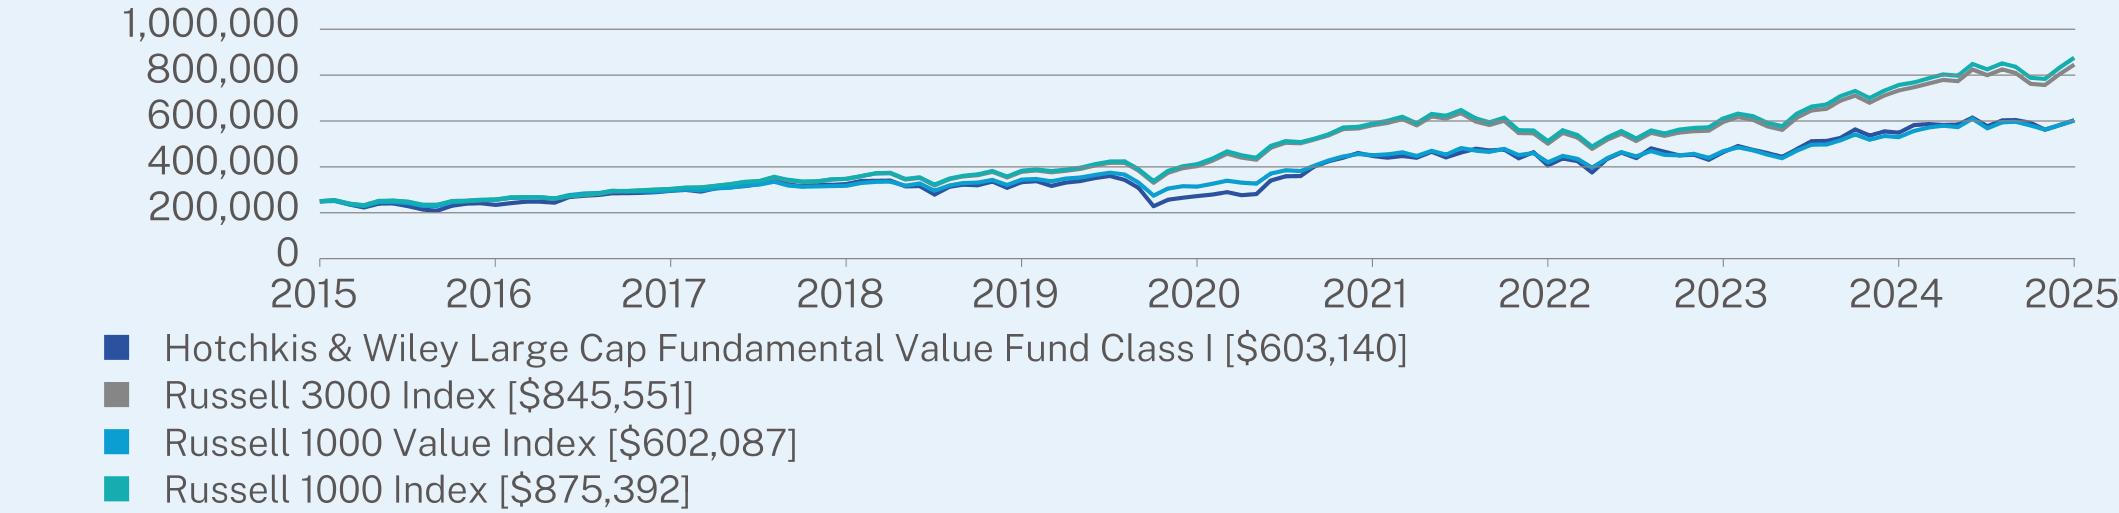
ANNUAL AVERAGE TOTAL RETURN (%)
|
|
1 Year
|
5 Year
|
10 Year
|
|
Class I
|
9.89
|
17.23
|
9.21
|
|
Russell 3000 Index
|
15.30
|
15.96
|
12.96
|
|
Russell 1000 Value Index
|
13.70
|
13.93
|
9.19
|
|
Russell 1000 Index
|
15.66
|
16.30
|
13.35
|
Visit https://www.hwcm.com/mutual-funds/resources/literature/ for more recent performance information.
Visit https://www.hwcm.com/mutual-funds/resources/literature/ for more recent performance information.
KEY FUND STATISTICS (as of June 30, 2025)
|
Net Assets
|
$369,481,018
|
|
Number of Holdings
|
67
|
|
Net Advisory Fee
|
$2,592,818
|
|
Portfolio Turnover
|
40%
|

|
Top Holdings
|
(%)
|
|
F5, Inc.
|
5.0%
|
|
Citigroup, Inc.
|
3.8%
|
|
Wells Fargo & Co.
|
3.1%
|
|
Telefonaktiebolaget LM Ericsson
|
3.0%
|
|
Comcast Corp. - Class A
|
3.0%
|
|
American International Group, Inc.
|
2.9%
|
|
General Motors Co.
|
2.8%
|
|
Dominion Energy, Inc.
|
2.5%
|
|
Elevance Health, Inc.
|
2.3%
|
|
APA Corp.
|
2.3%
|
Changes to Fund’s Portfolio Manager or Portfolio Management Team:
Effective July 1, 2024, Judd Peters no longer serves as a Portfolio Manager to the Fund and Doug Campbell was added as a Portfolio Manager to the Fund. George H. Davis, Jr., Patricia McKenna, and Scott McBride continue to serve as portfolio managers to the Fund and are jointly responsible for the Fund’s day-to-day management.
Fund Name Change:
Effective August 29, 2024, the Fund changed its name from Hotchkis & Wiley Large Cap Value Fund to Hotchkis & Wiley Large Cap Fundamental Value Fund.
This report describes changes to the Fund that occurred during the reporting period.
WHAT WERE THE FUND COSTS FOR THE PAST YEAR? (based on a hypothetical $10,000 investment)
|
Class Name
|
Costs of a $10,000 investment
|
Costs paid as a percentage of a $10,000 investment
|
|
Class Z
|
$89
|
0.85%
|
HOW DID THE FUND PERFORM LAST YEAR? WHAT AFFECTED ITS PERFORMANCE?
PERFORMANCE HIGHLIGHTS
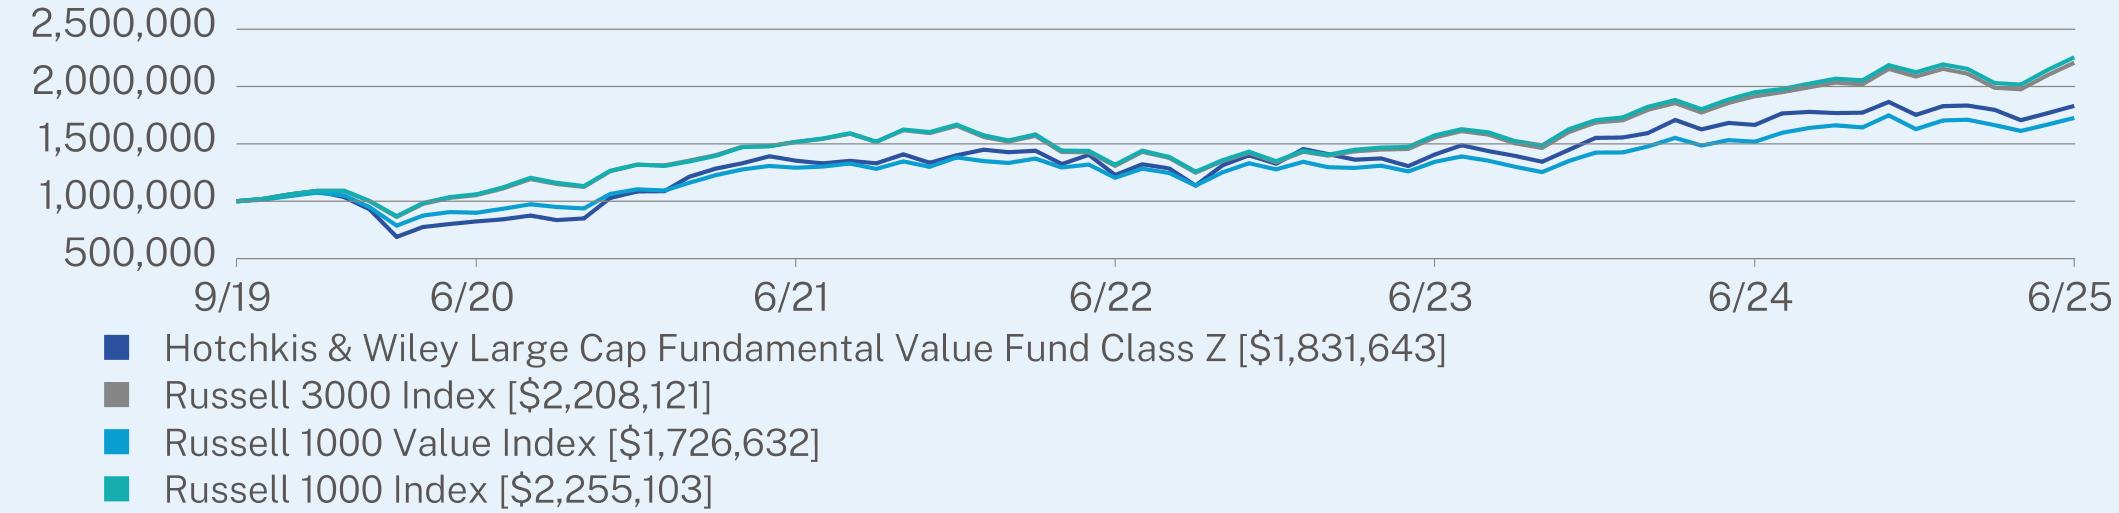
The Large Cap Fundamental Value Fund returned 9.98% for Class Z shares at net asset value (NAV) for the 12 months ended June 30, 2025. The Fund underperformed the Russell 3000 Index, which returned 15.30%.
TOP DETRACTORS FROM PERFORMANCE
•Stock selection and an overweight in energy were the primary detractors to performance followed by
stock selection in communication services, industrials, and materials. An overweight in health care also detracted from performance.
stock selection in communication services, industrials, and materials. An overweight in health care also detracted from performance.
TOP CONTRIBUTORS TO PERFORMANCE
• Stock selection in information technology and financials, along with an overweight position in financials, contributed to relative performance.
ANNUAL AVERAGE TOTAL RETURN (%)
|
|
1 Year
|
5 Year
|
Since Inception
(09/30/2019) |
|
Class Z
|
9.98
|
17.34
|
11.10
|
|
Russell 3000 Index
|
15.30
|
15.96
|
14.77
|
|
Russell 1000 Value Index
|
13.70
|
13.93
|
9.96
|
|
Russell 1000 Index
|
15.66
|
16.30
|
15.19
|
Visit https://www.hwcm.com/mutual-funds/resources/literature/ for more recent performance information.
Visit https://www.hwcm.com/mutual-funds/resources/literature/ for more recent performance information.
KEY FUND STATISTICS (as of June 30, 2025)
|
Net Assets
|
$369,481,018
|
|
Number of Holdings
|
67
|
|
Net Advisory Fee
|
$2,592,818
|
|
Portfolio Turnover
|
40%
|
|
Top Holdings
|
(%)
|
|
F5, Inc.
|
5.0%
|
|
Citigroup, Inc.
|
3.8%
|
|
Wells Fargo & Co.
|
3.1%
|
|
Telefonaktiebolaget LM Ericsson
|
3.0%
|
|
Comcast Corp. - Class A
|
3.0%
|
|
American International Group, Inc.
|
2.9%
|
|
General Motors Co.
|
2.8%
|
|
Dominion Energy, Inc.
|
2.5%
|
|
Elevance Health, Inc.
|
2.3%
|
|
APA Corp.
|
2.3%
|
Changes to Fund’s Portfolio Manager or Portfolio Management Team:
Effective July 1, 2024, Judd Peters no longer serves as a Portfolio Manager to the Fund and Doug Campbell was added as a Portfolio Manager to the Fund. George H. Davis, Jr., Patricia McKenna, and Scott McBride continue to serve as portfolio managers to the Fund and are jointly responsible for the Fund’s day-to-day management.
Fund Name Change:
Effective August 29, 2024, the Fund changed its name from Hotchkis & Wiley Large Cap Value Fund to Hotchkis & Wiley Large Cap Fundamental Value Fund.
WHAT WERE THE FUND COSTS FOR THE PAST YEAR? (based on a hypothetical $10,000 investment)
|
Class Name
|
Costs of a $10,000 investment
|
Costs paid as a percentage of a $10,000 investment
|
|
Class A
|
$122
|
1.21%
|
HOW DID THE FUND PERFORM LAST YEAR? WHAT AFFECTED ITS PERFORMANCE?
PERFORMANCE HIGHLIGHTS
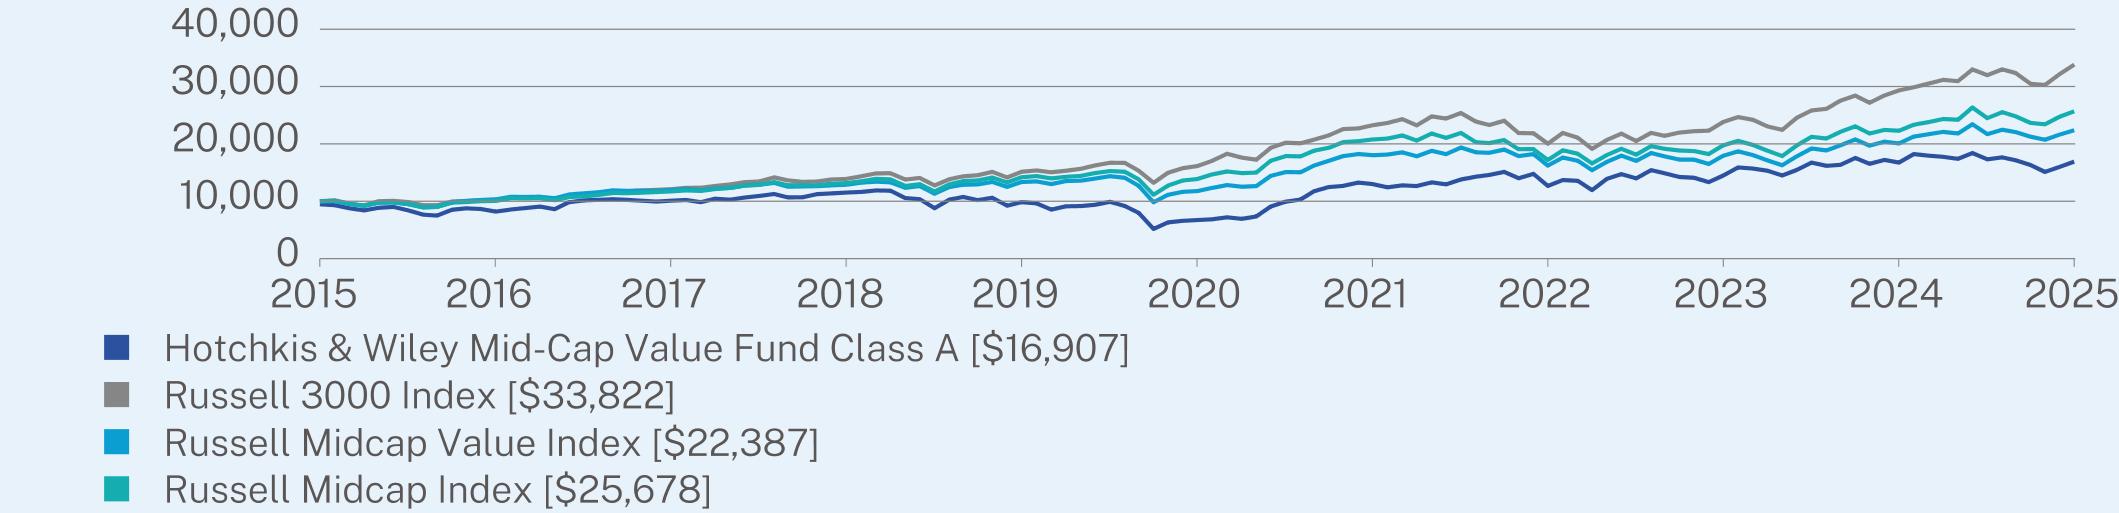
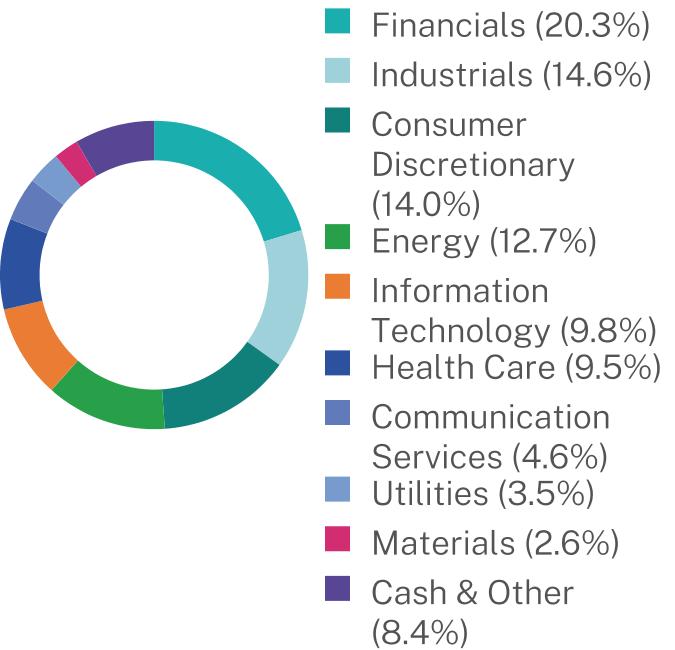
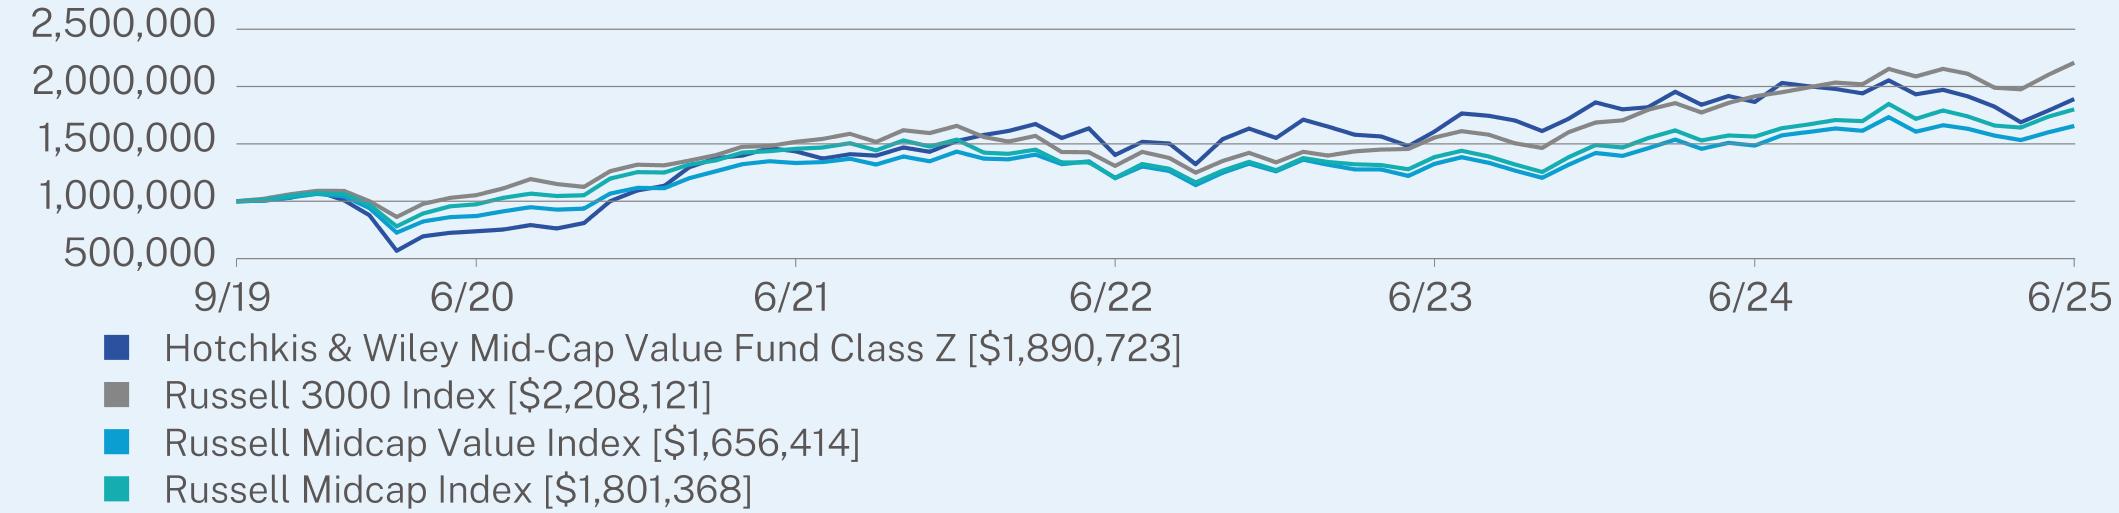
The Mid-Cap Value Fund returned 1.01% for Class A shares at net asset value (NAV) for the 12 months ended June 30, 2025. The Fund underperformed the Russell 3000 Index, which returned 15.30%.
TOP DETRACTORS FROM PERFORMANCE
• Stock selection and an overweight in energy was the primary detractor to performance followed by stock selection in consumer discretionary, materials, and industrials.
TOP CONTRIBUTORS TO PERFORMANCE
• Stock selection in information technology and financials, along with an overweight position in financials, contributed positively to relative performance. Stock selection in health care also contributed to performance.
ANNUAL AVERAGE TOTAL RETURN (%)
|
|
1 Year
|
5 Year
|
10 Year
|
|
Class A (without sales charge)
|
1.01
|
20.29
|
5.96
|
|
Class A (with sales charge)
|
-4.30
|
18.99
|
5.39
|
|
Russell 3000 Index
|
15.30
|
15.96
|
12.96
|
|
Russell Midcap Value Index
|
11.53
|
13.71
|
8.39
|
|
Russell Midcap Index
|
15.21
|
13.11
|
9.89
|
Visit https://www.hwcm.com/mutual-funds/resources/literature/ for more recent performance information.
Visit https://www.hwcm.com/mutual-funds/resources/literature/ for more recent performance information.
KEY FUND STATISTICS (as of June 30, 2025)
|
Net Assets
|
$379,156,892
|
|
Number of Holdings
|
71
|
|
Net Advisory Fee
|
$3,090,577
|
|
Portfolio Turnover
|
31%
|

|
Top Holdings
|
(%)
|
|
F5, Inc.
|
4.0%
|
|
Popular, Inc.
|
4.0%
|
|
Telefonaktiebolaget LM Ericsson
|
3.9%
|
|
APA Corp.
|
3.7%
|
|
Citizens Financial Group, Inc.
|
3.5%
|
|
Fluor Corp.
|
3.5%
|
|
Adient PLC
|
2.8%
|
|
State Street Corp.
|
2.7%
|
|
American International Group, Inc.
|
2.7%
|
|
Magna International, Inc.
|
2.6%
|
WHAT WERE THE FUND COSTS FOR THE PAST YEAR? (based on a hypothetical $10,000 investment)
|
Class Name
|
Costs of a $10,000 investment
|
Costs paid as a percentage of a $10,000 investment
|
|
Class I
|
$101
|
1.00%
|
HOW DID THE FUND PERFORM LAST YEAR? WHAT AFFECTED ITS PERFORMANCE?
PERFORMANCE HIGHLIGHTS
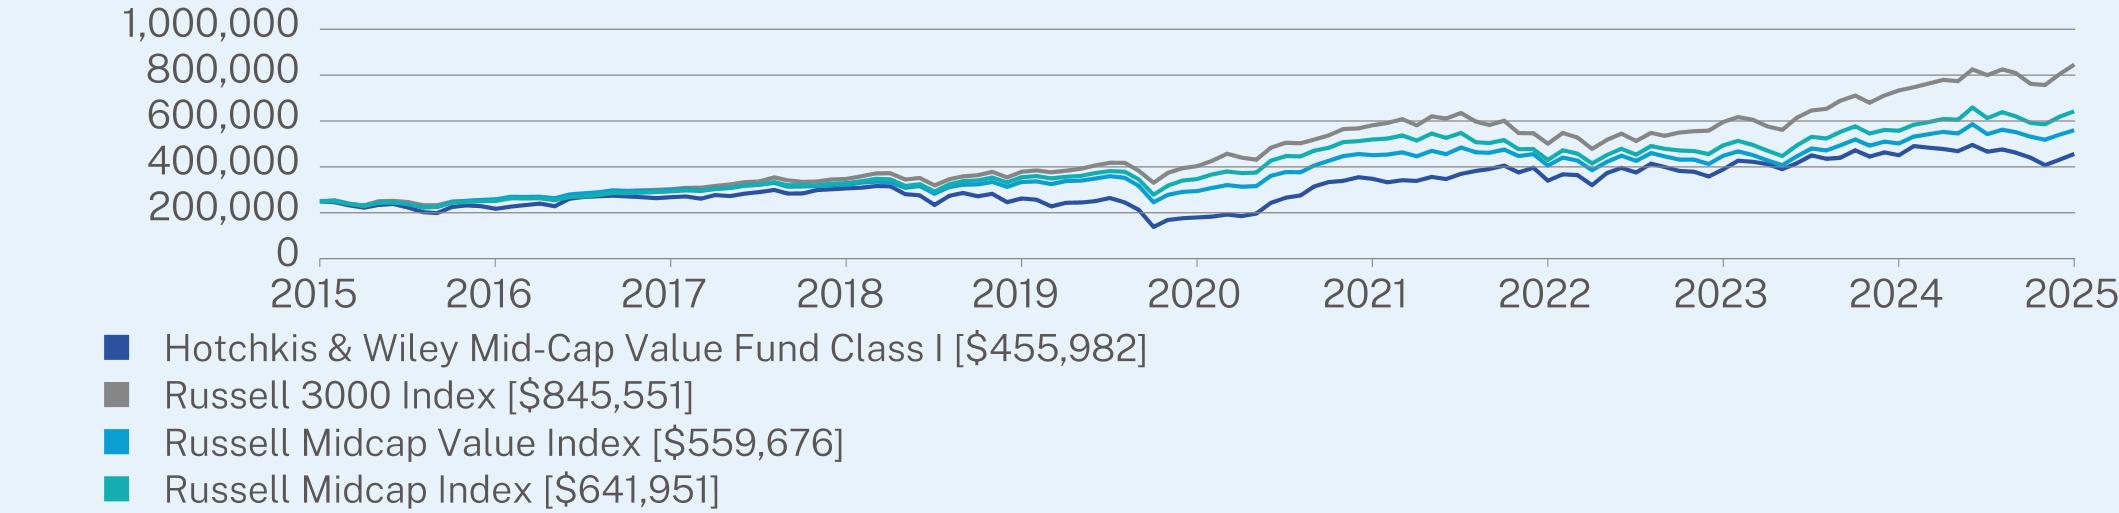
The Mid-Cap Value Fund returned 1.21% for Class I shares at net asset value (NAV) for the 12 months ended June 30, 2025. The Fund underperformed the Russell 3000 Index, which returned 15.30%.
TOP DETRACTORS FROM PERFORMANCE
• Stock selection and an overweight in energy was the primary detractor to performance followed by stock selection in consumer discretionary, materials, and industrials.
TOP CONTRIBUTORS TO PERFORMANCE
• Stock selection in information technology and financials, along with an overweight position in financials, contributed positively to relative performance. Stock selection in health care also contributed to performance.
ANNUAL AVERAGE TOTAL RETURN (%)
|
|
1 Year
|
5 Year
|
10 Year
|
|
Class I
|
1.21
|
20.52
|
6.19
|
|
Russell 3000 Index
|
15.30
|
15.96
|
12.96
|
|
Russell Midcap Value Index
|
11.53
|
13.71
|
8.39
|
|
Russell Midcap Index
|
15.21
|
13.11
|
9.89
|
Visit https://www.hwcm.com/mutual-funds/resources/literature/ for more recent performance information.
Visit https://www.hwcm.com/mutual-funds/resources/literature/ for more recent performance information.
KEY FUND STATISTICS (as of June 30, 2025)
|
Net Assets
|
$379,156,892
|
|
Number of Holdings
|
71
|
|
Net Advisory Fee
|
$3,090,577
|
|
Portfolio Turnover
|
31%
|
|
Top Holdings
|
(%)
|
|
F5, Inc.
|
4.0%
|
|
Popular, Inc.
|
4.0%
|
|
Telefonaktiebolaget LM Ericsson
|
3.9%
|
|
APA Corp.
|
3.7%
|
|
Citizens Financial Group, Inc.
|
3.5%
|
|
Fluor Corp.
|
3.5%
|
|
Adient PLC
|
2.8%
|
|
State Street Corp.
|
2.7%
|
|
American International Group, Inc.
|
2.7%
|
|
Magna International, Inc.
|
2.6%
|
WHAT WERE THE FUND COSTS FOR THE PAST YEAR? (based on a hypothetical $10,000 investment)
|
Class Name
|
Costs of a $10,000 investment
|
Costs paid as a percentage of a $10,000 investment
|
|
Class Z
|
$89
|
0.88%
|
HOW DID THE FUND PERFORM LAST YEAR? WHAT AFFECTED ITS PERFORMANCE?
PERFORMANCE HIGHLIGHTS
The Mid-Cap Value Fund returned 1.33% for Class Z shares at net asset value (NAV) for the 12 months ended June 30, 2025. The Fund underperformed the Russell 3000 Index, which returned 15.30%.
TOP DETRACTORS FROM PERFORMANCE
• Stock selection and an overweight in energy was the primary detractor to performance followed by stock selection in consumer discretionary, materials, and industrials.
TOP CONTRIBUTORS TO PERFORMANCE
• Stock selection in information technology and financials, along with an overweight position in financials, contributed positively to relative performance. Stock selection in health care also contributed to performance.
ANNUAL AVERAGE TOTAL RETURN (%)
|
|
1 Year
|
5 Year
|
Since Inception
(09/30/2019) |
|
Class Z
|
1.33
|
20.69
|
11.71
|
|
Russell 3000 Index
|
15.30
|
15.96
|
14.77
|
|
Russell Midcap Value Index
|
11.53
|
13.71
|
9.17
|
|
Russell Midcap Index
|
15.21
|
13.11
|
10.78
|
Visit https://www.hwcm.com/mutual-funds/resources/literature/ for more recent performance information.
Visit https://www.hwcm.com/mutual-funds/resources/literature/ for more recent performance information.
KEY FUND STATISTICS (as of June 30, 2025)
|
Net Assets
|
$379,156,892
|
|
Number of Holdings
|
71
|
|
Net Advisory Fee
|
$3,090,577
|
|
Portfolio Turnover
|
31%
|

|
Top Holdings
|
(%)
|
|
F5, Inc.
|
4.0%
|
|
Popular, Inc.
|
4.0%
|
|
Telefonaktiebolaget LM Ericsson
|
3.9%
|
|
APA Corp.
|
3.7%
|
|
Citizens Financial Group, Inc.
|
3.5%
|
|
Fluor Corp.
|
3.5%
|
|
Adient PLC
|
2.8%
|
|
State Street Corp.
|
2.7%
|
|
American International Group, Inc.
|
2.7%
|
|
Magna International, Inc.
|
2.6%
|
WHAT WERE THE FUND COSTS FOR THE PAST YEAR? (based on a hypothetical $10,000 investment)
|
Class Name
|
Costs of a $10,000 investment
|
Costs paid as a percentage of a $10,000 investment
|
|
Class A
|
$121
|
1.20%
|
HOW DID THE FUND PERFORM LAST YEAR? WHAT AFFECTED ITS PERFORMANCE?
PERFORMANCE HIGHLIGHTS
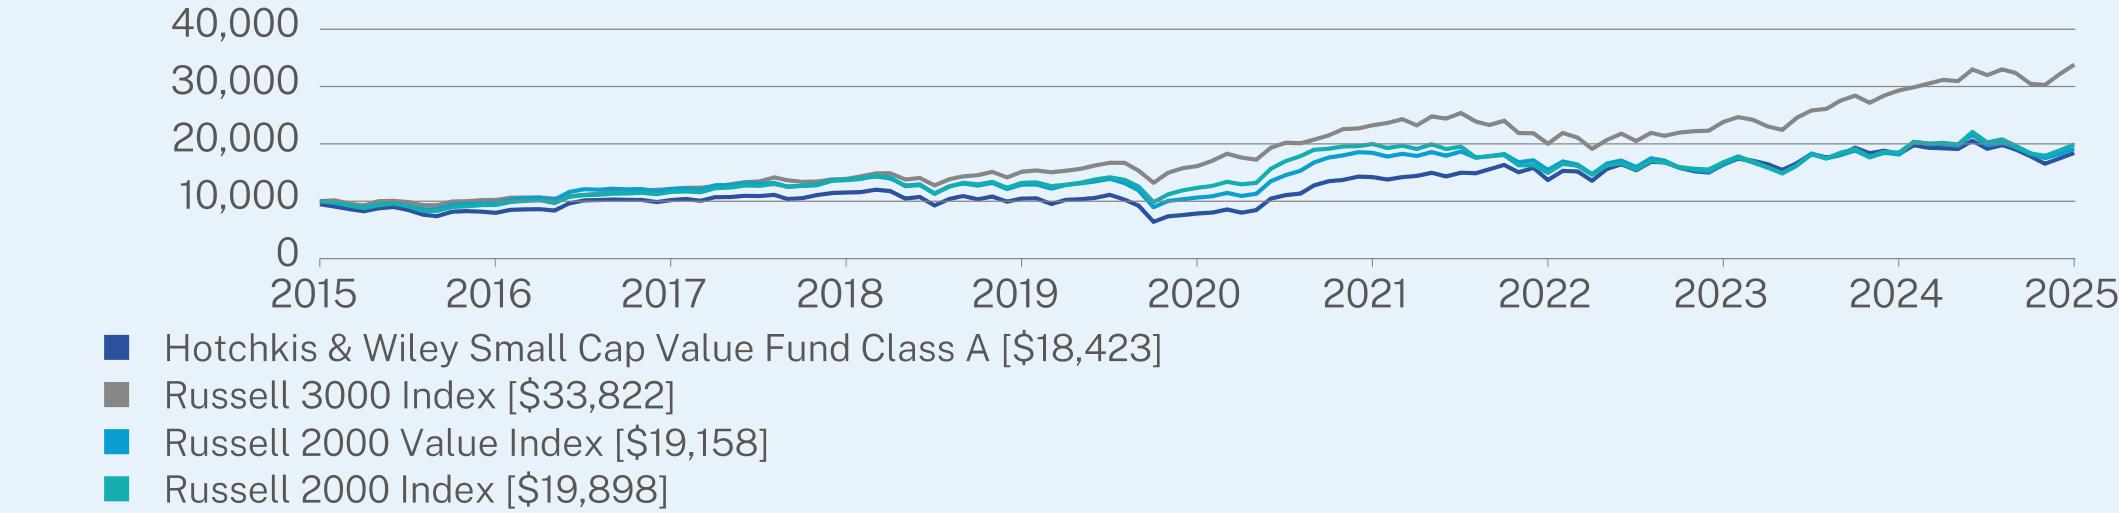
The Small Cap Value Fund returned 1.04% for Class A shares at net asset value (NAV) for the 12 months ended June 30, 2025. The Fund underperformed the Russell 3000 Index, which returned 15.30%.
TOP DETRACTORS FROM PERFORMANCE
• Stock selection and an overweight position in energy were the largest detractors from relative performance, followed by stock selection in communication services, consumer discretionary, and consumer staples. Stock selection in industrials was also a performance detractor.
TOP CONTRIBUTORS TO PERFORMANCE
• Stock selection in information technology, along with an underweight position in the health care sector and an overweight in financials, helped relative performance.
ANNUAL AVERAGE TOTAL RETURN (%)
|
|
1 Year
|
5 Year
|
10 Year
|
|
Class A (without sales charge)
|
1.04
|
18.56
|
6.87
|
|
Class A (with sales charge)
|
-4.26
|
17.29
|
6.30
|
|
Russell 3000 Index
|
15.30
|
15.96
|
12.96
|
|
Russell 2000 Value Index
|
5.54
|
12.47
|
6.72
|
|
Russell 2000 Index
|
7.68
|
10.04
|
7.12
|
Visit https://www.hwcm.com/mutual-funds/resources/literature/ for more recent performance information.
Visit https://www.hwcm.com/mutual-funds/resources/literature/ for more recent performance information.
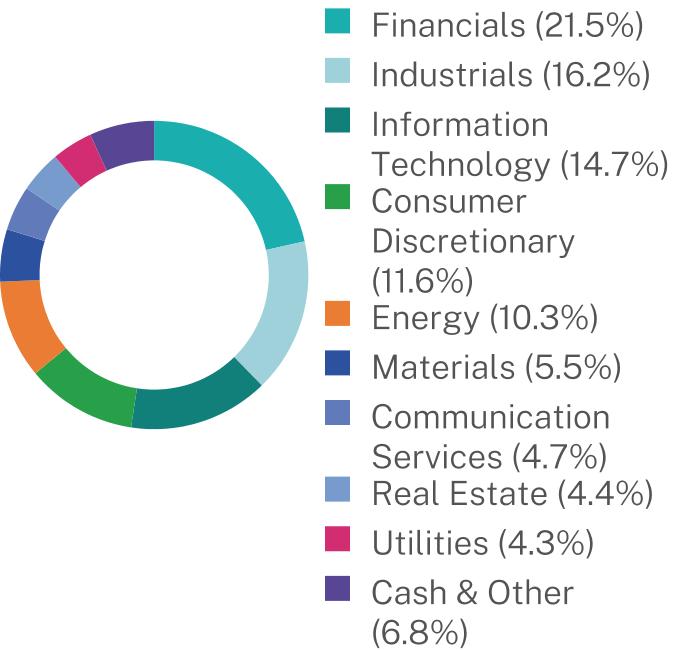
KEY FUND STATISTICS (as of June 30, 2025)
|
Net Assets
|
$743,590,211
|
|
Number of Holdings
|
69
|
|
Net Advisory Fee
|
$5,490,376
|
|
Portfolio Turnover
|
41%
|

|
Top Holdings
|
(%)
|
|
F5, Inc.
|
9.2%
|
|
NOV, Inc.
|
4.2%
|
|
Avnet, Inc.
|
4.0%
|
|
Jones Lang LaSalle, Inc.
|
3.8%
|
|
Stagwell, Inc.
|
3.8%
|
|
U-Haul Holding Co.
|
3.3%
|
|
First Hawaiian, Inc.
|
3.3%
|
|
Popular, Inc.
|
3.3%
|
|
Fluor Corp.
|
3.1%
|
|
Ecovyst, Inc.
|
3.1%
|
WHAT WERE THE FUND COSTS FOR THE PAST YEAR? (based on a hypothetical $10,000 investment)
|
Class Name
|
Costs of a $10,000 investment
|
Costs paid as a percentage of a $10,000 investment
|
|
Class C
|
$196
|
1.96%
|
HOW DID THE FUND PERFORM LAST YEAR? WHAT AFFECTED ITS PERFORMANCE?
PERFORMANCE HIGHLIGHTS
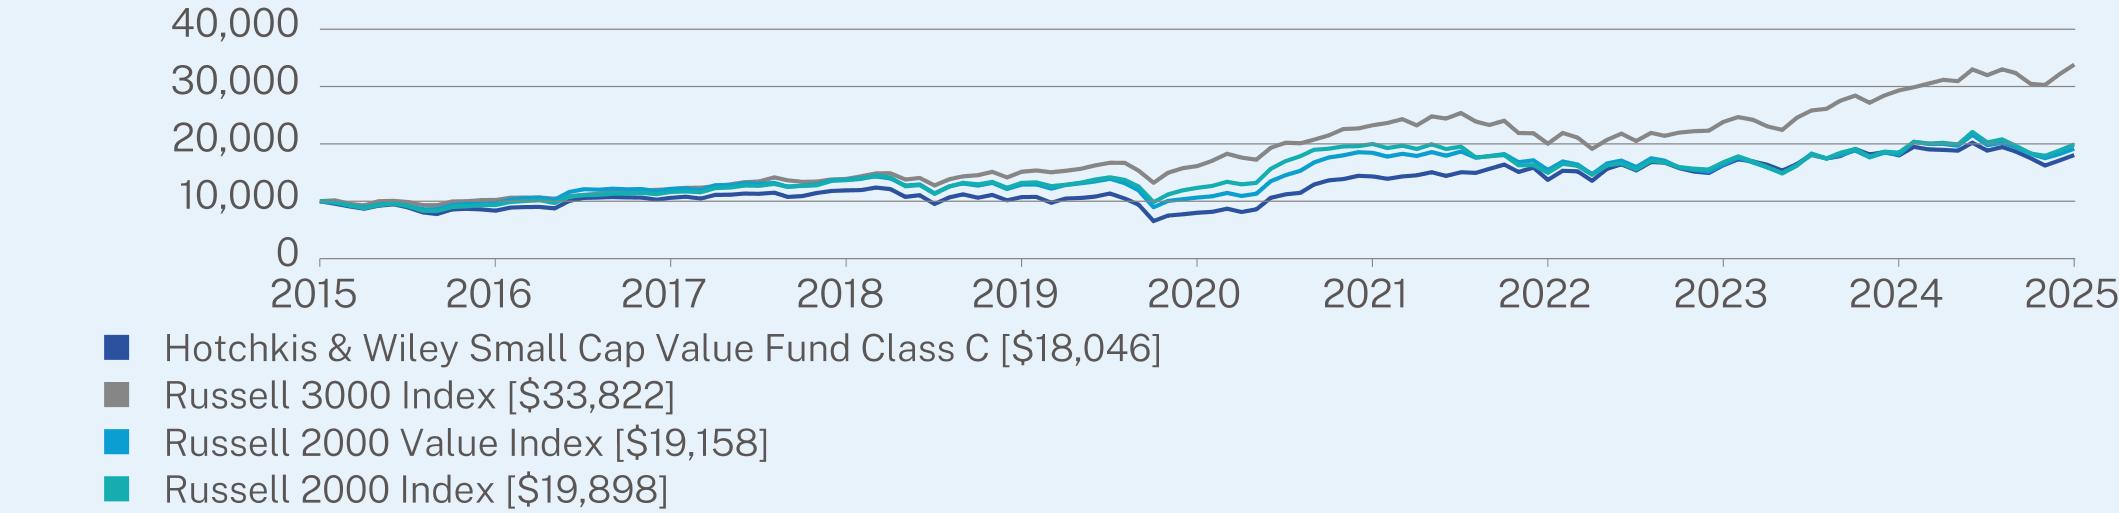
The Small Cap Value Fund returned 0.28% for Class C shares at net asset value (NAV) for the 12 months ended June 30, 2025. The Fund underperformed the Russell 3000 Index, which returned 15.30%.
TOP DETRACTORS FROM PERFORMANCE
• Stock selection and an overweight position in energy were the largest detractors from relative performance, followed by stock selection in communication services, consumer discretionary, and consumer staples. Stock selection in industrials was also a performance detractor.
TOP CONTRIBUTORS TO PERFORMANCE
• Stock selection in information technology, along with an underweight position in the health care sector and an overweight in financials, helped relative performance.
ANNUAL AVERAGE TOTAL RETURN (%)
|
|
1 Year
|
5 Year
|
10 Year
|
|
Class C (without sales charge)
|
0.28
|
17.68
|
6.08
|
|
Class C (with sales charge)
|
-0.63
|
17.68
|
6.08
|
|
Russell 3000 Index
|
15.30
|
15.96
|
12.96
|
|
Russell 2000 Value Index
|
5.54
|
12.47
|
6.72
|
|
Russell 2000 Index
|
7.68
|
10.04
|
7.12
|
Visit https://www.hwcm.com/mutual-funds/resources/literature/ for more recent performance information.
Visit https://www.hwcm.com/mutual-funds/resources/literature/ for more recent performance information.
KEY FUND STATISTICS (as of June 30, 2025)
|
Net Assets
|
$743,590,211
|
|
Number of Holdings
|
69
|
|
Net Advisory Fee
|
$5,490,376
|
|
Portfolio Turnover
|
41%
|
|
Top Holdings
|
(%)
|
|
F5, Inc.
|
9.2%
|
|
NOV, Inc.
|
4.2%
|
|
Avnet, Inc.
|
4.0%
|
|
Jones Lang LaSalle, Inc.
|
3.8%
|
|
Stagwell, Inc.
|
3.8%
|
|
U-Haul Holding Co.
|
3.3%
|
|
First Hawaiian, Inc.
|
3.3%
|
|
Popular, Inc.
|
3.3%
|
|
Fluor Corp.
|
3.1%
|
|
Ecovyst, Inc.
|
3.1%
|
WHAT WERE THE FUND COSTS FOR THE PAST YEAR? (based on a hypothetical $10,000 investment)
|
Class Name
|
Costs of a $10,000 investment
|
Costs paid as a percentage of a $10,000 investment
|
|
Class I
|
$100
|
0.99%
|
HOW DID THE FUND PERFORM LAST YEAR? WHAT AFFECTED ITS PERFORMANCE?
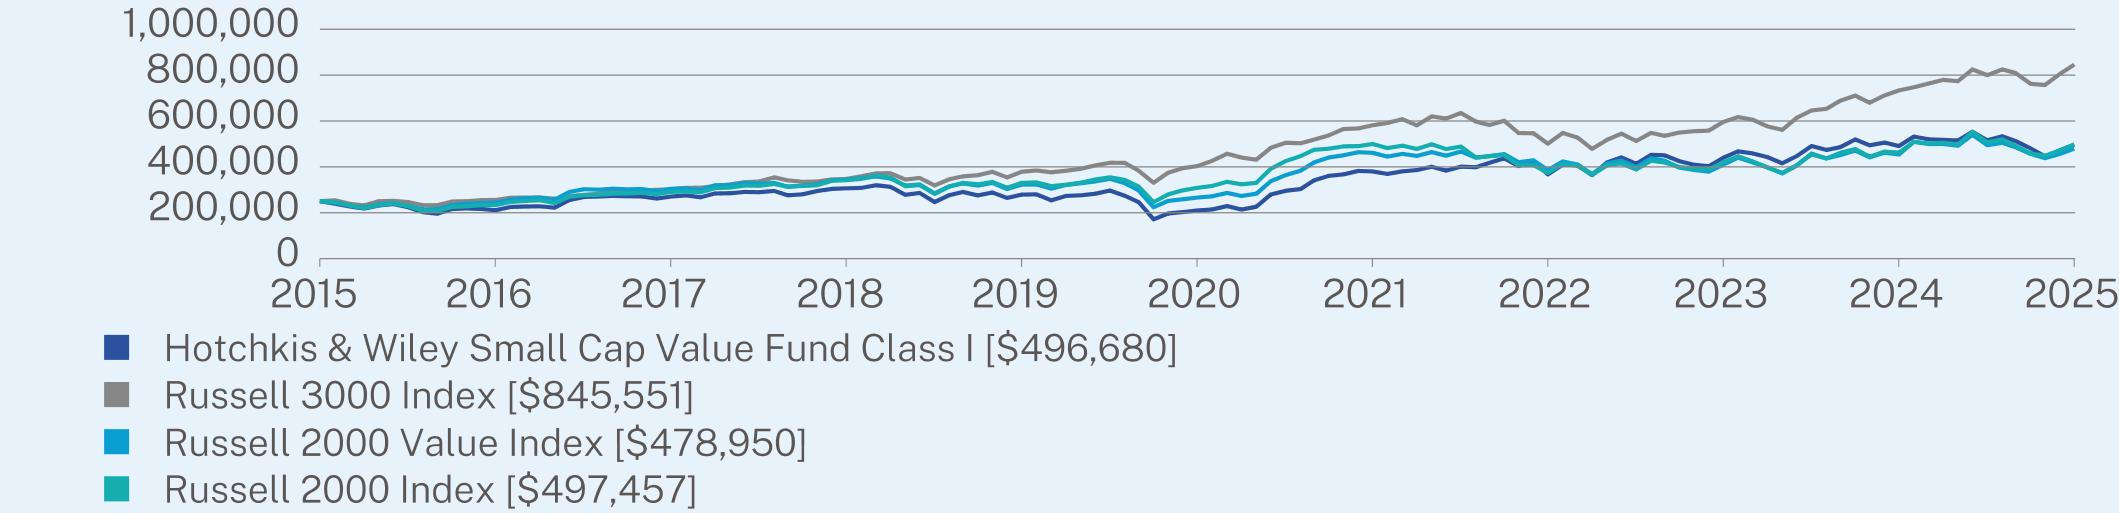
PERFORMANCE HIGHLIGHTS
The Small Cap Value Fund returned 1.25% for Class I shares at net asset value (NAV) for the 12 months ended June 30, 2025. The Fund underperformed the Russell 3000 Index, which returned 15.30%.
TOP DETRACTORS FROM PERFORMANCE
• Stock selection and an overweight position in energy were the largest detractors from relative performance, followed by stock selection in communication services, consumer discretionary, and consumer staples. Stock selection in industrials was also a performance detractor.
TOP CONTRIBUTORS TO PERFORMANCE
• Stock selection in information technology, along with an underweight position in the health care sector and an overweight in financials, helped relative performance.
ANNUAL AVERAGE TOTAL RETURN (%)
|
|
1 Year
|
5 Year
|
10 Year
|
|
Class I
|
1.25
|
18.79
|
7.11
|
|
Russell 3000 Index
|
15.30
|
15.96
|
12.96
|
|
Russell 2000 Value Index
|
5.54
|
12.47
|
6.72
|
|
Russell 2000 Index
|
7.68
|
10.04
|
7.12
|
Visit https://www.hwcm.com/mutual-funds/resources/literature/ for more recent performance information.
Visit https://www.hwcm.com/mutual-funds/resources/literature/ for more recent performance information.
KEY FUND STATISTICS (as of June 30, 2025)
|
Net Assets
|
$743,590,211
|
|
Number of Holdings
|
69
|
|
Net Advisory Fee
|
$5,490,376
|
|
Portfolio Turnover
|
41%
|

|
Top Holdings
|
(%)
|
|
F5, Inc.
|
9.2%
|
|
NOV, Inc.
|
4.2%
|
|
Avnet, Inc.
|
4.0%
|
|
Jones Lang LaSalle, Inc.
|
3.8%
|
|
Stagwell, Inc.
|
3.8%
|
|
U-Haul Holding Co.
|
3.3%
|
|
First Hawaiian, Inc.
|
3.3%
|
|
Popular, Inc.
|
3.3%
|
|
Fluor Corp.
|
3.1%
|
|
Ecovyst, Inc.
|
3.1%
|
WHAT WERE THE FUND COSTS FOR THE PAST YEAR? (based on a hypothetical $10,000 investment)
|
Class Name
|
Costs of a $10,000 investment
|
Costs paid as a percentage of a $10,000 investment
|
|
Class Z
|
$90
|
0.89%
|
HOW DID THE FUND PERFORM LAST YEAR? WHAT AFFECTED ITS PERFORMANCE?
PERFORMANCE HIGHLIGHTS
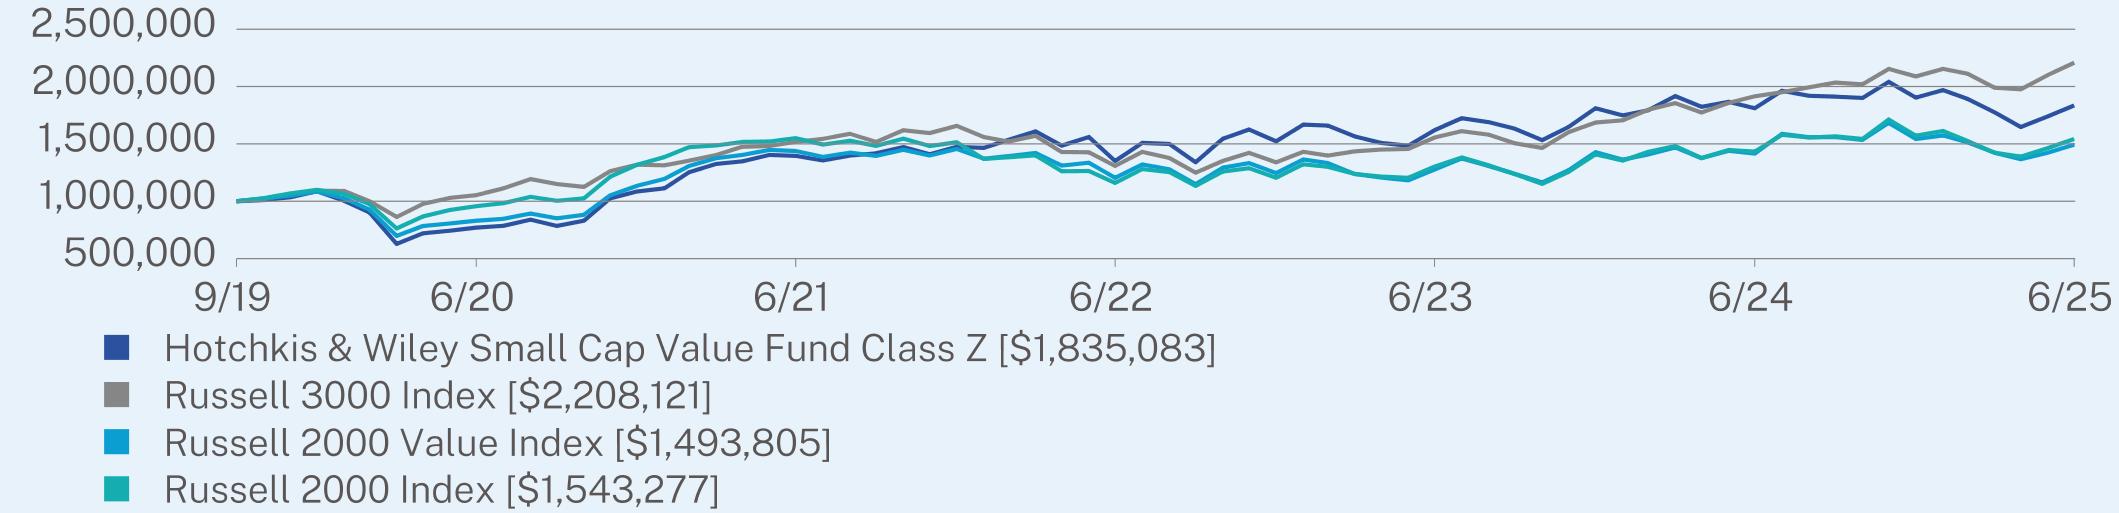
The Small Cap Value Fund returned 1.35% for Class Z shares at net asset value (NAV) for the 12 months ended June 30, 2025. The Fund underperformed the Russell 3000 Index, which returned 15.30%.
TOP DETRACTORS FROM PERFORMANCE
• Stock selection and an overweight position in energy were the largest detractors from relative performance, followed by stock selection in communication services, consumer discretionary, and consumer staples. Stock selection in industrials was also a performance detractor.
TOP CONTRIBUTORS TO PERFORMANCE
• Stock selection in information technology, along with an underweight position in the health care sector and an overweight in financials, helped relative performance.
ANNUAL AVERAGE TOTAL RETURN (%)
|
|
1 Year
|
5 Year
|
Since Inception
(09/30/2019) |
|
Class Z
|
1.35
|
18.97
|
11.13
|
|
Russell 3000 Index
|
15.30
|
15.96
|
14.77
|
|
Russell 2000 Value Index
|
5.54
|
12.47
|
7.23
|
|
Russell 2000 Index
|
7.68
|
10.04
|
7.84
|
Visit https://www.hwcm.com/mutual-funds/resources/literature/ for more recent performance information.
Visit https://www.hwcm.com/mutual-funds/resources/literature/ for more recent performance information.
KEY FUND STATISTICS (as of June 30, 2025)
|
Net Assets
|
$743,590,211
|
|
Number of Holdings
|
69
|
|
Net Advisory Fee
|
$5,490,376
|
|
Portfolio Turnover
|
41%
|

|
Top Holdings
|
(%)
|
|
F5, Inc.
|
9.2%
|
|
NOV, Inc.
|
4.2%
|
|
Avnet, Inc.
|
4.0%
|
|
Jones Lang LaSalle, Inc.
|
3.8%
|
|
Stagwell, Inc.
|
3.8%
|
|
U-Haul Holding Co.
|
3.3%
|
|
First Hawaiian, Inc.
|
3.3%
|
|
Popular, Inc.
|
3.3%
|
|
Fluor Corp.
|
3.1%
|
|
Ecovyst, Inc.
|
3.1%
|
WHAT WERE THE FUND COSTS FOR THE PAST YEAR? (based on a hypothetical $10,000 investment)
|
Class Name
|
Costs of a $10,000 investment
|
Costs paid as a percentage of a $10,000 investment
|
|
Class A
|
$106
|
1.06%
|
HOW DID THE FUND PERFORM LAST YEAR? WHAT AFFECTED ITS PERFORMANCE?
PERFORMANCE HIGHLIGHTS
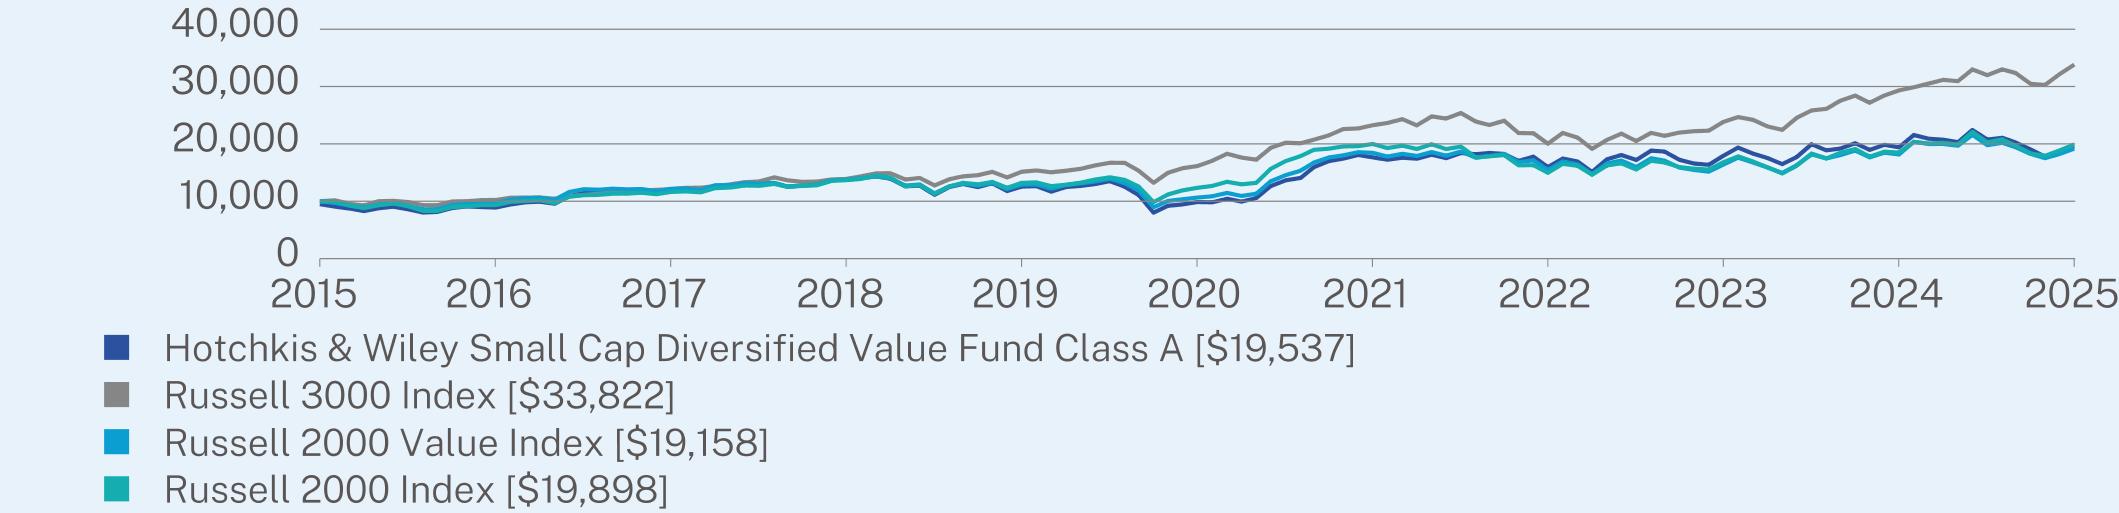
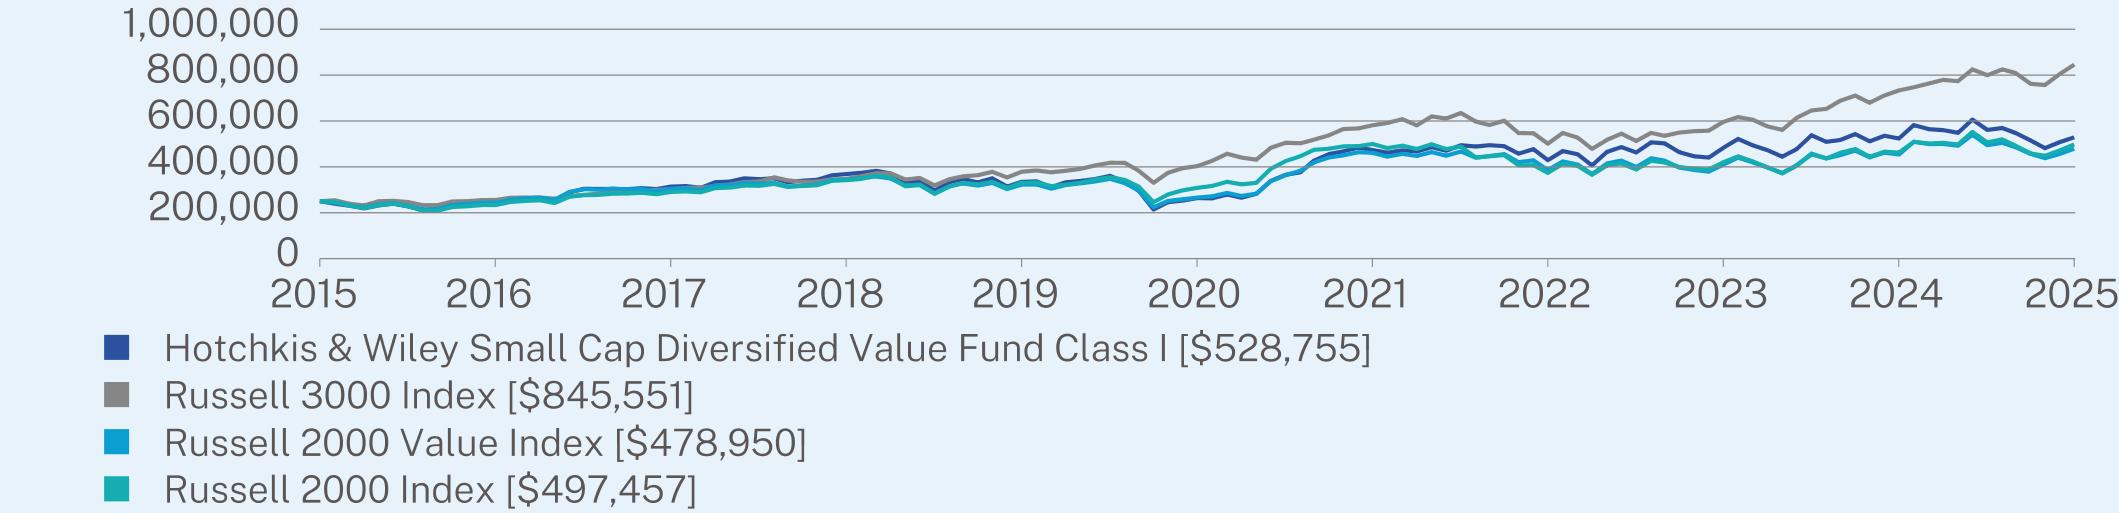
The Small Cap Diversified Value Fund returned 0.75% for Class A shares at net asset value (NAV) for the 12 months ended June 30, 2025. The Fund underperformed the Russell 3000 Index, which returned 15.30%.
TOP DETRACTORS FROM PERFORMANCE
• Stock selection in consumer discretionary, industrials, and financials were the primary detractors from relative performance, followed by stock selection and an overweight in energy. Stock selection in consumer staples, information technology, and communication services also detracted from performance.
TOP CONTRIBUTORS TO PERFORMANCE
• An overweight in financials and an underweight position in the health care sector helped relative performance.
ANNUAL AVERAGE TOTAL RETURN (%)
|
|
1 Year
|
5 Year
|
10 Year
|
|
Class A (without sales charge)
|
0.75
|
14.66
|
7.50
|
|
Class A (with sales charge)
|
-4.55
|
13.44
|
6.93
|
|
Russell 3000 Index
|
15.30
|
15.96
|
12.96
|
|
Russell 2000 Value Index
|
5.54
|
12.47
|
6.72
|
|
Russell 2000 Index
|
7.68
|
10.04
|
7.12
|
Visit https://www.hwcm.com/mutual-funds/resources/literature/ for more recent performance information.
Visit https://www.hwcm.com/mutual-funds/resources/literature/ for more recent performance information.
KEY FUND STATISTICS (as of June 30, 2025)
|
Net Assets
|
$730,982,432
|
|
Number of Holdings
|
353
|
|
Net Advisory Fee
|
$4,934,657
|
|
Portfolio Turnover
|
60%
|

|
Top Holdings
|
(%)
|
|
Par Pacific Holdings, Inc.
|
0.6%
|
|
Fluor Corp.
|
0.6%
|
|
Ecovyst, Inc.
|
0.5%
|
|
ScanSource, Inc.
|
0.5%
|
|
Cushman & Wakefield PLC
|
0.5%
|
|
Sonic Automotive, Inc. - Class A
|
0.5%
|
|
NEXTracker, Inc. - Class A
|
0.5%
|
|
Hilton Grand Vacations, Inc.
|
0.5%
|
|
WEX, Inc.
|
0.5%
|
|
NMI Holdings, Inc. - Class A
|
0.5%
|
WHAT WERE THE FUND COSTS FOR THE PAST YEAR? (based on a hypothetical $10,000 investment)
|
Class Name
|
Costs of a $10,000 investment
|
Costs paid as a percentage of a $10,000 investment
|
|
Class I
|
$81
|
0.81%
|
HOW DID THE FUND PERFORM LAST YEAR? WHAT AFFECTED ITS PERFORMANCE?
PERFORMANCE HIGHLIGHTS
The Small Cap Diversified Value Fund returned 1.01% for Class I shares at net asset value (NAV) for the 12 months ended June 30, 2025. The Fund underperformed the Russell 3000 Index, which returned 15.30%.
TOP DETRACTORS FROM PERFORMANCE
• Stock selection in consumer discretionary, industrials, and financials were the primary detractors from relative performance, followed by stock selection and an overweight in energy. Stock selection in consumer staples, information technology, and communication services also detracted from performance.
TOP CONTRIBUTORS TO PERFORMANCE
• An overweight in financials and an underweight position in the health care sector helped relative performance.
ANNUAL AVERAGE TOTAL RETURN (%)
|
|
1 Year
|
5 Year
|
10 Year
|
|
Class I
|
1.01
|
14.91
|
7.78
|
|
Russell 3000 Index
|
15.30
|
15.96
|
12.96
|
|
Russell 2000 Value Index
|
5.54
|
12.47
|
6.72
|
|
Russell 2000 Index
|
7.68
|
10.04
|
7.12
|
Visit https://www.hwcm.com/mutual-funds/resources/literature/ for more recent performance information.
Visit https://www.hwcm.com/mutual-funds/resources/literature/ for more recent performance information.
KEY FUND STATISTICS (as of June 30, 2025)
|
Net Assets
|
$730,982,432
|
|
Number of Holdings
|
353
|
|
Net Advisory Fee
|
$4,934,657
|
|
Portfolio Turnover
|
60%
|
|
Top Holdings
|
(%)
|
|
Par Pacific Holdings, Inc.
|
0.6%
|
|
Fluor Corp.
|
0.6%
|
|
Ecovyst, Inc.
|
0.5%
|
|
ScanSource, Inc.
|
0.5%
|
|
Cushman & Wakefield PLC
|
0.5%
|
|
Sonic Automotive, Inc. - Class A
|
0.5%
|
|
NEXTracker, Inc. - Class A
|
0.5%
|
|
Hilton Grand Vacations, Inc.
|
0.5%
|
|
WEX, Inc.
|
0.5%
|
|
NMI Holdings, Inc. - Class A
|
0.5%
|
WHAT WERE THE FUND COSTS FOR THE PAST YEAR? (based on a hypothetical $10,000 investment)
|
Class Name
|
Costs of a $10,000 investment
|
Costs paid as a percentage of a $10,000 investment
|
|
Class Z
|
$78
|
0.78%
|
HOW DID THE FUND PERFORM LAST YEAR? WHAT AFFECTED ITS PERFORMANCE?
PERFORMANCE HIGHLIGHTS
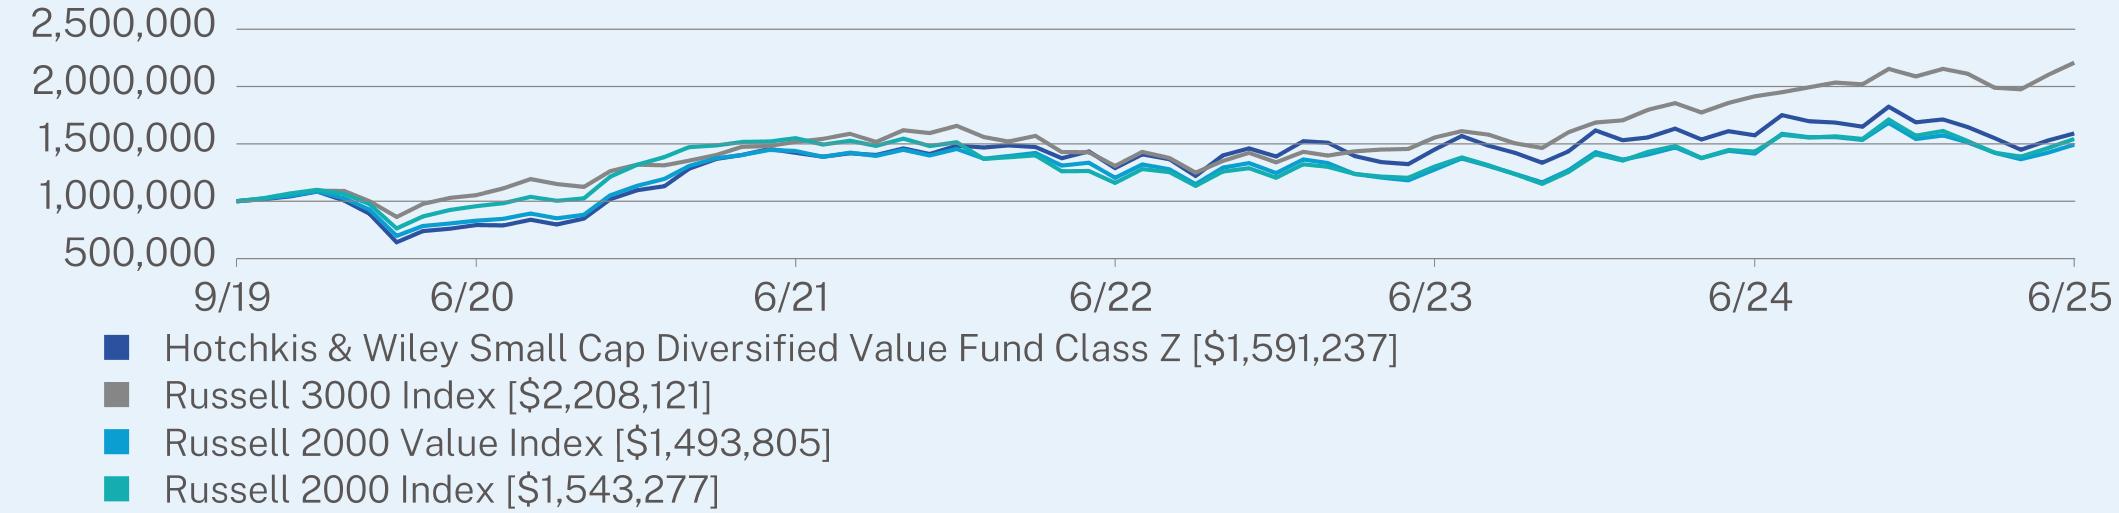
The Small Cap Diversified Value Fund returned 1.06% for Class Z shares at net asset value (NAV) for the 12 months ended June 30, 2025. The Fund underperformed the Russell 3000 Index, which returned 15.30%.
TOP DETRACTORS FROM PERFORMANCE
• Stock selection in consumer discretionary, industrials, and financials were the primary detractors from relative performance, followed by stock selection and an overweight in energy. Stock selection in consumer staples, information technology, and communication services also detracted from performance.
TOP CONTRIBUTORS TO PERFORMANCE
• An overweight in financials and an underweight position in the health care sector helped relative performance.
ANNUAL AVERAGE TOTAL RETURN (%)
|
|
1 Year
|
5 Year
|
Since Inception
(09/30/2019) |
|
Class Z
|
1.06
|
14.96
|
8.41
|
|
Russell 3000 Index
|
15.30
|
15.96
|
14.77
|
|
Russell 2000 Value Index
|
5.54
|
12.47
|
7.23
|
|
Russell 2000 Index
|
7.68
|
10.04
|
7.84
|
Visit https://www.hwcm.com/mutual-funds/resources/literature/ for more recent performance information.
Visit https://www.hwcm.com/mutual-funds/resources/literature/ for more recent performance information.
KEY FUND STATISTICS (as of June 30, 2025)
|
Net Assets
|
$730,982,432
|
|
Number of Holdings
|
353
|
|
Net Advisory Fee
|
$4,934,657
|
|
Portfolio Turnover
|
60%
|

|
Top Holdings
|
(%)
|
|
Par Pacific Holdings, Inc.
|
0.6%
|
|
Fluor Corp.
|
0.6%
|
|
Ecovyst, Inc.
|
0.5%
|
|
ScanSource, Inc.
|
0.5%
|
|
Cushman & Wakefield PLC
|
0.5%
|
|
Sonic Automotive, Inc. - Class A
|
0.5%
|
|
NEXTracker, Inc. - Class A
|
0.5%
|
|
Hilton Grand Vacations, Inc.
|
0.5%
|
|
WEX, Inc.
|
0.5%
|
|
NMI Holdings, Inc. - Class A
|
0.5%
|
WHAT WERE THE FUND COSTS FOR THE PAST YEAR? (based on a hypothetical $10,000 investment)
|
Class Name
|
Costs of a $10,000 investment
|
Costs paid as a percentage of a $10,000 investment
|
|
Class A
|
$129
|
1.20%
|
HOW DID THE FUND PERFORM LAST YEAR? WHAT AFFECTED ITS PERFORMANCE?
PERFORMANCE HIGHLIGHTS
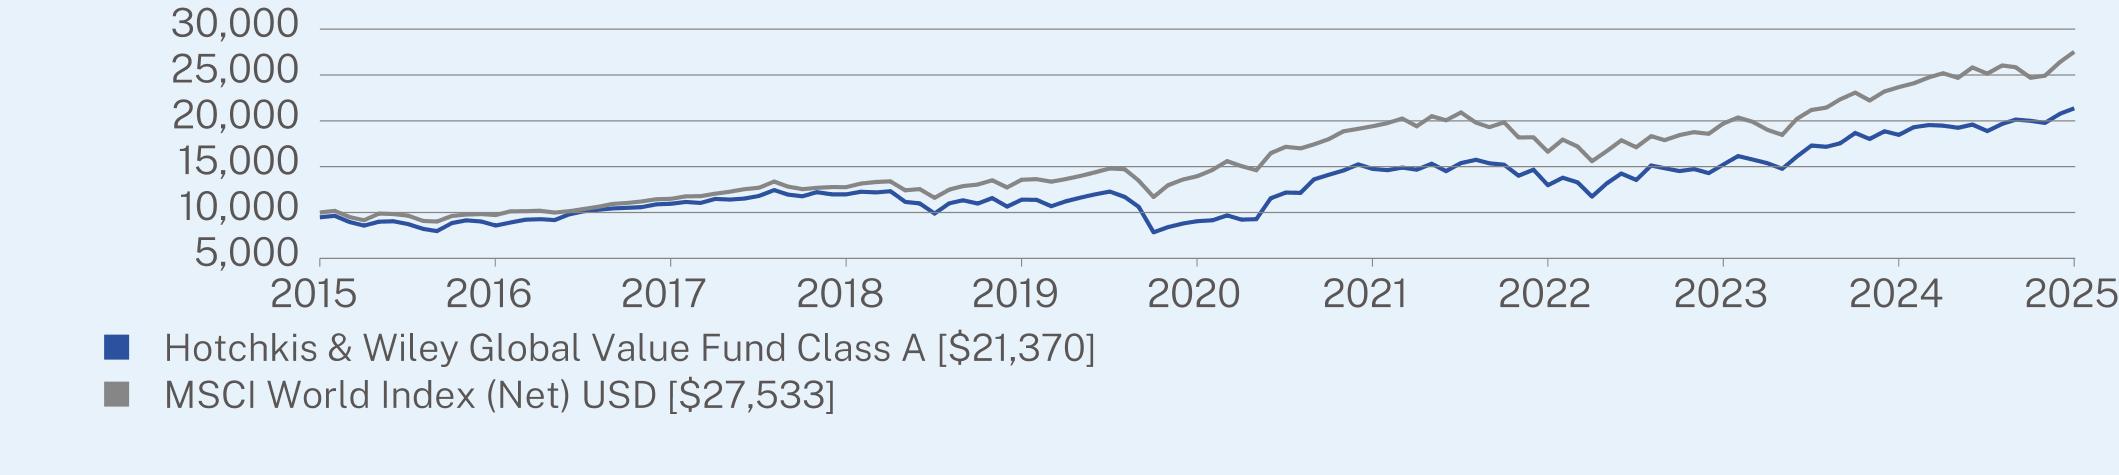
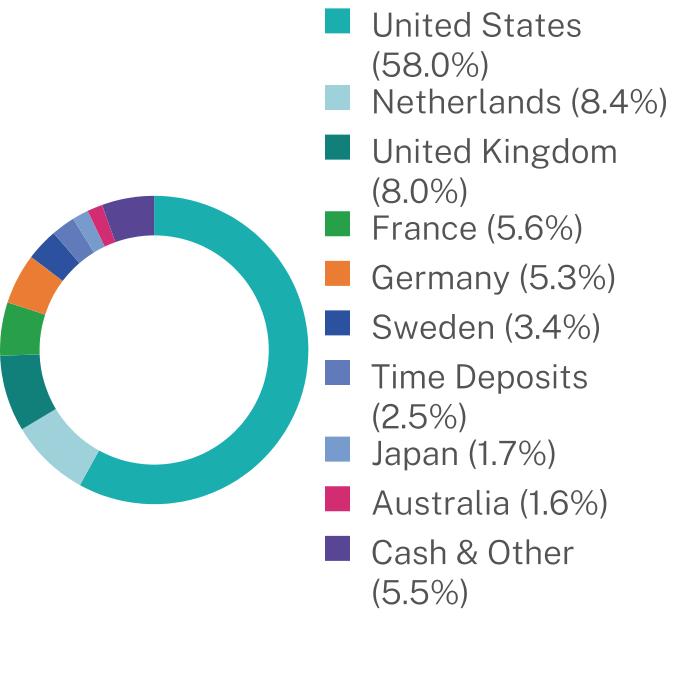
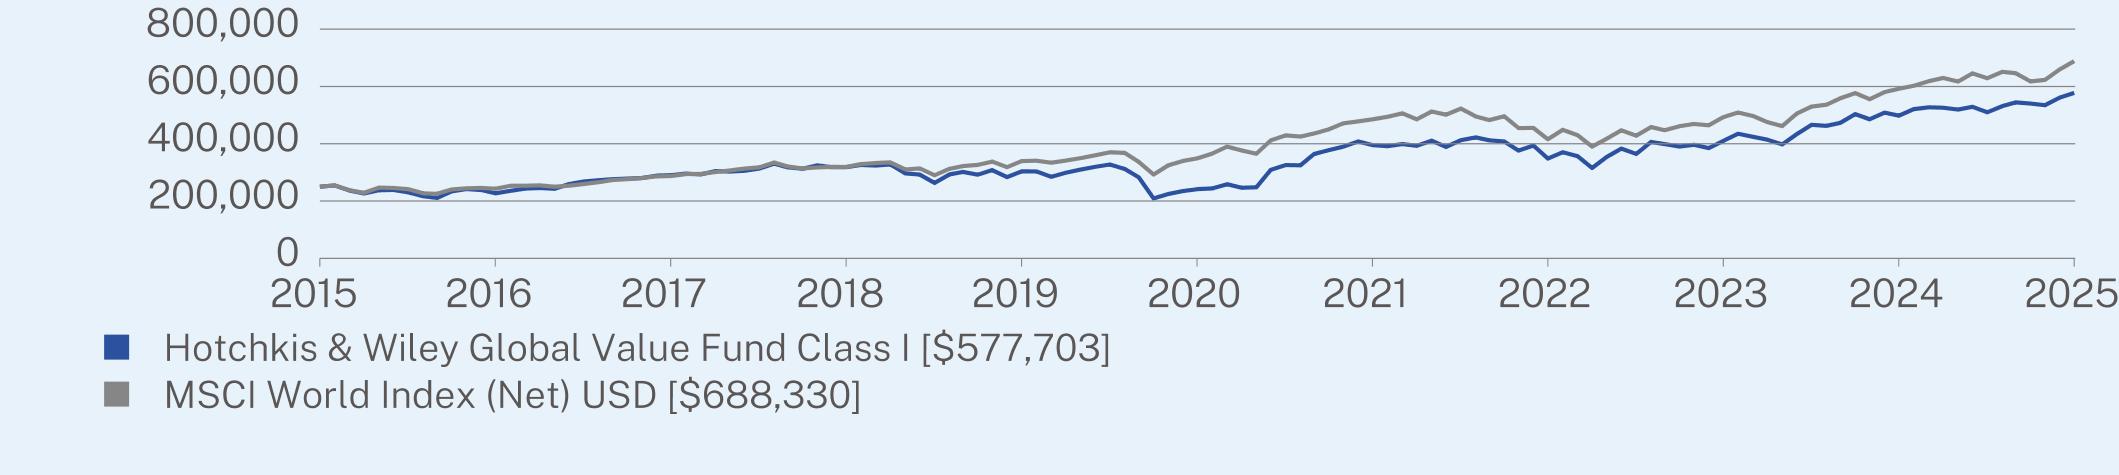
The Global Value Fund returned 15.70% for Class A shares at net asset value (NAV) for the 12 months ended June 30, 2025. The Fund underperformed the MSCI World Index, which returned 16.26%.
TOP DETRACTORS FROM PERFORMANCE
• Stock selection in communication services and energy was the primary detractor to relative performance. An overweight position in energy also detracted from performance.
TOP CONTRIBUTORS TO PERFORMANCE
• Stock selection in information technology and industrials were the primary contributors to relative performance, followed by stock selection in materials.
ANNUAL AVERAGE TOTAL RETURN (%)
|
|
1 Year
|
5 Year
|
10 Year
|
|
Class A (without sales charge)
|
15.70
|
18.74
|
8.47
|
|
Class A (with sales charge)
|
9.66
|
17.46
|
7.89
|
|
MSCI World Index (Net) USD
|
16.26
|
14.55
|
10.66
|
Visit https://www.hwcm.com/mutual-funds/resources/literature/ for more recent performance information.
Visit https://www.hwcm.com/mutual-funds/resources/literature/ for more recent performance information.
KEY FUND STATISTICS (as of June 30, 2025)
|
Net Assets
|
$39,828,890
|
|
Number of Holdings
|
69
|
|
Net Advisory Fee
|
$165,187
|
|
Portfolio Turnover
|
51%
|
|
Top Holdings
|
(%)
|
|
F5, Inc.
|
5.0%
|
|
Workday, Inc. - Class A
|
4.4%
|
|
Telefonaktiebolaget LM Ericsson
|
3.4%
|
|
Dominion Energy, Inc.
|
2.6%
|
|
Comcast Corp. - Class A
|
2.5%
|
|
GE HealthCare Technologies, Inc.
|
2.5%
|
|
Elevance Health, Inc.
|
2.4%
|
|
General Motors Co.
|
2.4%
|
|
American International Group, Inc.
|
2.3%
|
|
Heineken Holding NV
|
2.3%
|
WHAT WERE THE FUND COSTS FOR THE PAST YEAR? (based on a hypothetical $10,000 investment)
|
Class Name
|
Costs of a $10,000 investment
|
Costs paid as a percentage of a $10,000 investment
|
|
Class I
|
$103
|
0.95%
|
HOW DID THE FUND PERFORM LAST YEAR? WHAT AFFECTED ITS PERFORMANCE?
PERFORMANCE HIGHLIGHTS
The Global Value Fund returned 16.00% for Class I shares at net asset value (NAV) for the 12 months ended June 30, 2025. The Fund underperformed the MSCI World Index, which returned 16.26%.
TOP DETRACTORS FROM PERFORMANCE
• Stock selection in communication services and energy was the primary detractor to relative performance. An overweight position in energy also detracted from performance.
TOP CONTRIBUTORS TO PERFORMANCE
• Stock selection in information technology and industrials were the primary contributors to relative performance, followed by stock selection in materials.
ANNUAL AVERAGE TOTAL RETURN (%)
|
|
1 Year
|
5 Year
|
10 Year
|
|
Class I
|
16.00
|
19.05
|
8.74
|
|
MSCI World Index (Net) USD
|
16.26
|
14.55
|
10.66
|
Visit https://www.hwcm.com/mutual-funds/resources/literature/ for more recent performance information.
Visit https://www.hwcm.com/mutual-funds/resources/literature/ for more recent performance information.
KEY FUND STATISTICS (as of June 30, 2025)
|
Net Assets
|
$39,828,890
|
|
Number of Holdings
|
69
|
|
Net Advisory Fee
|
$165,187
|
|
Portfolio Turnover
|
51%
|

|
Top Holdings
|
(%)
|
|
F5, Inc.
|
5.0%
|
|
Workday, Inc. - Class A
|
4.4%
|
|
Telefonaktiebolaget LM Ericsson
|
3.4%
|
|
Dominion Energy, Inc.
|
2.6%
|
|
Comcast Corp. - Class A
|
2.5%
|
|
GE HealthCare Technologies, Inc.
|
2.5%
|
|
Elevance Health, Inc.
|
2.4%
|
|
General Motors Co.
|
2.4%
|
|
American International Group, Inc.
|
2.3%
|
|
Heineken Holding NV
|
2.3%
|
WHAT WERE THE FUND COSTS FOR THE PAST YEAR? (based on a hypothetical $10,000 investment)
|
Class Name
|
Costs of a $10,000 investment
|
Costs paid as a percentage of a $10,000 investment
|
|
Class I
|
$108
|
0.95%
|
HOW DID THE FUND PERFORM LAST YEAR? WHAT AFFECTED ITS PERFORMANCE?
PERFORMANCE HIGHLIGHTS
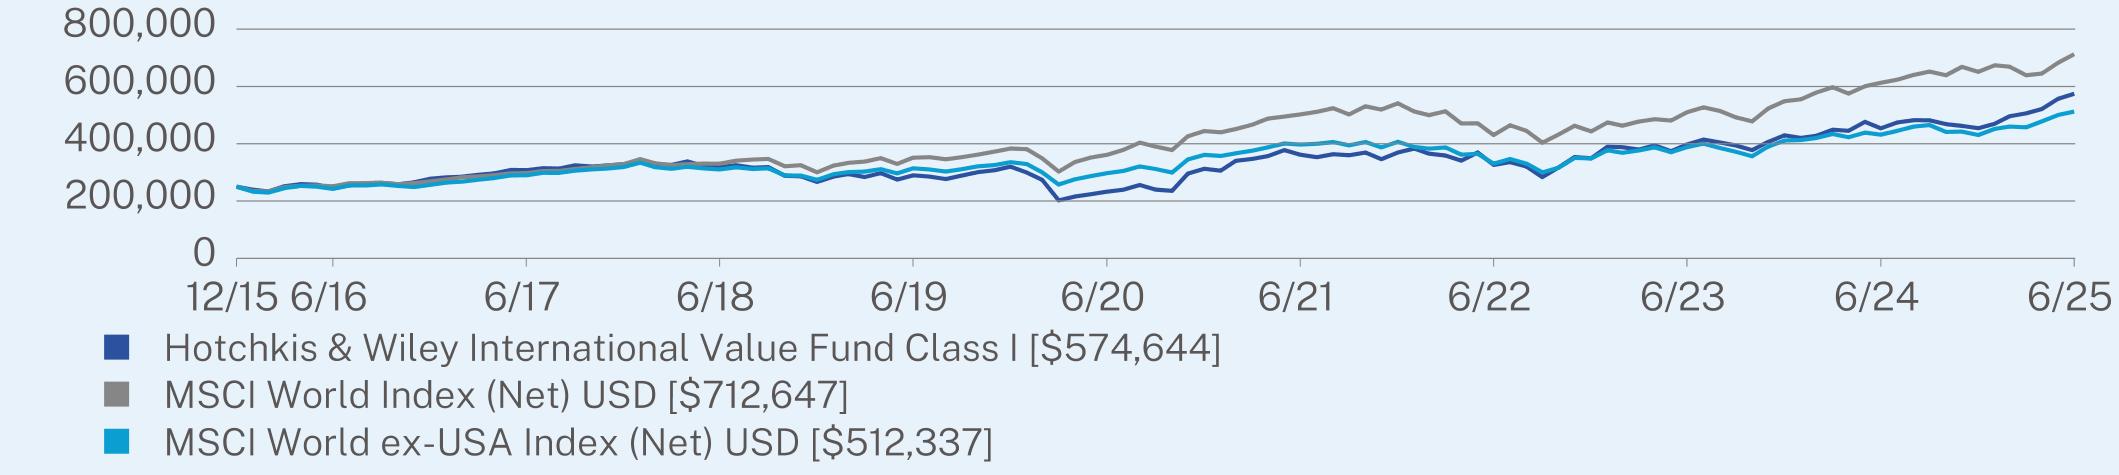
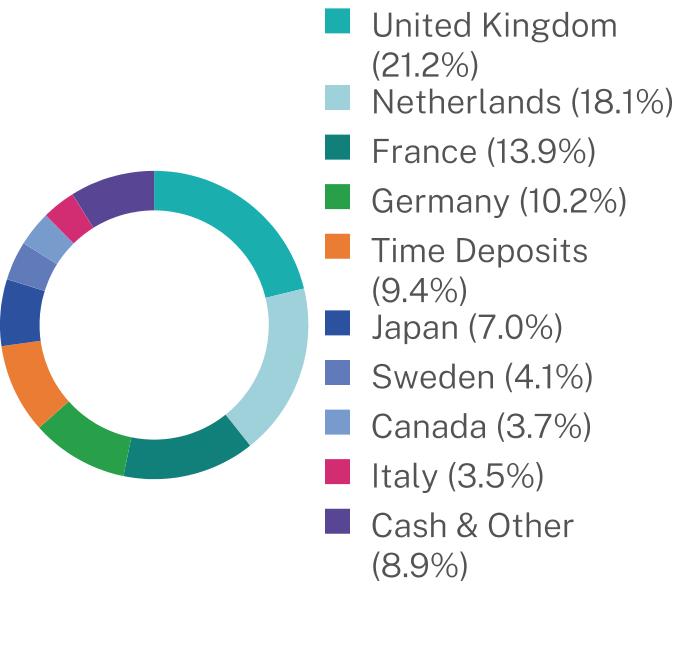
The International Value Fund returned 26.60% for Class I shares at net asset value (NAV) for the 12 months ended June 30, 2025. The Fund outperformed the MSCI World Index, which returned 16.26%.
TOP CONTRIBUTORS TO PERFORMANCE
• Stock selection in industrials and financials, along with an overweight in financials were the primary contributors to relative performance. Stock selection in consumer discretionary and an underweight position in health care also contributed to relative performance.
TOP DETRACTORS FROM PERFORMANCE
• Stock selection and an overweight in energy were the largest relative detractors to performance, followed by stock selection in communication services and information technology.
ANNUAL AVERAGE TOTAL RETURN (%)
|
|
1 Year
|
5 Year
|
Since Inception
(12/31/2015) |
|
Class I
|
26.60
|
19.81
|
9.16
|
|
MSCI World Index (Net) USD
|
16.26
|
14.55
|
11.66
|
|
MSCI World ex-USA Index (Net) USD
|
18.70
|
11.51
|
7.85
|
Visit https://www.hwcm.com/mutual-funds/resources/literature/ for more recent performance information.
Visit https://www.hwcm.com/mutual-funds/resources/literature/ for more recent performance information.
KEY FUND STATISTICS (as of June 30, 2025)
|
Net Assets
|
$4,795,621
|
|
Number of Holdings
|
56
|
|
Net Advisory Fee
|
$0
|
|
Portfolio Turnover
|
35%
|
|
Top Holdings
|
(%)
|
|
Siemens AG
|
4.6%
|
|
Telefonaktiebolaget LM Ericsson - Class B
|
4.1%
|
|
Henkel AG & Co. KGaA
|
3.9%
|
|
Heineken Holding NV
|
3.5%
|
|
Akzo Nobel NV
|
3.4%
|
|
Shell PLC
|
3.2%
|
|
Lloyds Banking Group PLC
|
2.9%
|
|
TotalEnergies SE
|
2.8%
|
|
BNP Paribas SA
|
2.8%
|
|
Societe Generale SA
|
2.7%
|
WHAT WERE THE FUND COSTS FOR THE PAST YEAR? (based on a hypothetical $10,000 investment)
|
Class Name
|
Costs of a $10,000 investment
|
Costs paid as a percentage of a $10,000 investment
|
|
Class I
|
$110
|
1.00%
|
HOW DID THE FUND PERFORM LAST YEAR? WHAT AFFECTED ITS PERFORMANCE?
PERFORMANCE HIGHLIGHTS
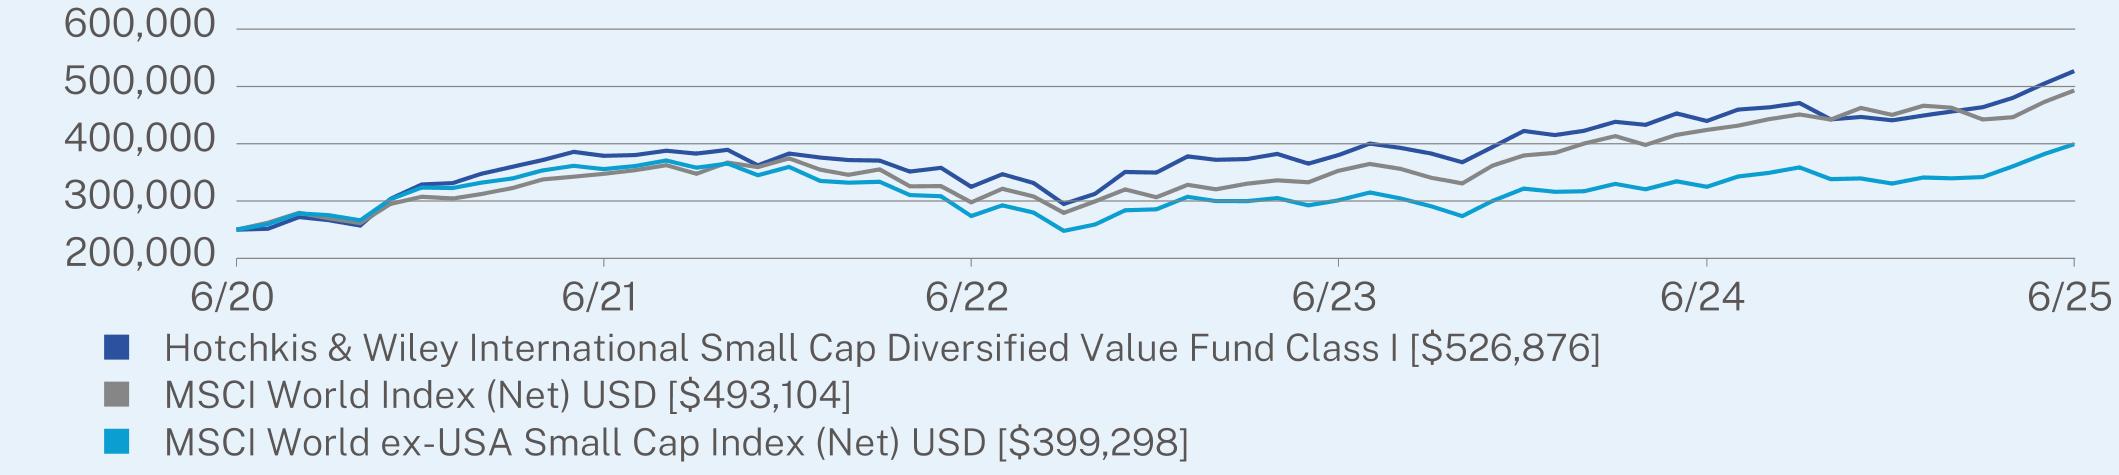
The International Small Cap Diversified Value Fund returned 19.82% for Class I shares at net asset value (NAV) for the 12 months ended June 30, 2025. The Fund outperformed the MSCI World Index, which returned 16.26%.
TOP CONTRIBUTORS TO PERFORMANCE
• Stock selection and an underweight position in health care, along with an overweight in financials were the largest contributors to relative performance. Stock selection in consumer staples was also a positive contributor.
TOP DETRACTORS FROM PERFORMANCE
• Stock selection in industrials and consumer discretionary and an underweight position in
communication services were the main detractors to relative performance. An overweight in energy also negatively impacted returns.
communication services were the main detractors to relative performance. An overweight in energy also negatively impacted returns.
ANNUAL AVERAGE TOTAL RETURN (%)
|
|
1 Year
|
5 Year
|
Since Inception
(06/30/2020) |
|
Class I
|
19.82
|
16.08
|
16.08
|
|
MSCI World Index (Net) USD
|
16.26
|
14.55
|
14.55
|
|
MSCI World ex-USA Small Cap Index (Net) USD
|
22.92
|
9.82
|
9.82
|
Visit https://www.hwcm.com/mutual-funds/resources/literature/ for more recent performance information.
Visit https://www.hwcm.com/mutual-funds/resources/literature/ for more recent performance information.
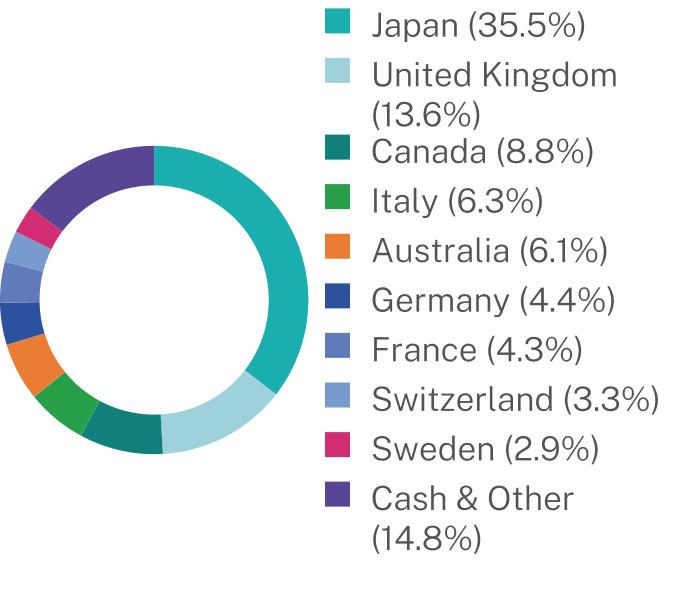
KEY FUND STATISTICS (as of June 30, 2025)
|
Net Assets
|
$4,665,436
|
|
Number of Holdings
|
299
|
|
Net Advisory Fee
|
$0
|
|
Portfolio Turnover
|
63%
|
|
Top Holdings
|
(%)
|
|
Shibaura Mechatronics Corp.
|
0.6%
|
|
Sesa SpA
|
0.6%
|
|
SUSS MicroTec SE
|
0.6%
|
|
Fuso Chemical Co. Ltd.
|
0.6%
|
|
Riken Vitamin Co. Ltd.
|
0.6%
|
|
GRENKE AG
|
0.6%
|
|
RS Technologies Co. Ltd.
|
0.6%
|
|
Tocalo Co. Ltd.
|
0.6%
|
|
Tazmo Co. Ltd.
|
0.6%
|
|
Hyakujushi Bank Ltd.
|
0.6%
|
WHAT WERE THE FUND COSTS FOR THE PAST YEAR? (based on a hypothetical $10,000 investment)
|
Class Name
|
Costs of a $10,000 investment
|
Costs paid as a percentage of a $10,000 investment
|
|
Class A
|
$128
|
1.20%
|
HOW DID THE FUND PERFORM LAST YEAR? WHAT AFFECTED ITS PERFORMANCE?
PERFORMANCE HIGHLIGHTS
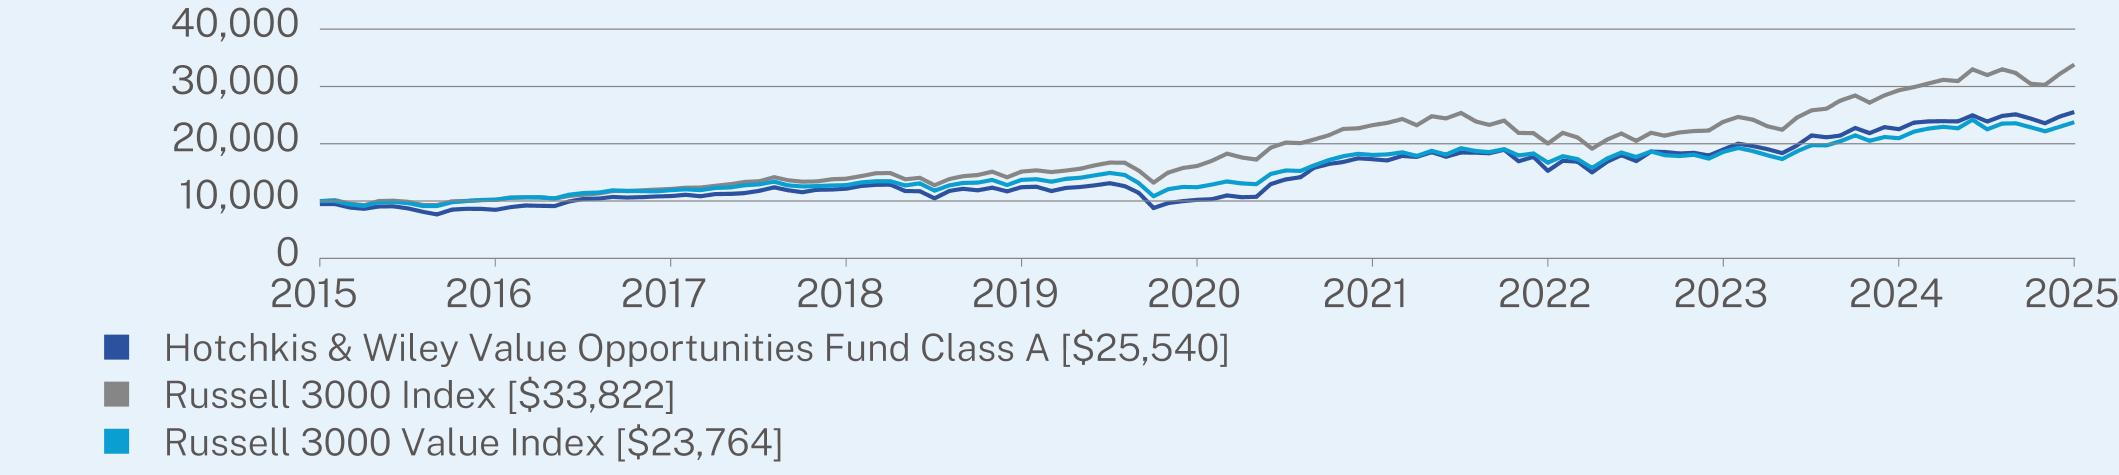
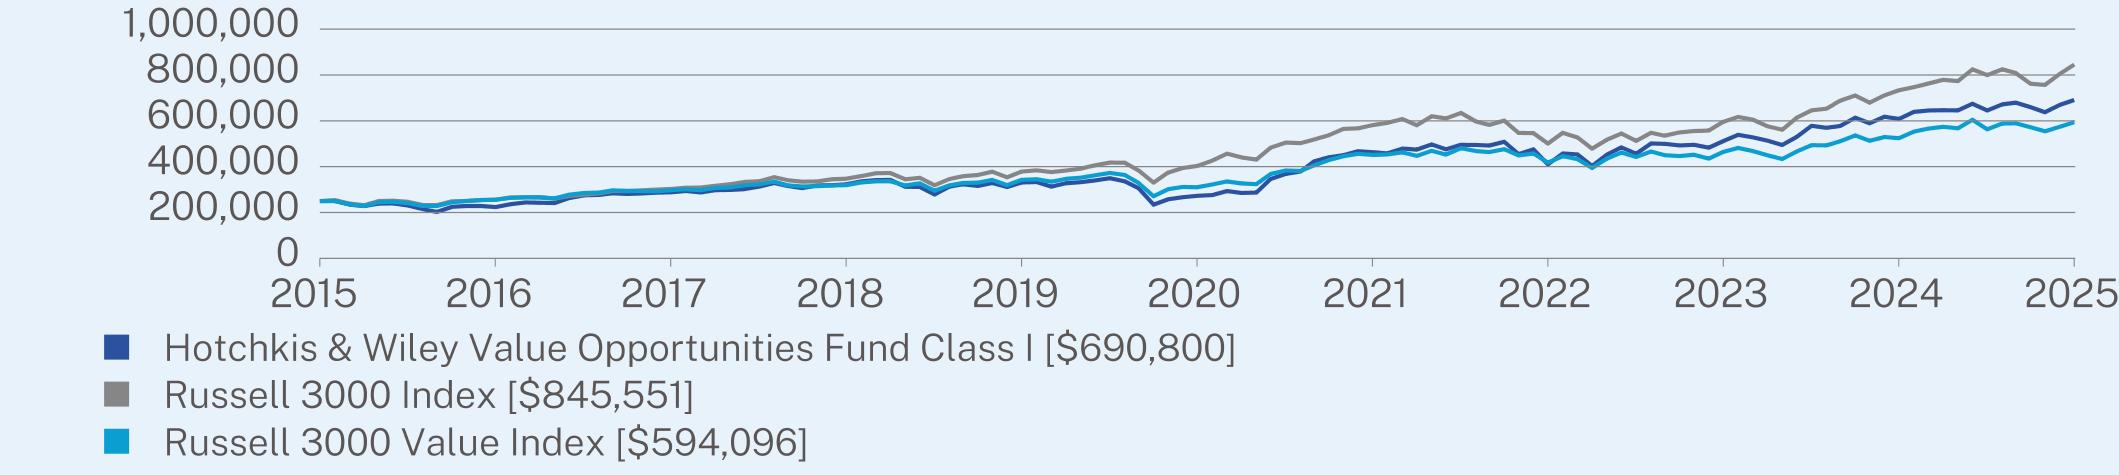
The Value Opportunities Fund returned 13.31% for Class A shares at net asset value (NAV) for the 12 months ended June 30, 2025. The Fund underperformed the Russell 3000 Index, which returned 15.30%.
TOP DETRACTORS FROM PERFORMANCE
• Stock selection and an overweight position in energy were the largest detractors from relative performance, followed by stock selection in communication services and materials. Stock selection in consumer discretionary was also a performance detractor.
TOP CONTRIBUTORS TO PERFORMANCE
• Stock selection in information technology, industrials, consumer staples and financials helped relative performance.
ANNUAL AVERAGE TOTAL RETURN (%)
|
|
1 Year
|
5 Year
|
10 Year
|
|
Class A (without sales charge)
|
13.31
|
20.10
|
10.42
|
|
Class A (with sales charge)
|
7.35
|
18.81
|
9.83
|
|
Russell 3000 Index
|
15.30
|
15.96
|
12.96
|
|
Russell 3000 Value Index
|
13.30
|
13.87
|
9.04
|
Visit https://www.hwcm.com/mutual-funds/resources/literature/ for more recent performance information.
Visit https://www.hwcm.com/mutual-funds/resources/literature/ for more recent performance information.
KEY FUND STATISTICS (as of June 30, 2025)
|
Net Assets
|
$725,124,671
|
|
Number of Holdings
|
70
|
|
Net Advisory Fee
|
$5,074,719
|
|
Portfolio Turnover
|
78%
|

|
Top Holdings
|
(%)
|
|
F5, Inc.
|
8.5%
|
|
Workday, Inc. - Class A
|
7.6%
|
|
Telefonaktiebolaget LM Ericsson
|
5.5%
|
|
Dominion Energy, Inc.
|
4.6%
|
|
Schlumberger NV
|
3.6%
|
|
Microsoft Corp.
|
3.4%
|
|
U-Haul Holding Co.
|
2.9%
|
|
Jones Lang LaSalle, Inc.
|
2.5%
|
|
Havas NV
|
2.5%
|
|
Siemens AG
|
2.4%
|
WHAT WERE THE FUND COSTS FOR THE PAST YEAR? (based on a hypothetical $10,000 investment)
|
Class Name
|
Costs of a $10,000 investment
|
Costs paid as a percentage of a $10,000 investment
|
|
Class C
|
$205
|
1.93%
|
HOW DID THE FUND PERFORM LAST YEAR? WHAT AFFECTED ITS PERFORMANCE?
PERFORMANCE HIGHLIGHTS
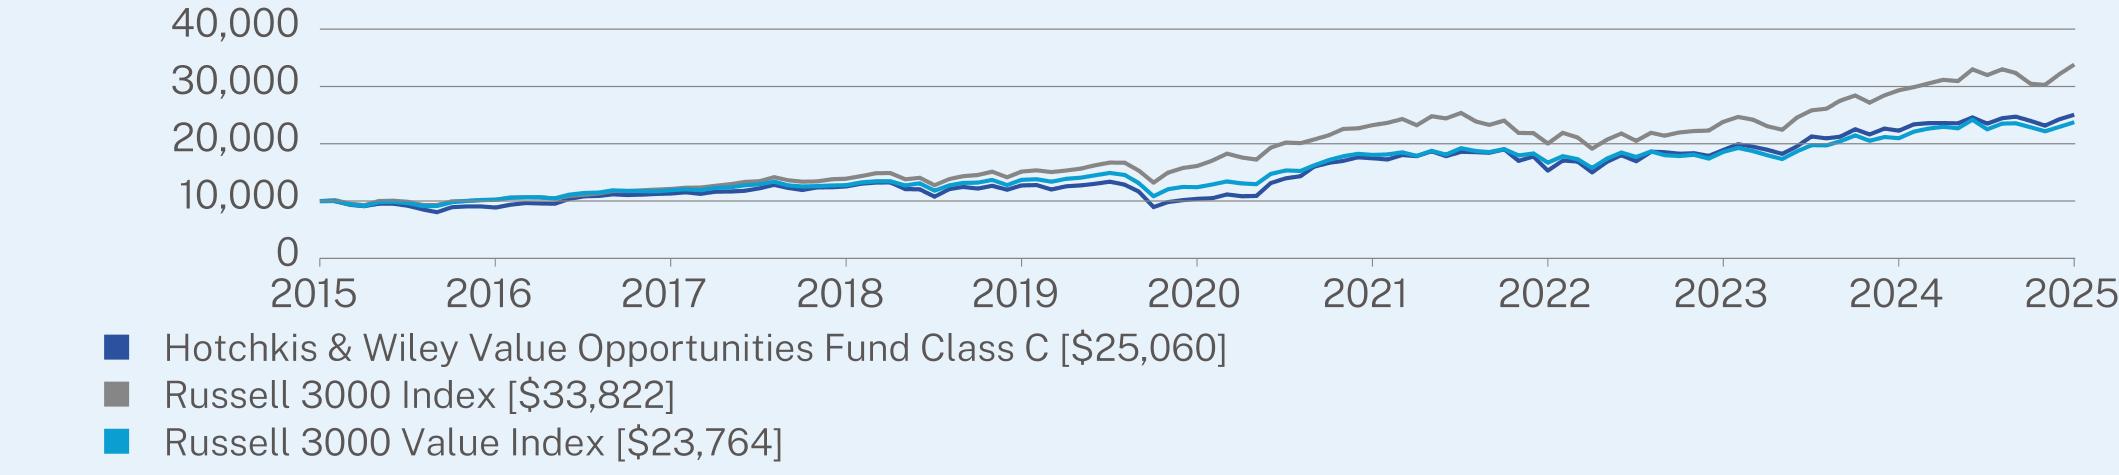
The Value Opportunities Fund returned 12.50% for Class C shares at net asset value (NAV) for the 12 months ended June 30, 2025. The Fund underperformed the Russell 3000 Index, which returned 15.30%.
TOP DETRACTORS FROM PERFORMANCE
• Stock selection and an overweight position in energy were the largest detractors from relative performance, followed by stock selection in communication services and materials. Stock selection in consumer discretionary was also a performance detractor.
TOP CONTRIBUTORS TO PERFORMANCE
• Stock selection in information technology, industrials, consumer staples and financials helped relative performance.
ANNUAL AVERAGE TOTAL RETURN (%)
|
|
1 Year
|
5 Year
|
10 Year
|
|
Class C (without sales charge)
|
12.50
|
19.24
|
9.62
|
|
Class C (with sales charge)
|
11.50
|
19.24
|
9.62
|
|
Russell 3000 Index
|
15.30
|
15.96
|
12.96
|
|
Russell 3000 Value Index
|
13.30
|
13.87
|
9.04
|
Visit https://www.hwcm.com/mutual-funds/resources/literature/ for more recent performance information.
Visit https://www.hwcm.com/mutual-funds/resources/literature/ for more recent performance information.
KEY FUND STATISTICS (as of June 30, 2025)
|
Net Assets
|
$725,124,671
|
|
Number of Holdings
|
70
|
|
Net Advisory Fee
|
$5,074,719
|
|
Portfolio Turnover
|
78%
|

|
Top Holdings
|
(%)
|
|
F5, Inc.
|
8.5%
|
|
Workday, Inc. - Class A
|
7.6%
|
|
Telefonaktiebolaget LM Ericsson
|
5.5%
|
|
Dominion Energy, Inc.
|
4.6%
|
|
Schlumberger NV
|
3.6%
|
|
Microsoft Corp.
|
3.4%
|
|
U-Haul Holding Co.
|
2.9%
|
|
Jones Lang LaSalle, Inc.
|
2.5%
|
|
Havas NV
|
2.5%
|
|
Siemens AG
|
2.4%
|
WHAT WERE THE FUND COSTS FOR THE PAST YEAR? (based on a hypothetical $10,000 investment)
|
Class Name
|
Costs of a $10,000 investment
|
Costs paid as a percentage of a $10,000 investment
|
|
Class I
|
$104
|
0.97%
|
HOW DID THE FUND PERFORM LAST YEAR? WHAT AFFECTED ITS PERFORMANCE?
PERFORMANCE HIGHLIGHTS
The Value Opportunities Fund returned 13.58% for Class I shares at net asset value (NAV) for the 12 months ended June 30, 2025. The Fund underperformed the Russell 3000 Index, which returned 15.30%.
TOP DETRACTORS FROM PERFORMANCE
• Stock selection and an overweight position in energy were the largest detractors from relative performance, followed by stock selection in communication services and materials. Stock selection in consumer discretionary was also a performance detractor.
TOP CONTRIBUTORS TO PERFORMANCE
• Stock selection in information technology, industrials, consumer staples and financials helped relative performance.
ANNUAL AVERAGE TOTAL RETURN (%)
|
|
1 Year
|
5 Year
|
10 Year
|
|
Class I
|
13.58
|
20.41
|
10.70
|
|
Russell 3000 Index
|
15.30
|
15.96
|
12.96
|
|
Russell 3000 Value Index
|
13.30
|
13.87
|
9.04
|
Visit https://www.hwcm.com/mutual-funds/resources/literature/ for more recent performance information.
Visit https://www.hwcm.com/mutual-funds/resources/literature/ for more recent performance information.
KEY FUND STATISTICS (as of June 30, 2025)
|
Net Assets
|
$725,124,671
|
|
Number of Holdings
|
70
|
|
Net Advisory Fee
|
$5,074,719
|
|
Portfolio Turnover
|
78%
|

|
Top Holdings
|
(%)
|
|
F5, Inc.
|
8.5%
|
|
Workday, Inc. - Class A
|
7.6%
|
|
Telefonaktiebolaget LM Ericsson
|
5.5%
|
|
Dominion Energy, Inc.
|
4.6%
|
|
Schlumberger NV
|
3.6%
|
|
Microsoft Corp.
|
3.4%
|
|
U-Haul Holding Co.
|
2.9%
|
|
Jones Lang LaSalle, Inc.
|
2.5%
|
|
Havas NV
|
2.5%
|
|
Siemens AG
|
2.4%
|
WHAT WERE THE FUND COSTS FOR THE PAST YEAR? (based on a hypothetical $10,000 investment)
|
Class Name
|
Costs of a $10,000 investment
|
Costs paid as a percentage of a $10,000 investment
|
|
Class Z
|
$94
|
0.88%
|
HOW DID THE FUND PERFORM LAST YEAR? WHAT AFFECTED ITS PERFORMANCE?
PERFORMANCE HIGHLIGHTS
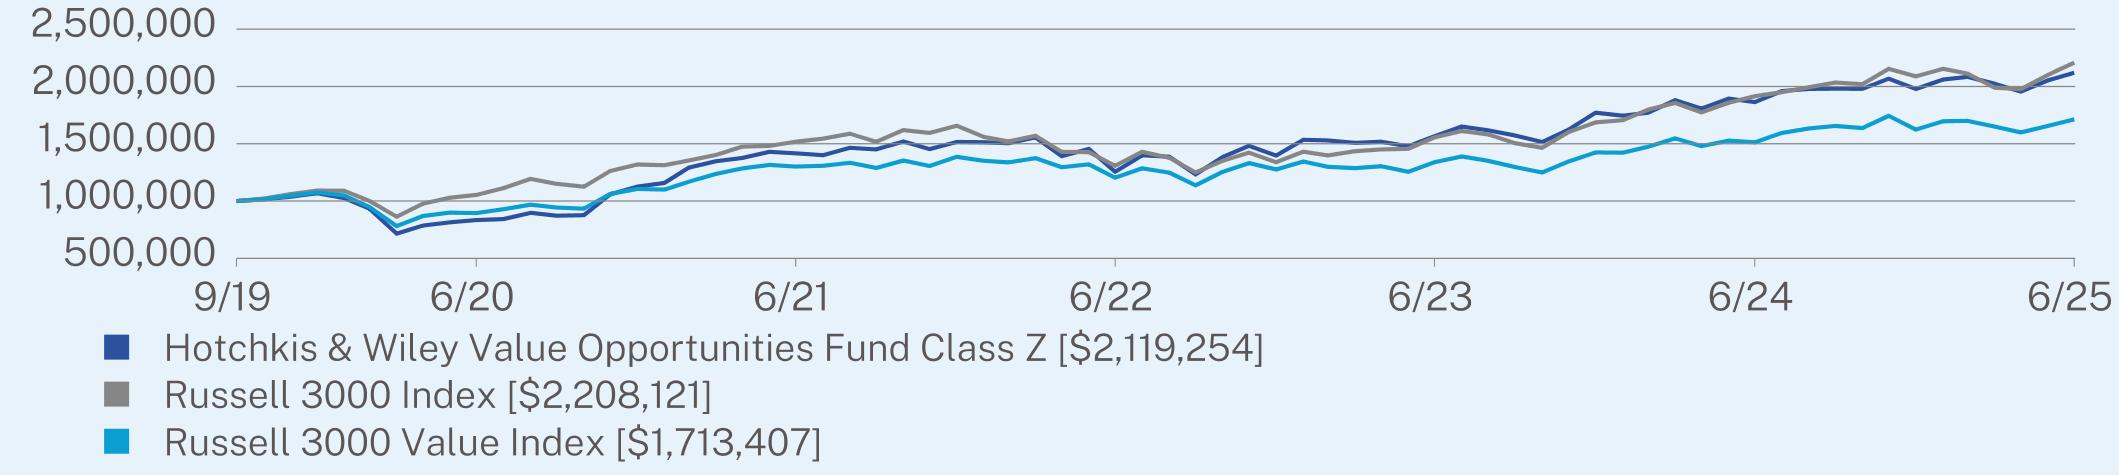
The Value Opportunities Fund returned 13.70% for Class Z shares at net asset value (NAV) for the 12 months ended June 30, 2025. The Fund underperformed the Russell 3000 Index, which returned 15.30%.
TOP DETRACTORS FROM PERFORMANCE
• Stock selection and an overweight position in energy were the largest detractors from relative performance, followed by stock selection in communication services and materials. Stock selection in consumer discretionary was also a performance detractor.
TOP CONTRIBUTORS TO PERFORMANCE
• Stock selection in information technology, industrials, consumer staples and financials helped relative performance.
ANNUAL AVERAGE TOTAL RETURN (%)
|
|
1 Year
|
5 Year
|
Since Inception
(09/30/2019) |
|
Class Z
|
13.70
|
20.51
|
13.95
|
|
Russell 3000 Index
|
15.30
|
15.96
|
14.77
|
|
Russell 3000 Value Index
|
13.30
|
13.87
|
9.82
|
Visit https://www.hwcm.com/mutual-funds/resources/literature/ for more recent performance information.
Visit https://www.hwcm.com/mutual-funds/resources/literature/ for more recent performance information.
KEY FUND STATISTICS (as of June 30, 2025)
|
Net Assets
|
$725,124,671
|
|
Number of Holdings
|
70
|
|
Net Advisory Fee
|
$5,074,719
|
|
Portfolio Turnover
|
78%
|
|
Top Holdings
|
(%)
|
|
F5, Inc.
|
8.5%
|
|
Workday, Inc. - Class A
|
7.6%
|
|
Telefonaktiebolaget LM Ericsson
|
5.5%
|
|
Dominion Energy, Inc.
|
4.6%
|
|
Schlumberger NV
|
3.6%
|
|
Microsoft Corp.
|
3.4%
|
|
U-Haul Holding Co.
|
2.9%
|
|
Jones Lang LaSalle, Inc.
|
2.5%
|
|
Havas NV
|
2.5%
|
|
Siemens AG
|
2.4%
|
This report describes changes to the Fund that occurred during the reporting period.
WHAT WERE THE FUND COSTS FOR THE PAST YEAR? (based on a hypothetical $10,000 investment)
|
Class Name
|
Costs of a $10,000 investment
|
Costs paid as a percentage of a $10,000 investment
|
|
Class A
|
$95
|
0.91%
|
HOW DID THE FUND PERFORM LAST YEAR? WHAT AFFECTED ITS PERFORMANCE?
PERFORMANCE HIGHLIGHTS
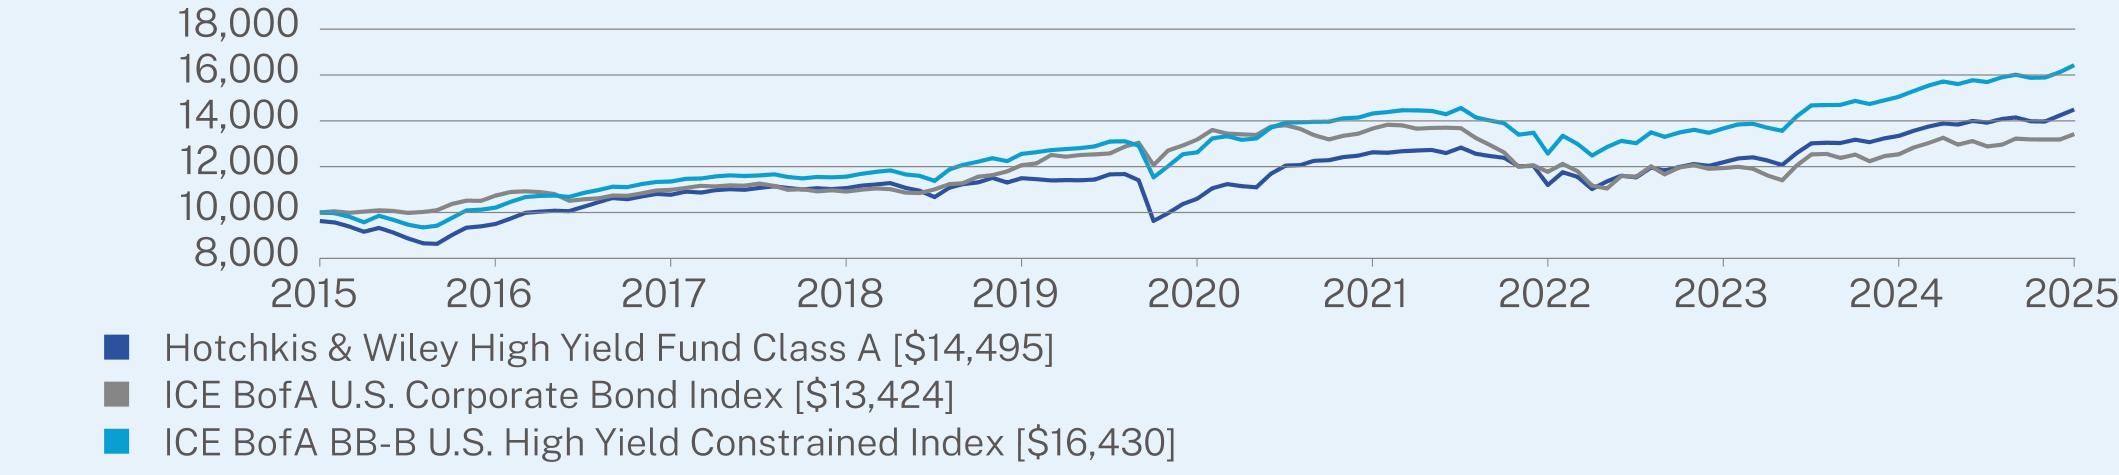
The High Yield Fund returned 8.63% for Class A shares at net asset value (NAV) for the 12 months ended June 30, 2025. The Fund outperformed the ICE BofA U.S. Corporate Bond Index, which returned 7.03%.
TOP CONTRIBUTORS TO PERFORMANCE
• Credit selection was positive across fifteen of the nineteen high yield market sectors, most notably in basic industry and capital goods.
• Overweight within the BB and B rating cohorts were the primary contributors to relative performance.
TOP DETRACTORS FROM PERFORMANCE
• Credit selection within the energy sector and an underweight within banking detracted from relative performance.
ANNUAL AVERAGE TOTAL RETURN (%)
|
|
1 Year
|
5 Year
|
10 Year
|
|
Class A (without sales charge)
|
8.63
|
6.45
|
4.18
|
|
Class A (with sales charge)
|
4.58
|
5.65
|
3.78
|
|
ICE BofA U.S. Corporate Bond Index
|
7.03
|
0.36
|
2.99
|
|
ICE BofA BB-B U.S. High Yield Constrained Index
|
9.15
|
5.41
|
5.09
|
Visit https://www.hwcm.com/mutual-funds/resources/literature/ for more recent performance information.
Visit https://www.hwcm.com/mutual-funds/resources/literature/ for more recent performance information.
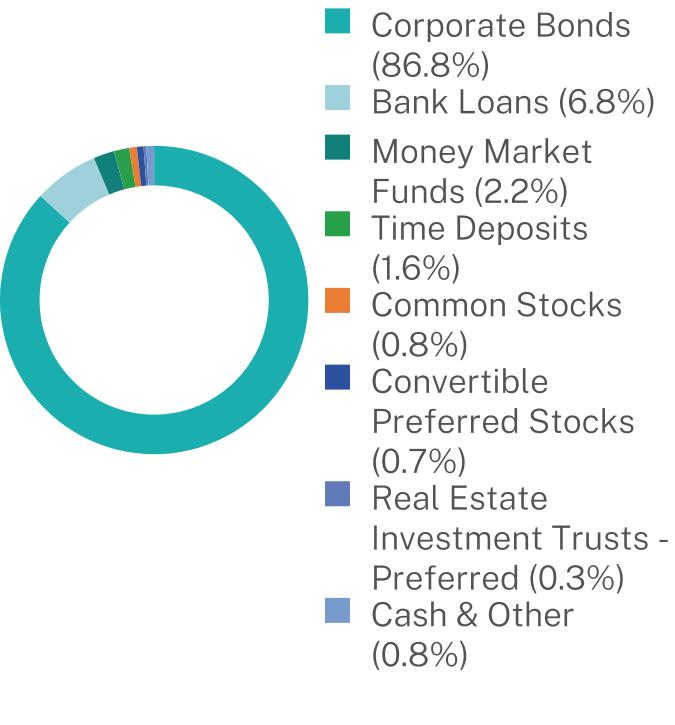
KEY FUND STATISTICS (as of June 30, 2025)
|
Net Assets
|
$775,924,165
|
|
Number of Holdings
|
208
|
|
Net Advisory Fee
|
$4,189,946
|
|
Portfolio Turnover
|
41%
|
|
Top 10 Issuers
|
(%)
|
|
CCO Holdings LLC / CCO Holdings Capital Corp.
|
2.3%
|
|
Carnival Corp.
|
1.5%
|
|
Authentic Brands Group LLC
|
1.3%
|
|
CSC Holdings LLC
|
1.0%
|
|
WR Grace Holdings LLC
|
0.9%
|
|
Fortis 333, Inc.
|
0.9%
|
|
Gray Media, Inc.
|
0.9%
|
|
Venture Global Plaquemines LNG LLC
|
0.8%
|
|
Herc Holdings, Inc.
|
0.8%
|
|
TransDigm, Inc.
|
0.8%
|
Changes to Fund’s Portfolio Manager or Portfolio Management Team:
Effective July 1, 2024, Daniel McKenzie was added as a Portfolio Manager to the Fund. Ray Kennedy, Mark Hudoff, Patrick Meegan and Richard Mak continue to serve as portfolio managers to the Fund and are jointly responsible for the Fund’s day-to-day management.
This report describes changes to the Fund that occurred during the reporting period.
WHAT WERE THE FUND COSTS FOR THE PAST YEAR? (based on a hypothetical $10,000 investment)
|
Class Name
|
Costs of a $10,000 investment
|
Costs paid as a percentage of a $10,000 investment
|
|
Class I
|
$73
|
0.70%
|
HOW DID THE FUND PERFORM LAST YEAR? WHAT AFFECTED ITS PERFORMANCE?
PERFORMANCE HIGHLIGHTS
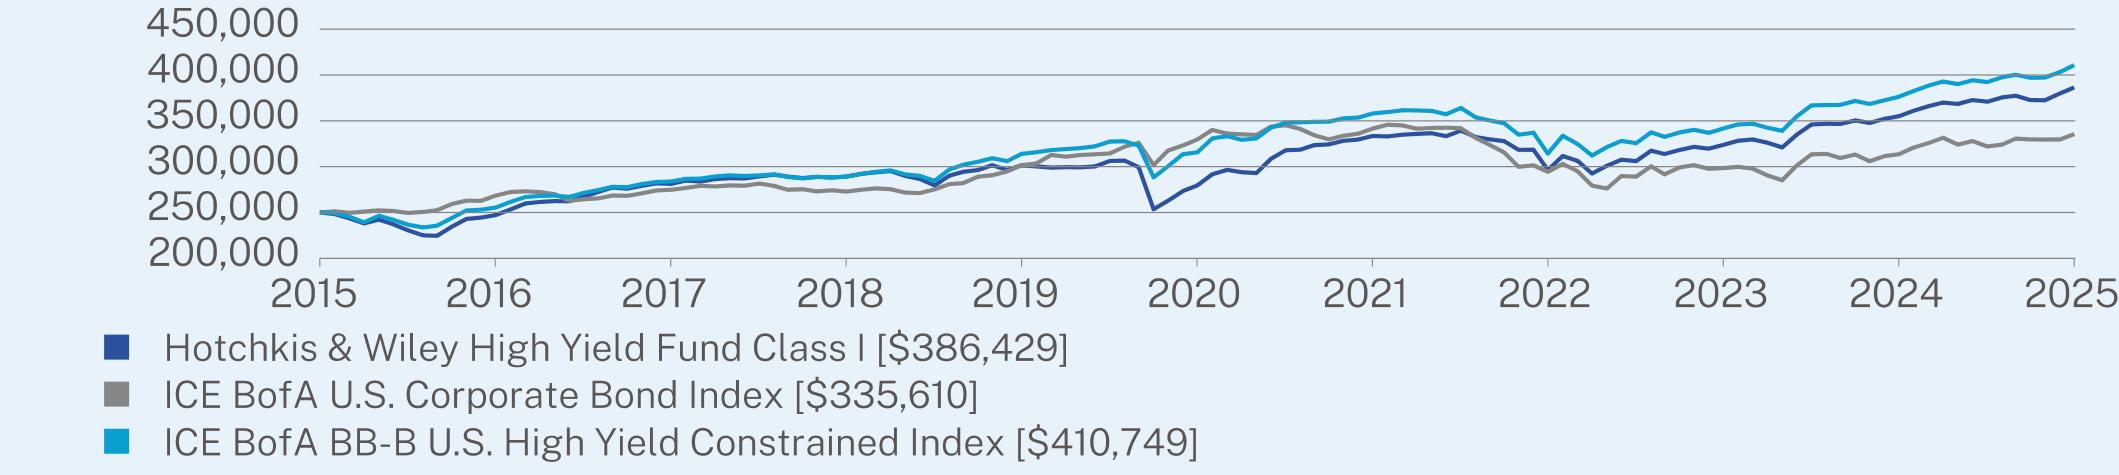
The High Yield Fund returned 8.82% for Class I shares at net asset value (NAV) for the 12 months ended June 30, 2025. The Fund outperformed the ICE BofA U.S. Corporate Bond Index, which returned 7.03%.
TOP CONTRIBUTORS TO PERFORMANCE
• Credit selection was positive across fifteen of the nineteen high yield market sectors, most notably in basic industry and capital goods.
• Overweight within the BB and B rating cohorts were the primary contributors to relative performance.
TOP DETRACTORS FROM PERFORMANCE
• Credit selection within the energy sector and an underweight within banking detracted from relative performance.
ANNUAL AVERAGE TOTAL RETURN (%)
|
|
1 Year
|
5 Year
|
10 Year
|
|
Class I
|
8.82
|
6.69
|
4.45
|
|
ICE BofA U.S. Corporate Bond Index
|
7.03
|
0.36
|
2.99
|
|
ICE BofA BB-B U.S. High Yield Constrained Index
|
9.15
|
5.41
|
5.09
|
Visit https://www.hwcm.com/mutual-funds/resources/literature/ for more recent performance information.
Visit https://www.hwcm.com/mutual-funds/resources/literature/ for more recent performance information.
KEY FUND STATISTICS (as of June 30, 2025)
|
Net Assets
|
$775,924,165
|
|
Number of Holdings
|
208
|
|
Net Advisory Fee
|
$4,189,946
|
|
Portfolio Turnover
|
41%
|

|
Top 10 Issuers
|
(%)
|
|
CCO Holdings LLC / CCO Holdings Capital Corp.
|
2.3%
|
|
Carnival Corp.
|
1.5%
|
|
Authentic Brands Group LLC
|
1.3%
|
|
CSC Holdings LLC
|
1.0%
|
|
WR Grace Holdings LLC
|
0.9%
|
|
Fortis 333, Inc.
|
0.9%
|
|
Gray Media, Inc.
|
0.9%
|
|
Venture Global Plaquemines LNG LLC
|
0.8%
|
|
Herc Holdings, Inc.
|
0.8%
|
|
TransDigm, Inc.
|
0.8%
|
Changes to Fund’s Portfolio Manager or Portfolio Management Team:
Effective July 1, 2024, Daniel McKenzie was added as a Portfolio Manager to the Fund. Ray Kennedy, Mark Hudoff, Patrick Meegan and Richard Mak continue to serve as portfolio managers to the Fund and are jointly responsible for the Fund’s day-to-day management.
This report describes changes to the Fund that occurred during the reporting period.
WHAT WERE THE FUND COSTS FOR THE PAST YEAR? (based on a hypothetical $10,000 investment)
|
Class Name
|
Costs of a $10,000 investment
|
Costs paid as a percentage of a $10,000 investment
|
|
Class Z
|
$63
|
0.60%
|
HOW DID THE FUND PERFORM LAST YEAR? WHAT AFFECTED ITS PERFORMANCE?
PERFORMANCE HIGHLIGHTS
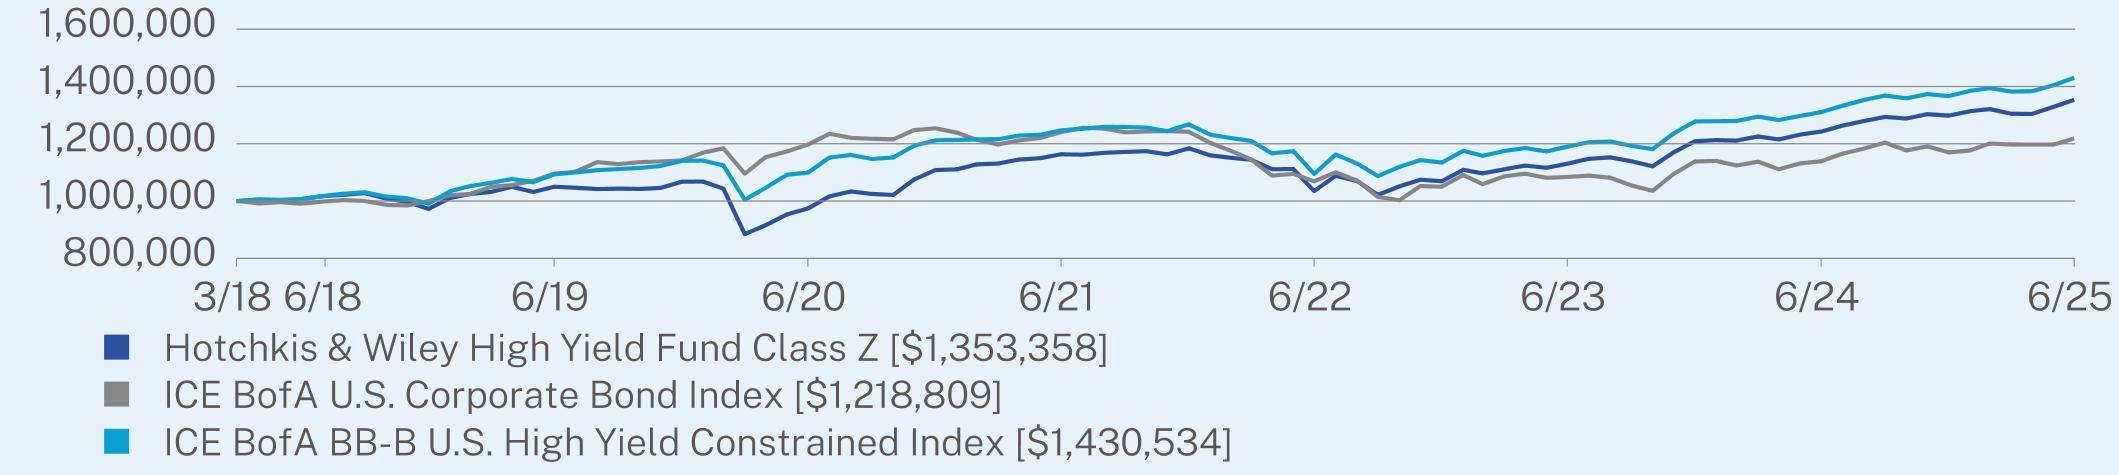
The High Yield Fund returned 8.94% for Class Z shares at net asset value (NAV) for the 12 months ended June 30, 2025. The Fund outperformed the ICE BofA U.S. Corporate Bond Index, which returned 7.03%.
TOP CONTRIBUTORS TO PERFORMANCE
• Credit selection was positive across fifteen of the nineteen high yield market sectors, most notably in basic industry and capital goods.
• Overweight within the BB and B rating cohorts were the primary contributors to relative performance.
TOP DETRACTORS FROM PERFORMANCE
• Credit selection within the energy sector and an underweight within banking detracted from relative performance.
ANNUAL AVERAGE TOTAL RETURN (%)
|
|
1 Year
|
5 Year
|
Since Inception
(03/29/2018) |
|
Class Z
|
8.94
|
6.80
|
4.26
|
|
ICE BofA U.S. Corporate Bond Index
|
7.03
|
0.36
|
2.77
|
|
ICE BofA BB-B U.S. High Yield Constrained Index
|
9.15
|
5.41
|
5.06
|
Visit https://www.hwcm.com/mutual-funds/resources/literature/ for more recent performance information.
Visit https://www.hwcm.com/mutual-funds/resources/literature/ for more recent performance information.
KEY FUND STATISTICS (as of June 30, 2025)
|
Net Assets
|
$775,924,165
|
|
Number of Holdings
|
208
|
|
Net Advisory Fee
|
$4,189,946
|
|
Portfolio Turnover
|
41%
|

|
Top 10 Issuers
|
(%)
|
|
CCO Holdings LLC / CCO Holdings Capital Corp.
|
2.3%
|
|
Carnival Corp.
|
1.5%
|
|
Authentic Brands Group LLC
|
1.3%
|
|
CSC Holdings LLC
|
1.0%
|
|
WR Grace Holdings LLC
|
0.9%
|
|
Fortis 333, Inc.
|
0.9%
|
|
Gray Media, Inc.
|
0.9%
|
|
Venture Global Plaquemines LNG LLC
|
0.8%
|
|
Herc Holdings, Inc.
|
0.8%
|
|
TransDigm, Inc.
|
0.8%
|
Changes to Fund’s Portfolio Manager or Portfolio Management Team:
Effective July 1, 2024, Daniel McKenzie was added as a Portfolio Manager to the Fund. Ray Kennedy, Mark Hudoff, Patrick Meegan and Richard Mak continue to serve as portfolio managers to the Fund and are jointly responsible for the Fund’s day-to-day management.
WHAT WERE THE FUND COSTS FOR THE PAST YEAR? (based on a hypothetical $10,000 investment)
|
Fund Name
|
Costs of a $10,000 investment
|
Costs paid as a percentage of a $10,000 investment*
|
|
SMID Cap Diversified Value Fund
|
$14
|
0.55%
|
HOW DID THE FUND PERFORM LAST YEAR? WHAT AFFECTED ITS PERFORMANCE?
PERFORMANCE HIGHLIGHTS
The SMID Cap Diversified Value Fund returned 2.11% at net asset value (NAV) from March 28, 2025 (Fund inception) through June 30, 2025. The Fund underperformed the Russell 3000 Index, which returned 11.50% for the same period.
TOP DETRACTORS FROM PERFORMANCE
|
•
|
Stock selection in information technology, along with an overweight in energy and an underweight position in technology, were the primary detractors from performance. Stock selection in industrials, consumer staples, and communication services also detracted from returns.
|
TOP CONTRIBUTORS TO PERFORMANCE
|
•
|
Stock selection in real estate and an underweight in health care helped relative performance.
|
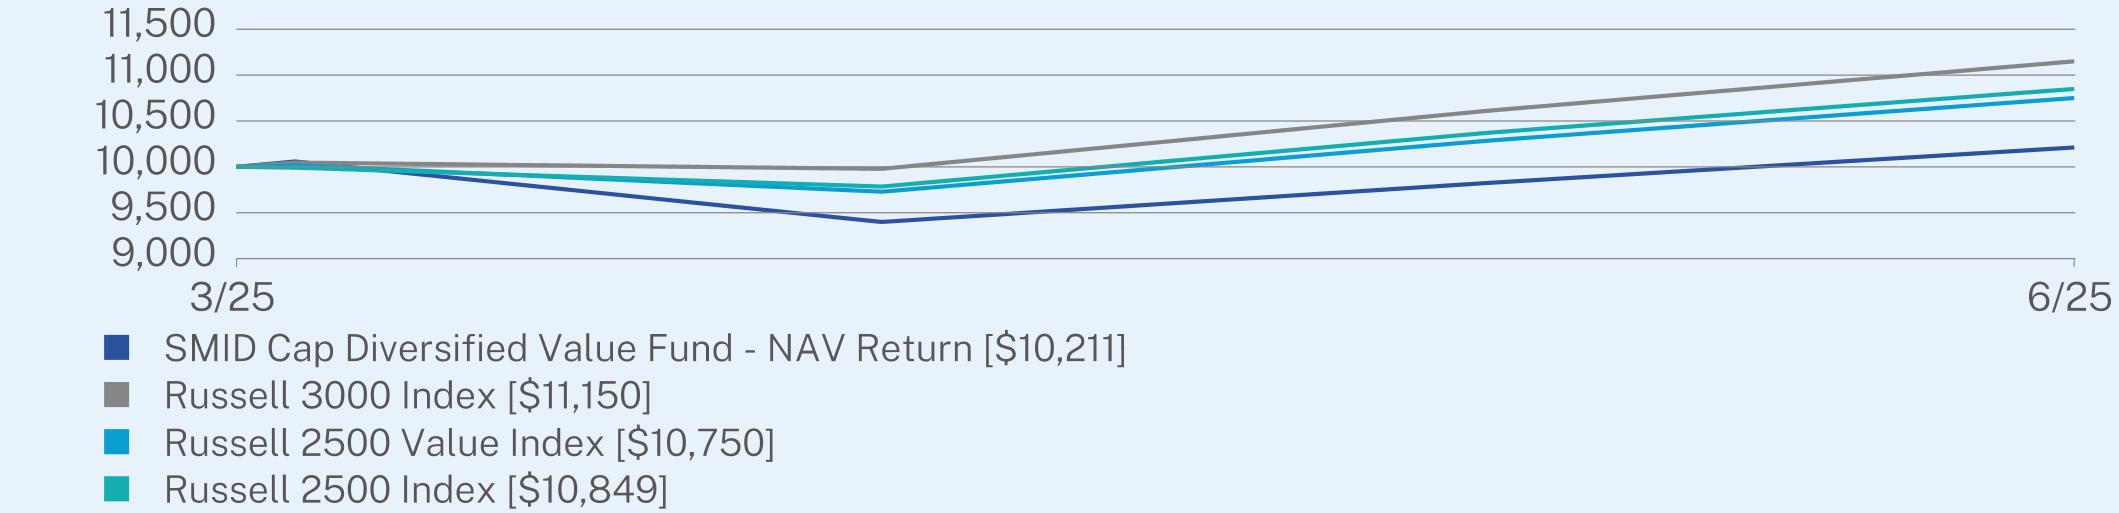
ANNUAL AVERAGE TOTAL RETURN (%)
|
|
Since Inception
(03/28/2025) |
|
SMID Cap Diversified Value Fund - NAV Return
|
2.11
|
|
Russell 3000 Index
|
11.50
|
|
Russell 2500 Value Index
|
7.50
|
|
Russell 2500 Index
|
8.49
|
Visit https://www.hwcm.com/etfs/hw-smid-cap-diversified-value-fund/summary/ for more recent performance information.
Visit https://www.hwcm.com/etfs/hw-smid-cap-diversified-value-fund/summary/ for more recent performance information.
KEY FUND STATISTICS (as of June 30, 2025)
|
Net Assets
|
$2,002,254
|
|
Number of Holdings
|
156
|
|
Net Advisory Fee
|
$2,319
|
|
Portfolio Turnover
|
0%
|
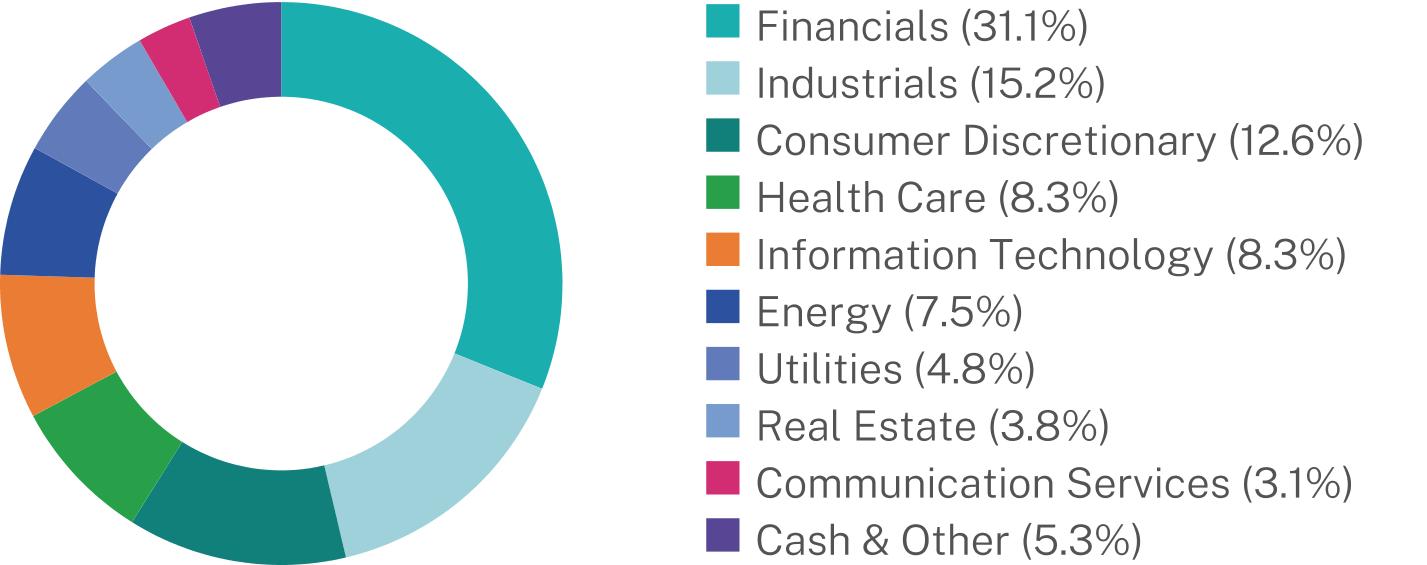
|
Top 10 Issuers
|
(%)
|
|
Synchrony Financial
|
1.2%
|
|
Franklin Resources, Inc.
|
1.2%
|
|
Popular, Inc.
|
1.2%
|
|
BorgWarner, Inc.
|
1.2%
|
|
Huntington Ingalls Industries, Inc.
|
1.2%
|
|
State Street Corp.
|
1.1%
|
|
TE Connectivity PLC
|
1.1%
|
|
WESCO International, Inc.
|
1.1%
|
|
Corebridge Financial, Inc.
|
1.1%
|
|
Magna International, Inc.
|
1.1%
|
WHAT WERE THE FUND COSTS FOR THE PAST YEAR? (based on a hypothetical $10,000 investment)
|
Fund Name
|
Costs of a $10,000 investment
|
Costs paid as a percentage of a $10,000 investment
|
|
HW Opportunities MP Fund
|
$0
|
0.00%
|
HOW DID THE FUND PERFORM LAST YEAR? WHAT AFFECTED ITS PERFORMANCE?
PERFORMANCE HIGHLIGHTS
The HW Opportunities MP Fund returned 4.26% at net asset value (NAV) for the 12 months ended June 30, 2025. The Fund underperformed the Russell 3000 Index, which returned 15.30%.
TOP DETRACTORS FROM PERFORMANCE
• The largest relative detractor was stock selection in energy and communication services. Additional headwinds came from an overweight in energy and miscellaneous put positions, along with security selection in materials.
TOP CONTRIBUTORS TO PERFORMANCE
• Stock selection in industrials and information technology and an underweight in health care contributed to relative performance.
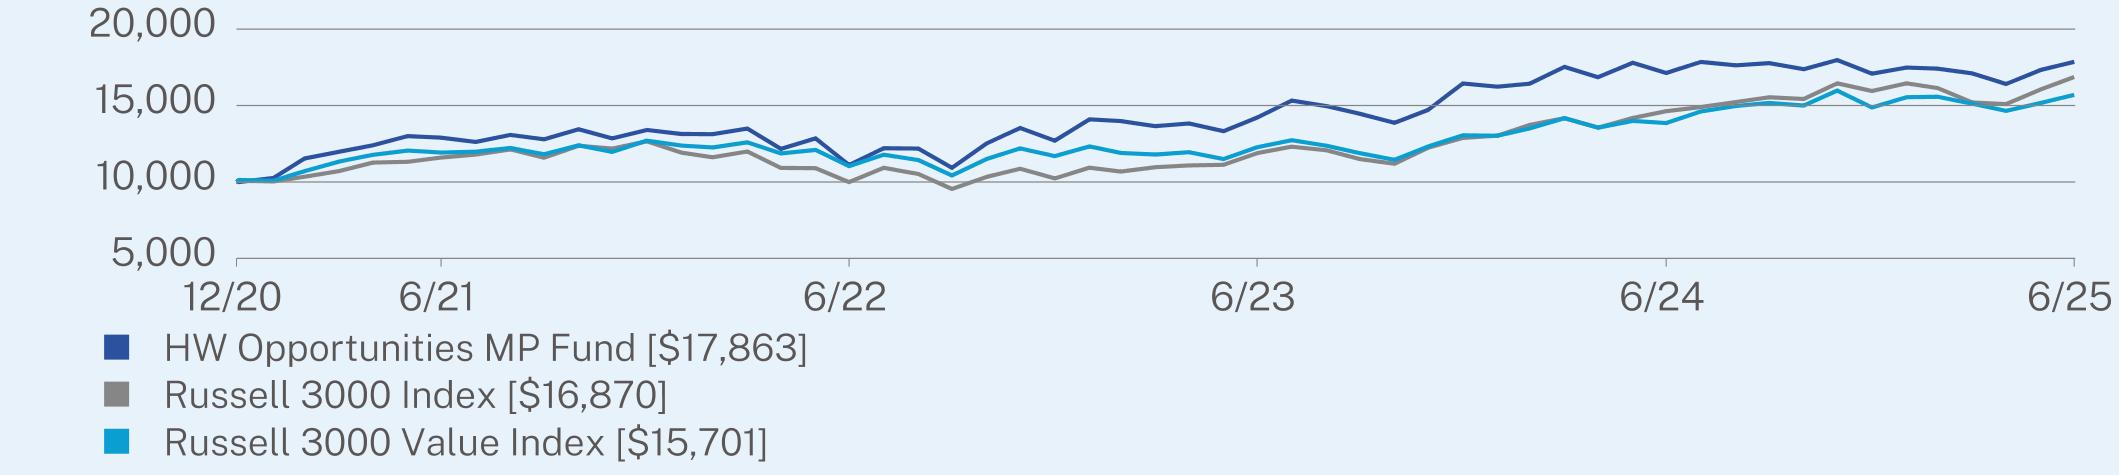
ANNUAL AVERAGE TOTAL RETURN (%)
|
|
1 Year
|
Since Inception
(12/30/2020) |
|
Fund
|
4.26
|
13.76
|
|
Russell 3000 Index
|
15.30
|
12.32
|
|
Russell 3000 Value Index
|
13.30
|
10.54
|
Visit https://www.hwcm.com/HOMPX for more recent performance information.
Visit https://www.hwcm.com/HOMPX for more recent performance information.
KEY FUND STATISTICS (as of June 30, 2025)
|
Net Assets
|
$69,365,301
|
|
Number of Holdings
|
49
|
|
Net Advisory Fee
|
$0
|
|
Portfolio Turnover
|
107%
|
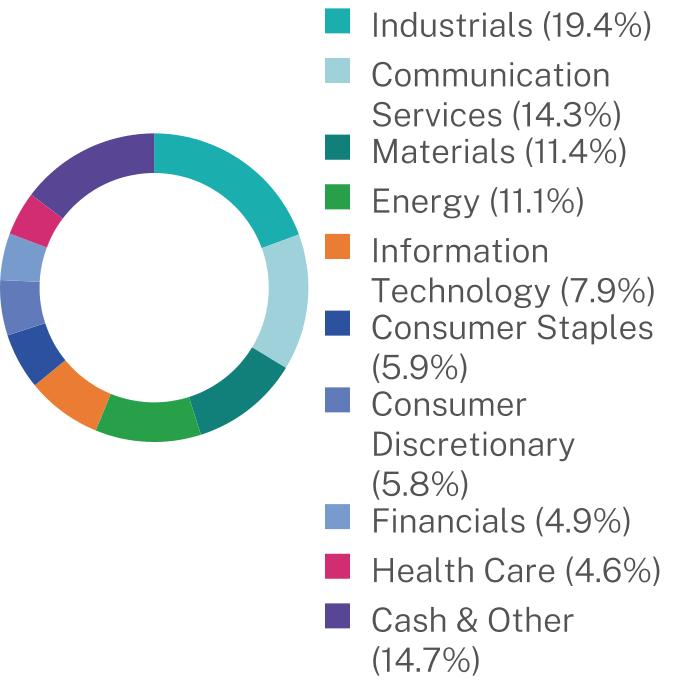
|
Top Holdings
|
(%)
|
|
U-Haul Holding Co.
|
8.0%
|
|
Havas NV
|
6.6%
|
|
Qantas Airways Ltd.
|
6.4%
|
|
Ecovyst, Inc.
|
5.9%
|
|
Fuso Chemical Co. Ltd.
|
5.5%
|
|
Henkel AG & Co. KGaA
|
4.5%
|
|
Stagwell, Inc.
|
4.4%
|
|
Jones Lang LaSalle, Inc.
|
4.3%
|
|
Vanguard Long-Term Treasury ETF
|
4.1%
|
|
Siemens AG
|
3.9%
|
The Fund commenced operations following the completion of the reorganization of the HW Opportunities MP Fund, a series of Series Portfolio Trust (the “Predecessor Fund”), into the Fund, which occurred after close of business on December 15, 2023 (the “Reorganization”). During the Fund’s two most recent fiscal years, as a result of the Reorganization after the close of business on December 15, 2023, there was a change in accountants from Cohen & Company, Ltd., the Predecessor Fund’s independent registered public accounting firm, to Deloitte & Touche LLP, the independent registered public accounting firm that the Board selected for the Fund at a meeting held on August 15, 2023, upon the recommendation of the Trust’s Audit Committee.
| [1] |
|