Shareholder Report
Jun. 30, 2025
USD ($)
Holding
There were no material changes to the Fund during the 12-month period ended June 30, 2025.
Shareholder Report |
12 Months Ended | ||||||||||||||||||||||||||||||||||||||||||||||||
|---|---|---|---|---|---|---|---|---|---|---|---|---|---|---|---|---|---|---|---|---|---|---|---|---|---|---|---|---|---|---|---|---|---|---|---|---|---|---|---|---|---|---|---|---|---|---|---|---|---|
|
Jun. 30, 2025
USD ($)
Holding
| |||||||||||||||||||||||||||||||||||||||||||||||||
| Shareholder Report [Line Items] | |||||||||||||||||||||||||||||||||||||||||||||||||
| Document Type | N-CSR | ||||||||||||||||||||||||||||||||||||||||||||||||
| Amendment Flag | false | ||||||||||||||||||||||||||||||||||||||||||||||||
| Registrant Name | SIT LARGE CAP GROWTH FUND INC | ||||||||||||||||||||||||||||||||||||||||||||||||
| Entity Central Index Key | 0000356786 | ||||||||||||||||||||||||||||||||||||||||||||||||
| Entity Investment Company Type | N-1A | ||||||||||||||||||||||||||||||||||||||||||||||||
| Document Period End Date | Jun. 30, 2025 | ||||||||||||||||||||||||||||||||||||||||||||||||
| C000032270 | |||||||||||||||||||||||||||||||||||||||||||||||||
| Shareholder Report [Line Items] | |||||||||||||||||||||||||||||||||||||||||||||||||
| Fund Name | Sit Large Cap Growth Fund | ||||||||||||||||||||||||||||||||||||||||||||||||
| No Trading Symbol [Flag] | true | ||||||||||||||||||||||||||||||||||||||||||||||||
| Annual or Semi-Annual Statement [Text Block] | This annual shareholder report contains important information about Sit Large Cap Growth Fund for the period of July 1, 2024 to June 30, 2025. | ||||||||||||||||||||||||||||||||||||||||||||||||
| Shareholder Report Annual or Semi-Annual | Annual Shareholder Report | ||||||||||||||||||||||||||||||||||||||||||||||||
| Additional Information [Text Block] | You can find additional information about the Fund at www.sitfunds.com/documents. You can also request this information by contacting us at 1-800-332-5580. | ||||||||||||||||||||||||||||||||||||||||||||||||
| Additional Information Phone Number | 1-800-332-5580 | ||||||||||||||||||||||||||||||||||||||||||||||||
| Additional Information Email | <span style="box-sizing: border-box; color: rgb(0, 0, 0); display: inline; flex-wrap: nowrap; font-size: 12px; font-weight: 400; grid-area: auto; line-height: 18px; margin: 0px; overflow: visible; text-align: left; text-align-last: auto; white-space-collapse: preserve-breaks;">www.sitfunds.com</span>/documents | ||||||||||||||||||||||||||||||||||||||||||||||||
| Expenses [Text Block] | What were the Fund’s costs for the last year?(based on a hypothetical $10,000 investment)
|
||||||||||||||||||||||||||||||||||||||||||||||||
| Expenses Paid, Amount | $ 105 | ||||||||||||||||||||||||||||||||||||||||||||||||
| Expense Ratio, Percent | 1.00% | ||||||||||||||||||||||||||||||||||||||||||||||||
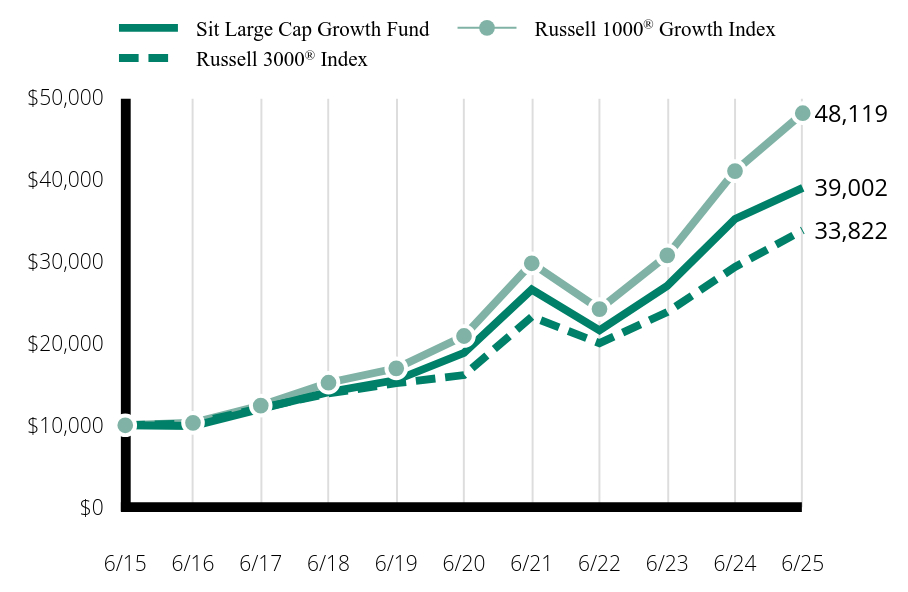
| Factors Affecting Performance [Text Block] | How did the Fund perform in the past 12 months and what affected its performance?For the 12-month period ended June 30, 2025, the Sit Large Cap Growth Fund returned +10.79%, underperforming the Russell 1000® Growth Index's return of +17.22%. During the period, stock selection in the technology services sector was the largest detractor from performance. In this sector, an underweight position in Palantir (+438%) combined with overweight positions in Alphabet (-3%) and Adobe (-30%) weighed on returns. Stock selection in the health services sector also detracted from performance during the period, as the Fund held positions in equities that declined, such as UnitedHealth Group (-38%) and Centene (-18%). Augmenting returns during the period were an overweight position in the electronic technology sector, combined with strong stock selection. Key contributors to performance here include positions in Broadcom (+73%) and not owning underperforming equities such as Qualcomm (-18%). Additionally, an overweight position in producer manufacturing and positive stock selection in finance contributed to improved performance. |
||||||||||||||||||||||||||||||||||||||||||||||||
| Line Graph [Table Text Block] |
|
||||||||||||||||||||||||||||||||||||||||||||||||
| Average Annual Return [Table Text Block] |
|
||||||||||||||||||||||||||||||||||||||||||||||||
| Material Change Date | Jun. 30, 2025 | ||||||||||||||||||||||||||||||||||||||||||||||||
| AssetsNet | $ 240,254,566 | ||||||||||||||||||||||||||||||||||||||||||||||||
| Holdings Count | Holding | 62 | ||||||||||||||||||||||||||||||||||||||||||||||||
| Advisory Fees Paid, Amount | $ 2,228,273 | ||||||||||||||||||||||||||||||||||||||||||||||||
| InvestmentCompanyPortfolioTurnover | 4.27% | ||||||||||||||||||||||||||||||||||||||||||||||||
| Additional Fund Statistics [Text Block] | Fund Statistics (as of 06/30/25)
|
||||||||||||||||||||||||||||||||||||||||||||||||
| Holdings [Text Block] | Top 10 Equity (% of Net Assets)
Sector Allocation (% of Net Assets)
|
||||||||||||||||||||||||||||||||||||||||||||||||
| Material Fund Change [Text Block] | Material Fund ChangesThere were no material changes to the Fund during the 12-month period ended June 30, 2025. |
||||||||||||||||||||||||||||||||||||||||||||||||
| Summary of Change Legend [Text Block] | There were no material changes to the Fund during the 12-month period ended June 30, 2025. |
| X | ||||||||||
- Definition Boolean flag that is true when the XBRL content amends previously-filed or accepted submission. No definition available.
|
| X | ||||||||||
- Definition For the EDGAR submission types of Form 8-K: the date of the report, the date of the earliest event reported; for the EDGAR submission types of Form N-1A: the filing date; for all other submission types: the end of the reporting or transition period. The format of the date is YYYY-MM-DD. No definition available.
|
| X | ||||||||||
- Definition The type of document being provided (such as 10-K, 10-Q, 485BPOS, etc). The document type is limited to the same value as the supporting SEC submission type, or the word 'Other'. No definition available.
|
| X | ||||||||||
- Definition A unique 10-digit SEC-issued value to identify entities that have filed disclosures with the SEC. It is commonly abbreviated as CIK. Reference 1: http://www.xbrl.org/2003/role/presentationRef
|
| X | ||||||||||
- Definition One of: N-1A (Mutual Fund), N-1 (Open-End Separate Account with No Variable Annuities), N-2 (Closed-End Investment Company), N-3 (Separate Account Registered as Open-End Management Investment Company), N-4 (Variable Annuity UIT Separate Account), N-5 (Small Business Investment Company), N-6 (Variable Life UIT Separate Account), S-1 or S-3 (Face Amount Certificate Company), S-6 (UIT, Non-Insurance Product). Reference 1: http://www.xbrl.org/2003/role/presentationRef
|
| X | ||||||||||
- Definition The exact name of the entity filing the report as specified in its charter, which is required by forms filed with the SEC. Reference 1: http://www.xbrl.org/2003/role/presentationRef
|
| X | ||||||||||
- Definition Boolean flag that is true only for a security having no trading symbol. No definition available.
|
| X | ||||||||||
- References Reference 1: http://www.xbrl.org/2003/role/presentationRef
|
| X | ||||||||||
- References Reference 1: http://www.xbrl.org/2003/role/presentationRef
|
| X | ||||||||||
- References Reference 1: http://www.xbrl.org/2003/role/presentationRef
|
| X | ||||||||||
- References Reference 1: http://www.xbrl.org/2003/role/presentationRef
|
| X | ||||||||||
- References Reference 1: http://www.xbrl.org/2003/role/presentationRef
|
| X | ||||||||||
- References Reference 1: http://www.xbrl.org/2003/role/presentationRef
|
| X | ||||||||||
- References Reference 1: http://www.xbrl.org/2003/role/presentationRef
|
| X | ||||||||||
- References Reference 1: http://www.xbrl.org/2003/role/presentationRef
|
| X | ||||||||||
- References Reference 1: http://www.xbrl.org/2003/role/presentationRef
|
| X | ||||||||||
- References Reference 1: http://www.xbrl.org/2003/role/presentationRef
|
| X | ||||||||||
- References Reference 1: http://www.xbrl.org/2003/role/presentationRef
|
| X | ||||||||||
- References Reference 1: http://www.xbrl.org/2003/role/presentationRef
|
| X | ||||||||||
- References Reference 1: http://www.xbrl.org/2003/role/presentationRef
|
| X | ||||||||||
- References Reference 1: http://www.xbrl.org/2003/role/presentationRef
|
| X | ||||||||||
- References Reference 1: http://www.xbrl.org/2003/role/presentationRef
|
| X | ||||||||||
- References Reference 1: http://www.xbrl.org/2003/role/presentationRef
|
| X | ||||||||||
- References Reference 1: http://www.xbrl.org/2003/role/presentationRef
|
| X | ||||||||||
- References Reference 1: http://www.xbrl.org/2003/role/presentationRef
|
| X | ||||||||||
- References Reference 1: http://www.xbrl.org/2003/role/presentationRef
|
| X | ||||||||||
- References Reference 1: http://www.xbrl.org/2003/role/presentationRef
|
| X | ||||||||||
- Definition Amount of net assets (liabilities). Reference 1: http://fasb.org/us-gaap/role/ref/legacyRef
|
| X | ||||||||||
- Definition Percentage of lesser of purchase or sale of portfolio securities to average value of portfolio securities owned. Reference 1: http://www.xbrl.org/2009/role/commonPracticeRef
|
| X | ||||||||||
- Details
|