The bar chart and average annual total returns table below illustrate the risks of investing in the Fund by showing changes in the Fund’s performance from year-to-year and by showing how the Fund’s average annual total returns compare with those of a broad measure of market performance, respectively. The Fund’s past performance (before and after taxes) does not necessarily indicate how the Fund will perform in the future.
Visit https://www.canterburygroup.com/mutualfund or call (844) 838-2121 for current performance information.
The bar chart shows the changes in annual total returns on a calendar year-by-year basis for the Fund’s Institutional Shares.
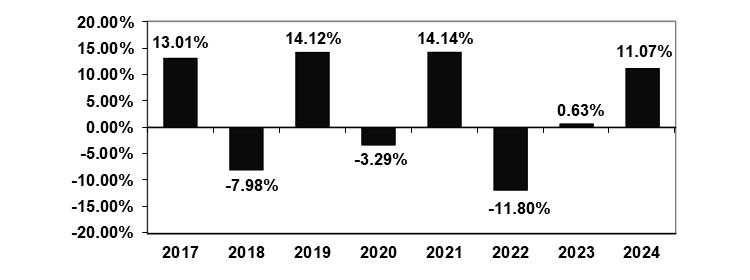
During the period shown in the bar chart, the highest return for a quarter was 8.15% for the quarter ended March 31, 2021 and the lowest return for a quarter was (17.37)% for the quarter ended March 31, 2020. The Fund’s Institutional Shares year-to-date return as of June 30, 2025 was 2.45%.
The average annual total returns table shows how the Fund’s average annual returns compare with those of its benchmark, the MSCI World Index.
| 1 Year | 5 Years | Since inception(1) | ||||
| Canterbury Portfolio Thermostat Fund – Institutional Shares | ||||||
| Return Before Taxes | 11.07% | 1.70% | 3.25% | |||
| Return After Taxes on Distributions(2)(3) | 11.07% | 1.02% | 2.72% | |||
| Return After Taxes on Distributions and Sale of Fund Shares(2)(3) | 6.55% | 1.22% | 2.47% | |||
| MSCI World Index(4) | 19.19% | 11.70% | 12.10% |
| (1) | The inception of the Fund was August 2, 2016. |
| (2) | After-tax returns are calculated using the historical highest individual federal marginal income tax rates and do not reflect the impact of state and local taxes. |
| (3) | Actual after-tax returns depend on an investor’s tax situation and may differ from those shown. After-tax returns shown are not relevant to investors who hold their Fund shares through tax-deferred arrangements, such as 401(k) plans or individual retirement accounts. The Return After Taxes on Distributions and Sale of Fund Shares for a period may be greater than the Return After Taxes on Distributions for the same period if there was a loss realized on the sale of Fund shares. The benefit of the tax loss (to the extent it can be used to offset other gains) may result in a higher return. |
| (4) | The MSCI World Index is an unmanaged free float-adjusted market capitalization index that is designed to measure global developed market equity performance. Currently, the MSCI World Index consists of the following 23 developed market country indices: Australia, Austria, Belgium, Canada, Denmark, Finland, France, Germany, Hong Kong, Ireland, Israel, Italy, Japan, Netherlands, New Zealand, Norway, Portugal, Singapore, Spain, Sweden, Switzerland, the United Kingdom and the United States. The performance of the index is expressed in terms of U.S. dollars, and does not reflect the deduction of fees or taxes with a mutual fund, such as investment management and fund accounting fees. An individual cannot invest directly in an index. |