Shareholder Report
|
6 Months Ended |
|
Jun. 30, 2025
USD ($)
Holding
|
|---|
| Shareholder Report [Line Items] |
|
|
| Document Type |
N-CSRS
|
|
| Amendment Flag |
false
|
|
| Registrant Name |
Morgan Stanley Variable Insurance Fund, Inc.
|
|
| Entity Central Index Key |
0001011378
|
|
| Entity Investment Company Type |
N-1A
|
|
| Document Period End Date |
Jun. 30, 2025
|
|
| C000011741 |
|
|
| Shareholder Report [Line Items] |
|
|
| Fund Name |
Morgan Stanley Variable Insurance Fund, Inc. - Discovery Portfolio
|
|
| Class Name |
I
|
|
| Trading Symbol |
MMGPX
|
|
| Annual or Semi-Annual Statement [Text Block] |
This semi-annual shareholder report contains important information about Morgan Stanley Variable Insurance Fund, Inc. - Discovery Portfolio for the period of January 1, 2025 to June 30, 2025.
|
|
| Shareholder Report Annual or Semi-Annual |
Semi-Annual Shareholder Report
|
|
| Additional Information [Text Block] |
You can find additional information about the Fund at www.morganstanley.com/im/shareholderreports. You can also request this information by contacting us at 1-800-869-6397.
|
|
| Additional Information Phone Number |
1-800-869-6397
|
|
| Additional Information Website |
<span style="box-sizing: border-box; color: rgb(0, 0, 0); display: inline; flex-wrap: nowrap; font-size: 10.6667px; font-weight: 400; grid-area: auto; line-height: 16px; margin: 0px; overflow: visible; text-align: left; text-align-last: auto; white-space-collapse: preserve-breaks;">www.morganstanley.com/im/shareholderreports</span>
|
|
| Expenses [Text Block] |
What were the Fund costs for the last six months?Footnote Reference1(based on a hypothetical $10,000 investment) Class Name | Costs of a $10,000 investment | Costs paid as a percentage of a $10,000 investment |
|---|
Class I | $52 | 0.95%Footnote Reference2 |
|---|
| Footnote | Description | Footnote1 | Does not reflect fees and expenses imposed by your insurance company. You may pay fees other than the fees and expenses of the Fund, such as brokerage commissions and other fees charged by financial intermediaries. | Footnote2 | Annualized |
|
|
| Expenses Paid, Amount |
$ 52
|
|
| Expense Ratio, Percent |
0.95%
|
[1] |
| AssetsNet |
$ 223,823,319
|
|
| Holdings Count | Holding |
35
|
|
| InvestmentCompanyPortfolioTurnover |
52.00%
|
|
| Additional Fund Statistics [Text Block] |
Total Net Assets | $223,823,319 |
|---|
# of Portfolio Holdings | 35 |
|---|
Portfolio Turnover Rate | 52% |
|---|
|
|
| Holdings [Text Block] |
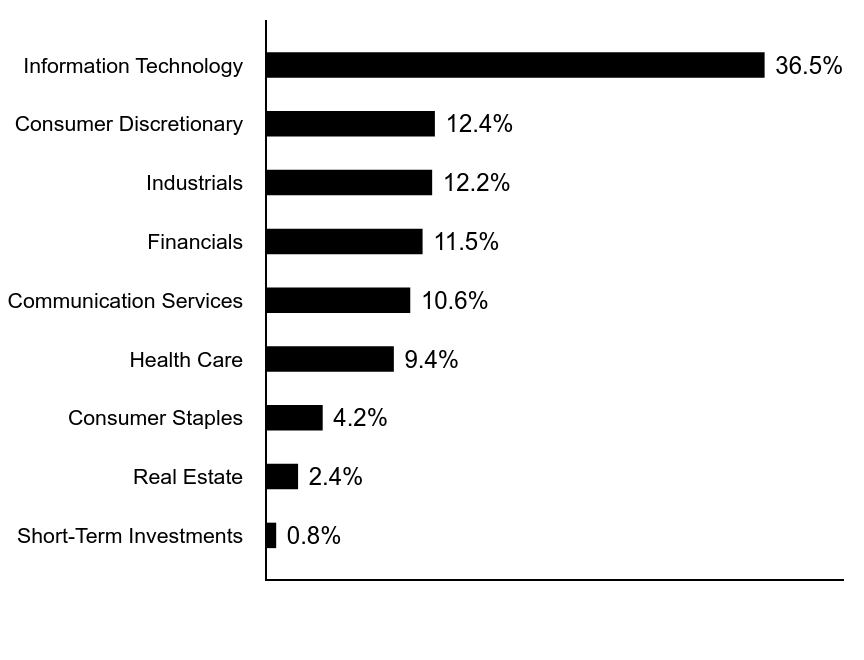
Sector Allocation (% of total investments)Value | Value |
|---|
Short-Term Investments | 0.8% | Real Estate | 2.4% | Consumer Staples | 4.2% | Health Care | 9.4% | Communication Services | 10.6% | Financials | 11.5% | Industrials | 12.2% | Consumer Discretionary | 12.4% | Information Technology | 36.5% |
|
|
| Largest Holdings [Text Block] |
Top Ten Holdings (% of total investments)Footnote ReferenceaCloudflare, Inc. | 12.9% |
|---|
QXO, Inc. | 6.4% |
|---|
Affirm Holdings, Inc. | 6.4% |
|---|
MicroStrategy, Inc. | 6.2% |
|---|
ROBLOX Corp. | 5.9% |
|---|
Core & Main, Inc. | 5.1% |
|---|
IonQ, Inc. | 5.0% |
|---|
Royalty Pharma PLC | 4.8% |
|---|
Trade Desk, Inc. | 4.7% |
|---|
Snowflake, Inc. | 3.6% |
|---|
Total | 61.0% |
|---|
| Footnote | Description | Footnotea | Excluding cash equivalents. |
|
|
| Updated Prospectus Web Address |
<span style="box-sizing: border-box; color: rgb(0, 0, 0); display: inline; flex-wrap: nowrap; font-size: 10.6667px; font-weight: 400; grid-area: auto; line-height: 16px; margin: 0px; overflow: visible; text-align: left; text-align-last: auto; white-space-collapse: preserve-breaks;">www.morganstanley.com/im/shareholderreports</span>
|
|
| C000011740 |
|
|
| Shareholder Report [Line Items] |
|
|
| Fund Name |
Morgan Stanley Variable Insurance Fund, Inc. - Discovery Portfolio
|
|
| Class Name |
II
|
|
| Trading Symbol |
MMGTX
|
|
| Annual or Semi-Annual Statement [Text Block] |
This semi-annual shareholder report contains important information about Morgan Stanley Variable Insurance Fund, Inc. - Discovery Portfolio for the period of January 1, 2025 to June 30, 2025.
|
|
| Shareholder Report Annual or Semi-Annual |
Semi-Annual Shareholder Report
|
|
| Additional Information [Text Block] |
You can find additional information about the Fund at www.morganstanley.com/im/shareholderreports. You can also request this information by contacting us at 1-800-869-6397.
|
|
| Additional Information Phone Number |
1-800-869-6397
|
|
| Additional Information Website |
<span style="box-sizing: border-box; color: rgb(0, 0, 0); display: inline; flex-wrap: nowrap; font-size: 10.6667px; font-weight: 400; grid-area: auto; line-height: 16px; margin: 0px; overflow: visible; text-align: left; text-align-last: auto; white-space-collapse: preserve-breaks;">www.morganstanley.com/im/shareholderreports</span>
|
|
| Expenses [Text Block] |
What were the Fund costs for the last six months?Footnote Reference1(based on a hypothetical $10,000 investment) Class Name | Costs of a $10,000 investment | Costs paid as a percentage of a $10,000 investment |
|---|
Class II | $58 | 1.05%Footnote Reference2 |
|---|
| Footnote | Description | Footnote1 | Does not reflect fees and expenses imposed by your insurance company. You may pay fees other than the fees and expenses of the Fund, such as brokerage commissions and other fees charged by financial intermediaries. | Footnote2 | Annualized |
|
|
| Expenses Paid, Amount |
$ 58
|
|
| Expense Ratio, Percent |
1.05%
|
[2] |
| AssetsNet |
$ 223,823,319
|
|
| Holdings Count | Holding |
35
|
|
| InvestmentCompanyPortfolioTurnover |
52.00%
|
|
| Additional Fund Statistics [Text Block] |
Total Net Assets | $223,823,319 |
|---|
# of Portfolio Holdings | 35 |
|---|
Portfolio Turnover Rate | 52% |
|---|
|
|
| Holdings [Text Block] |
Sector Allocation (% of total investments)Value | Value |
|---|
Short-Term Investments | 0.8% | Real Estate | 2.4% | Consumer Staples | 4.2% | Health Care | 9.4% | Communication Services | 10.6% | Financials | 11.5% | Industrials | 12.2% | Consumer Discretionary | 12.4% | Information Technology | 36.5% |
|
|
| Largest Holdings [Text Block] |
Top Ten Holdings (% of total investments)Footnote ReferenceaCloudflare, Inc. | 12.9% |
|---|
QXO, Inc. | 6.4% |
|---|
Affirm Holdings, Inc. | 6.4% |
|---|
MicroStrategy, Inc. | 6.2% |
|---|
ROBLOX Corp. | 5.9% |
|---|
Core & Main, Inc. | 5.1% |
|---|
IonQ, Inc. | 5.0% |
|---|
Royalty Pharma PLC | 4.8% |
|---|
Trade Desk, Inc. | 4.7% |
|---|
Snowflake, Inc. | 3.6% |
|---|
Total | 61.0% |
|---|
| Footnote | Description | Footnotea | Excluding cash equivalents. |
|
|
| Updated Prospectus Web Address |
<span style="box-sizing: border-box; color: rgb(0, 0, 0); display: inline; flex-wrap: nowrap; font-size: 10.6667px; font-weight: 400; grid-area: auto; line-height: 16px; margin: 0px; overflow: visible; text-align: left; text-align-last: auto; white-space-collapse: preserve-breaks;">www.morganstanley.com/im/shareholderreports</span>
|
|
| C000011754 |
|
|
| Shareholder Report [Line Items] |
|
|
| Fund Name |
Morgan Stanley Variable Insurance Fund, Inc. - Emerging Markets Equity Portfolio
|
|
| Class Name |
I
|
|
| Trading Symbol |
MEMEX
|
|
| Annual or Semi-Annual Statement [Text Block] |
This semi-annual shareholder report contains important information about Morgan Stanley Variable Insurance Fund, Inc. - Emerging Markets Equity Portfolio for the period of January 1, 2025 to June 30, 2025.
|
|
| Shareholder Report Annual or Semi-Annual |
Semi-Annual Shareholder Report
|
|
| Additional Information [Text Block] |
You can find additional information about the Fund at www.morganstanley.com/im/shareholderreports. You can also request this information by contacting us at 1-800-869-6397.
|
|
| Additional Information Phone Number |
1-800-869-6397
|
|
| Additional Information Website |
<span style="box-sizing: border-box; color: rgb(0, 0, 0); display: inline; flex-wrap: nowrap; font-size: 10.6667px; font-weight: 400; grid-area: auto; line-height: 16px; margin: 0px; overflow: visible; text-align: left; text-align-last: auto; white-space-collapse: preserve-breaks;">www.morganstanley.com/im/shareholderreports</span>
|
|
| Expenses [Text Block] |
What were the Fund costs for the last six months?Footnote Reference1(based on a hypothetical $10,000 investment) Class Name | Costs of a $10,000 investment | Costs paid as a percentage of a $10,000 investment |
|---|
Class I | $66 | 1.25%Footnote Reference2 |
|---|
| Footnote | Description | Footnote1 | Does not reflect fees and expenses imposed by your insurance company. You may pay fees other than the fees and expenses of the Fund, such as brokerage commissions and other fees charged by financial intermediaries. | Footnote2 | Annualized |
|
|
| Expenses Paid, Amount |
$ 66
|
|
| Expense Ratio, Percent |
1.25%
|
[3] |
| AssetsNet |
$ 162,831,213
|
|
| Holdings Count | Holding |
92
|
|
| InvestmentCompanyPortfolioTurnover |
14.00%
|
|
| Additional Fund Statistics [Text Block] |
Total Net Assets | $162,831,213 |
|---|
# of Portfolio Holdings | 92 |
|---|
Portfolio Turnover Rate | 14% |
|---|
|
|
| Holdings [Text Block] |
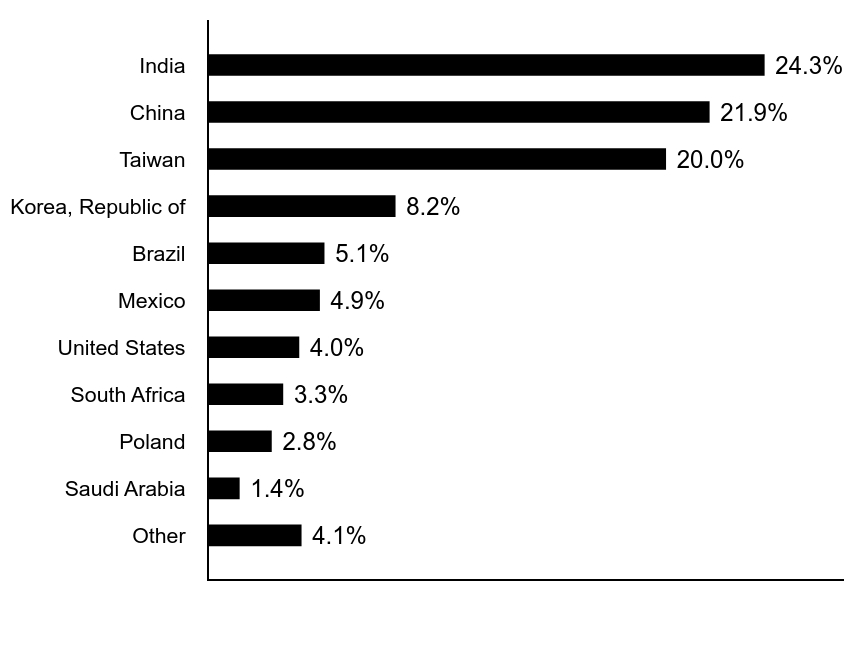
Country Allocation (% of total investments)Value | Value |
|---|
Other | 4.1% | Saudi Arabia | 1.4% | Poland | 2.8% | South Africa | 3.3% | United States | 4.0% | Mexico | 4.9% | Brazil | 5.1% | Korea, Republic of | 8.2% | Taiwan | 20.0% | China | 21.9% | India | 24.3% |
|
|
| Largest Holdings [Text Block] |
Top Ten Holdings (% of total investments)Footnote ReferenceaTaiwan Semiconductor Manufacturing Co. Ltd. | 12.7% |
|---|
Tencent Holdings Ltd. | 5.1% |
|---|
Samsung Electronics Co. Ltd. | 4.4% |
|---|
China Construction Bank Corp. | 2.5% |
|---|
Alibaba Group Holding Ltd. | 2.4% |
|---|
Reliance Industries Ltd. | 2.2% |
|---|
ICICI Bank Ltd. | 2.1% |
|---|
BYD Co. Ltd. | 1.9% |
|---|
HDFC Bank Ltd. | 1.9% |
|---|
WEG SA | 1.6% |
|---|
Total | 36.8% |
|---|
| Footnote | Description | Footnotea | Excluding cash equivalents. |
|
|
| Updated Prospectus Web Address |
<span style="box-sizing: border-box; color: rgb(0, 0, 0); display: inline; flex-wrap: nowrap; font-size: 10.6667px; font-weight: 400; grid-area: auto; line-height: 16px; margin: 0px; overflow: visible; text-align: left; text-align-last: auto; white-space-collapse: preserve-breaks;">www.morganstanley.com/im/shareholderreports</span>
|
|
| C000011753 |
|
|
| Shareholder Report [Line Items] |
|
|
| Fund Name |
Morgan Stanley Variable Insurance Fund, Inc. - Emerging Markets Equity Portfolio
|
|
| Class Name |
II
|
|
| Trading Symbol |
MSMBX
|
|
| Annual or Semi-Annual Statement [Text Block] |
This semi-annual shareholder report contains important information about Morgan Stanley Variable Insurance Fund, Inc. - Emerging Markets Equity Portfolio for the period of January 1, 2025 to June 30, 2025.
|
|
| Shareholder Report Annual or Semi-Annual |
Semi-Annual Shareholder Report
|
|
| Additional Information [Text Block] |
You can find additional information about the Fund at www.morganstanley.com/im/shareholderreports. You can also request this information by contacting us at 1-800-869-6397.
|
|
| Additional Information Phone Number |
1-800-869-6397
|
|
| Additional Information Website |
<span style="box-sizing: border-box; color: rgb(0, 0, 0); display: inline; flex-wrap: nowrap; font-size: 10.6667px; font-weight: 400; grid-area: auto; line-height: 16px; margin: 0px; overflow: visible; text-align: left; text-align-last: auto; white-space-collapse: preserve-breaks;">www.morganstanley.com/im/shareholderreports</span>
|
|
| Expenses [Text Block] |
What were the Fund costs for the last six months?Footnote Reference1(based on a hypothetical $10,000 investment) Class Name | Costs of a $10,000 investment | Costs paid as a percentage of a $10,000 investment |
|---|
Class II | $69 | 1.30%Footnote Reference2 |
|---|
| Footnote | Description | Footnote1 | Does not reflect fees and expenses imposed by your insurance company. You may pay fees other than the fees and expenses of the Fund, such as brokerage commissions and other fees charged by financial intermediaries. | Footnote2 | Annualized |
|
|
| Expenses Paid, Amount |
$ 69
|
|
| Expense Ratio, Percent |
1.30%
|
[4] |
| AssetsNet |
$ 162,831,213
|
|
| Holdings Count | Holding |
92
|
|
| InvestmentCompanyPortfolioTurnover |
14.00%
|
|
| Additional Fund Statistics [Text Block] |
Total Net Assets | $162,831,213 |
|---|
# of Portfolio Holdings | 92 |
|---|
Portfolio Turnover Rate | 14% |
|---|
|
|
| Holdings [Text Block] |
Country Allocation (% of total investments)Value | Value |
|---|
Other | 4.1% | Saudi Arabia | 1.4% | Poland | 2.8% | South Africa | 3.3% | United States | 4.0% | Mexico | 4.9% | Brazil | 5.1% | Korea, Republic of | 8.2% | Taiwan | 20.0% | China | 21.9% | India | 24.3% |
|
|
| Largest Holdings [Text Block] |
Top Ten Holdings (% of total investments)Footnote ReferenceaTaiwan Semiconductor Manufacturing Co. Ltd. | 12.7% |
|---|
Tencent Holdings Ltd. | 5.1% |
|---|
Samsung Electronics Co. Ltd. | 4.4% |
|---|
China Construction Bank Corp. | 2.5% |
|---|
Alibaba Group Holding Ltd. | 2.4% |
|---|
Reliance Industries Ltd. | 2.2% |
|---|
ICICI Bank Ltd. | 2.1% |
|---|
BYD Co. Ltd. | 1.9% |
|---|
HDFC Bank Ltd. | 1.9% |
|---|
WEG SA | 1.6% |
|---|
Total | 36.8% |
|---|
| Footnote | Description | Footnotea | Excluding cash equivalents. |
|
|
| Updated Prospectus Web Address |
<span style="box-sizing: border-box; color: rgb(0, 0, 0); display: inline; flex-wrap: nowrap; font-size: 10.6667px; font-weight: 400; grid-area: auto; line-height: 16px; margin: 0px; overflow: visible; text-align: left; text-align-last: auto; white-space-collapse: preserve-breaks;">www.morganstanley.com/im/shareholderreports</span>
|
|
| C000011764 |
|
|
| Shareholder Report [Line Items] |
|
|
| Fund Name |
Morgan Stanley Variable Insurance Fund, Inc. - Global Strategist Portfolio
|
|
| Class Name |
I
|
|
| Trading Symbol |
MIMPX
|
|
| Annual or Semi-Annual Statement [Text Block] |
This semi-annual shareholder report contains important information about Morgan Stanley Variable Insurance Fund, Inc. - Global Strategist Portfolio for the period of January 1, 2025 to June 30, 2025.
|
|
| Shareholder Report Annual or Semi-Annual |
Semi-Annual Shareholder Report
|
|
| Additional Information [Text Block] |
You can find additional information about the Fund at www.morganstanley.com/im/shareholderreports. You can also request this information by contacting us at 1-800-869-6397.
|
|
| Additional Information Phone Number |
1-800-869-6397
|
|
| Additional Information Website |
<span style="box-sizing: border-box; color: rgb(0, 0, 0); display: inline; flex-wrap: nowrap; font-size: 10.6667px; font-weight: 400; grid-area: auto; line-height: 16px; margin: 0px; overflow: visible; text-align: left; text-align-last: auto; white-space-collapse: preserve-breaks;">www.morganstanley.com/im/shareholderreports</span>
|
|
| Expenses [Text Block] |
What were the Fund costs for the last six months?Footnote Reference1(based on a hypothetical $10,000 investment) Class Name | Costs of a $10,000 investment | Costs paid as a percentage of a $10,000 investment |
|---|
Class I | $46 | 0.88%Footnote Reference2 |
|---|
| Footnote | Description | Footnote1 | Does not reflect fees and expenses imposed by your insurance company. You may pay fees other than the fees and expenses of the Fund, such as brokerage commissions and other fees charged by financial intermediaries. | Footnote2 | Annualized |
|
|
| Expenses Paid, Amount |
$ 46
|
|
| Expense Ratio, Percent |
0.88%
|
[5] |
| AssetsNet |
$ 82,264,133
|
|
| Holdings Count | Holding |
1,393
|
|
| InvestmentCompanyPortfolioTurnover |
55.00%
|
|
| Additional Fund Statistics [Text Block] |
Total Net Assets | $82,264,133 |
|---|
# of Portfolio Holdings | 1,393 |
|---|
Portfolio Turnover Rate | 55% |
|---|
|
|
| Holdings [Text Block] |
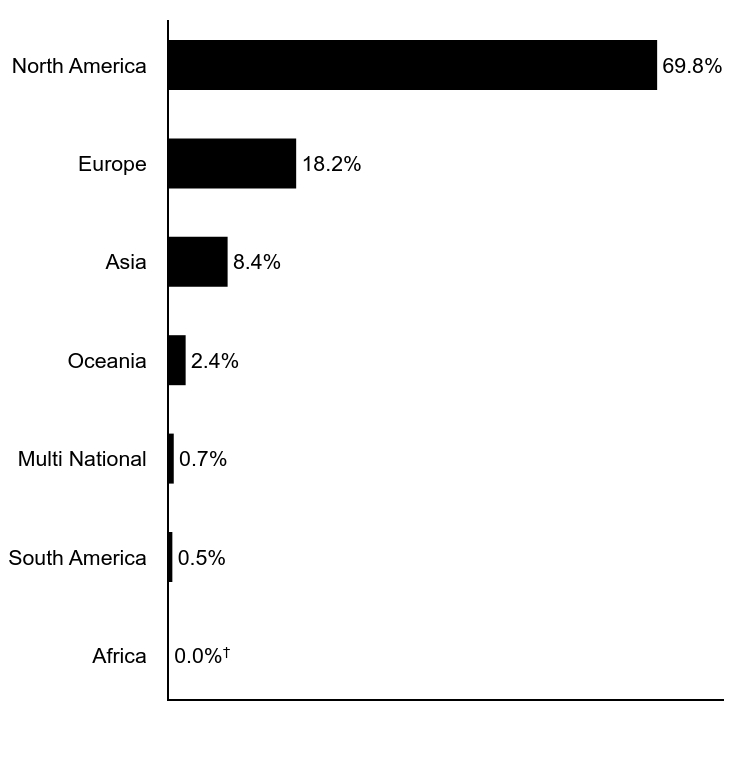
Geographic Allocation (% of total investments)Value | Value |
|---|
Africa | 0.0%Footnote Reference† | South America | 0.5% | Multi National | 0.7% | Oceania | 2.4% | Asia | 8.4% | Europe | 18.2% | North America | 69.8% |
| Footnote | Description | Footnote† | Amount is less than 0.05% |
|
|
| Credit Quality Explanation [Text Block] |
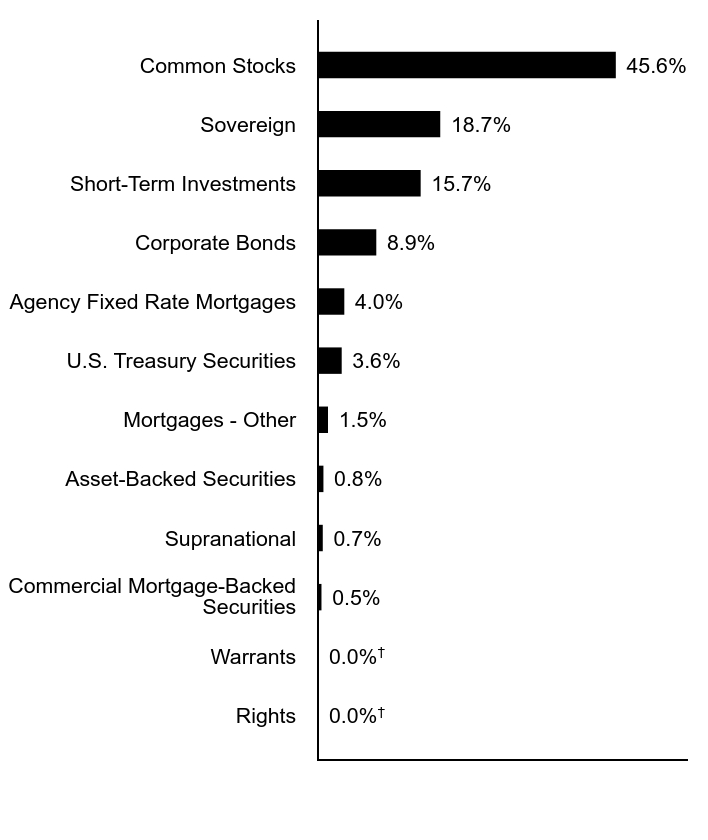
Asset Allocation (% of total investments)Value | Value |
|---|
Rights | 0.0%Footnote Reference† | Warrants | 0.0%Footnote Reference† | Commercial Mortgage-Backed Securities | 0.5% | Supranational | 0.7% | Asset-Backed Securities | 0.8% | Mortgages - Other | 1.5% | U.S. Treasury Securities | 3.6% | Agency Fixed Rate Mortgages | 4.0% | Corporate Bonds | 8.9% | Short-Term Investments | 15.7% | Sovereign | 18.7% | Common Stocks | 45.6% |
| Footnote | Description | Footnote† | Amount is less than 0.05% |
|
|
| Material Fund Change [Text Block] |
|
|
| Updated Prospectus Web Address |
<span style="box-sizing: border-box; color: rgb(0, 0, 0); display: inline; flex-wrap: nowrap; font-size: 10.6667px; font-weight: 400; grid-area: auto; line-height: 16px; margin: 0px; overflow: visible; text-align: left; text-align-last: auto; white-space-collapse: preserve-breaks;">www.morganstanley.com/im/shareholderreports</span>
|
|
| C000097939 |
|
|
| Shareholder Report [Line Items] |
|
|
| Fund Name |
Morgan Stanley Variable Insurance Fund, Inc. - Global Strategist Portfolio
|
|
| Class Name |
II
|
|
| Trading Symbol |
MGTPX
|
|
| Annual or Semi-Annual Statement [Text Block] |
This semi-annual shareholder report contains important information about Morgan Stanley Variable Insurance Fund, Inc. - Global Strategist Portfolio for the period of January 1, 2025 to June 30, 2025.
|
|
| Shareholder Report Annual or Semi-Annual |
Semi-Annual Shareholder Report
|
|
| Additional Information [Text Block] |
You can find additional information about the Fund at www.morganstanley.com/im/shareholderreports. You can also request this information by contacting us at 1-800-869-6397.
|
|
| Additional Information Phone Number |
1-800-869-6397
|
|
| Additional Information Website |
<span style="box-sizing: border-box; color: rgb(0, 0, 0); display: inline; flex-wrap: nowrap; font-size: 10.6667px; font-weight: 400; grid-area: auto; line-height: 16px; margin: 0px; overflow: visible; text-align: left; text-align-last: auto; white-space-collapse: preserve-breaks;">www.morganstanley.com/im/shareholderreports</span>
|
|
| Expenses [Text Block] |
What were the Fund costs for the last six months?Footnote Reference1(based on a hypothetical $10,000 investment) Class Name | Costs of a $10,000 investment | Costs paid as a percentage of a $10,000 investment |
|---|
Class II | $51 | 0.98%Footnote Reference2 |
|---|
| Footnote | Description | Footnote1 | Does not reflect fees and expenses imposed by your insurance company. You may pay fees other than the fees and expenses of the Fund, such as brokerage commissions and other fees charged by financial intermediaries. | Footnote2 | Annualized |
|
|
| Expenses Paid, Amount |
$ 51
|
|
| Expense Ratio, Percent |
0.98%
|
[6] |
| AssetsNet |
$ 82,264,133
|
|
| Holdings Count | Holding |
1,393
|
|
| InvestmentCompanyPortfolioTurnover |
55.00%
|
|
| Additional Fund Statistics [Text Block] |
Total Net Assets | $82,264,133 |
|---|
# of Portfolio Holdings | 1,393 |
|---|
Portfolio Turnover Rate | 55% |
|---|
|
|
| Holdings [Text Block] |
Geographic Allocation (% of total investments)Value | Value |
|---|
Africa | 0.0%Footnote Reference† | South America | 0.5% | Multi National | 0.7% | Oceania | 2.4% | Asia | 8.4% | Europe | 18.2% | North America | 69.8% |
| Footnote | Description | Footnote† | Amount is less than 0.05% |
|
|
| Credit Quality Explanation [Text Block] |
Asset Allocation (% of total investments)Value | Value |
|---|
Rights | 0.0%Footnote Reference† | Warrants | 0.0%Footnote Reference† | Commercial Mortgage-Backed Securities | 0.5% | Supranational | 0.7% | Asset-Backed Securities | 0.8% | Mortgages - Other | 1.5% | U.S. Treasury Securities | 3.6% | Agency Fixed Rate Mortgages | 4.0% | Corporate Bonds | 8.9% | Short-Term Investments | 15.7% | Sovereign | 18.7% | Common Stocks | 45.6% |
| Footnote | Description | Footnote† | Amount is less than 0.05% |
|
|
| Material Fund Change [Text Block] |
|
|
| Updated Prospectus Web Address |
<span style="box-sizing: border-box; color: rgb(0, 0, 0); display: inline; flex-wrap: nowrap; font-size: 10.6667px; font-weight: 400; grid-area: auto; line-height: 16px; margin: 0px; overflow: visible; text-align: left; text-align-last: auto; white-space-collapse: preserve-breaks;">www.morganstanley.com/im/shareholderreports</span>
|
|
| C000011757 |
|
|
| Shareholder Report [Line Items] |
|
|
| Fund Name |
Morgan Stanley Variable Insurance Fund, Inc. - Growth Portfolio
|
|
| Class Name |
I
|
|
| Trading Symbol |
MEGIX
|
|
| Annual or Semi-Annual Statement [Text Block] |
This semi-annual shareholder report contains important information about Morgan Stanley Variable Insurance Fund, Inc. - Growth Portfolio for the period of January 1, 2025 to June 30, 2025.
|
|
| Shareholder Report Annual or Semi-Annual |
Semi-Annual Shareholder Report
|
|
| Additional Information [Text Block] |
You can find additional information about the Fund at www.morganstanley.com/im/shareholderreports. You can also request this information by contacting us at 1-800-869-6397.
|
|
| Additional Information Phone Number |
1-800-869-6397
|
|
| Additional Information Website |
<span style="box-sizing: border-box; color: rgb(0, 0, 0); display: inline; flex-wrap: nowrap; font-size: 10.6667px; font-weight: 400; grid-area: auto; line-height: 16px; margin: 0px; overflow: visible; text-align: left; text-align-last: auto; white-space-collapse: preserve-breaks;">www.morganstanley.com/im/shareholderreports</span>
|
|
| Expenses [Text Block] |
What were the Fund costs for the last six months?Footnote Reference1(based on a hypothetical $10,000 investment) Class Name | Costs of a $10,000 investment | Costs paid as a percentage of a $10,000 investment |
|---|
Class I | $32 | 0.56%Footnote Reference2 |
|---|
| Footnote | Description | Footnote1 | Does not reflect fees and expenses imposed by your insurance company. You may pay fees other than the fees and expenses of the Fund, such as brokerage commissions and other fees charged by financial intermediaries. | Footnote2 | Annualized |
|
|
| Expenses Paid, Amount |
$ 32
|
|
| Expense Ratio, Percent |
0.56%
|
[7] |
| AssetsNet |
$ 783,364,568
|
|
| Holdings Count | Holding |
29
|
|
| InvestmentCompanyPortfolioTurnover |
48.00%
|
|
| Additional Fund Statistics [Text Block] |
Total Net Assets | $783,364,568 |
|---|
# of Portfolio Holdings | 29 |
|---|
Portfolio Turnover Rate | 48% |
|---|
|
|
| Holdings [Text Block] |
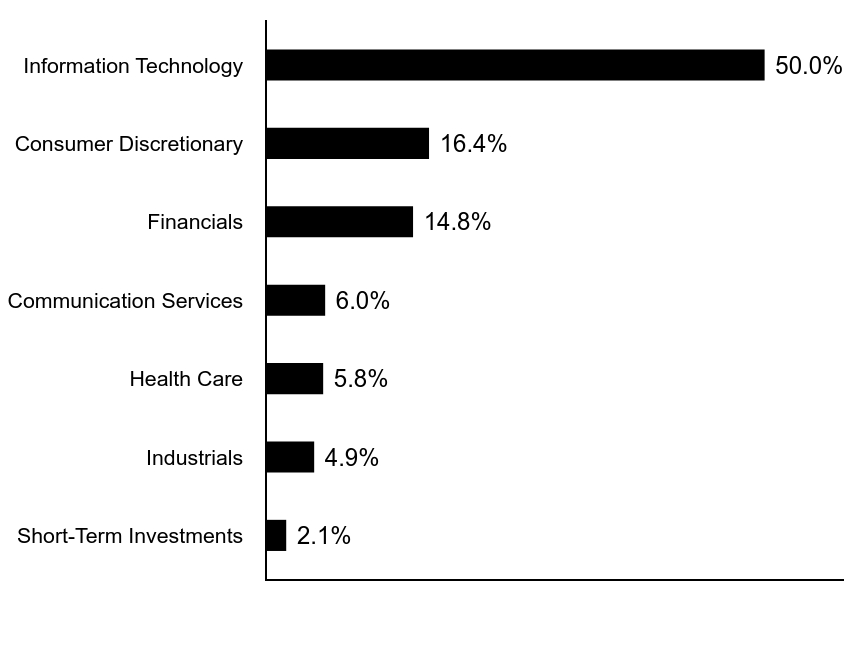
Sector Allocation (% of total investments)Value | Value |
|---|
Short-Term Investments | 2.1% | Industrials | 4.9% | Health Care | 5.8% | Communication Services | 6.0% | Financials | 14.8% | Consumer Discretionary | 16.4% | Information Technology | 50.0% |
|
|
| Largest Holdings [Text Block] |
Top Ten Holdings (% of total investments)Footnote ReferenceaCloudflare, Inc. | 12.4% |
|---|
MicroStrategy, Inc. | 6.6% |
|---|
Affirm Holdings, Inc. | 6.6% |
|---|
ROBLOX Corp. | 5.9% |
|---|
Tesla, Inc. | 5.7% |
|---|
AppLovin Corp. | 5.3% |
|---|
Shopify, Inc. | 4.9% |
|---|
DoorDash, Inc. | 4.8% |
|---|
MercadoLibre, Inc. | 4.8% |
|---|
Snowflake, Inc. | 4.8% |
|---|
Total | 61.8% |
|---|
| Footnote | Description | Footnotea | Excluding cash equivalents. |
|
|
| Updated Prospectus Web Address |
<span style="box-sizing: border-box; color: rgb(0, 0, 0); display: inline; flex-wrap: nowrap; font-size: 10.6667px; font-weight: 400; grid-area: auto; line-height: 16px; margin: 0px; overflow: visible; text-align: left; text-align-last: auto; white-space-collapse: preserve-breaks;">www.morganstanley.com/im/shareholderreports</span>
|
|
| C000011758 |
|
|
| Shareholder Report [Line Items] |
|
|
| Fund Name |
Morgan Stanley Variable Insurance Fund, Inc. - Growth Portfolio
|
|
| Class Name |
II
|
|
| Trading Symbol |
MEGTX
|
|
| Annual or Semi-Annual Statement [Text Block] |
This semi-annual shareholder report contains important information about Morgan Stanley Variable Insurance Fund, Inc. - Growth Portfolio for the period of January 1, 2025 to June 30, 2025.
|
|
| Shareholder Report Annual or Semi-Annual |
Semi-Annual Shareholder Report
|
|
| Additional Information [Text Block] |
You can find additional information about the Fund at www.morganstanley.com/im/shareholderreports. You can also request this information by contacting us at 1-800-869-6397.
|
|
| Additional Information Phone Number |
1-800-869-6397
|
|
| Additional Information Website |
<span style="box-sizing: border-box; color: rgb(0, 0, 0); display: inline; flex-wrap: nowrap; font-size: 10.6667px; font-weight: 400; grid-area: auto; line-height: 16px; margin: 0px; overflow: visible; text-align: left; text-align-last: auto; white-space-collapse: preserve-breaks;">www.morganstanley.com/im/shareholderreports</span>
|
|
| Expenses [Text Block] |
What were the Fund costs for the last six months?Footnote Reference1(based on a hypothetical $10,000 investment) Class Name | Costs of a $10,000 investment | Costs paid as a percentage of a $10,000 investment |
|---|
Class II | $46 | 0.81%Footnote Reference2 |
|---|
| Footnote | Description | Footnote1 | Does not reflect fees and expenses imposed by your insurance company. You may pay fees other than the fees and expenses of the Fund, such as brokerage commissions and other fees charged by financial intermediaries. | Footnote2 | Annualized |
|
|
| Expenses Paid, Amount |
$ 46
|
|
| Expense Ratio, Percent |
0.81%
|
[8] |
| AssetsNet |
$ 783,364,568
|
|
| Holdings Count | Holding |
29
|
|
| InvestmentCompanyPortfolioTurnover |
48.00%
|
|
| Additional Fund Statistics [Text Block] |
Total Net Assets | $783,364,568 |
|---|
# of Portfolio Holdings | 29 |
|---|
Portfolio Turnover Rate | 48% |
|---|
|
|
| Holdings [Text Block] |
Sector Allocation (% of total investments)Value | Value |
|---|
Short-Term Investments | 2.1% | Industrials | 4.9% | Health Care | 5.8% | Communication Services | 6.0% | Financials | 14.8% | Consumer Discretionary | 16.4% | Information Technology | 50.0% |
|
|
| Largest Holdings [Text Block] |
Top Ten Holdings (% of total investments)Footnote ReferenceaCloudflare, Inc. | 12.4% |
|---|
MicroStrategy, Inc. | 6.6% |
|---|
Affirm Holdings, Inc. | 6.6% |
|---|
ROBLOX Corp. | 5.9% |
|---|
Tesla, Inc. | 5.7% |
|---|
AppLovin Corp. | 5.3% |
|---|
Shopify, Inc. | 4.9% |
|---|
DoorDash, Inc. | 4.8% |
|---|
MercadoLibre, Inc. | 4.8% |
|---|
Snowflake, Inc. | 4.8% |
|---|
Total | 61.8% |
|---|
| Footnote | Description | Footnotea | Excluding cash equivalents. |
|
|
| Updated Prospectus Web Address |
<span style="box-sizing: border-box; color: rgb(0, 0, 0); display: inline; flex-wrap: nowrap; font-size: 10.6667px; font-weight: 400; grid-area: auto; line-height: 16px; margin: 0px; overflow: visible; text-align: left; text-align-last: auto; white-space-collapse: preserve-breaks;">www.morganstanley.com/im/shareholderreports</span>
|
|
| C000011752 |
|
|
| Shareholder Report [Line Items] |
|
|
| Fund Name |
Morgan Stanley Variable Insurance Fund, Inc. - Emerging Markets Debt Portfolio
|
|
| Class Name |
I
|
|
| Trading Symbol |
MEMNX
|
|
| Annual or Semi-Annual Statement [Text Block] |
This semi-annual shareholder report contains important information about Morgan Stanley Variable Insurance Fund, Inc. - Emerging Markets Debt Portfolio for the period of January 1, 2025 to June 30, 2025.
|
|
| Shareholder Report Annual or Semi-Annual |
Semi-Annual Shareholder Report
|
|
| Additional Information [Text Block] |
You can find additional information about the Fund at www.morganstanley.com/im/shareholderreports. You can also request this information by contacting us at 1-800-869-6397.
|
|
| Additional Information Phone Number |
1-800-869-6397
|
|
| Additional Information Website |
<span style="box-sizing: border-box; color: rgb(0, 0, 0); display: inline; flex-wrap: nowrap; font-size: 10.6667px; font-weight: 400; grid-area: auto; line-height: 16px; margin: 0px; overflow: visible; text-align: left; text-align-last: auto; white-space-collapse: preserve-breaks;">www.morganstanley.com/im/shareholderreports</span>
|
|
| Expenses [Text Block] |
What were the Fund costs for the last six months?Footnote Reference1(based on a hypothetical $10,000 investment) Class Name | Costs of a $10,000 investment | Costs paid as a percentage of a $10,000 investment |
|---|
Class I | $56 | 1.10%Footnote Reference2 |
|---|
| Footnote | Description | Footnote1 | Does not reflect fees and expenses imposed by your insurance company. You may pay fees other than the fees and expenses of the Fund, such as brokerage commissions and other fees charged by financial intermediaries. | Footnote2 | Annualized |
|
|
| Expenses Paid, Amount |
$ 56
|
|
| Expense Ratio, Percent |
1.10%
|
[9] |
| AssetsNet |
$ 103,868,068
|
|
| Holdings Count | Holding |
284
|
|
| InvestmentCompanyPortfolioTurnover |
65.00%
|
|
| Additional Fund Statistics [Text Block] |
Total Net Assets | $103,868,068 |
|---|
# of Portfolio Holdings | 284 |
|---|
Portfolio Turnover Rate | 65% |
|---|
|
|
| Holdings [Text Block] |
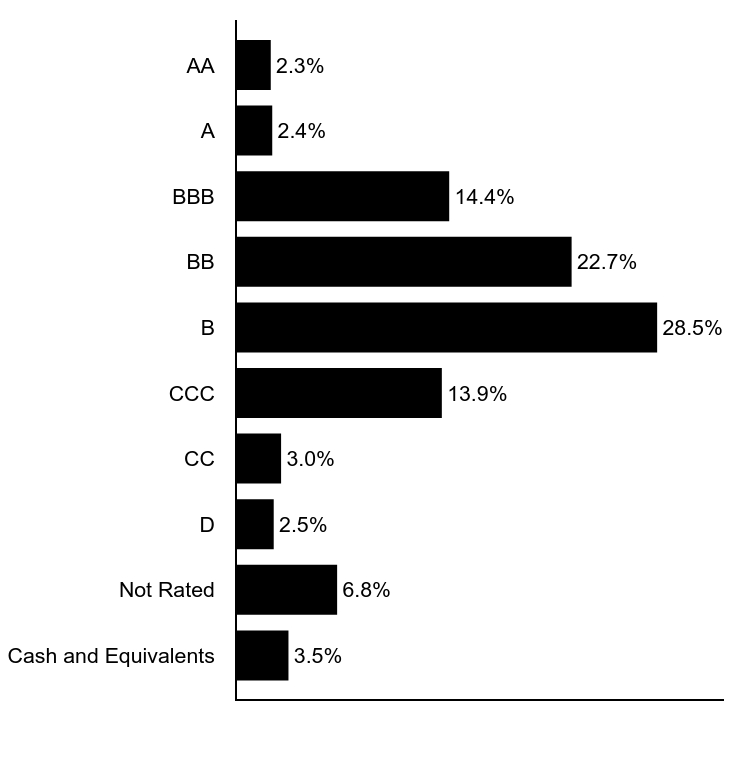
Credit Quality (% of net assets)Footnote Reference*Value | Value |
|---|
Cash and Equivalents | 3.5% | Not Rated | 6.8% | D | 2.5% | CC | 3.0% | CCC | 13.9% | B | 28.5% | BB | 22.7% | BBB | 14.4% | A | 2.4% | AA | 2.3% |
| Footnote | Description | Footnote* | Security ratings disclosed with the exception for those labeled “not rated” is an aggregation of the highest security level rating amongst S&P Global Ratings, Moody’s Investors Services, Inc., and Fitch Ratings, each a Nationally Recognized Statistical Ratings Organization (“NRSRO”). |
|
|
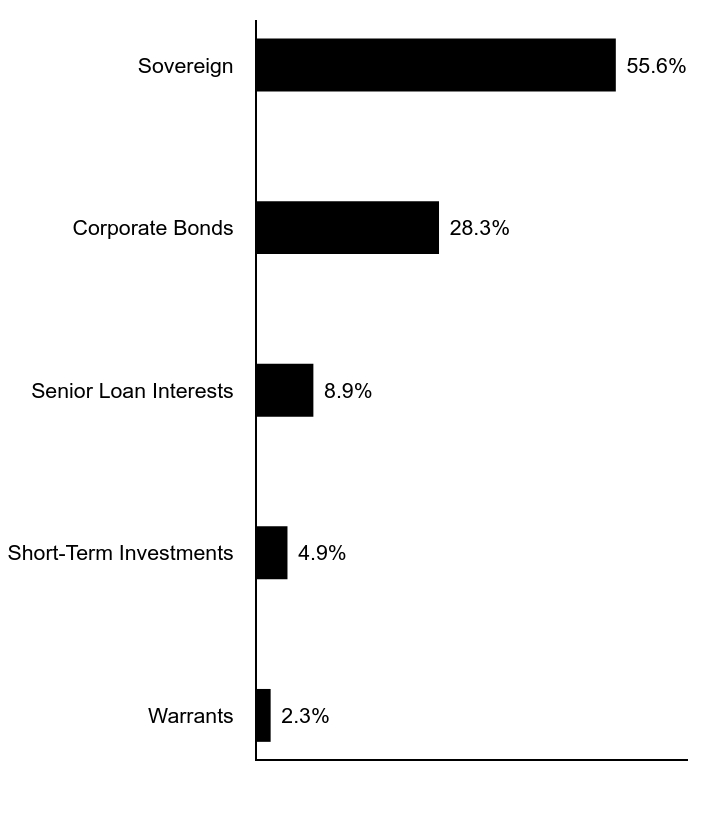
| Credit Quality Explanation [Text Block] |
Asset Allocation (% of total investments)Value | Value |
|---|
Warrants | 2.3% | Short-Term Investments | 4.9% | Senior Loan Interests | 8.9% | Corporate Bonds | 28.3% | Sovereign | 55.6% |
|
|
| Material Fund Change [Text Block] |
|
|
| Updated Prospectus Web Address |
<span style="box-sizing: border-box; color: rgb(0, 0, 0); display: inline; flex-wrap: nowrap; font-size: 10.6667px; font-weight: 400; grid-area: auto; line-height: 16px; margin: 0px; overflow: visible; text-align: left; text-align-last: auto; white-space-collapse: preserve-breaks;">www.morganstanley.com/im/shareholderreports</span>
|
|
| C000011751 |
|
|
| Shareholder Report [Line Items] |
|
|
| Fund Name |
Morgan Stanley Variable Insurance Fund, Inc. - Emerging Markets Debt Portfolio
|
|
| Class Name |
II
|
|
| Trading Symbol |
MBDBX
|
|
| Annual or Semi-Annual Statement [Text Block] |
This semi-annual shareholder report contains important information about Morgan Stanley Variable Insurance Fund, Inc. - Emerging Markets Debt Portfolio for the period of January 1, 2025 to June 30, 2025.
|
|
| Shareholder Report Annual or Semi-Annual |
Semi-Annual Shareholder Report
|
|
| Additional Information [Text Block] |
You can find additional information about the Fund at www.morganstanley.com/im/shareholderreports. You can also request this information by contacting us at 1-800-869-6397.
|
|
| Additional Information Phone Number |
1-800-869-6397
|
|
| Additional Information Website |
<span style="box-sizing: border-box; color: rgb(0, 0, 0); display: inline; flex-wrap: nowrap; font-size: 10.6667px; font-weight: 400; grid-area: auto; line-height: 16px; margin: 0px; overflow: visible; text-align: left; text-align-last: auto; white-space-collapse: preserve-breaks;">www.morganstanley.com/im/shareholderreports</span>
|
|
| Expenses [Text Block] |
What were the Fund costs for the last six months?Footnote Reference1(based on a hypothetical $10,000 investment) Class Name | Costs of a $10,000 investment | Costs paid as a percentage of a $10,000 investment |
|---|
Class II | $59 | 1.15%Footnote Reference2 |
|---|
| Footnote | Description | Footnote1 | Does not reflect fees and expenses imposed by your insurance company. You may pay fees other than the fees and expenses of the Fund, such as brokerage commissions and other fees charged by financial intermediaries. | Footnote2 | Annualized |
|
|
| Expenses Paid, Amount |
$ 59
|
|
| Expense Ratio, Percent |
1.15%
|
[10] |
| AssetsNet |
$ 103,868,068
|
|
| Holdings Count | Holding |
284
|
|
| InvestmentCompanyPortfolioTurnover |
65.00%
|
|
| Additional Fund Statistics [Text Block] |
Total Net Assets | $103,868,068 |
|---|
# of Portfolio Holdings | 284 |
|---|
Portfolio Turnover Rate | 65% |
|---|
|
|
| Holdings [Text Block] |
Credit Quality (% of net assets)Footnote Reference*Value | Value |
|---|
Cash and Equivalents | 3.5% | Not Rated | 6.8% | D | 2.5% | CC | 3.0% | CCC | 13.9% | B | 28.5% | BB | 22.7% | BBB | 14.4% | A | 2.4% | AA | 2.3% |
| Footnote | Description | Footnote* | Security ratings disclosed with the exception for those labeled “not rated” is an aggregation of the highest security level rating amongst S&P Global Ratings, Moody’s Investors Services, Inc., and Fitch Ratings, each a Nationally Recognized Statistical Ratings Organization (“NRSRO”). |
|
|
| Credit Quality Explanation [Text Block] |
Asset Allocation (% of total investments)Value | Value |
|---|
Warrants | 2.3% | Short-Term Investments | 4.9% | Senior Loan Interests | 8.9% | Corporate Bonds | 28.3% | Sovereign | 55.6% |
|
|
| Material Fund Change [Text Block] |
|
|
| Updated Prospectus Web Address |
<span style="box-sizing: border-box; color: rgb(0, 0, 0); display: inline; flex-wrap: nowrap; font-size: 10.6667px; font-weight: 400; grid-area: auto; line-height: 16px; margin: 0px; overflow: visible; text-align: left; text-align-last: auto; white-space-collapse: preserve-breaks;">www.morganstanley.com/im/shareholderreports</span>
|
|
|
|