Shareholder Report
Jun. 30, 2025
USD ($)
Holding
This report describes certain changes to the Fund that occurred during the reporting period.
FUND EXPENSES
What were the fund costs for the last year?
| (based on a hypothetical $10,000 investment) | ||
| Class Name | Costs of a $10,000 investment | Costs paid as a percentage of a $10,000 investment |
| R6 | $69 | 0.64% |
MANAGEMENT'S DISCUSSION OF FUND PERFORMANCE
-
For the twelve months ended June 30, 2025, Class R6 shares of the MFS International Equity Fund (fund) provided a total return of 16.69%, at net asset value. This compares with a return of 17.73% for the fund’s benchmark, the MSCI EAFE (Europe, Australasia, Far East) Index (net div).
-
Global equity markets reached record levels during the period withstanding considerable volatility amid tariffs, geopolitical conflict and high levels of uncertainty. In Europe, renewed focus on defense and infrastructure spending brightened the outlook.
-
Market volatility rose toward the end of the period as the Trump administration imposed, then suspended for 90-days, an array of tariffs on most US trading partners. Sector level tariffs remained in place. A temporary truce was reached separately with China, although tensions remained high as negotiations continued.
-
Moderating inflation pressures allowed many global central banks to ease monetary policy during the period. Amid a difficult policymaking environment, the Federal Reserve stayed on the sidelines, awaiting greater clarity on the impact of tariffs.
-
Top contributors to performance relative to the MSCI EAFE Index:
-
Security selection within both the information technology and consumer discretionary sectors strengthened relative performance.
-
-
Top detractors from performance relative to the MSCI EAFE Index:
-
Security selection and, to a lesser extent, an underweight allocation to the financials sector weakened the fund's relative performance.
-
Stock selection within the consumer staples sector further weighed on the fund's relative returns.
-
FUND PERFORMANCE
The fund’s past performance is not a good predictor of the fund’s future performance. The graph and table below do not reflect the deduction of taxes that a shareholder would pay on fund distributions or the redemption of fund shares. The graph and table below assume reinvestment of dividends and capital gain distributions.
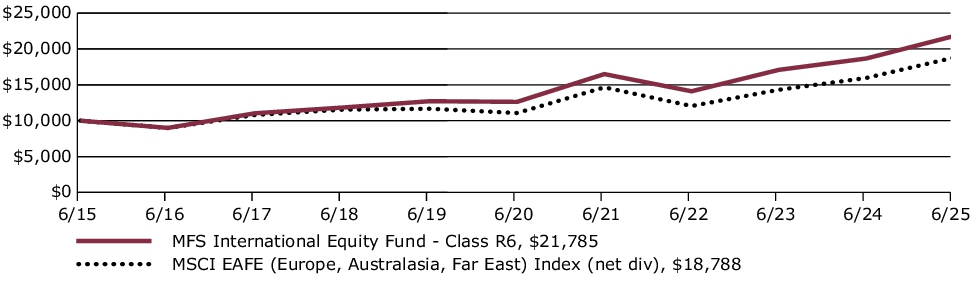
Growth of a Hypothetical $10,000 Investment
This graph shows the performance of a hypothetical $10,000 investment in Class R6 over a ten year period or since inception, if shorter, in comparison to a broad measure of market performance.
Average Annual Total Returns through 6/30/25
This table shows the average annual total returns of the class of shares noted for the periods shown, both with (if any) and without sales charges. It also shows the average annual total returns of a broad measure of market performance over the same periods.
| Share Class | 1-yr | 5-yr | 10-yr |
| R6 without sales charge | 16.69% | 11.53% | 8.10% |
| Comparative Benchmark(s) | |||
| MSCI EAFE (Europe, Australasia, Far East) Index (net div) ∆ | 17.73% | 11.16% | 6.51% |
|
∆ |
Source: FactSet Research Systems Inc. |
Visit mfs.com/perf/r6 for more recent performance information.
FUND STATISTICS AS OF 6/30/25
| Net Assets ($): | 28,905,082,239 | Total Management Fee ($)#: | 146,964,144 | |
| Total Number of Holdings: | 80 | Portfolio Turnover Rate (%): | 13 |
# Includes the effect of any management fee waivers, if applicable.
Where the fund holds derivatives, they are not included in the total number of portfolio holdings.
PORTFOLIO COMPOSITION (BASED ON TOTAL INVESTMENTS AS OF 6/30/25)
Portfolio structure
| Equities | 98.6% |
| Money Market Funds | 1.4% |
Top ten holdings
| Hitachi Ltd. | 3.0% |
| SAP SE | 2.9% |
| Air Liquide S.A. | 2.9% |
| Schneider Electric SE | 2.7% |
| Rolls-Royce Holdings PLC | 2.4% |
| Roche Holding AG | 2.3% |
| Compass Group PLC | 2.3% |
| Compagnie Financiere Richemont S.A. | 2.2% |
| Deutsche Boerse AG | 2.2% |
| Taiwan Semiconductor Manufacturing Co. Ltd., ADR | 2.1% |
Issuer country weightings
| Japan | 19.2% |
| France | 18.5% |
| United Kingdom | 13.8% |
| Switzerland | 12.6% |
| Germany | 9.6% |
| Canada | 3.3% |
| Ireland | 2.8% |
| Denmark | 2.5% |
| Italy | 2.5% |
| Other Countries | 15.2% |
Top ten holdings
| Hitachi Ltd. | 3.0% |
| SAP SE | 2.9% |
| Air Liquide S.A. | 2.9% |
| Schneider Electric SE | 2.7% |
| Rolls-Royce Holdings PLC | 2.4% |
| Roche Holding AG | 2.3% |
| Compass Group PLC | 2.3% |
| Compagnie Financiere Richemont S.A. | 2.2% |
| Deutsche Boerse AG | 2.2% |
| Taiwan Semiconductor Manufacturing Co. Ltd., ADR | 2.1% |
MATERIAL FUND CHANGES
This is a summary of certain changes to the fund from July 1, 2024 through June 30, 2025. For more complete information, you may review the fund's prospectus as amended, which is available at funds.mfs.com or upon request at 1‑800‑225‑2606.
Effective August 1, 2024, the management fee is computed daily and paid monthly at the following annual rates based on the fund’s average daily net assets: 0.75% up to $1 billion; 0.70% in excess of $1 billion and up to $2.5 billion; 0.65% in excess of $2.5 billion and up to $10 billion; 0.60% in excess of $10 billion and up to $20 billion; 0.55% in excess of $20 billion and up to $25 billion; 0.525% in excess of $25 billion.
Effective August 1, 2024, the management fee is computed daily and paid monthly at the following annual rates based on the fund’s average daily net assets: 0.75% up to $1 billion; 0.70% in excess of $1 billion and up to $2.5 billion; 0.65% in excess of $2.5 billion and up to $10 billion; 0.60% in excess of $10 billion and up to $20 billion; 0.55% in excess of $20 billion and up to $25 billion; 0.525% in excess of $25 billion.
This is a summary of certain changes to the fund from July 1, 2024 through June 30, 2025. For more complete information, you may review the fund's prospectus as amended, which is available at funds.mfs.com or upon request at 1‑800‑225‑2606.
This report describes certain changes to the Fund that occurred during the reporting period.
FUND EXPENSES
What were the fund costs for the last year?
| (based on a hypothetical $10,000 investment) | ||
| Class Name | Costs of a $10,000 investment | Costs paid as a percentage of a $10,000 investment |
| I | $78 | 0.72% |
MANAGEMENT'S DISCUSSION OF FUND PERFORMANCE
-
For the twelve months ended June 30, 2025, Class I shares of the MFS International Equity Fund (fund) provided a total return of 16.58%, at net asset value. This compares with a return of 17.73% for the fund’s benchmark, the MSCI EAFE (Europe, Australasia, Far East) Index (net div).
-
Global equity markets reached record levels during the period withstanding considerable volatility amid tariffs, geopolitical conflict and high levels of uncertainty. In Europe, renewed focus on defense and infrastructure spending brightened the outlook.
-
Market volatility rose toward the end of the period as the Trump administration imposed, then suspended for 90-days, an array of tariffs on most US trading partners. Sector level tariffs remained in place. A temporary truce was reached separately with China, although tensions remained high as negotiations continued.
-
Moderating inflation pressures allowed many global central banks to ease monetary policy during the period. Amid a difficult policymaking environment, the Federal Reserve stayed on the sidelines, awaiting greater clarity on the impact of tariffs.
-
Top contributors to performance relative to the MSCI EAFE Index:
-
Security selection within both the information technology and consumer discretionary sectors strengthened relative performance.
-
-
Top detractors from performance relative to the MSCI EAFE Index:
-
Security selection and, to a lesser extent, an underweight allocation to the financials sector weakened the fund's relative performance.
-
Stock selection within the consumer staples sector further weighed on the fund's relative returns.
-
FUND PERFORMANCE
The fund’s past performance is not a good predictor of the fund’s future performance. The graph and table below do not reflect the deduction of taxes that a shareholder would pay on fund distributions or the redemption of fund shares. The graph and table below assume reinvestment of dividends and capital gain distributions.
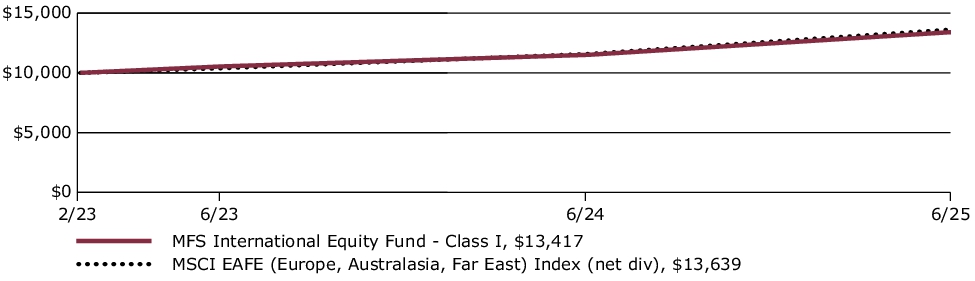
Growth of a Hypothetical $10,000 Investment*
This graph shows the performance of a hypothetical $10,000 investment in Class I over a ten year period or since inception, if shorter, in comparison to a broad measure of market performance.
Average Annual Total Returns through 6/30/25
This table shows the average annual total returns of the class of shares noted for the periods shown, both with (if any) and without sales charges. It also shows the average annual total returns of a broad measure of market performance over the same periods.
| Share Class | 1-yr | Life* |
| I without sales charge | 16.58% | 13.05% |
| Comparative Benchmark(s) | ||
| MSCI EAFE (Europe, Australasia, Far East) Index (net div) ∆ | 17.73% | 13.84% |
|
* |
For the period from the commencement of the class's investment operations, February 8, 2023 through June 30, 2025. |
|
∆ |
Source: FactSet Research Systems Inc. |
Visit mfs.com/perf/i for more recent performance information.
FUND STATISTICS AS OF 6/30/25
| Net Assets ($): | 28,905,082,239 | Total Management Fee ($)#: | 146,964,144 | |
| Total Number of Holdings: | 80 | Portfolio Turnover Rate (%): | 13 |
# Includes the effect of any management fee waivers, if applicable.
Where the fund holds derivatives, they are not included in the total number of portfolio holdings.
PORTFOLIO COMPOSITION (BASED ON TOTAL INVESTMENTS AS OF 6/30/25)
Portfolio structure
| Equities | 98.6% |
| Money Market Funds | 1.4% |
Top ten holdings
| Hitachi Ltd. | 3.0% |
| SAP SE | 2.9% |
| Air Liquide S.A. | 2.9% |
| Schneider Electric SE | 2.7% |
| Rolls-Royce Holdings PLC | 2.4% |
| Roche Holding AG | 2.3% |
| Compass Group PLC | 2.3% |
| Compagnie Financiere Richemont S.A. | 2.2% |
| Deutsche Boerse AG | 2.2% |
| Taiwan Semiconductor Manufacturing Co. Ltd., ADR | 2.1% |
Issuer country weightings
| Japan | 19.2% |
| France | 18.5% |
| United Kingdom | 13.8% |
| Switzerland | 12.6% |
| Germany | 9.6% |
| Canada | 3.3% |
| Ireland | 2.8% |
| Denmark | 2.5% |
| Italy | 2.5% |
| Other Countries | 15.2% |
Top ten holdings
| Hitachi Ltd. | 3.0% |
| SAP SE | 2.9% |
| Air Liquide S.A. | 2.9% |
| Schneider Electric SE | 2.7% |
| Rolls-Royce Holdings PLC | 2.4% |
| Roche Holding AG | 2.3% |
| Compass Group PLC | 2.3% |
| Compagnie Financiere Richemont S.A. | 2.2% |
| Deutsche Boerse AG | 2.2% |
| Taiwan Semiconductor Manufacturing Co. Ltd., ADR | 2.1% |
MATERIAL FUND CHANGES
This is a summary of certain changes to the fund from July 1, 2024 through June 30, 2025. For more complete information, you may review the fund's prospectus as amended, which is available at funds.mfs.com or upon request at 1‑800‑225‑2606.
Effective August 1, 2024, the management fee is computed daily and paid monthly at the following annual rates based on the fund’s average daily net assets: 0.75% up to $1 billion; 0.70% in excess of $1 billion and up to $2.5 billion; 0.65% in excess of $2.5 billion and up to $10 billion; 0.60% in excess of $10 billion and up to $20 billion; 0.55% in excess of $20 billion and up to $25 billion; 0.525% in excess of $25 billion.
Effective August 1, 2024, the management fee is computed daily and paid monthly at the following annual rates based on the fund’s average daily net assets: 0.75% up to $1 billion; 0.70% in excess of $1 billion and up to $2.5 billion; 0.65% in excess of $2.5 billion and up to $10 billion; 0.60% in excess of $10 billion and up to $20 billion; 0.55% in excess of $20 billion and up to $25 billion; 0.525% in excess of $25 billion.
This is a summary of certain changes to the fund from July 1, 2024 through June 30, 2025. For more complete information, you may review the fund's prospectus as amended, which is available at funds.mfs.com or upon request at 1‑800‑225‑2606.
This report describes certain changes to the Fund that occurred during the reporting period.
FUND EXPENSES
What were the fund costs for the last year?
| (based on a hypothetical $10,000 investment) | ||
| Class Name | Costs of a $10,000 investment | Costs paid as a percentage of a $10,000 investment |
| A | $105 | 0.97% |
MANAGEMENT'S DISCUSSION OF FUND PERFORMANCE
-
For the twelve months ended June 30, 2025, Class A shares of the MFS International Equity Fund (fund) provided a total return of 16.26%, at net asset value. This compares with a return of 17.73% for the fund’s benchmark, the MSCI EAFE (Europe, Australasia, Far East) Index (net div).
-
Global equity markets reached record levels during the period withstanding considerable volatility amid tariffs, geopolitical conflict and high levels of uncertainty. In Europe, renewed focus on defense and infrastructure spending brightened the outlook.
-
Market volatility rose toward the end of the period as the Trump administration imposed, then suspended for 90-days, an array of tariffs on most US trading partners. Sector level tariffs remained in place. A temporary truce was reached separately with China, although tensions remained high as negotiations continued.
-
Moderating inflation pressures allowed many global central banks to ease monetary policy during the period. Amid a difficult policymaking environment, the Federal Reserve stayed on the sidelines, awaiting greater clarity on the impact of tariffs.
-
Top contributors to performance relative to the MSCI EAFE Index:
-
Security selection within both the information technology and consumer discretionary sectors strengthened relative performance.
-
-
Top detractors from performance relative to the MSCI EAFE Index:
-
Security selection and, to a lesser extent, an underweight allocation to the financials sector weakened the fund's relative performance.
-
Stock selection within the consumer staples sector further weighed on the fund's relative returns.
-
FUND PERFORMANCE
The fund’s past performance is not a good predictor of the fund’s future performance. The graph and table below do not reflect the deduction of taxes that a shareholder would pay on fund distributions or the redemption of fund shares. The graph and table below assume reinvestment of dividends and capital gain distributions.
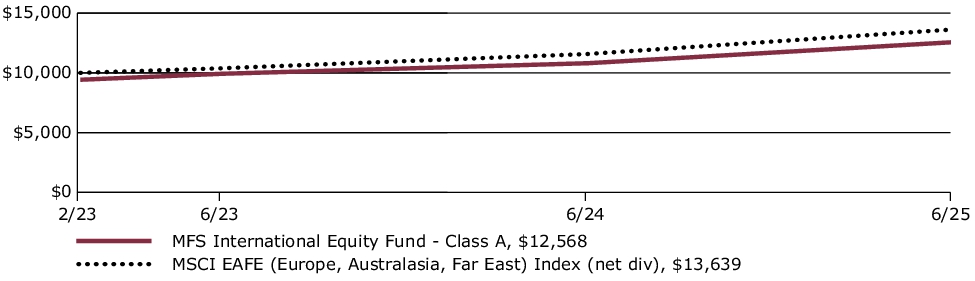
Growth of a Hypothetical $10,000 Investment*
This graph shows the performance of a hypothetical $10,000 investment in Class A over a ten year period or since inception, if shorter, in comparison to a broad measure of market performance. This graph includes the deduction of the maximum applicable sales charge.
Average Annual Total Returns through 6/30/25
This table shows the average annual total returns of the class of shares noted for the periods shown, both with (if any) and without sales charges. It also shows the average annual total returns of a broad measure of market performance over the same periods.
| Share Class | 1-yr | Life* |
| A without sales charge | 16.26% | 12.76% |
| A with initial sales charge (5.75%) | 9.58% | 10.01% |
| Comparative Benchmark(s) | ||
| MSCI EAFE (Europe, Australasia, Far East) Index (net div) ∆ | 17.73% | 13.84% |
|
* |
For the period from the commencement of the class's investment operations, February 8, 2023 through June 30, 2025. |
|
∆ |
Source: FactSet Research Systems Inc. |
Visit mfs.com/perf/a for more recent performance information.
FUND STATISTICS AS OF 6/30/25
| Net Assets ($): | 28,905,082,239 | Total Management Fee ($)#: | 146,964,144 | |
| Total Number of Holdings: | 80 | Portfolio Turnover Rate (%): | 13 |
# Includes the effect of any management fee waivers, if applicable.
Where the fund holds derivatives, they are not included in the total number of portfolio holdings.
PORTFOLIO COMPOSITION (BASED ON TOTAL INVESTMENTS AS OF 6/30/25)
Portfolio structure
| Equities | 98.6% |
| Money Market Funds | 1.4% |
Top ten holdings
| Hitachi Ltd. | 3.0% |
| SAP SE | 2.9% |
| Air Liquide S.A. | 2.9% |
| Schneider Electric SE | 2.7% |
| Rolls-Royce Holdings PLC | 2.4% |
| Roche Holding AG | 2.3% |
| Compass Group PLC | 2.3% |
| Compagnie Financiere Richemont S.A. | 2.2% |
| Deutsche Boerse AG | 2.2% |
| Taiwan Semiconductor Manufacturing Co. Ltd., ADR | 2.1% |
Issuer country weightings
| Japan | 19.2% |
| France | 18.5% |
| United Kingdom | 13.8% |
| Switzerland | 12.6% |
| Germany | 9.6% |
| Canada | 3.3% |
| Ireland | 2.8% |
| Denmark | 2.5% |
| Italy | 2.5% |
| Other Countries | 15.2% |
Top ten holdings
| Hitachi Ltd. | 3.0% |
| SAP SE | 2.9% |
| Air Liquide S.A. | 2.9% |
| Schneider Electric SE | 2.7% |
| Rolls-Royce Holdings PLC | 2.4% |
| Roche Holding AG | 2.3% |
| Compass Group PLC | 2.3% |
| Compagnie Financiere Richemont S.A. | 2.2% |
| Deutsche Boerse AG | 2.2% |
| Taiwan Semiconductor Manufacturing Co. Ltd., ADR | 2.1% |
MATERIAL FUND CHANGES
This is a summary of certain changes to the fund from July 1, 2024 through June 30, 2025. For more complete information, you may review the fund's prospectus as amended, which is available at funds.mfs.com or upon request at 1‑800‑225‑2606.
Effective August 1, 2024, the management fee is computed daily and paid monthly at the following annual rates based on the fund’s average daily net assets: 0.75% up to $1 billion; 0.70% in excess of $1 billion and up to $2.5 billion; 0.65% in excess of $2.5 billion and up to $10 billion; 0.60% in excess of $10 billion and up to $20 billion; 0.55% in excess of $20 billion and up to $25 billion; 0.525% in excess of $25 billion.
Effective August 1, 2024, the management fee is computed daily and paid monthly at the following annual rates based on the fund’s average daily net assets: 0.75% up to $1 billion; 0.70% in excess of $1 billion and up to $2.5 billion; 0.65% in excess of $2.5 billion and up to $10 billion; 0.60% in excess of $10 billion and up to $20 billion; 0.55% in excess of $20 billion and up to $25 billion; 0.525% in excess of $25 billion.
This is a summary of certain changes to the fund from July 1, 2024 through June 30, 2025. For more complete information, you may review the fund's prospectus as amended, which is available at funds.mfs.com or upon request at 1‑800‑225‑2606.
| [1] | Includes the effect of any management fee waivers, if applicable. |
| [2] | Includes the effect of any management fee waivers, if applicable. |
| [3] | Includes the effect of any management fee waivers, if applicable. |