Shareholder Report
Jun. 30, 2025
USD ($)
Holding
Fund Expenses
(Based on a hypothetical $10,000 investment)
| Costs of a $10,000 investment | Costs paid as a percentage of a $10,000 investment | |||
| Sequoia Fund, Inc. | $54 | 1.00%* |
| *Annualized |
Key Fund Statistics
| Net assets | $3,895,115,489 |
| Total number of portfolio holdings | 24 |
| Portfolio turnover rate as of the end of the reporting period | 5% |
Fund Holdings (as of June 30, 2025)
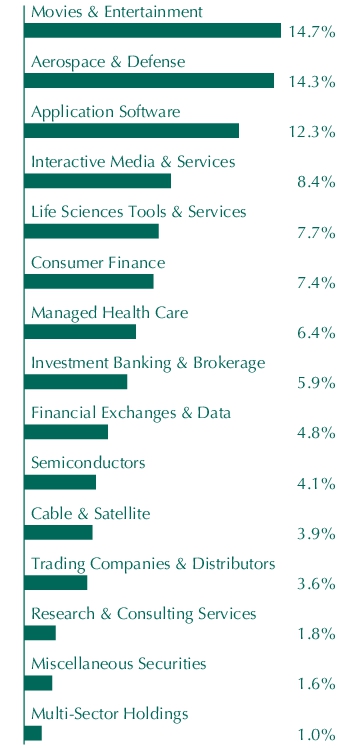
The following table and graph show the investment makeup of the Fund as of June 30, 2025. Figures are expressed as percentages of the Fund’s net assets.
Top Ten Holdings
| Rolls-Royce Holdings PLC | 14.3% |
| Constellation Software, Inc. | 7.8% |
| Liberty Media Corp.-Liberty Formula One | 7.5% |
| Universal Music Group NV | 7.2% |
| The Charles Schwab Corp. | 5.9% |
| Eurofins Scientific SE | 5.3% |
| Alphabet, Inc. | 5.2% |
| Intercontinental Exchange, Inc. | 4.8% |
| Capital One Financial Corp. | 4.5% |
| SAP SE | 4.5% |
Sector Allocation
Top Ten Holdings
| Rolls-Royce Holdings PLC | 14.3% |
| Constellation Software, Inc. | 7.8% |
| Liberty Media Corp.-Liberty Formula One | 7.5% |
| Universal Music Group NV | 7.2% |
| The Charles Schwab Corp. | 5.9% |
| Eurofins Scientific SE | 5.3% |
| Alphabet, Inc. | 5.2% |
| Intercontinental Exchange, Inc. | 4.8% |
| Capital One Financial Corp. | 4.5% |
| SAP SE | 4.5% |
| [1] | Annualized |