Shareholder Report
Jun. 30, 2025
USD ($)
shares
What were the Fund costs for the last six months?
(based on a hypothetical $10,000 investment)
| Fund | Costs of a $10,000 Investment | Costs Paid as a Percentage of a $10,000 Investment |
|---|---|---|
| Bretton Fund | $68 | 1.35%1 |
Management's Discussion of Fund Performance
For the first half of the year, the biggest detractor from the Fund's performance was UnitedHealth Group, which took off 1.8% as it struggled with rising medical costs of its enrollees. Eagle Materials dragged down performance by 0.8% due to weak earnings driven by poor weather and weak demand. Ross Stores hurt performance amid investor concerns over tariffs.
On the positive side, JPMorgan Chase added 1.1% after reporting stronger than expected earnings. Progressive added 1.0%, and AutoZone added 0.9%.
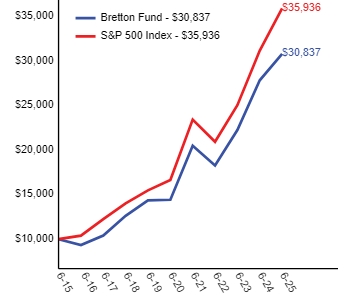
Average Annual Total Returns
| 1 Year | 5 Years | 10 Years | |
|---|---|---|---|
| Bretton Fund | 10.71% | 16.40% | 11.92% |
| S&P 500 Index | 15.16% | 16.64% | 13.65% |
Fund Statistics
| Net Assets ($) | $111,149,114 |
| Number of Portfolio Holdings | |
| Portfolio Turnover Rate (%) | 0% |
What did the Fund invest in?
Sectors (% of net assets)
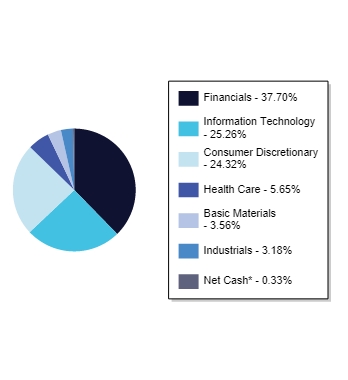
* | Net Assets represents cash equivalents and liabilities in excess of other assets. |
Top Ten Holdings (% of net assets)
| Alphabet Inc. - Class C | |
| The Progressive Corporation | |
| AutoZone, Inc. | |
| American Express Company | |
| JPMorgan Chase & Co. | |
| Microsoft Corporation | |
| Visa Inc. - Class A | |
| Bank of America Corporation | |
| The TJX Companies, Inc. | |
| MasterCard Incorporated - Class A |