Shareholder Report
|
6 Months Ended |
|
Jun. 30, 2025
USD ($)
shares
|
|---|
| Shareholder Report [Line Items] |
|
| Document Type |
N-CSRS
|
| Amendment Flag |
false
|
| Registrant Name |
DIAMOND HILL FUNDS
|
| Entity Central Index Key |
0001032423
|
| Entity Investment Company Type |
N-1A
|
| Document Period End Date |
Jun. 30, 2025
|
| Diamond Hill Small Cap Fund | Investor Class |
|
| Shareholder Report [Line Items] |
|
| Fund Name |
Diamond Hill Small Cap Fund
|
| Class Name |
Investor
|
| Trading Symbol |
DHSCX
|
| Annual or Semi-Annual Statement [Text Block] |
This semi-annual shareholder report contains important information about Diamond Hill Small Cap Fund (the "Fund") for the period of January 1, 2025 to June 30, 2025.
|
| Shareholder Report Annual or Semi-Annual |
semi-annual shareholder report
|
| Additional Information [Text Block] |
You can find additional information about the Fund at https://diamond-hill.com/documents. You can also request this information by contacting us at 888-226-5595 or info@diamond-hill.com or by contacting your financial advisor.
|
| Additional Information Phone Number |
888-226-5595
|
| Additional Information Email |
info@diamond-hill.com
|
| Additional Information Website |
https://diamond-hill.com/documents
|
| Expenses [Text Block] |
|
| Expenses Paid, Amount |
$ 63
|
| Expense Ratio, Percent |
1.27%
|
| Factors Affecting Performance [Text Block] |
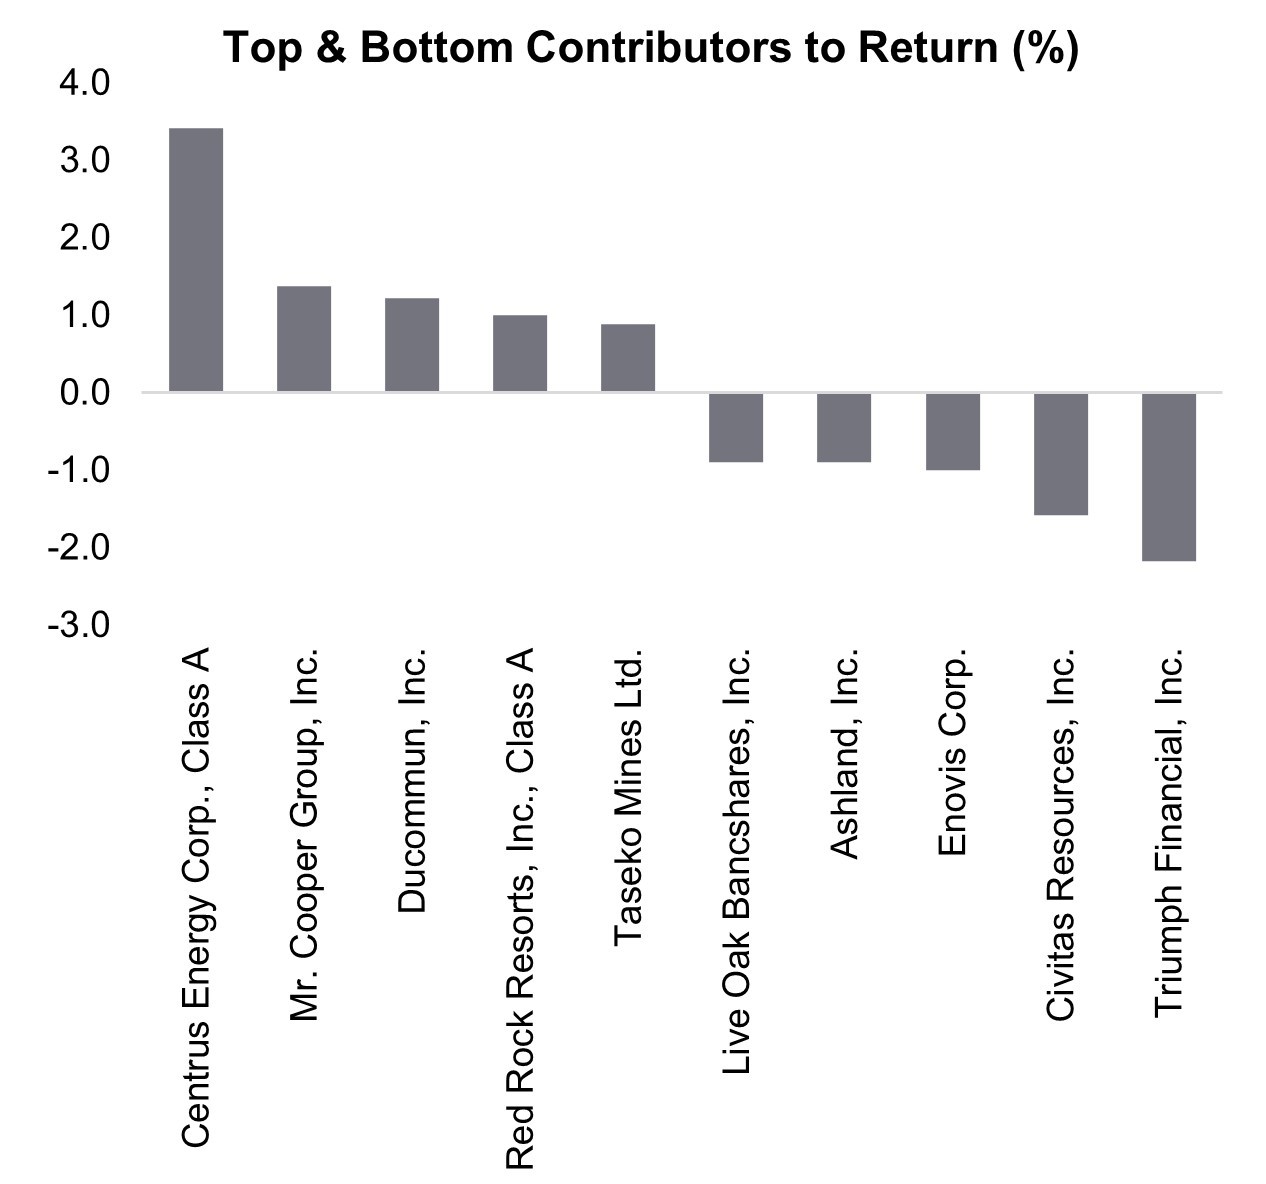
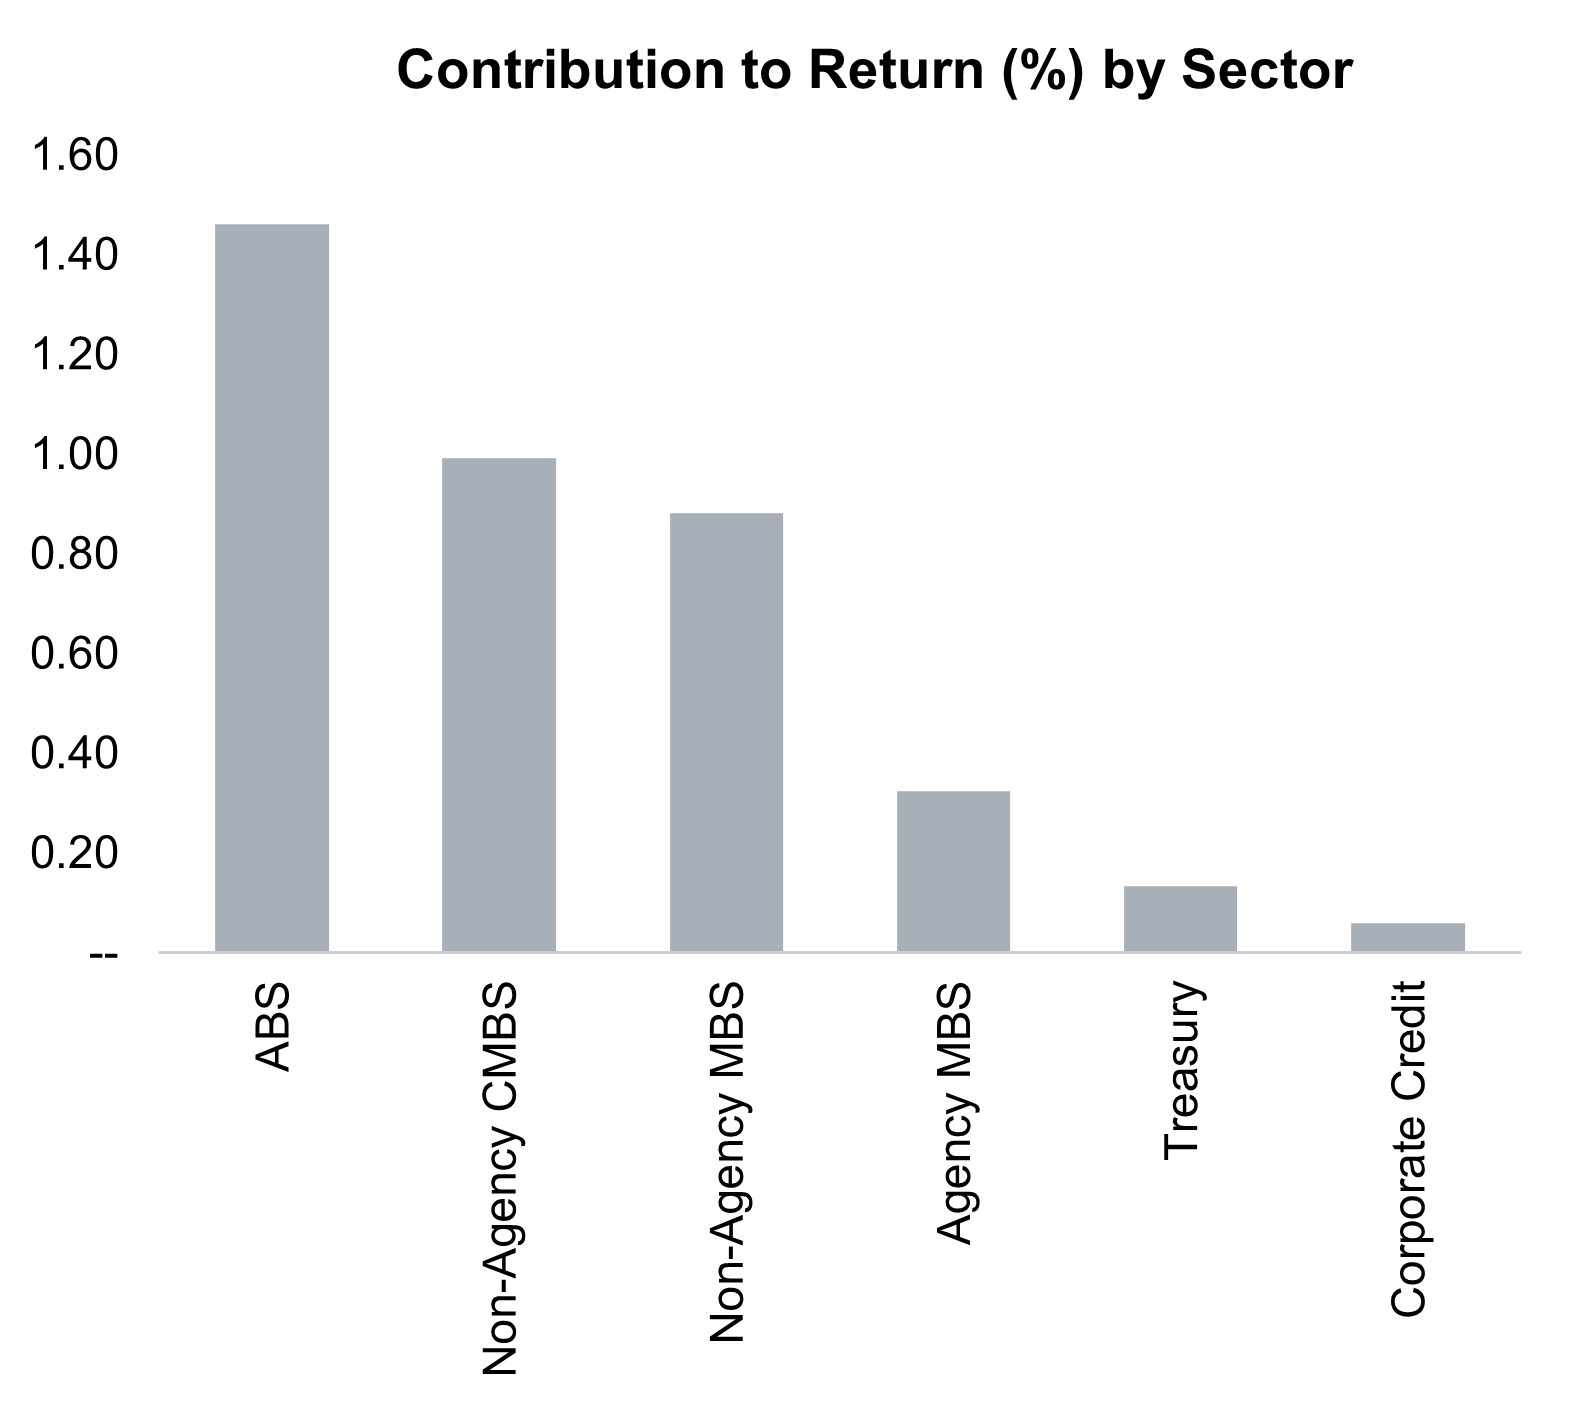
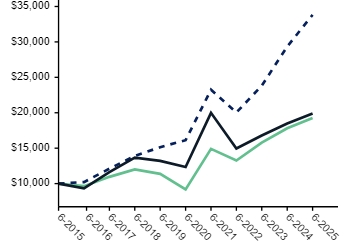
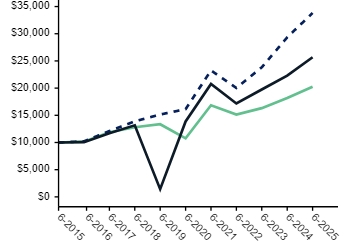
The Fund (Ticker: DHSCX) returned -1.35% for the 6-month period ended June 30, 2025. Over that same period, the Russell 2000 Index returned -1.79%. Security selection is the primary driver of the Fund's performance during any given period — the top and bottom contributors to return are illustrated in the chart. |
| Performance Past Does Not Indicate Future [Text] |
Past performance is not indicative of future results.
|
| Line Graph [Table Text Block] |
|
| Average Annual Return [Table Text Block] |
|
Investor |
-1.35%
|
7.83%
|
15.61%
|
6.46%
|
|
Russell 3000 Index |
5.75
|
15.30
|
15.96
|
12.96
|
|
Russell 2000 Index |
-1.79
|
7.68
|
10.04
|
7.12
|
|
| No Deduction of Taxes [Text Block] |
The performance of the above Fund does not reflect the deduction of taxes that a shareholder would pay on Fund distributions or the redemption of Fund shares.
|
| Net Assets |
$ 205,151,858
|
| Holdings Count | shares |
60
|
| Advisory Fees Paid, Amount |
$ 849,449
|
| Investment Company, Portfolio Turnover |
36.00%
|
| Additional Fund Statistics [Text Block] |
| Net Assets |
$205,151,858 |
| Number of Portfolio Holdings |
60 |
| Portfolio Turnover Rate |
36% |
| Total Advisory Fees Paid |
$849,449 |
|
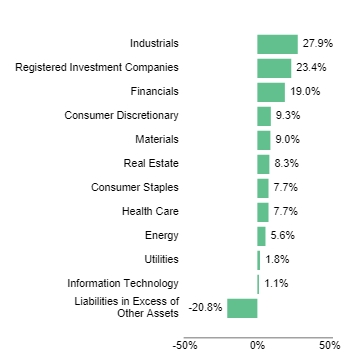
| Holdings [Text Block] |
|
Industrials
|
27.9% |
|
Registered Investment Companies
|
23.4% |
|
Financials
|
19.0% |
|
Consumer Discretionary
|
9.3% |
|
Materials
|
9.0% |
|
Real Estate
|
8.3% |
|
Consumer Staples
|
7.7% |
|
Health Care
|
7.7% |
|
Energy
|
5.6% |
|
Utilities
|
1.8% |
|
Information Technology
|
1.1% |
|
Liabilities in Excess of Other Assets
|
-20.8% |
|
Red Rock Resorts, Inc. Class A
|
6.2 |
|
Ryman Hospitality Properties, Inc.
|
4.5 |
|
Ducommun, Inc.
|
4.3 |
|
Bank OZK
|
4.0 |
|
Triumph Financial, Inc.
|
3.7 |
|
Mr. Cooper Group, Inc.
|
3.4 |
|
Astrana Health, Inc.
|
2.9 |
|
Live Oak Bancshares, Inc.
|
2.9 |
|
Graham Corp.
|
2.8 |
|
United States Lime & Minerals, Inc.
|
2.8 |
|
| Largest Holdings [Text Block] |
|
Red Rock Resorts, Inc. Class A
|
6.2 |
|
Ryman Hospitality Properties, Inc.
|
4.5 |
|
Ducommun, Inc.
|
4.3 |
|
Bank OZK
|
4.0 |
|
Triumph Financial, Inc.
|
3.7 |
|
Mr. Cooper Group, Inc.
|
3.4 |
|
Astrana Health, Inc.
|
2.9 |
|
Live Oak Bancshares, Inc.
|
2.9 |
|
Graham Corp.
|
2.8 |
|
United States Lime & Minerals, Inc.
|
2.8 |
|
| Diamond Hill Small Cap Fund | Class I |
|
| Shareholder Report [Line Items] |
|
| Fund Name |
Diamond Hill Small Cap Fund
|
| Class Name |
Class I
|
| Trading Symbol |
DHSIX
|
| Annual or Semi-Annual Statement [Text Block] |
This semi-annual shareholder report contains important information about Diamond Hill Small Cap Fund (the "Fund") for the period of January 1, 2025 to June 30, 2025.
|
| Shareholder Report Annual or Semi-Annual |
semi-annual shareholder report
|
| Additional Information [Text Block] |
You can find additional information about the Fund at https://diamond-hill.com/documents. You can also request this information by contacting us at 888-226-5595 or info@diamond-hill.com or by contacting your financial advisor.
|
| Additional Information Phone Number |
888-226-5595
|
| Additional Information Email |
info@diamond-hill.com
|
| Additional Information Website |
https://diamond-hill.com/documents
|
| Expenses [Text Block] |
|
| Expenses Paid, Amount |
$ 48
|
| Expense Ratio, Percent |
0.98%
|
| Factors Affecting Performance [Text Block] |
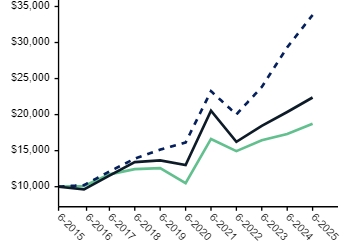
The Fund (Ticker: DHSIX) returned -1.17% for the 6-month period ended June 30, 2025. Over that same period, the Russell 2000 Index returned -1.79%. Security selection is the primary driver of the Fund's performance during any given period — the top and bottom contributors to return are illustrated in the chart. |
| Performance Past Does Not Indicate Future [Text] |
Past performance is not indicative of future results.
|
| Line Graph [Table Text Block] |
|
| Average Annual Return [Table Text Block] |
|
Class I |
-1.17%
|
8.16%
|
15.94%
|
6.77%
|
|
Russell 3000 Index |
5.75
|
15.30
|
15.96
|
12.96
|
|
Russell 2000 Index |
-1.79
|
7.68
|
10.04
|
7.12
|
|
| No Deduction of Taxes [Text Block] |
The performance of the above Fund does not reflect the deduction of taxes that a shareholder would pay on Fund distributions or the redemption of Fund shares.
|
| Net Assets |
$ 205,151,858
|
| Holdings Count | shares |
60
|
| Advisory Fees Paid, Amount |
$ 849,449
|
| Investment Company, Portfolio Turnover |
36.00%
|
| Additional Fund Statistics [Text Block] |
| Net Assets |
$205,151,858 |
| Number of Portfolio Holdings |
60 |
| Portfolio Turnover Rate |
36% |
| Total Advisory Fees Paid |
$849,449 |
|
| Holdings [Text Block] |
|
Industrials
|
27.9% |
|
Registered Investment Companies
|
23.4% |
|
Financials
|
19.0% |
|
Consumer Discretionary
|
9.3% |
|
Materials
|
9.0% |
|
Real Estate
|
8.3% |
|
Consumer Staples
|
7.7% |
|
Health Care
|
7.7% |
|
Energy
|
5.6% |
|
Utilities
|
1.8% |
|
Information Technology
|
1.1% |
|
Liabilities in Excess of Other Assets
|
-20.8% |

|
Red Rock Resorts, Inc. Class A
|
6.2 |
|
Ryman Hospitality Properties, Inc.
|
4.5 |
|
Ducommun, Inc.
|
4.3 |
|
Bank OZK
|
4.0 |
|
Triumph Financial, Inc.
|
3.7 |
|
Mr. Cooper Group, Inc.
|
3.4 |
|
Astrana Health, Inc.
|
2.9 |
|
Live Oak Bancshares, Inc.
|
2.9 |
|
Graham Corp.
|
2.8 |
|
United States Lime & Minerals, Inc.
|
2.8 |
|
| Largest Holdings [Text Block] |
|
Red Rock Resorts, Inc. Class A
|
6.2 |
|
Ryman Hospitality Properties, Inc.
|
4.5 |
|
Ducommun, Inc.
|
4.3 |
|
Bank OZK
|
4.0 |
|
Triumph Financial, Inc.
|
3.7 |
|
Mr. Cooper Group, Inc.
|
3.4 |
|
Astrana Health, Inc.
|
2.9 |
|
Live Oak Bancshares, Inc.
|
2.9 |
|
Graham Corp.
|
2.8 |
|
United States Lime & Minerals, Inc.
|
2.8 |
|
| Diamond Hill Small Cap Fund | Class Y |
|
| Shareholder Report [Line Items] |
|
| Fund Name |
Diamond Hill Small Cap Fund
|
| Class Name |
Class Y
|
| Trading Symbol |
DHSYX
|
| Annual or Semi-Annual Statement [Text Block] |
This semi-annual shareholder report contains important information about Diamond Hill Small Cap Fund (the "Fund") for the period of January 1, 2025 to June 30, 2025.
|
| Shareholder Report Annual or Semi-Annual |
semi-annual shareholder report
|
| Additional Information [Text Block] |
You can find additional information about the Fund at https://diamond-hill.com/documents. You can also request this information by contacting us at 888-226-5595 or info@diamond-hill.com or by contacting your financial advisor.
|
| Additional Information Phone Number |
888-226-5595
|
| Additional Information Email |
info@diamond-hill.com
|
| Additional Information Website |
https://diamond-hill.com/documents
|
| Expenses [Text Block] |
|
| Expenses Paid, Amount |
$ 42
|
| Expense Ratio, Percent |
0.86%
|
| Factors Affecting Performance [Text Block] |
The Fund (Ticker: DHSYX) returned -1.13% for the 6-month period ended June 30, 2025. Over that same period, the Russell 2000 Index returned -1.79%. Security selection is the primary driver of the Fund's performance during any given period — the top and bottom contributors to return are illustrated in the chart. |
| Performance Past Does Not Indicate Future [Text] |
Past performance is not indicative of future results.
|
| Line Graph [Table Text Block] |
|
| Average Annual Return [Table Text Block] |
|
Class Y |
-1.13%
|
8.30%
|
16.09%
|
6.90%
|
|
Russell 3000 Index |
5.75
|
15.30
|
15.96
|
12.96
|
|
Russell 2000 Index |
-1.79
|
7.68
|
10.04
|
7.12
|
|
| No Deduction of Taxes [Text Block] |
The performance of the above Fund does not reflect the deduction of taxes that a shareholder would pay on Fund distributions or the redemption of Fund shares.
|
| Net Assets |
$ 205,151,858
|
| Holdings Count | shares |
60
|
| Advisory Fees Paid, Amount |
$ 849,449
|
| Investment Company, Portfolio Turnover |
36.00%
|
| Additional Fund Statistics [Text Block] |
| Net Assets |
$205,151,858 |
| Number of Portfolio Holdings |
60 |
| Portfolio Turnover Rate |
36% |
| Total Advisory Fees Paid |
$849,449 |
|
| Holdings [Text Block] |
|
Industrials
|
27.9% |
|
Registered Investment Companies
|
23.4% |
|
Financials
|
19.0% |
|
Consumer Discretionary
|
9.3% |
|
Materials
|
9.0% |
|
Real Estate
|
8.3% |
|
Consumer Staples
|
7.7% |
|
Health Care
|
7.7% |
|
Energy
|
5.6% |
|
Utilities
|
1.8% |
|
Information Technology
|
1.1% |
|
Liabilities in Excess of Other Assets
|
-20.8% |

|
Red Rock Resorts, Inc. Class A
|
6.2 |
|
Ryman Hospitality Properties, Inc.
|
4.5 |
|
Ducommun, Inc.
|
4.3 |
|
Bank OZK
|
4.0 |
|
Triumph Financial, Inc.
|
3.7 |
|
Mr. Cooper Group, Inc.
|
3.4 |
|
Astrana Health, Inc.
|
2.9 |
|
Live Oak Bancshares, Inc.
|
2.9 |
|
Graham Corp.
|
2.8 |
|
United States Lime & Minerals, Inc.
|
2.8 |
|
| Largest Holdings [Text Block] |
|
Red Rock Resorts, Inc. Class A
|
6.2 |
|
Ryman Hospitality Properties, Inc.
|
4.5 |
|
Ducommun, Inc.
|
4.3 |
|
Bank OZK
|
4.0 |
|
Triumph Financial, Inc.
|
3.7 |
|
Mr. Cooper Group, Inc.
|
3.4 |
|
Astrana Health, Inc.
|
2.9 |
|
Live Oak Bancshares, Inc.
|
2.9 |
|
Graham Corp.
|
2.8 |
|
United States Lime & Minerals, Inc.
|
2.8 |
|
| Diamond Hill Small-Mid Cap Fund | Investor Class |
|
| Shareholder Report [Line Items] |
|
| Fund Name |
Diamond Hill Small-Mid Cap Fund
|
| Class Name |
Investor
|
| Trading Symbol |
DHMAX
|
| Annual or Semi-Annual Statement [Text Block] |
This semi-annual shareholder report contains important information about Diamond Hill Small-Mid Cap Fund (the "Fund") for the period of January 1, 2025 to June 30, 2025.
|
| Shareholder Report Annual or Semi-Annual |
semi-annual shareholder report
|
| Additional Information [Text Block] |
You can find additional information about the Fund at https://diamond-hill.com/documents. You can also request this information by contacting us at 888-226-5595 or info@diamond-hill.com or by contacting your financial advisor.
|
| Additional Information Phone Number |
888-226-5595
|
| Additional Information Email |
info@diamond-hill.com
|
| Additional Information Website |
https://diamond-hill.com/documents
|
| Expenses [Text Block] |
|
| Expenses Paid, Amount |
$ 60
|
| Expense Ratio, Percent |
1.21%
|
| Factors Affecting Performance [Text Block] |
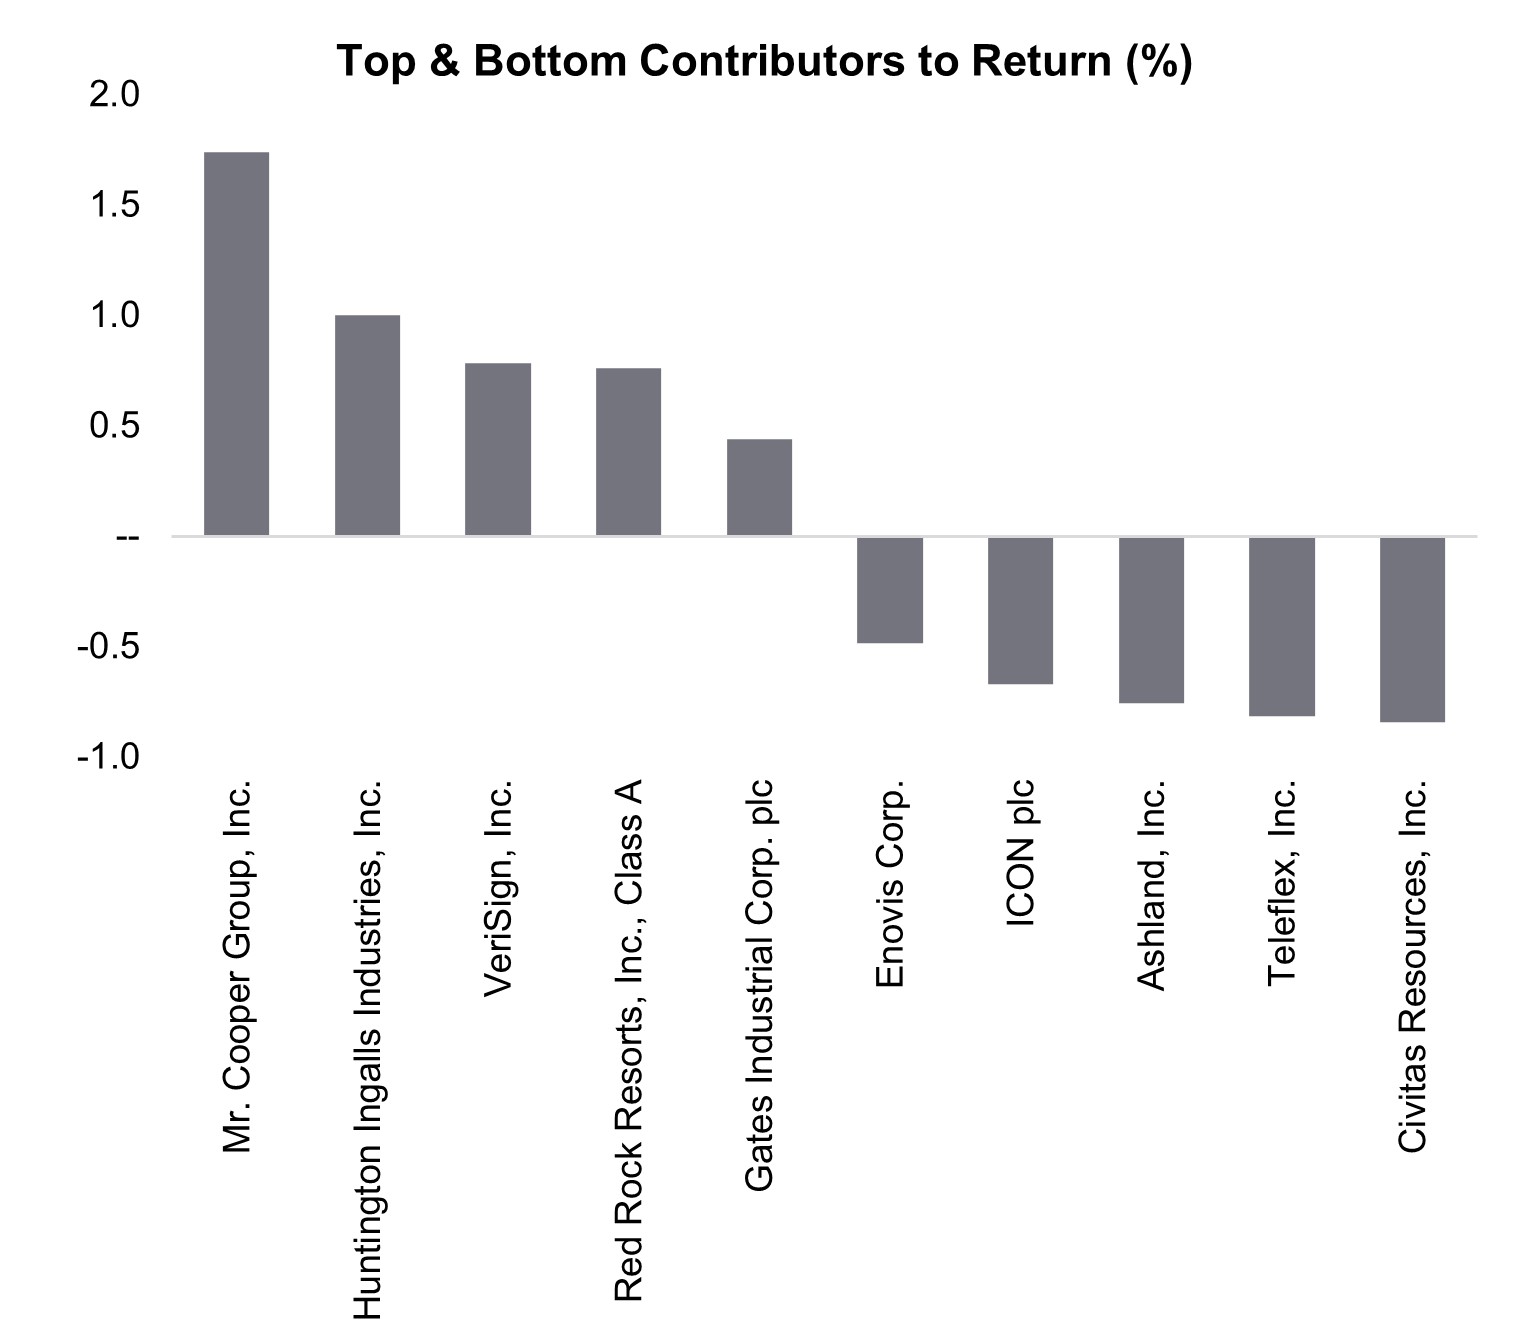
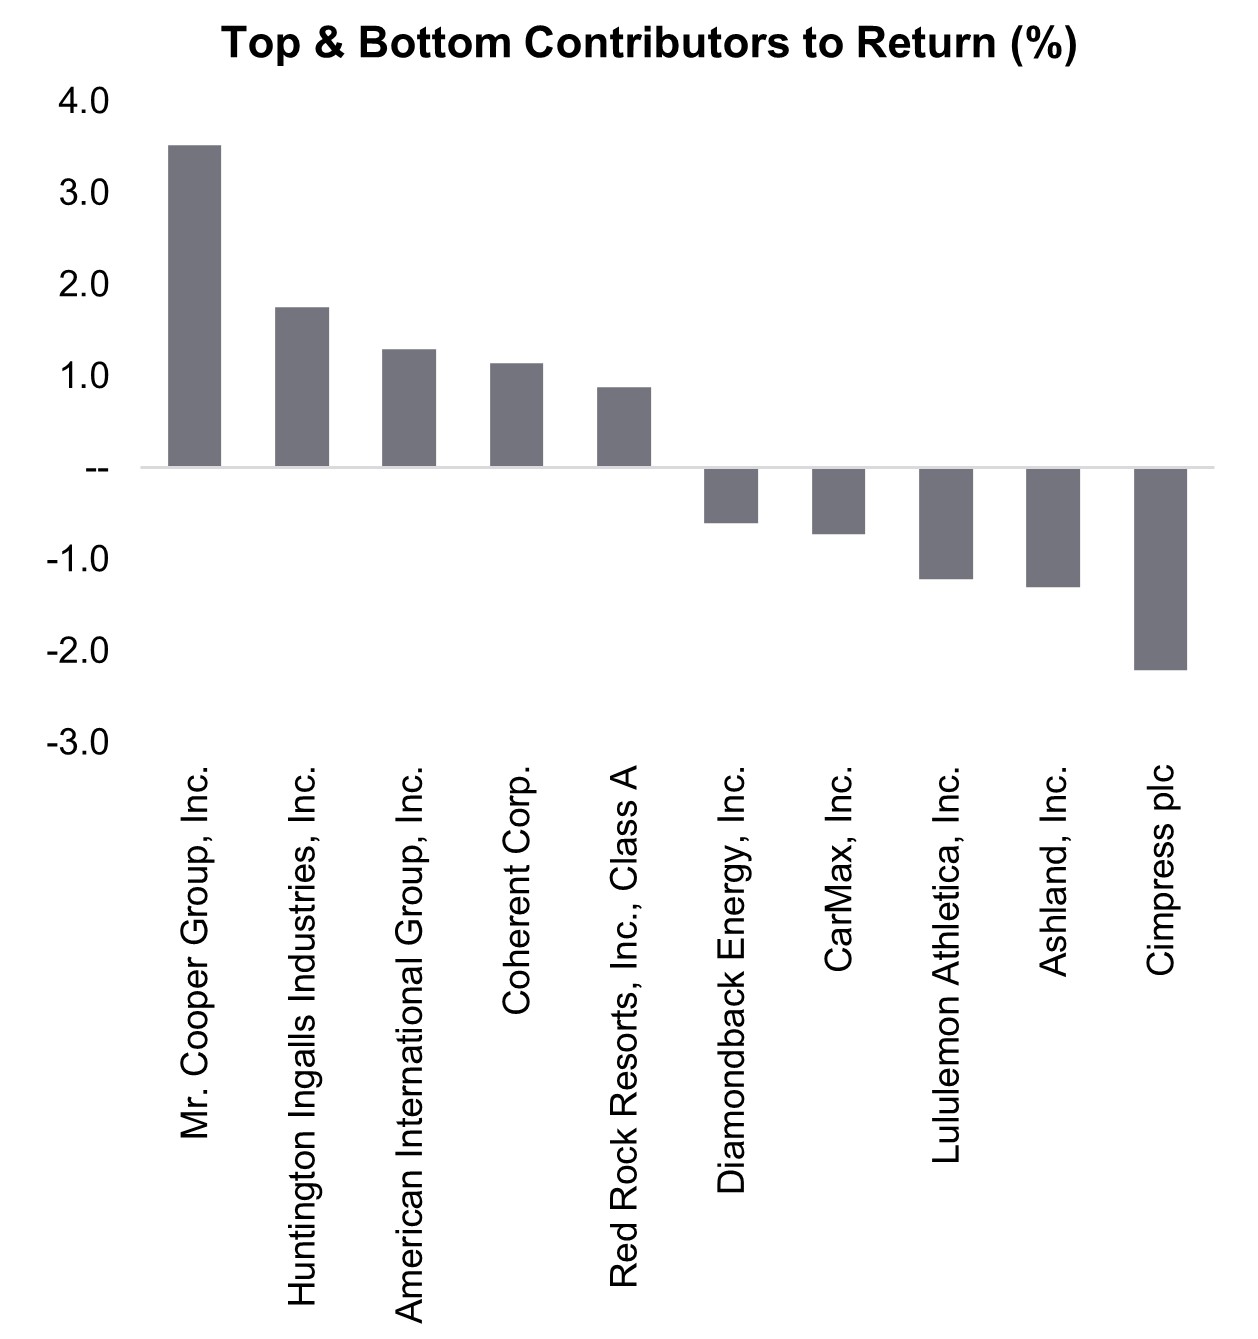
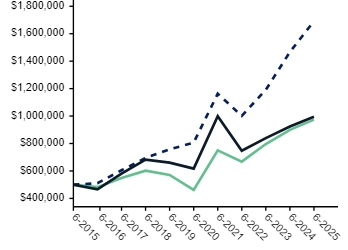
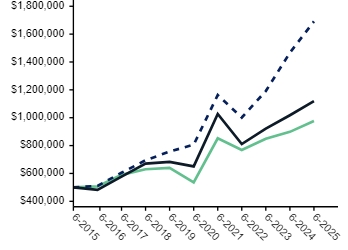
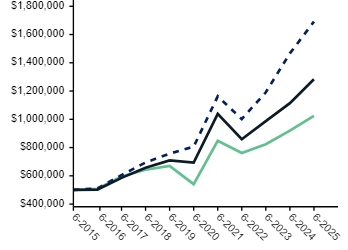
The Fund (Ticker: DHMAX) returned 0.94% for the 6-month period ended June 30, 2025. Over that same period, the Russell 2500 Index returned 0.44%. Security selection is the primary driver of the Fund's performance during any given period — the top and bottom contributors to return are illustrated in the chart. |
| Performance Past Does Not Indicate Future [Text] |
Past performance is not indicative of future results.
|
| Line Graph [Table Text Block] |
|
| Average Annual Return [Table Text Block] |
|
Investor |
0.94%
|
8.20%
|
12.26%
|
6.48%
|
|
Russell 3000 Index |
5.75
|
15.30
|
15.96
|
12.96
|
|
Russell 2500 Index |
0.44
|
9.91
|
11.44
|
8.39
|
|
| No Deduction of Taxes [Text Block] |
The performance of the above Fund does not reflect the deduction of taxes that a shareholder would pay on Fund distributions or the redemption of Fund shares.
|
| Net Assets |
$ 899,489,126
|
| Holdings Count | shares |
64
|
| Advisory Fees Paid, Amount |
$ 3,583,563
|
| Investment Company, Portfolio Turnover |
11.00%
|
| Additional Fund Statistics [Text Block] |
| Net Assets |
$899,489,126 |
| Number of Portfolio Holdings |
64 |
| Portfolio Turnover Rate |
11% |
| Total Advisory Fees Paid |
$3,583,563 |
|
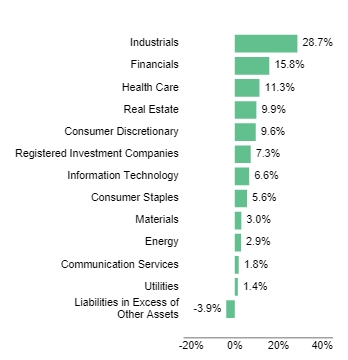
| Holdings [Text Block] |
|
Industrials
|
28.7% |
|
Financials
|
15.8% |
|
Health Care
|
11.3% |
|
Real Estate
|
9.9% |
|
Consumer Discretionary
|
9.6% |
|
Registered Investment Companies
|
7.3% |
|
Information Technology
|
6.6% |
|
Consumer Staples
|
5.6% |
|
Materials
|
3.0% |
|
Energy
|
2.9% |
|
Communication Services
|
1.8% |
|
Utilities
|
1.4% |
|
Liabilities in Excess of Other Assets
|
-3.9% |

|
WESCO International, Inc.
|
5.0 |
|
Red Rock Resorts, Inc. Class A
|
5.0 |
|
Mr. Cooper Group, Inc.
|
4.4 |
|
Post Holdings, Inc.
|
4.0 |
|
Regal Rexnord Corp.
|
3.7 |
|
Gates Industrial Corp. plc
|
3.6 |
|
Huntington Ingalls Industries, Inc.
|
3.3 |
|
CubeSmart
|
3.1 |
|
SS&C Technologies Holdings, Inc.
|
2.6 |
|
Webster Financial Corp.
|
2.5 |
|
| Largest Holdings [Text Block] |
|
WESCO International, Inc.
|
5.0 |
|
Red Rock Resorts, Inc. Class A
|
5.0 |
|
Mr. Cooper Group, Inc.
|
4.4 |
|
Post Holdings, Inc.
|
4.0 |
|
Regal Rexnord Corp.
|
3.7 |
|
Gates Industrial Corp. plc
|
3.6 |
|
Huntington Ingalls Industries, Inc.
|
3.3 |
|
CubeSmart
|
3.1 |
|
SS&C Technologies Holdings, Inc.
|
2.6 |
|
Webster Financial Corp.
|
2.5 |
|
| Diamond Hill Small-Mid Cap Fund | Class I |
|
| Shareholder Report [Line Items] |
|
| Fund Name |
Diamond Hill Small-Mid Cap Fund
|
| Class Name |
Class I
|
| Trading Symbol |
DHMIX
|
| Annual or Semi-Annual Statement [Text Block] |
This semi-annual shareholder report contains important information about Diamond Hill Small-Mid Cap Fund (the "Fund") for the period of January 1, 2025 to June 30, 2025.
|
| Shareholder Report Annual or Semi-Annual |
semi-annual shareholder report
|
| Additional Information [Text Block] |
You can find additional information about the Fund at https://diamond-hill.com/documents. You can also request this information by contacting us at 888-226-5595 or info@diamond-hill.com or by contacting your financial advisor.
|
| Additional Information Phone Number |
888-226-5595
|
| Additional Information Email |
info@diamond-hill.com
|
| Additional Information Website |
https://diamond-hill.com/documents
|
| Expenses [Text Block] |
|
| Expenses Paid, Amount |
$ 46
|
| Expense Ratio, Percent |
0.92%
|
| Factors Affecting Performance [Text Block] |
The Fund (Ticker: DHMIX) returned 1.09% for the 6-month period ended June 30, 2025. Over that same period, the Russell 2500 Index returned 0.44%. Security selection is the primary driver of the Fund's performance during any given period — the top and bottom contributors to return are illustrated in the chart. |
| Performance Past Does Not Indicate Future [Text] |
Past performance is not indicative of future results.
|
| Line Graph [Table Text Block] |

|
| Average Annual Return [Table Text Block] |
|
Class I |
1.09%
|
8.53%
|
12.58%
|
6.79%
|
|
Russell 3000 Index |
5.75
|
15.30
|
15.96
|
12.96
|
|
Russell 2500 Index |
0.44
|
9.91
|
11.44
|
8.39
|
|
| No Deduction of Taxes [Text Block] |
The performance of the above Fund does not reflect the deduction of taxes that a shareholder would pay on Fund distributions or the redemption of Fund shares.
|
| Net Assets |
$ 899,489,126
|
| Holdings Count | shares |
64
|
| Advisory Fees Paid, Amount |
$ 3,583,563
|
| Investment Company, Portfolio Turnover |
11.00%
|
| Additional Fund Statistics [Text Block] |
| Net Assets |
$899,489,126 |
| Number of Portfolio Holdings |
64 |
| Portfolio Turnover Rate |
11% |
| Total Advisory Fees Paid |
$3,583,563 |
|
| Holdings [Text Block] |
|
Industrials
|
28.7% |
|
Financials
|
15.8% |
|
Health Care
|
11.3% |
|
Real Estate
|
9.9% |
|
Consumer Discretionary
|
9.6% |
|
Registered Investment Companies
|
7.3% |
|
Information Technology
|
6.6% |
|
Consumer Staples
|
5.6% |
|
Materials
|
3.0% |
|
Energy
|
2.9% |
|
Communication Services
|
1.8% |
|
Utilities
|
1.4% |
|
Liabilities in Excess of Other Assets
|
-3.9% |

|
WESCO International, Inc.
|
5.0 |
|
Red Rock Resorts, Inc. Class A
|
5.0 |
|
Mr. Cooper Group, Inc.
|
4.4 |
|
Post Holdings, Inc.
|
4.0 |
|
Regal Rexnord Corp.
|
3.7 |
|
Gates Industrial Corp. plc
|
3.6 |
|
Huntington Ingalls Industries, Inc.
|
3.3 |
|
CubeSmart
|
3.1 |
|
SS&C Technologies Holdings, Inc.
|
2.6 |
|
Webster Financial Corp.
|
2.5 |
|
| Largest Holdings [Text Block] |
|
WESCO International, Inc.
|
5.0 |
|
Red Rock Resorts, Inc. Class A
|
5.0 |
|
Mr. Cooper Group, Inc.
|
4.4 |
|
Post Holdings, Inc.
|
4.0 |
|
Regal Rexnord Corp.
|
3.7 |
|
Gates Industrial Corp. plc
|
3.6 |
|
Huntington Ingalls Industries, Inc.
|
3.3 |
|
CubeSmart
|
3.1 |
|
SS&C Technologies Holdings, Inc.
|
2.6 |
|
Webster Financial Corp.
|
2.5 |
|
| Diamond Hill Small-Mid Cap Fund | Class Y |
|
| Shareholder Report [Line Items] |
|
| Fund Name |
Diamond Hill Small-Mid Cap Fund
|
| Class Name |
Class Y
|
| Trading Symbol |
DHMYX
|
| Annual or Semi-Annual Statement [Text Block] |
This semi-annual shareholder report contains important information about Diamond Hill Small-Mid Cap Fund (the "Fund") for the period of January 1, 2025 to June 30, 2025.
|
| Shareholder Report Annual or Semi-Annual |
semi-annual shareholder report
|
| Additional Information [Text Block] |
You can find additional information about the Fund at https://diamond-hill.com/documents. You can also request this information by contacting us at 888-226-5595 or info@diamond-hill.com or by contacting your financial advisor.
|
| Additional Information Phone Number |
888-226-5595
|
| Additional Information Email |
info@diamond-hill.com
|
| Additional Information Website |
https://diamond-hill.com/documents
|
| Expenses [Text Block] |
|
| Expenses Paid, Amount |
$ 40
|
| Expense Ratio, Percent |
0.80%
|
| Factors Affecting Performance [Text Block] |
The Fund (Ticker: DHMYX) returned 1.17% for the 6-month period ended June 30, 2025. Over that same period, the Russell 2500 Index returned 0.44%. Security selection is the primary driver of the Fund's performance during any given period — the top and bottom contributors to return are illustrated in the chart. |
| Performance Past Does Not Indicate Future [Text] |
Past performance is not indicative of future results.
|
| Line Graph [Table Text Block] |
|
| Average Annual Return [Table Text Block] |
|
Class Y |
1.17%
|
8.65%
|
12.72%
|
6.92%
|
|
Russell 3000 Index |
5.75
|
15.30
|
15.96
|
12.96
|
|
Russell 2500 Index |
0.44
|
9.91
|
11.44
|
8.39
|
|
| No Deduction of Taxes [Text Block] |
The performance of the above Fund does not reflect the deduction of taxes that a shareholder would pay on Fund distributions or the redemption of Fund shares.
|
| Net Assets |
$ 899,489,126
|
| Holdings Count | shares |
64
|
| Advisory Fees Paid, Amount |
$ 3,583,563
|
| Investment Company, Portfolio Turnover |
11.00%
|
| Additional Fund Statistics [Text Block] |
| Net Assets |
$899,489,126 |
| Number of Portfolio Holdings |
64 |
| Portfolio Turnover Rate |
11% |
| Total Advisory Fees Paid |
$3,583,563 |
|
| Holdings [Text Block] |
|
Industrials
|
28.7% |
|
Financials
|
15.8% |
|
Health Care
|
11.3% |
|
Real Estate
|
9.9% |
|
Consumer Discretionary
|
9.6% |
|
Registered Investment Companies
|
7.3% |
|
Information Technology
|
6.6% |
|
Consumer Staples
|
5.6% |
|
Materials
|
3.0% |
|
Energy
|
2.9% |
|
Communication Services
|
1.8% |
|
Utilities
|
1.4% |
|
Liabilities in Excess of Other Assets
|
-3.9% |
|
WESCO International, Inc.
|
5.0 |
|
Red Rock Resorts, Inc. Class A
|
5.0 |
|
Mr. Cooper Group, Inc.
|
4.4 |
|
Post Holdings, Inc.
|
4.0 |
|
Regal Rexnord Corp.
|
3.7 |
|
Gates Industrial Corp. plc
|
3.6 |
|
Huntington Ingalls Industries, Inc.
|
3.3 |
|
CubeSmart
|
3.1 |
|
SS&C Technologies Holdings, Inc.
|
2.6 |
|
Webster Financial Corp.
|
2.5 |
|
| Largest Holdings [Text Block] |
|
WESCO International, Inc.
|
5.0 |
|
Red Rock Resorts, Inc. Class A
|
5.0 |
|
Mr. Cooper Group, Inc.
|
4.4 |
|
Post Holdings, Inc.
|
4.0 |
|
Regal Rexnord Corp.
|
3.7 |
|
Gates Industrial Corp. plc
|
3.6 |
|
Huntington Ingalls Industries, Inc.
|
3.3 |
|
CubeSmart
|
3.1 |
|
SS&C Technologies Holdings, Inc.
|
2.6 |
|
Webster Financial Corp.
|
2.5 |
|
| Diamond Hill Mid Cap Fund | Investor Class |
|
| Shareholder Report [Line Items] |
|
| Fund Name |
Diamond Hill Mid Cap Fund
|
| Class Name |
Investor
|
| Trading Symbol |
DHPAX
|
| Annual or Semi-Annual Statement [Text Block] |
This semi-annual shareholder report contains important information about Diamond Hill Mid Cap Fund (the "Fund") for the period of January 1, 2025 to June 30, 2025.
|
| Shareholder Report Annual or Semi-Annual |
semi-annual shareholder report
|
| Additional Information [Text Block] |
You can find additional information about the Fund at https://diamond-hill.com/documents. You can also request this information by contacting us at 888-226-5595 or info@diamond-hill.com or by contacting your financial advisor.
|
| Additional Information Phone Number |
888-226-5595
|
| Additional Information Email |
info@diamond-hill.com
|
| Additional Information Website |
https://diamond-hill.com/documents
|
| Expenses [Text Block] |
|
| Expenses Paid, Amount |
$ 54
|
| Expense Ratio, Percent |
1.07%
|
| Factors Affecting Performance [Text Block] |
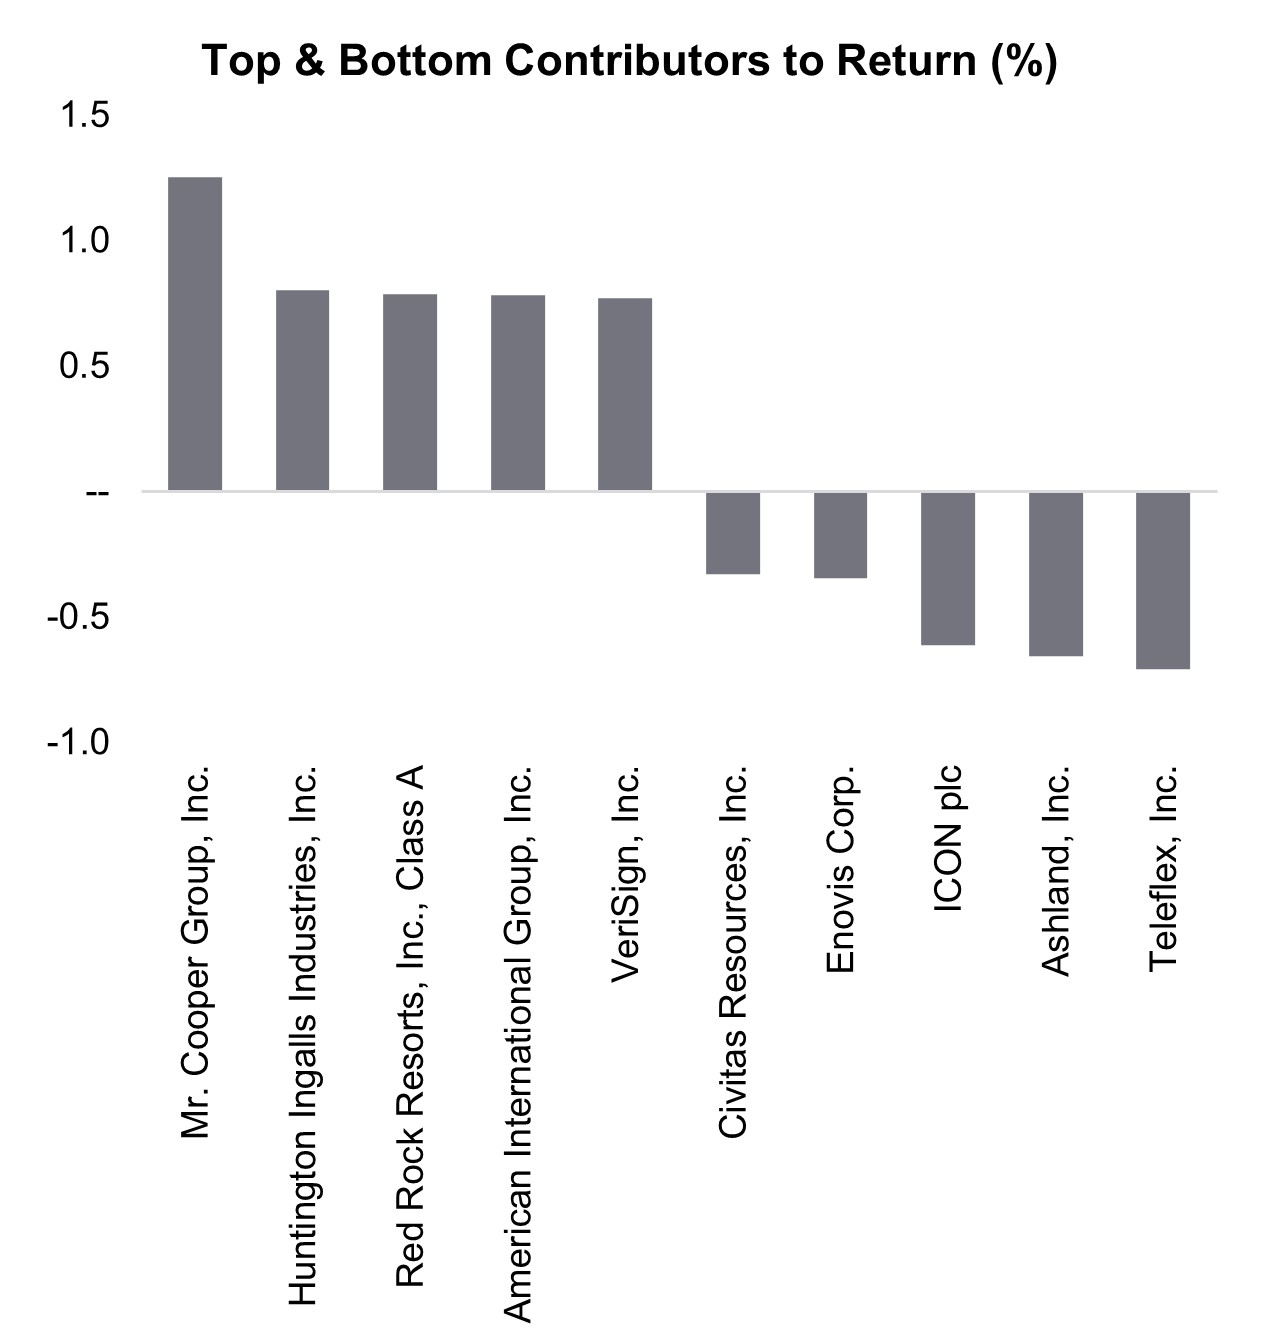
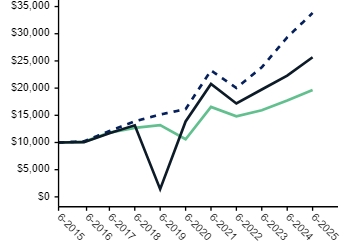
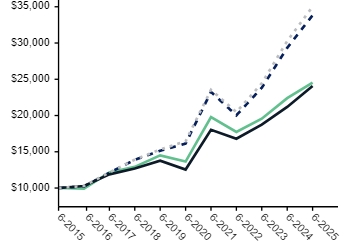
The Fund (Ticker: DHPAX) returned 4.86% for the 6-month period ended June 30, 2025. Over that same period, the Russell Midcap Index returned 4.84%. Security selection is the primary driver of the Fund's performance during any given period — the top and bottom contributors to return are illustrated in the chart. |
| Performance Past Does Not Indicate Future [Text] |
Past performance is not indicative of future results.
|
| Line Graph [Table Text Block] |
|
| Average Annual Return [Table Text Block] |
|
Investor |
4.86%
|
10.99%
|
13.15%
|
6.99%
|
|
Russell 3000 Index |
5.75
|
15.30
|
15.96
|
12.96
|
|
Russell Midcap Index |
4.84
|
15.21
|
13.11
|
9.89
|
|
| No Deduction of Taxes [Text Block] |
The performance of the above Fund does not reflect the deduction of taxes that a shareholder would pay on Fund distributions or the redemption of Fund shares.
|
| Net Assets |
$ 82,017,666
|
| Holdings Count | shares |
57
|
| Advisory Fees Paid, Amount |
$ 396,629
|
| Investment Company, Portfolio Turnover |
13.00%
|
| Additional Fund Statistics [Text Block] |
| Net Assets |
$82,017,666 |
| Number of Portfolio Holdings |
57 |
| Portfolio Turnover Rate |
13% |
| Total Advisory Fees Paid |
$396,629 |
|
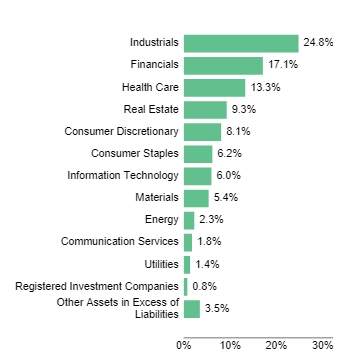
| Holdings [Text Block] |
|
Industrials
|
24.8% |
|
Financials
|
17.1% |
|
Health Care
|
13.3% |
|
Real Estate
|
9.3% |
|
Consumer Discretionary
|
8.1% |
|
Consumer Staples
|
6.2% |
|
Information Technology
|
6.0% |
|
Materials
|
5.4% |
|
Energy
|
2.3% |
|
Communication Services
|
1.8% |
|
Utilities
|
1.4% |
|
Registered Investment Companies
|
0.8% |
|
Other Assets in Excess of Liabilities
|
3.5% |
|
WESCO International, Inc.
|
4.9 |
|
Red Rock Resorts, Inc. Class A
|
4.7 |
|
American International Group, Inc.
|
4.6 |
|
Mr. Cooper Group, Inc.
|
4.5 |
|
Post Holdings, Inc.
|
3.7 |
|
Boston Scientific Corp.
|
3.6 |
|
Regal Rexnord Corp.
|
3.6 |
|
Parker-Hannifin Corp.
|
3.3 |
|
Huntington Ingalls Industries, Inc.
|
2.6 |
|
Freeport-McMoRan, Inc.
|
2.5 |
|
| Largest Holdings [Text Block] |
|
WESCO International, Inc.
|
4.9 |
|
Red Rock Resorts, Inc. Class A
|
4.7 |
|
American International Group, Inc.
|
4.6 |
|
Mr. Cooper Group, Inc.
|
4.5 |
|
Post Holdings, Inc.
|
3.7 |
|
Boston Scientific Corp.
|
3.6 |
|
Regal Rexnord Corp.
|
3.6 |
|
Parker-Hannifin Corp.
|
3.3 |
|
Huntington Ingalls Industries, Inc.
|
2.6 |
|
Freeport-McMoRan, Inc.
|
2.5 |
|
| Diamond Hill Mid Cap Fund | Class I |
|
| Shareholder Report [Line Items] |
|
| Fund Name |
Diamond Hill Mid Cap Fund
|
| Class Name |
Class I
|
| Trading Symbol |
DHPIX
|
| Annual or Semi-Annual Statement [Text Block] |
This semi-annual shareholder report contains important information about Diamond Hill Mid Cap Fund (the "Fund") for the period of January 1, 2025 to June 30, 2025.
|
| Shareholder Report Annual or Semi-Annual |
semi-annual shareholder report
|
| Additional Information [Text Block] |
You can find additional information about the Fund at https://diamond-hill.com/documents. You can also request this information by contacting us at 888-226-5595 or info@diamond-hill.com or by contacting your financial advisor.
|
| Additional Information Phone Number |
888-226-5595
|
| Additional Information Email |
info@diamond-hill.com
|
| Additional Information Website |
https://diamond-hill.com/documents
|
| Expenses [Text Block] |
|
| Expenses Paid, Amount |
$ 40
|
| Expense Ratio, Percent |
0.78%
|
| Factors Affecting Performance [Text Block] |
The Fund (Ticker: DHPIX) returned 4.99% for the 6-month period ended June 30, 2025. Over that same period, the Russell Midcap Index returned 4.84%. Security selection is the primary driver of the Fund's performance during any given period — the top and bottom contributors to return are illustrated in the chart. |
| Performance Past Does Not Indicate Future [Text] |
Past performance is not indicative of future results.
|
| Line Graph [Table Text Block] |
|
| Average Annual Return [Table Text Block] |
|
Class I |
4.99%
|
11.32%
|
13.49%
|
7.31%
|
|
Russell 3000 Index |
5.75
|
15.30
|
15.96
|
12.96
|
|
Russell Midcap Index |
4.84
|
15.21
|
13.11
|
9.89
|
|
| No Deduction of Taxes [Text Block] |
The performance of the above Fund does not reflect the deduction of taxes that a shareholder would pay on Fund distributions or the redemption of Fund shares.
|
| Net Assets |
$ 82,017,666
|
| Holdings Count | shares |
57
|
| Advisory Fees Paid, Amount |
$ 396,629
|
| Investment Company, Portfolio Turnover |
13.00%
|
| Additional Fund Statistics [Text Block] |
| Net Assets |
$82,017,666 |
| Number of Portfolio Holdings |
57 |
| Portfolio Turnover Rate |
13% |
| Total Advisory Fees Paid |
$396,629 |
|
| Holdings [Text Block] |
|
Industrials
|
24.8% |
|
Financials
|
17.1% |
|
Health Care
|
13.3% |
|
Real Estate
|
9.3% |
|
Consumer Discretionary
|
8.1% |
|
Consumer Staples
|
6.2% |
|
Information Technology
|
6.0% |
|
Materials
|
5.4% |
|
Energy
|
2.3% |
|
Communication Services
|
1.8% |
|
Utilities
|
1.4% |
|
Registered Investment Companies
|
0.8% |
|
Other Assets in Excess of Liabilities
|
3.5% |

|
WESCO International, Inc.
|
4.9 |
|
Red Rock Resorts, Inc. Class A
|
4.7 |
|
American International Group, Inc.
|
4.6 |
|
Mr. Cooper Group, Inc.
|
4.5 |
|
Post Holdings, Inc.
|
3.7 |
|
Boston Scientific Corp.
|
3.6 |
|
Regal Rexnord Corp.
|
3.6 |
|
Parker-Hannifin Corp.
|
3.3 |
|
Huntington Ingalls Industries, Inc.
|
2.6 |
|
Freeport-McMoRan, Inc.
|
2.5 |
|
| Largest Holdings [Text Block] |
|
WESCO International, Inc.
|
4.9 |
|
Red Rock Resorts, Inc. Class A
|
4.7 |
|
American International Group, Inc.
|
4.6 |
|
Mr. Cooper Group, Inc.
|
4.5 |
|
Post Holdings, Inc.
|
3.7 |
|
Boston Scientific Corp.
|
3.6 |
|
Regal Rexnord Corp.
|
3.6 |
|
Parker-Hannifin Corp.
|
3.3 |
|
Huntington Ingalls Industries, Inc.
|
2.6 |
|
Freeport-McMoRan, Inc.
|
2.5 |
|
| Diamond Hill Mid Cap Fund | Class Y |
|
| Shareholder Report [Line Items] |
|
| Fund Name |
Diamond Hill Mid Cap Fund
|
| Class Name |
Class Y
|
| Trading Symbol |
DHPYX
|
| Annual or Semi-Annual Statement [Text Block] |
This semi-annual shareholder report contains important information about Diamond Hill Mid Cap Fund (the "Fund") for the period of January 1, 2025 to June 30, 2025.
|
| Shareholder Report Annual or Semi-Annual |
semi-annual shareholder report
|
| Additional Information [Text Block] |
You can find additional information about the Fund at https://diamond-hill.com/documents. You can also request this information by contacting us at 888-226-5595 or info@diamond-hill.com or by contacting your financial advisor.
|
| Additional Information Phone Number |
888-226-5595
|
| Additional Information Email |
info@diamond-hill.com
|
| Additional Information Website |
https://diamond-hill.com/documents
|
| Expenses [Text Block] |
|
| Expenses Paid, Amount |
$ 34
|
| Expense Ratio, Percent |
0.66%
|
| Factors Affecting Performance [Text Block] |
The Fund (Ticker: DHPYX) returned 5.15% for the 6-month period ended June 30, 2025. Over that same period, the Russell Midcap Index returned 4.84%. Security selection is the primary driver of the Fund's performance during any given period — the top and bottom contributors to return are illustrated in the chart. |
| Performance Past Does Not Indicate Future [Text] |
Past performance is not indicative of future results.
|
| Line Graph [Table Text Block] |
|
| Average Annual Return [Table Text Block] |
|
Class Y |
5.15%
|
11.48%
|
13.63%
|
7.44%
|
|
Russell 3000 Index |
5.75
|
15.30
|
15.96
|
12.96
|
|
Russell Midcap Index |
4.84
|
15.21
|
13.11
|
9.89
|
|
| No Deduction of Taxes [Text Block] |
The performance of the above Fund does not reflect the deduction of taxes that a shareholder would pay on Fund distributions or the redemption of Fund shares.
|
| Net Assets |
$ 82,017,666
|
| Holdings Count | shares |
57
|
| Advisory Fees Paid, Amount |
$ 396,629
|
| Investment Company, Portfolio Turnover |
13.00%
|
| Additional Fund Statistics [Text Block] |
| Net Assets |
$82,017,666 |
| Number of Portfolio Holdings |
57 |
| Portfolio Turnover Rate |
13% |
| Total Advisory Fees Paid |
$396,629 |
|
| Holdings [Text Block] |
|
Industrials
|
24.8% |
|
Financials
|
17.1% |
|
Health Care
|
13.3% |
|
Real Estate
|
9.3% |
|
Consumer Discretionary
|
8.1% |
|
Consumer Staples
|
6.2% |
|
Information Technology
|
6.0% |
|
Materials
|
5.4% |
|
Energy
|
2.3% |
|
Communication Services
|
1.8% |
|
Utilities
|
1.4% |
|
Registered Investment Companies
|
0.8% |
|
Other Assets in Excess of Liabilities
|
3.5% |

|
WESCO International, Inc.
|
4.9 |
|
Red Rock Resorts, Inc. Class A
|
4.7 |
|
American International Group, Inc.
|
4.6 |
|
Mr. Cooper Group, Inc.
|
4.5 |
|
Post Holdings, Inc.
|
3.7 |
|
Boston Scientific Corp.
|
3.6 |
|
Regal Rexnord Corp.
|
3.6 |
|
Parker-Hannifin Corp.
|
3.3 |
|
Huntington Ingalls Industries, Inc.
|
2.6 |
|
Freeport-McMoRan, Inc.
|
2.5 |
|
| Largest Holdings [Text Block] |
|
WESCO International, Inc.
|
4.9 |
|
Red Rock Resorts, Inc. Class A
|
4.7 |
|
American International Group, Inc.
|
4.6 |
|
Mr. Cooper Group, Inc.
|
4.5 |
|
Post Holdings, Inc.
|
3.7 |
|
Boston Scientific Corp.
|
3.6 |
|
Regal Rexnord Corp.
|
3.6 |
|
Parker-Hannifin Corp.
|
3.3 |
|
Huntington Ingalls Industries, Inc.
|
2.6 |
|
Freeport-McMoRan, Inc.
|
2.5 |
|
| Diamond Hill Large Cap Fund | Investor Class |
|
| Shareholder Report [Line Items] |
|
| Fund Name |
Diamond Hill Large Cap Fund
|
| Class Name |
Investor
|
| Trading Symbol |
DHLAX
|
| Annual or Semi-Annual Statement [Text Block] |
This semi-annual shareholder report contains important information about Diamond Hill Large Cap Fund (the "Fund") for the period of January 1, 2025 to June 30, 2025.
|
| Shareholder Report Annual or Semi-Annual |
semi-annual shareholder report
|
| Additional Information [Text Block] |
You can find additional information about the Fund at https://diamond-hill.com/documents. You can also request this information by contacting us at 888-226-5595 or info@diamond-hill.com or by contacting your financial advisor.
|
| Additional Information Phone Number |
888-226-5595
|
| Additional Information Email |
info@diamond-hill.com
|
| Additional Information Website |
https://diamond-hill.com/documents
|
| Expenses [Text Block] |
|
| Expenses Paid, Amount |
$ 49
|
| Expense Ratio, Percent |
0.96%
|
| Factors Affecting Performance [Text Block] |
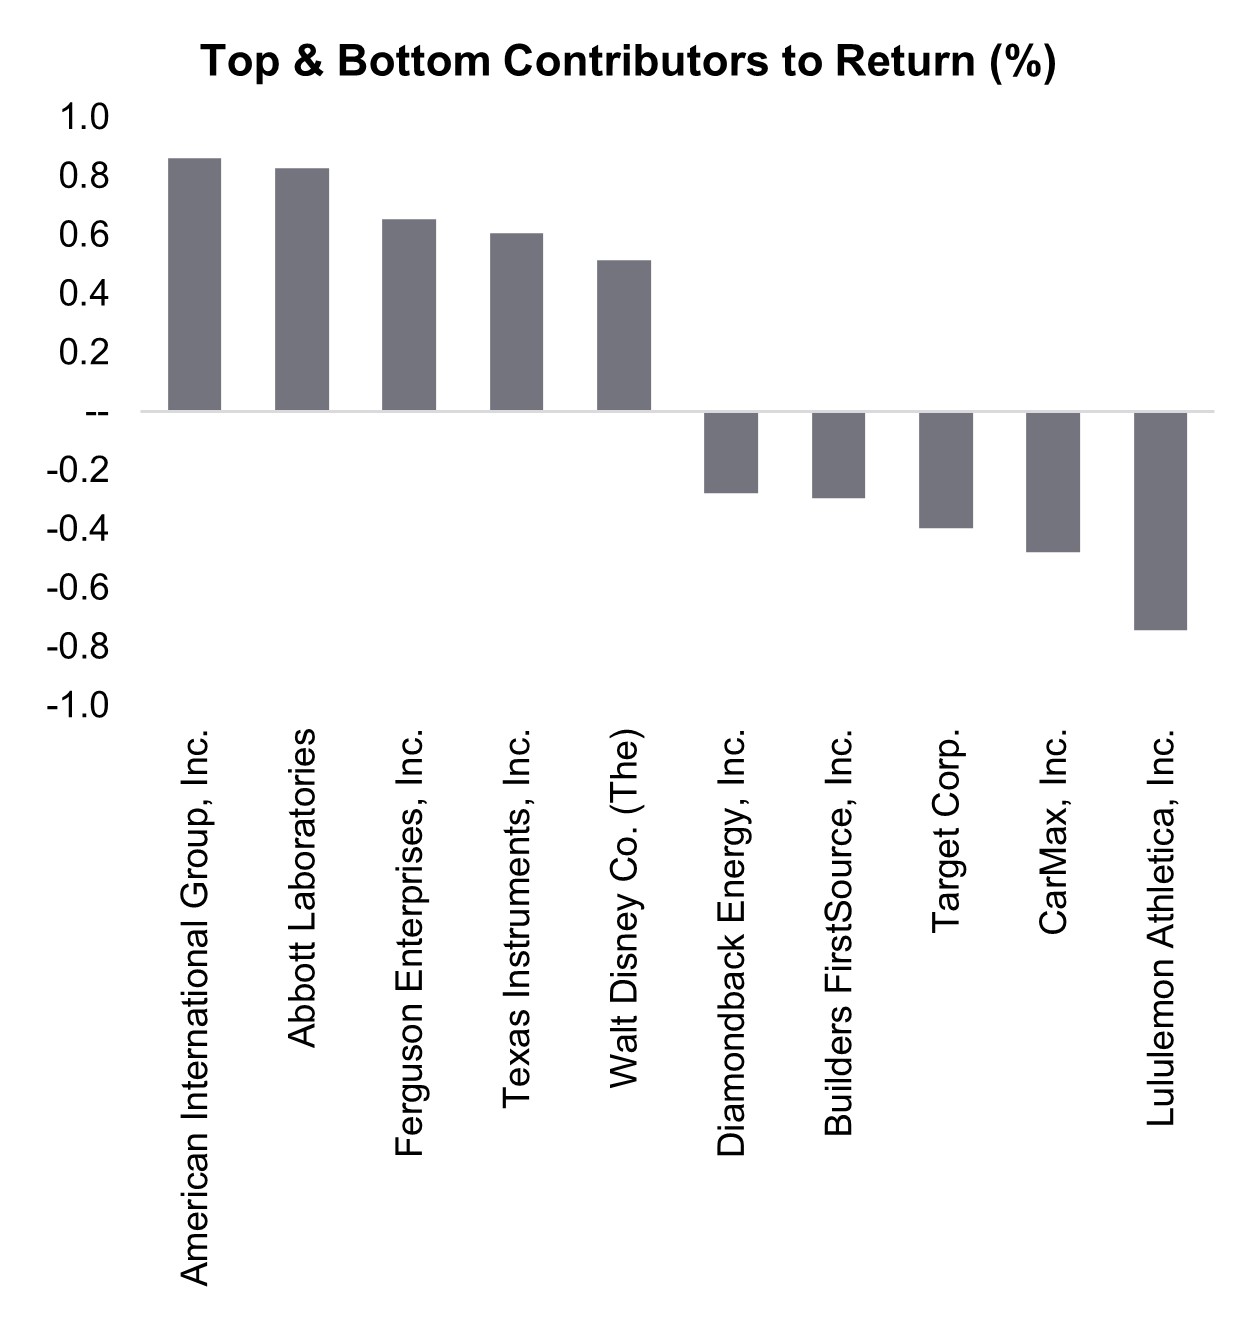
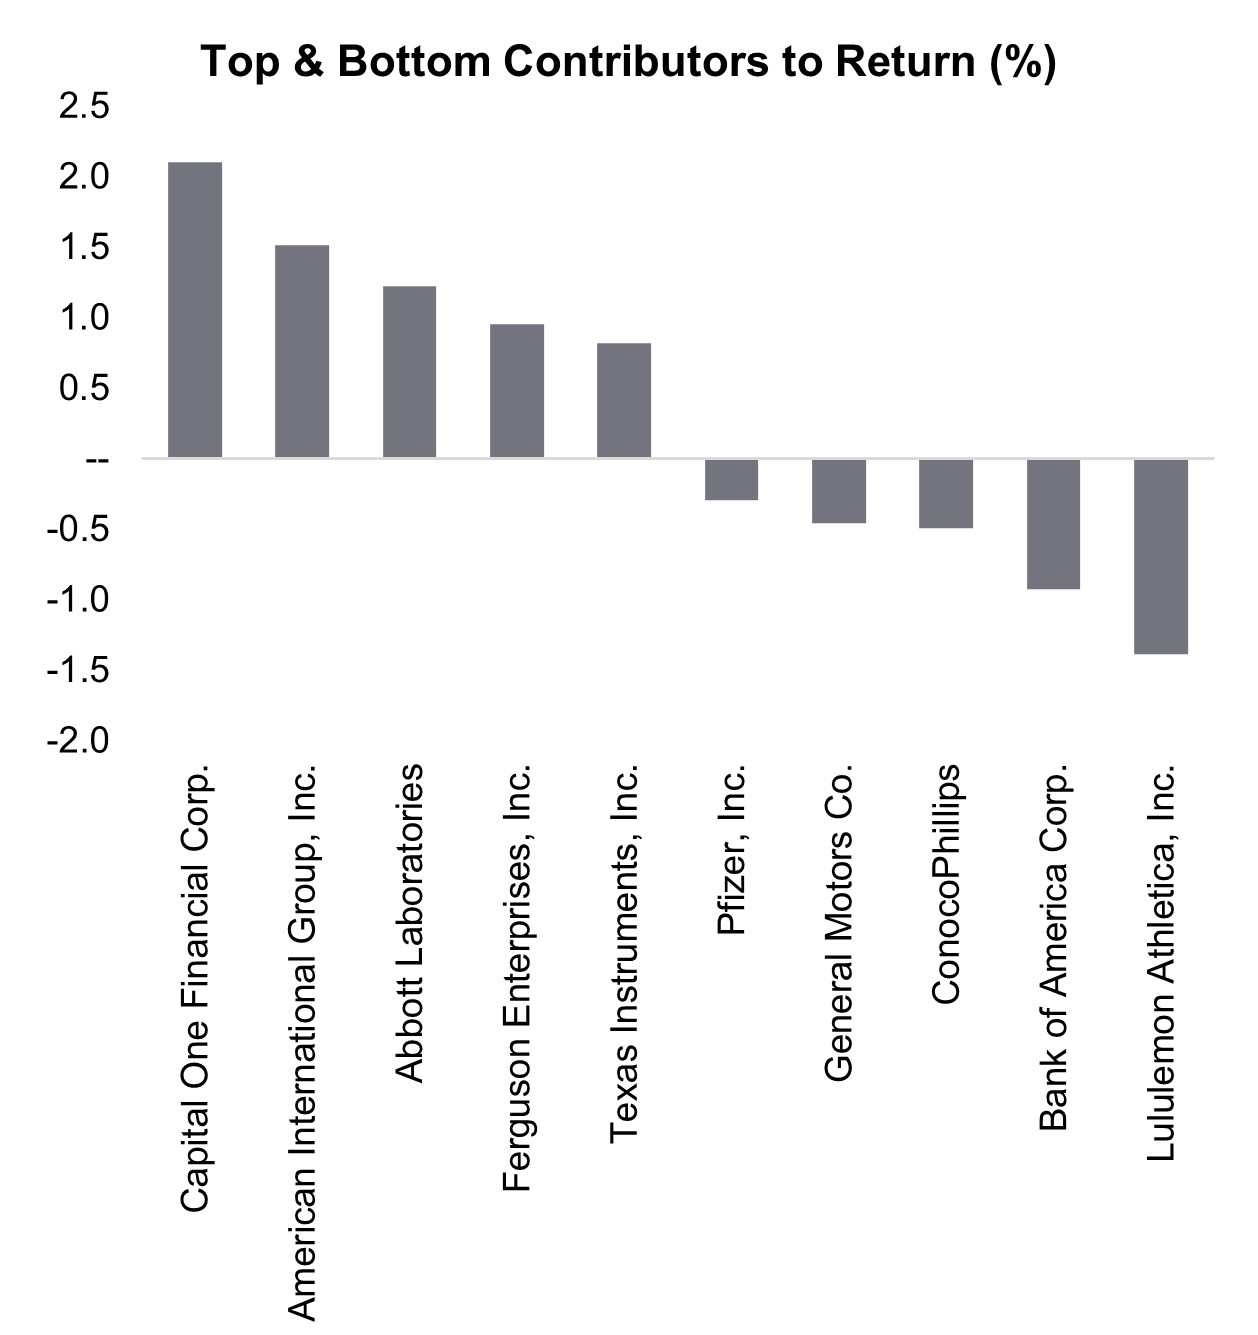
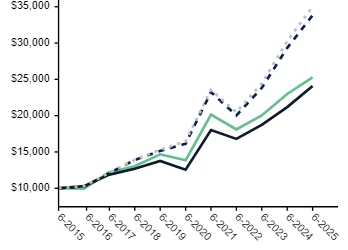
The Fund (Ticker: DHLAX) returned 4.10% for the 6-month period ended June 30, 2025. Over that same period, the Russell 1000 Value Index returned 6.00%. Security selection is the primary driver of the Fund's performance during any given period — the top and bottom contributors to return are illustrated in the chart. |
| Performance Past Does Not Indicate Future [Text] |
Past performance is not indicative of future results.
|
| Line Graph [Table Text Block] |
|
| Average Annual Return [Table Text Block] |
|
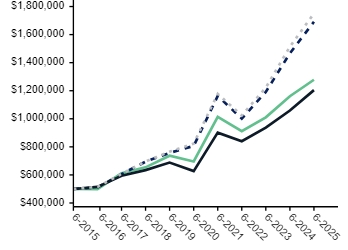
Investor |
4.10%
|
9.67%
|
12.46%
|
9.40%
|
|
Russell 3000 Index |
5.75
|
15.30
|
15.96
|
12.96
|
|
Russell 1000 Value Index |
6.00
|
13.70
|
13.93
|
9.19
|
|
Russell 1000 Index |
6.12
|
15.66
|
16.30
|
13.35
|
|
| No Deduction of Taxes [Text Block] |
The performance of the above Fund does not reflect the deduction of taxes that a shareholder would pay on Fund distributions or the redemption of Fund shares.
|
| Net Assets |
$ 8,414,727,808
|
| Holdings Count | shares |
48
|
| Advisory Fees Paid, Amount |
$ 20,831,323
|
| Investment Company, Portfolio Turnover |
26.00%
|
| Additional Fund Statistics [Text Block] |
| Net Assets |
$8,414,727,808 |
| Number of Portfolio Holdings |
48 |
| Portfolio Turnover Rate |
26% |
| Total Advisory Fees Paid |
$20,831,323 |
|
| Holdings [Text Block] |
|
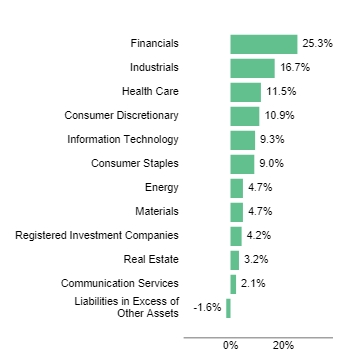
Financials
|
25.3% |
|
Industrials
|
16.7% |
|
Health Care
|
11.5% |
|
Consumer Discretionary
|
10.9% |
|
Information Technology
|
9.3% |
|
Consumer Staples
|
9.0% |
|
Energy
|
4.7% |
|
Materials
|
4.7% |
|
Registered Investment Companies
|
4.2% |
|
Real Estate
|
3.2% |
|
Communication Services
|
2.1% |
|
Liabilities in Excess of Other Assets
|
-1.6% |

|
American International Group, Inc.
|
4.8 |
|
Berkshire Hathaway, Inc., Class B
|
4.3 |
|
Abbott Laboratories
|
4.2 |
|
Texas Instruments, Inc.
|
3.9 |
|
Aon plc, Class A
|
3.2 |
|
Capital One Financial Corp.
|
3.2 |
|
Colgate-Palmolive Co.
|
3.1 |
|
ConocoPhillips
|
2.9 |
|
Sysco Corp.
|
2.8 |
|
Bank of America Corp.
|
2.6 |
|
| Largest Holdings [Text Block] |
|
American International Group, Inc.
|
4.8 |
|
Berkshire Hathaway, Inc., Class B
|
4.3 |
|
Abbott Laboratories
|
4.2 |
|
Texas Instruments, Inc.
|
3.9 |
|
Aon plc, Class A
|
3.2 |
|
Capital One Financial Corp.
|
3.2 |
|
Colgate-Palmolive Co.
|
3.1 |
|
ConocoPhillips
|
2.9 |
|
Sysco Corp.
|
2.8 |
|
Bank of America Corp.
|
2.6 |
|
| Diamond Hill Large Cap Fund | Class I |
|
| Shareholder Report [Line Items] |
|
| Fund Name |
Diamond Hill Large Cap Fund
|
| Class Name |
Class I
|
| Trading Symbol |
DHLRX
|
| Annual or Semi-Annual Statement [Text Block] |
This semi-annual shareholder report contains important information about Diamond Hill Large Cap Fund (the "Fund") for the period of January 1, 2025 to June 30, 2025.
|
| Shareholder Report Annual or Semi-Annual |
semi-annual shareholder report
|
| Additional Information [Text Block] |
You can find additional information about the Fund at https://diamond-hill.com/documents. You can also request this information by contacting us at 888-226-5595 or info@diamond-hill.com or by contacting your financial advisor.
|
| Additional Information Phone Number |
888-226-5595
|
| Additional Information Email |
info@diamond-hill.com
|
| Additional Information Website |
https://diamond-hill.com/documents
|
| Expenses [Text Block] |
|
| Expenses Paid, Amount |
$ 34
|
| Expense Ratio, Percent |
0.67%
|
| Factors Affecting Performance [Text Block] |
The Fund (Ticker: DHLRX) returned 4.27% for the 6-month period ended June 30, 2025. Over that same period, the Russell 1000 Value Index returned 6.00%. Security selection is the primary driver of the Fund's performance during any given period — the top and bottom contributors to return are illustrated in the chart. |
| Performance Past Does Not Indicate Future [Text] |
Past performance is not indicative of future results.
|
| Line Graph [Table Text Block] |
|
| Average Annual Return [Table Text Block] |
|
Class I |
4.27%
|
9.99%
|
12.79%
|
9.72%
|
|
Russell 3000 Index |
5.75
|
15.30
|
15.96
|
12.96
|
|
Russell 1000 Value Index |
6.00
|
13.70
|
13.93
|
9.19
|
|
Russell 1000 Index |
6.12
|
15.66
|
16.30
|
13.35
|
|
| No Deduction of Taxes [Text Block] |
The performance of the above Fund does not reflect the deduction of taxes that a shareholder would pay on Fund distributions or the redemption of Fund shares.
|
| Net Assets |
$ 8,414,727,808
|
| Holdings Count | shares |
48
|
| Advisory Fees Paid, Amount |
$ 20,831,323
|
| Investment Company, Portfolio Turnover |
26.00%
|
| Additional Fund Statistics [Text Block] |
| Net Assets |
$8,414,727,808 |
| Number of Portfolio Holdings |
48 |
| Portfolio Turnover Rate |
26% |
| Total Advisory Fees Paid |
$20,831,323 |
|
| Holdings [Text Block] |
|
Financials
|
25.3% |
|
Industrials
|
16.7% |
|
Health Care
|
11.5% |
|
Consumer Discretionary
|
10.9% |
|
Information Technology
|
9.3% |
|
Consumer Staples
|
9.0% |
|
Energy
|
4.7% |
|
Materials
|
4.7% |
|
Registered Investment Companies
|
4.2% |
|
Real Estate
|
3.2% |
|
Communication Services
|
2.1% |
|
Liabilities in Excess of Other Assets
|
-1.6% |
|
American International Group, Inc.
|
4.8 |
|
Berkshire Hathaway, Inc., Class B
|
4.3 |
|
Abbott Laboratories
|
4.2 |
|
Texas Instruments, Inc.
|
3.9 |
|
Aon plc, Class A
|
3.2 |
|
Capital One Financial Corp.
|
3.2 |
|
Colgate-Palmolive Co.
|
3.1 |
|
ConocoPhillips
|
2.9 |
|
Sysco Corp.
|
2.8 |
|
Bank of America Corp.
|
2.6 |
|
| Largest Holdings [Text Block] |
|
American International Group, Inc.
|
4.8 |
|
Berkshire Hathaway, Inc., Class B
|
4.3 |
|
Abbott Laboratories
|
4.2 |
|
Texas Instruments, Inc.
|
3.9 |
|
Aon plc, Class A
|
3.2 |
|
Capital One Financial Corp.
|
3.2 |
|
Colgate-Palmolive Co.
|
3.1 |
|
ConocoPhillips
|
2.9 |
|
Sysco Corp.
|
2.8 |
|
Bank of America Corp.
|
2.6 |
|
| Diamond Hill Large Cap Fund | Class Y |
|
| Shareholder Report [Line Items] |
|
| Fund Name |
Diamond Hill Large Cap Fund
|
| Class Name |
Class Y
|
| Trading Symbol |
DHLYX
|
| Annual or Semi-Annual Statement [Text Block] |
This semi-annual shareholder report contains important information about Diamond Hill Large Cap Fund (the "Fund") for the period of January 1, 2025 to June 30, 2025.
|
| Shareholder Report Annual or Semi-Annual |
semi-annual shareholder report
|
| Additional Information [Text Block] |
You can find additional information about the Fund at https://diamond-hill.com/documents. You can also request this information by contacting us at 888-226-5595 or info@diamond-hill.com or by contacting your financial advisor.
|
| Additional Information Phone Number |
888-226-5595
|
| Additional Information Email |
info@diamond-hill.com
|
| Additional Information Website |
https://diamond-hill.com/documents
|
| Expenses [Text Block] |
|
| Expenses Paid, Amount |
$ 28
|
| Expense Ratio, Percent |
0.55%
|
| Factors Affecting Performance [Text Block] |
The Fund (Ticker: DHLYX) returned 4.33% for the 6-month period ended June 30, 2025. Over that same period, the Russell 1000 Value Index returned 6.00%. Security selection is the primary driver of the Fund's performance during any given period — the top and bottom contributors to return are illustrated in the chart. |
| Performance Past Does Not Indicate Future [Text] |
Past performance is not indicative of future results.
|
| Line Graph [Table Text Block] |
|
| Average Annual Return [Table Text Block] |
|
Class Y |
4.33%
|
10.13%
|
12.93%
|
9.84%
|
|
Russell 3000 Index |
5.75
|
15.30
|
15.96
|
12.96
|
|
Russell 1000 Value Index |
6.00
|
13.70
|
13.93
|
9.19
|
|
Russell 1000 Index |
6.12
|
15.66
|
16.30
|
13.35
|
|
| No Deduction of Taxes [Text Block] |
The performance of the above Fund does not reflect the deduction of taxes that a shareholder would pay on Fund distributions or the redemption of Fund shares.
|
| Net Assets |
$ 8,414,727,808
|
| Holdings Count | shares |
48
|
| Advisory Fees Paid, Amount |
$ 20,831,323
|
| Investment Company, Portfolio Turnover |
26.00%
|
| Additional Fund Statistics [Text Block] |
| Net Assets |
$8,414,727,808 |
| Number of Portfolio Holdings |
48 |
| Portfolio Turnover Rate |
26% |
| Total Advisory Fees Paid |
$20,831,323 |
|
| Holdings [Text Block] |
|
Financials
|
25.3% |
|
Industrials
|
16.7% |
|
Health Care
|
11.5% |
|
Consumer Discretionary
|
10.9% |
|
Information Technology
|
9.3% |
|
Consumer Staples
|
9.0% |
|
Energy
|
4.7% |
|
Materials
|
4.7% |
|
Registered Investment Companies
|
4.2% |
|
Real Estate
|
3.2% |
|
Communication Services
|
2.1% |
|
Liabilities in Excess of Other Assets
|
-1.6% |

|
American International Group, Inc.
|
4.8 |
|
Berkshire Hathaway, Inc., Class B
|
4.3 |
|
Abbott Laboratories
|
4.2 |
|
Texas Instruments, Inc.
|
3.9 |
|
Aon plc, Class A
|
3.2 |
|
Capital One Financial Corp.
|
3.2 |
|
Colgate-Palmolive Co.
|
3.1 |
|
ConocoPhillips
|
2.9 |
|
Sysco Corp.
|
2.8 |
|
Bank of America Corp.
|
2.6 |
|
| Largest Holdings [Text Block] |
|
American International Group, Inc.
|
4.8 |
|
Berkshire Hathaway, Inc., Class B
|
4.3 |
|
Abbott Laboratories
|
4.2 |
|
Texas Instruments, Inc.
|
3.9 |
|
Aon plc, Class A
|
3.2 |
|
Capital One Financial Corp.
|
3.2 |
|
Colgate-Palmolive Co.
|
3.1 |
|
ConocoPhillips
|
2.9 |
|
Sysco Corp.
|
2.8 |
|
Bank of America Corp.
|
2.6 |
|
| Diamond Hill Large Cap Concentrated Fund | Investor Class |
|
| Shareholder Report [Line Items] |
|
| Fund Name |
Diamond Hill Large Cap Concentrated Fund
|
| Class Name |
Investor
|
| Trading Symbol |
DHFAX
|
| Annual or Semi-Annual Statement [Text Block] |
This semi-annual shareholder report contains important information about Diamond Hill Large Cap Concentrated Fund (the "Fund") for the period of January 1, 2025 to June 30, 2025.
|
| Shareholder Report Annual or Semi-Annual |
semi-annual shareholder report
|
| Additional Information [Text Block] |
You can find additional information about the Fund at https://diamond-hill.com/documents. You can also request this information by contacting us at 888-226-5595 or info@diamond-hill.com or by contacting your financial advisor.
|
| Material Fund Change Notice [Text Block] |
This report describes changes to the Fund that occurred during the reporting period.
|
| Additional Information Phone Number |
888-226-5595
|
| Additional Information Email |
info@diamond-hill.com
|
| Additional Information Website |
https://diamond-hill.com/documents
|
| Expenses [Text Block] |
|
| Expenses Paid, Amount |
$ 49
|
| Expense Ratio, Percent |
0.96%
|
| Factors Affecting Performance [Text Block] |
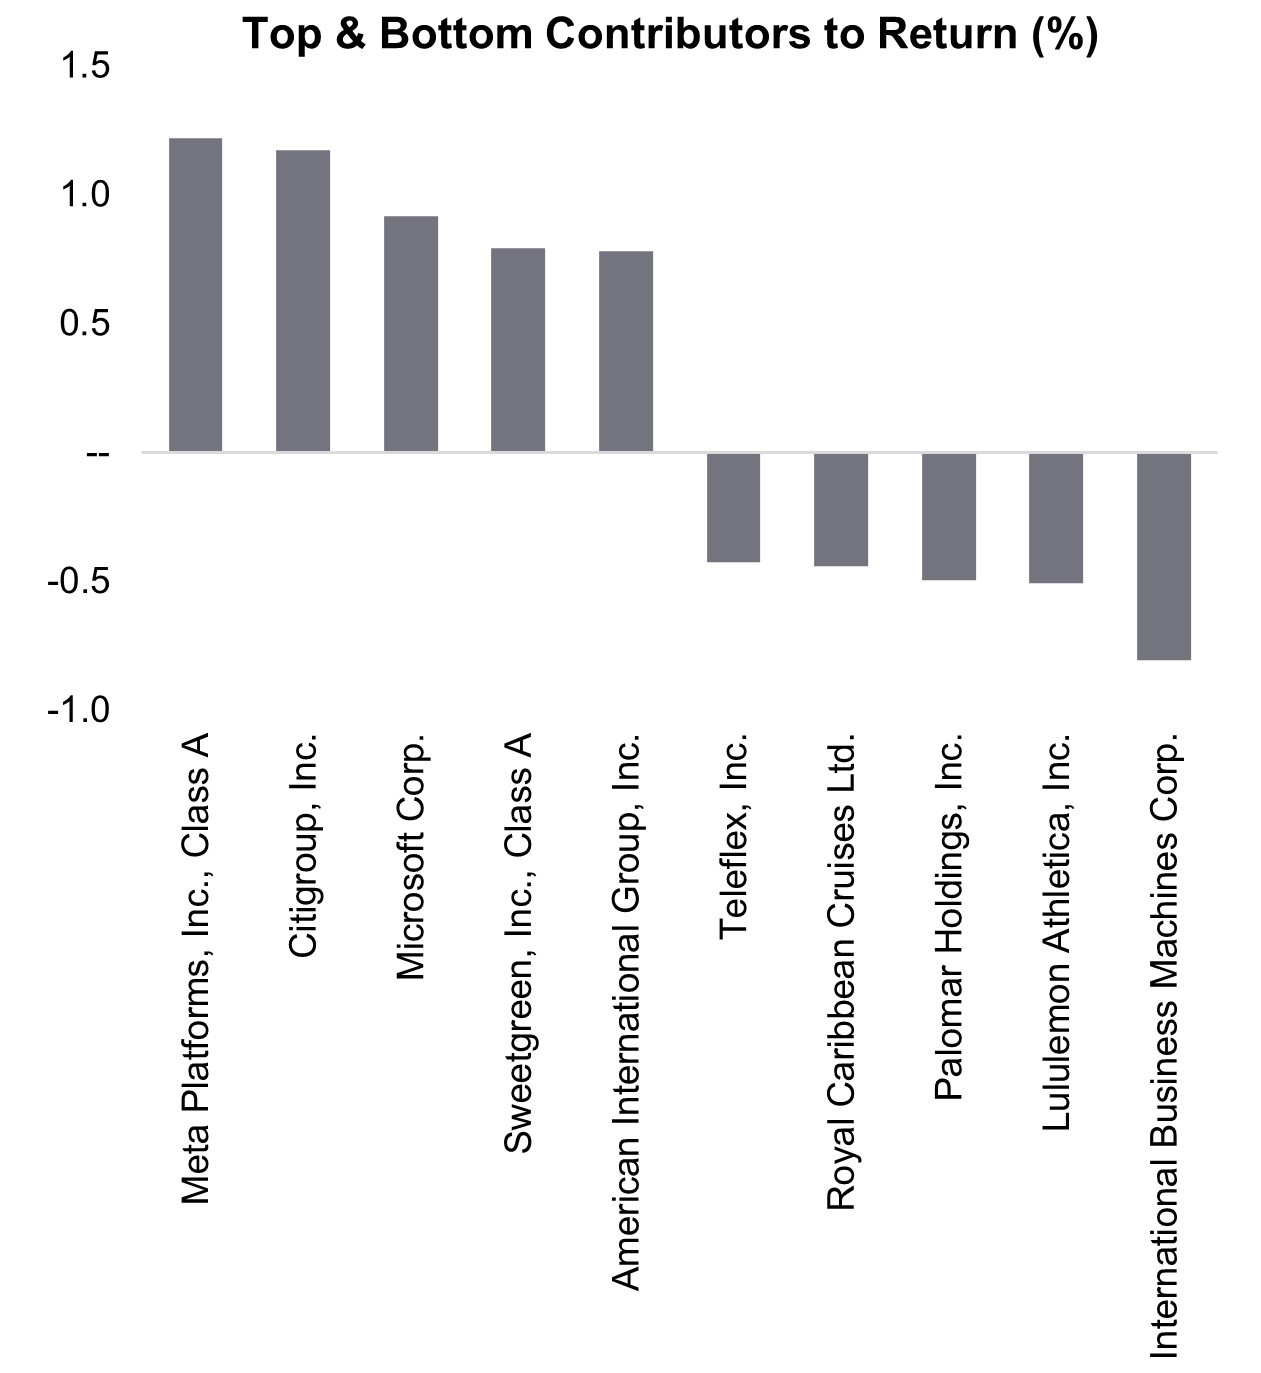
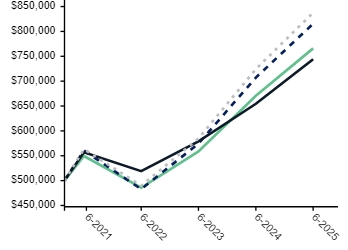
The Fund (Ticker: DHFAX) returned 7.75% for the 6-month period ended June 30, 2025. Over that same period, the Russell 1000 Value Index returned 6.00%. Security selection is the primary driver of the Fund's performance during any given period — the top and bottom contributors to return are illustrated in the chart. |
| Performance Past Does Not Indicate Future [Text] |
Past performance is not indicative of future results.
|
| Line Graph [Table Text Block] |
|
| Average Annual Return [Table Text Block] |
|
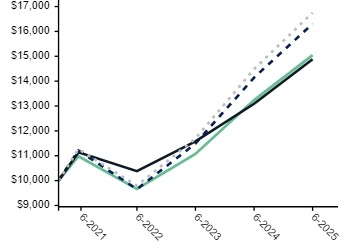
Investor |
7.75%
|
13.66%
|
9.87%
|
|
Russell 3000 Index |
5.75
|
15.30
|
11.95
|
|
Russell 1000 Value Index |
6.00
|
13.70
|
9.61
|
|
Russell 1000 Index |
6.12
|
15.66
|
12.65
|
|
| Performance Inception Date |
Feb. 26, 2021
|
| No Deduction of Taxes [Text Block] |
The performance of the above Fund does not reflect the deduction of taxes that a shareholder would pay on Fund distributions or the redemption of Fund shares.
|
| Material Change Date |
Jan. 01, 2025
|
| Net Assets |
$ 41,786,984
|
| Holdings Count | shares |
22
|
| Advisory Fees Paid, Amount |
$ 95,472
|
| Investment Company, Portfolio Turnover |
35.00%
|
| Additional Fund Statistics [Text Block] |
| Net Assets |
$41,786,984 |
| Number of Portfolio Holdings |
22 |
| Portfolio Turnover Rate |
35% |
| Total Advisory Fees Paid |
$95,472 |
|
| Holdings [Text Block] |
|
Financials
|
25.6% |
|
Industrials
|
15.4% |
|
Health Care
|
13.3% |
|
Consumer Discretionary
|
10.6% |
|
Consumer Staples
|
9.5% |
|
Information Technology
|
9.4% |
|
Energy
|
5.3% |
|
Registered Investment Companies
|
3.9% |
|
Real Estate
|
3.7% |
|
Materials
|
3.3% |
|
Liabilities in Excess of Other Assets
|
0.0% |

|
American International Group, Inc.
|
8.4 |
|
Texas Instruments, Inc.
|
6.4 |
|
Berkshire Hathaway, Inc., Class B
|
6.3 |
|
Capital One Financial Corp.
|
6.2 |
|
Abbott Laboratories
|
5.7 |
|
ConocoPhillips
|
5.3 |
|
Colgate-Palmolive Co.
|
4.9 |
|
Aon plc, Class A
|
4.7 |
|
Ferguson Enterprises, Inc.
|
4.7 |
|
Sysco Corp.
|
4.6 |
|
| Largest Holdings [Text Block] |
|
American International Group, Inc.
|
8.4 |
|
Texas Instruments, Inc.
|
6.4 |
|
Berkshire Hathaway, Inc., Class B
|
6.3 |
|
Capital One Financial Corp.
|
6.2 |
|
Abbott Laboratories
|
5.7 |
|
ConocoPhillips
|
5.3 |
|
Colgate-Palmolive Co.
|
4.9 |
|
Aon plc, Class A
|
4.7 |
|
Ferguson Enterprises, Inc.
|
4.7 |
|
Sysco Corp.
|
4.6 |
|
| Material Fund Change [Text Block] |
This is a summary of certain changes to the Fund since January 1, 2025. For more complete information, you may review the Fund's next prospectus, which we expect to be available by September 26, 2025 at https://diamond-hill.com/documents or upon request at 888-226-5595. The Board of Trustees after careful consideration and upon the recommendation of the Adviser, approved the conversion (the "Reorganization") of the Large Cap Concentrated Fund (the "Target Fund") into an exchange-traded fund ("ETF") by reorganizing the Target Fund into the newly created series of the Trust, the Diamond Hill Large Cap Concentrated ETF (the "Survivor Fund"). The Reorganization is expected to occur on or about September 26, 2025 (the "Closing Date"). The Survivor Fund will not commence operations before completion of the Reorganization and does not have existing shareholders. Shareholders are not required to approve the Reorganization, and shareholders will not be asked to vote. However, shareholders received a Combined Prospectus/Information Statement that contains information about the Survivor Fund and provides details about the terms and conditions of the Reorganization. |
| Material Fund Change Strategies [Text Block] |
The Board of Trustees after careful consideration and upon the recommendation of the Adviser, approved the conversion (the "Reorganization") of the Large Cap Concentrated Fund (the "Target Fund") into an exchange-traded fund ("ETF") by reorganizing the Target Fund into the newly created series of the Trust, the Diamond Hill Large Cap Concentrated ETF (the "Survivor Fund"). The Reorganization is expected to occur on or about September 26, 2025 (the "Closing Date"). The Survivor Fund will not commence operations before completion of the Reorganization and does not have existing shareholders. Shareholders are not required to approve the Reorganization, and shareholders will not be asked to vote. However, shareholders received a Combined Prospectus/Information Statement that contains information about the Survivor Fund and provides details about the terms and conditions of the Reorganization.
|
| Summary of Change Legend [Text Block] |
This is a summary of certain changes to the Fund since January 1, 2025. For more complete information, you may review the Fund's next prospectus, which we expect to be available by September 26, 2025 at https://diamond-hill.com/documents or upon request at 888-226-5595.
|
| Updated Prospectus Phone Number |
888-226-5595
|
| Updated Prospectus Web Address |
https://diamond-hill.com/documents
|
| Diamond Hill Large Cap Concentrated Fund | Class I |
|
| Shareholder Report [Line Items] |
|
| Fund Name |
Diamond Hill Large Cap Concentrated Fund
|
| Class Name |
Class I
|
| Trading Symbol |
DHFIX
|
| Annual or Semi-Annual Statement [Text Block] |
This semi-annual shareholder report contains important information about Diamond Hill Large Cap Concentrated Fund (the "Fund") for the period of January 1, 2025 to June 30, 2025.
|
| Shareholder Report Annual or Semi-Annual |
semi-annual shareholder report
|
| Additional Information [Text Block] |
You can find additional information about the Fund at https://diamond-hill.com/documents. You can also request this information by contacting us at 888-226-5595 or info@diamond-hill.com or by contacting your financial advisor.
|
| Material Fund Change Notice [Text Block] |
This report describes changes to the Fund that occurred during the reporting period.
|
| Additional Information Phone Number |
888-226-5595
|
| Additional Information Email |
info@diamond-hill.com
|
| Additional Information Website |
https://diamond-hill.com/documents
|
| Expenses [Text Block] |
|
| Expenses Paid, Amount |
$ 35
|
| Expense Ratio, Percent |
0.67%
|
| Factors Affecting Performance [Text Block] |
The Fund (Ticker: DHFIX) returned 7.94% for the 6-month period ended June 30, 2025. Over that same period, the Russell 1000 Value Index returned 6.00%. Security selection is the primary driver of the Fund's performance during any given period — the top and bottom contributors to return are illustrated in the chart. |
| Performance Past Does Not Indicate Future [Text] |
Past performance is not indicative of future results.
|
| Line Graph [Table Text Block] |
|
| Average Annual Return [Table Text Block] |
|
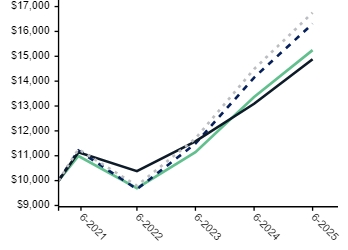
Class I |
7.94%
|
14.10%
|
10.21%
|
|
Russell 3000 Index |
5.75
|
15.30
|
11.95
|
|
Russell 1000 Value Index |
6.00
|
13.70
|
9.61
|
|
Russell 1000 Index |
6.12
|
15.66
|
12.65
|
|
| Performance Inception Date |
Feb. 26, 2021
|
| No Deduction of Taxes [Text Block] |
The performance of the above Fund does not reflect the deduction of taxes that a shareholder would pay on Fund distributions or the redemption of Fund shares.
|
| Material Change Date |
Jan. 01, 2025
|
| Net Assets |
$ 41,786,984
|
| Holdings Count | shares |
22
|
| Advisory Fees Paid, Amount |
$ 95,472
|
| Investment Company, Portfolio Turnover |
35.00%
|
| Additional Fund Statistics [Text Block] |
| Net Assets |
$41,786,984 |
| Number of Portfolio Holdings |
22 |
| Portfolio Turnover Rate |
35% |
| Total Advisory Fees Paid |
$95,472 |
|
| Holdings [Text Block] |
|
Financials
|
25.6% |
|
Industrials
|
15.4% |
|
Health Care
|
13.3% |
|
Consumer Discretionary
|
10.6% |
|
Consumer Staples
|
9.5% |
|
Information Technology
|
9.4% |
|
Energy
|
5.3% |
|
Registered Investment Companies
|
3.9% |
|
Real Estate
|
3.7% |
|
Materials
|
3.3% |
|
Liabilities in Excess of Other Assets
|
0.0% |

|
American International Group, Inc.
|
8.4 |
|
Texas Instruments, Inc.
|
6.4 |
|
Berkshire Hathaway, Inc., Class B
|
6.3 |
|
Capital One Financial Corp.
|
6.2 |
|
Abbott Laboratories
|
5.7 |
|
ConocoPhillips
|
5.3 |
|
Colgate-Palmolive Co.
|
4.9 |
|
Aon plc, Class A
|
4.7 |
|
Ferguson Enterprises, Inc.
|
4.7 |
|
Sysco Corp.
|
4.6 |
|
| Largest Holdings [Text Block] |
|
American International Group, Inc.
|
8.4 |
|
Texas Instruments, Inc.
|
6.4 |
|
Berkshire Hathaway, Inc., Class B
|
6.3 |
|
Capital One Financial Corp.
|
6.2 |
|
Abbott Laboratories
|
5.7 |
|
ConocoPhillips
|
5.3 |
|
Colgate-Palmolive Co.
|
4.9 |
|
Aon plc, Class A
|
4.7 |
|
Ferguson Enterprises, Inc.
|
4.7 |
|
Sysco Corp.
|
4.6 |
|
| Material Fund Change [Text Block] |
This is a summary of certain changes to the Fund since January 1, 2025. For more complete information, you may review the Fund's next prospectus, which we expect to be available by September 26, 2025 at https://diamond-hill.com/documents or upon request at 888-226-5595. The Board of Trustees after careful consideration and upon the recommendation of the Adviser, approved the conversion (the "Reorganization") of the Large Cap Concentrated Fund (the "Target Fund") into an exchange-traded fund ("ETF") by reorganizing the Target Fund into the newly created series of the Trust, the Diamond Hill Large Cap Concentrated ETF (the "Survivor Fund"). The Reorganization is expected to occur on or about September 26, 2025 (the "Closing Date"). The Survivor Fund will not commence operations before completion of the Reorganization and does not have existing shareholders. Shareholders are not required to approve the Reorganization, and shareholders will not be asked to vote. However, shareholders received a Combined Prospectus/Information Statement that contains information about the Survivor Fund and provides details about the terms and conditions of the Reorganization. |
| Material Fund Change Strategies [Text Block] |
The Board of Trustees after careful consideration and upon the recommendation of the Adviser, approved the conversion (the "Reorganization") of the Large Cap Concentrated Fund (the "Target Fund") into an exchange-traded fund ("ETF") by reorganizing the Target Fund into the newly created series of the Trust, the Diamond Hill Large Cap Concentrated ETF (the "Survivor Fund"). The Reorganization is expected to occur on or about September 26, 2025 (the "Closing Date"). The Survivor Fund will not commence operations before completion of the Reorganization and does not have existing shareholders. Shareholders are not required to approve the Reorganization, and shareholders will not be asked to vote. However, shareholders received a Combined Prospectus/Information Statement that contains information about the Survivor Fund and provides details about the terms and conditions of the Reorganization.
|
| Summary of Change Legend [Text Block] |
This is a summary of certain changes to the Fund since January 1, 2025. For more complete information, you may review the Fund's next prospectus, which we expect to be available by September 26, 2025 at https://diamond-hill.com/documents or upon request at 888-226-5595.
|
| Updated Prospectus Phone Number |
888-226-5595
|
| Updated Prospectus Web Address |
https://diamond-hill.com/documents
|
| Diamond Hill Large Cap Concentrated Fund | Class Y |
|
| Shareholder Report [Line Items] |
|
| Fund Name |
Diamond Hill Large Cap Concentrated Fund
|
| Class Name |
Class Y
|
| Trading Symbol |
DHFYX
|
| Annual or Semi-Annual Statement [Text Block] |
This semi-annual shareholder report contains important information about Diamond Hill Large Cap Concentrated Fund (the "Fund") for the period of January 1, 2025 to June 30, 2025.
|
| Shareholder Report Annual or Semi-Annual |
semi-annual shareholder report
|
| Additional Information [Text Block] |
You can find additional information about the Fund at https://diamond-hill.com/documents. You can also request this information by contacting us at 888-226-5595 or info@diamond-hill.com or by contacting your financial advisor.
|
| Material Fund Change Notice [Text Block] |
This report describes changes to the Fund that occurred during the reporting period.
|
| Additional Information Phone Number |
888-226-5595
|
| Additional Information Email |
info@diamond-hill.com
|
| Additional Information Website |
https://diamond-hill.com/documents
|
| Expenses [Text Block] |
|
| Expenses Paid, Amount |
$ 28
|
| Expense Ratio, Percent |
0.55%
|
| Factors Affecting Performance [Text Block] |
The Fund (Ticker: DHFYX) returned 8.01% for the 6-month period ended June 30, 2025. Over that same period, the Russell 1000 Value Index returned 6.00%. Security selection is the primary driver of the Fund's performance during any given period — the top and bottom contributors to return are illustrated in the chart. |
| Performance Past Does Not Indicate Future [Text] |
Past performance is not indicative of future results.
|
| Line Graph [Table Text Block] |
|
| Average Annual Return [Table Text Block] |
|
Class Y |
8.01%
|
14.19%
|
10.32%
|
|
Russell 3000 Index |
5.75
|
15.30
|
11.95
|
|
Russell 1000 Value Index |
6.00
|
13.70
|
9.61
|
|
Russell 1000 Index |
6.12
|
15.66
|
12.65
|
|
| Performance Inception Date |
Feb. 26, 2021
|
| No Deduction of Taxes [Text Block] |
The performance of the above Fund does not reflect the deduction of taxes that a shareholder would pay on Fund distributions or the redemption of Fund shares.
|
| Material Change Date |
Jan. 01, 2025
|
| Net Assets |
$ 41,786,984
|
| Holdings Count | shares |
22
|
| Advisory Fees Paid, Amount |
$ 95,472
|
| Investment Company, Portfolio Turnover |
35.00%
|
| Additional Fund Statistics [Text Block] |
| Net Assets |
$41,786,984 |
| Number of Portfolio Holdings |
22 |
| Portfolio Turnover Rate |
35% |
| Total Advisory Fees Paid |
$95,472 |
|
| Holdings [Text Block] |
|
Financials
|
25.6% |
|
Industrials
|
15.4% |
|
Health Care
|
13.3% |
|
Consumer Discretionary
|
10.6% |
|
Consumer Staples
|
9.5% |
|
Information Technology
|
9.4% |
|
Energy
|
5.3% |
|
Registered Investment Companies
|
3.9% |
|
Real Estate
|
3.7% |
|
Materials
|
3.3% |
|
Liabilities in Excess of Other Assets
|
0.0% |
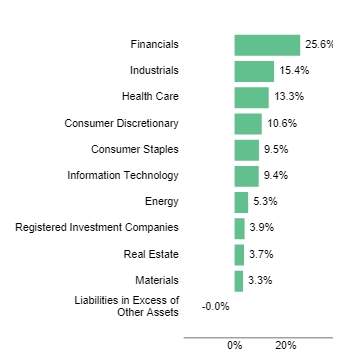
|
American International Group, Inc.
|
8.4 |
|
Texas Instruments, Inc.
|
6.4 |
|
Berkshire Hathaway, Inc., Class B
|
6.3 |
|
Capital One Financial Corp.
|
6.2 |
|
Abbott Laboratories
|
5.7 |
|
ConocoPhillips
|
5.3 |
|
Colgate-Palmolive Co.
|
4.9 |
|
Aon plc, Class A
|
4.7 |
|
Ferguson Enterprises, Inc.
|
4.7 |
|
Sysco Corp.
|
4.6 |
|
| Largest Holdings [Text Block] |
|
American International Group, Inc.
|
8.4 |
|
Texas Instruments, Inc.
|
6.4 |
|
Berkshire Hathaway, Inc., Class B
|
6.3 |
|
Capital One Financial Corp.
|
6.2 |
|
Abbott Laboratories
|
5.7 |
|
ConocoPhillips
|
5.3 |
|
Colgate-Palmolive Co.
|
4.9 |
|
Aon plc, Class A
|
4.7 |
|
Ferguson Enterprises, Inc.
|
4.7 |
|
Sysco Corp.
|
4.6 |
|
| Material Fund Change [Text Block] |
This is a summary of certain changes to the Fund since January 1, 2025. For more complete information, you may review the Fund's next prospectus, which we expect to be available by September 26, 2025 at https://diamond-hill.com/documents or upon request at 888-226-5595. The Board of Trustees after careful consideration and upon the recommendation of the Adviser, approved the conversion (the "Reorganization") of the Large Cap Concentrated Fund (the "Target Fund") into an exchange-traded fund ("ETF") by reorganizing the Target Fund into the newly created series of the Trust, the Diamond Hill Large Cap Concentrated ETF (the "Survivor Fund"). The Reorganization is expected to occur on or about September 26, 2025 (the "Closing Date"). The Survivor Fund will not commence operations before completion of the Reorganization and does not have existing shareholders. Shareholders are not required to approve the Reorganization, and shareholders will not be asked to vote. However, shareholders received a Combined Prospectus/Information Statement that contains information about the Survivor Fund and provides details about the terms and conditions of the Reorganization. |
| Material Fund Change Strategies [Text Block] |
The Board of Trustees after careful consideration and upon the recommendation of the Adviser, approved the conversion (the "Reorganization") of the Large Cap Concentrated Fund (the "Target Fund") into an exchange-traded fund ("ETF") by reorganizing the Target Fund into the newly created series of the Trust, the Diamond Hill Large Cap Concentrated ETF (the "Survivor Fund"). The Reorganization is expected to occur on or about September 26, 2025 (the "Closing Date"). The Survivor Fund will not commence operations before completion of the Reorganization and does not have existing shareholders. Shareholders are not required to approve the Reorganization, and shareholders will not be asked to vote. However, shareholders received a Combined Prospectus/Information Statement that contains information about the Survivor Fund and provides details about the terms and conditions of the Reorganization.
|
| Summary of Change Legend [Text Block] |
This is a summary of certain changes to the Fund since January 1, 2025. For more complete information, you may review the Fund's next prospectus, which we expect to be available by September 26, 2025 at https://diamond-hill.com/documents or upon request at 888-226-5595.
|
| Updated Prospectus Phone Number |
888-226-5595
|
| Updated Prospectus Web Address |
https://diamond-hill.com/documents
|
| Diamond Hill Select Fund | Investor Class |
|
| Shareholder Report [Line Items] |
|
| Fund Name |
Diamond Hill Select Fund
|
| Class Name |
Investor
|
| Trading Symbol |
DHTAX
|
| Annual or Semi-Annual Statement [Text Block] |
This semi-annual shareholder report contains important information about Diamond Hill Select Fund (the "Fund") for the period of January 1, 2025 to June 30, 2025.
|
| Shareholder Report Annual or Semi-Annual |
semi-annual shareholder report
|
| Additional Information [Text Block] |
You can find additional information about the Fund at https://diamond-hill.com/documents. You can also request this information by contacting us at 888-226-5595 or info@diamond-hill.com or by contacting your financial advisor.
|
| Additional Information Phone Number |
888-226-5595
|
| Additional Information Email |
info@diamond-hill.com
|
| Additional Information Website |
https://diamond-hill.com/documents
|
| Expenses [Text Block] |
|
| Expenses Paid, Amount |
$ 59
|
| Expense Ratio, Percent |
1.16%
|
| Factors Affecting Performance [Text Block] |
The Fund (Ticker: DHTAX) returned 3.54% for the 6-month period ended June 30, 2025. Over that same period, the Russell 3000 Index returned 5.75%. Security selection is the primary driver of the Fund's performance during any given period — the top and bottom contributors to return are illustrated in the chart. |
| Performance Past Does Not Indicate Future [Text] |
Past performance is not indicative of future results.
|
| Line Graph [Table Text Block] |
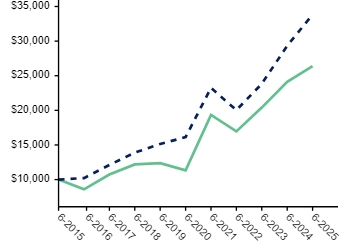
|
| Average Annual Return [Table Text Block] |
|
Investor |
3.54%
|
9.46%
|
18.40%
|
10.19%
|
|
Russell 3000 Index |
5.75
|
15.30
|
15.96
|
12.96
|
|
| No Deduction of Taxes [Text Block] |
The performance of the above Fund does not reflect the deduction of taxes that a shareholder would pay on Fund distributions or the redemption of Fund shares.
|
| Net Assets |
$ 570,391,044
|
| Holdings Count | shares |
28
|
| Advisory Fees Paid, Amount |
$ 1,934,946
|
| Investment Company, Portfolio Turnover |
27.00%
|
| Additional Fund Statistics [Text Block] |
| Net Assets |
$570,391,044 |
| Number of Portfolio Holdings |
28 |
| Portfolio Turnover Rate |
27% |
| Total Advisory Fees Paid |
$1,934,946 |
|
| Holdings [Text Block] |
|
Industrials
|
28.3% |
|
Financials
|
22.9% |
|
Consumer Discretionary
|
18.1% |
|
Information Technology
|
8.8% |
|
Materials
|
6.1% |
|
Health Care
|
5.7% |
|
Energy
|
5.4% |
|
Registered Investment Companies
|
3.9% |
|
Real Estate
|
2.1% |
|
Liabilities in Excess of Other Assets
|
-1.3% |
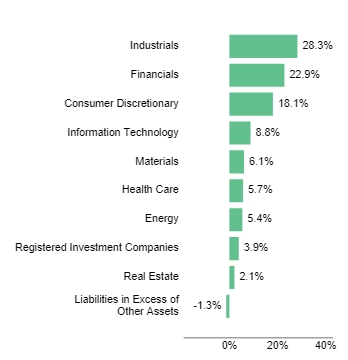
|
Mr. Cooper Group, Inc.
|
8.2 |
|
American International Group, Inc.
|
6.7 |
|
Regal Rexnord Corp.
|
6.5 |
|
Capital One Financial Corp.
|
5.4 |
|
Cimpress plc
|
5.4 |
|
CarMax, Inc.
|
5.2 |
|
Huntington Ingalls Industries, Inc.
|
5.2 |
|
Red Rock Resorts, Inc. Class A
|
5.0 |
|
Ashland, Inc.
|
4.1 |
|
Coherent Corp.
|
3.7 |
|
| Largest Holdings [Text Block] |
|
Mr. Cooper Group, Inc.
|
8.2 |
|
American International Group, Inc.
|
6.7 |
|
Regal Rexnord Corp.
|
6.5 |
|
Capital One Financial Corp.
|
5.4 |
|
Cimpress plc
|
5.4 |
|
CarMax, Inc.
|
5.2 |
|
Huntington Ingalls Industries, Inc.
|
5.2 |
|
Red Rock Resorts, Inc. Class A
|
5.0 |
|
Ashland, Inc.
|
4.1 |
|
Coherent Corp.
|
3.7 |
|
| Diamond Hill Select Fund | Class I |
|
| Shareholder Report [Line Items] |
|
| Fund Name |
Diamond Hill Select Fund
|
| Class Name |
Class I
|
| Trading Symbol |
DHLTX
|
| Annual or Semi-Annual Statement [Text Block] |
This semi-annual shareholder report contains important information about Diamond Hill Select Fund (the "Fund") for the period of January 1, 2025 to June 30, 2025.
|
| Shareholder Report Annual or Semi-Annual |
semi-annual shareholder report
|
| Additional Information [Text Block] |
You can find additional information about the Fund at https://diamond-hill.com/documents. You can also request this information by contacting us at 888-226-5595 or info@diamond-hill.com or by contacting your financial advisor.
|
| Additional Information Phone Number |
888-226-5595
|
| Additional Information Email |
info@diamond-hill.com
|
| Additional Information Website |
https://diamond-hill.com/documents
|
| Expenses [Text Block] |
|
| Expenses Paid, Amount |
$ 44
|
| Expense Ratio, Percent |
0.87%
|
| Factors Affecting Performance [Text Block] |
The Fund (Ticker: DHLTX) returned 3.65% for the 6-month period ended June 30, 2025. Over that same period, the Russell 3000 Index returned 5.75%. Security selection is the primary driver of the Fund's performance during any given period — the top and bottom contributors to return are illustrated in the chart. |
| Performance Past Does Not Indicate Future [Text] |
Past performance is not indicative of future results.
|
| Line Graph [Table Text Block] |

|
| Average Annual Return [Table Text Block] |
|
Class I |
3.65%
|
9.73%
|
18.75%
|
10.51%
|
|
Russell 3000 Index |
5.75
|
15.30
|
15.96
|
12.96
|
|
| No Deduction of Taxes [Text Block] |
The performance of the above Fund does not reflect the deduction of taxes that a shareholder would pay on Fund distributions or the redemption of Fund shares.
|
| Net Assets |
$ 570,391,044
|
| Holdings Count | shares |
28
|
| Advisory Fees Paid, Amount |
$ 1,934,946
|
| Investment Company, Portfolio Turnover |
27.00%
|
| Additional Fund Statistics [Text Block] |
| Net Assets |
$570,391,044 |
| Number of Portfolio Holdings |
28 |
| Portfolio Turnover Rate |
27% |
| Total Advisory Fees Paid |
$1,934,946 |
|
| Holdings [Text Block] |
|
Industrials
|
28.3% |
|
Financials
|
22.9% |
|
Consumer Discretionary
|
18.1% |
|
Information Technology
|
8.8% |
|
Materials
|
6.1% |
|
Health Care
|
5.7% |
|
Energy
|
5.4% |
|
Registered Investment Companies
|
3.9% |
|
Real Estate
|
2.1% |
|
Liabilities in Excess of Other Assets
|
-1.3% |

|
Mr. Cooper Group, Inc.
|
8.2 |
|
American International Group, Inc.
|
6.7 |
|
Regal Rexnord Corp.
|
6.5 |
|
Capital One Financial Corp.
|
5.4 |
|
Cimpress plc
|
5.4 |
|
CarMax, Inc.
|
5.2 |
|
Huntington Ingalls Industries, Inc.
|
5.2 |
|
Red Rock Resorts, Inc. Class A
|
5.0 |
|
Ashland, Inc.
|
4.1 |
|
Coherent Corp.
|
3.7 |
|
| Largest Holdings [Text Block] |
|
Mr. Cooper Group, Inc.
|
8.2 |
|
American International Group, Inc.
|
6.7 |
|
Regal Rexnord Corp.
|
6.5 |
|
Capital One Financial Corp.
|
5.4 |
|
Cimpress plc
|
5.4 |
|
CarMax, Inc.
|
5.2 |
|
Huntington Ingalls Industries, Inc.
|
5.2 |
|
Red Rock Resorts, Inc. Class A
|
5.0 |
|
Ashland, Inc.
|
4.1 |
|
Coherent Corp.
|
3.7 |
|
| Diamond Hill Select Fund | Class Y |
|
| Shareholder Report [Line Items] |
|
| Fund Name |
Diamond Hill Select Fund
|
| Class Name |
Class Y
|
| Trading Symbol |
DHTYX
|
| Annual or Semi-Annual Statement [Text Block] |
This semi-annual shareholder report contains important information about Diamond Hill Select Fund (the "Fund") for the period of January 1, 2025 to June 30, 2025.
|
| Shareholder Report Annual or Semi-Annual |
semi-annual shareholder report
|
| Additional Information [Text Block] |
You can find additional information about the Fund at https://diamond-hill.com/documents. You can also request this information by contacting us at 888-226-5595 or info@diamond-hill.com or by contacting your financial advisor.
|
| Additional Information Phone Number |
888-226-5595
|
| Additional Information Email |
info@diamond-hill.com
|
| Additional Information Website |
https://diamond-hill.com/documents
|
| Expenses [Text Block] |
|
| Expenses Paid, Amount |
$ 38
|
| Expense Ratio, Percent |
0.75%
|
| Factors Affecting Performance [Text Block] |
The Fund (Ticker: DHTYX) returned 3.76% for the 6-month period ended June 30, 2025. Over that same period, the Russell 3000 Index returned 5.75%. Security selection is the primary driver of the Fund's performance during any given period — the top and bottom contributors to return are illustrated in the chart. |
| Performance Past Does Not Indicate Future [Text] |
Past performance is not indicative of future results.
|
| Line Graph [Table Text Block] |
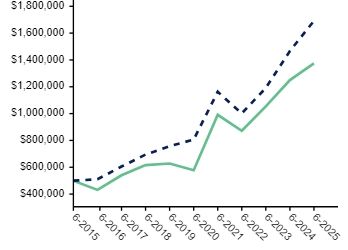
|
| Average Annual Return [Table Text Block] |
|
Class Y |
3.76%
|
9.93%
|
18.90%
|
10.64%
|
|
Russell 3000 Index |
5.75
|
15.30
|
15.96
|
12.96
|
|
| No Deduction of Taxes [Text Block] |
The performance of the above Fund does not reflect the deduction of taxes that a shareholder would pay on Fund distributions or the redemption of Fund shares.
|
| Net Assets |
$ 570,391,044
|
| Holdings Count | shares |
28
|
| Advisory Fees Paid, Amount |
$ 1,934,946
|
| Investment Company, Portfolio Turnover |
27.00%
|
| Additional Fund Statistics [Text Block] |
| Net Assets |
$570,391,044 |
| Number of Portfolio Holdings |
28 |
| Portfolio Turnover Rate |
27% |
| Total Advisory Fees Paid |
$1,934,946 |
|
| Holdings [Text Block] |
|
Industrials
|
28.3% |
|
Financials
|
22.9% |
|
Consumer Discretionary
|
18.1% |
|
Information Technology
|
8.8% |
|
Materials
|
6.1% |
|
Health Care
|
5.7% |
|
Energy
|
5.4% |
|
Registered Investment Companies
|
3.9% |
|
Real Estate
|
2.1% |
|
Liabilities in Excess of Other Assets
|
-1.3% |

|
Mr. Cooper Group, Inc.
|
8.2 |
|
American International Group, Inc.
|
6.7 |
|
Regal Rexnord Corp.
|
6.5 |
|
Capital One Financial Corp.
|
5.4 |
|
Cimpress plc
|
5.4 |
|
CarMax, Inc.
|
5.2 |
|
Huntington Ingalls Industries, Inc.
|
5.2 |
|
Red Rock Resorts, Inc. Class A
|
5.0 |
|
Ashland, Inc.
|
4.1 |
|
Coherent Corp.
|
3.7 |
|
| Largest Holdings [Text Block] |
|
Mr. Cooper Group, Inc.
|
8.2 |
|
American International Group, Inc.
|
6.7 |
|
Regal Rexnord Corp.
|
6.5 |
|
Capital One Financial Corp.
|
5.4 |
|
Cimpress plc
|
5.4 |
|
CarMax, Inc.
|
5.2 |
|
Huntington Ingalls Industries, Inc.
|
5.2 |
|
Red Rock Resorts, Inc. Class A
|
5.0 |
|
Ashland, Inc.
|
4.1 |
|
Coherent Corp.
|
3.7 |
|
| Diamond Hill Long-Short Fund | Investor Class |
|
| Shareholder Report [Line Items] |
|
| Fund Name |
Diamond Hill Long-Short Fund
|
| Class Name |
Investor
|
| Trading Symbol |
DIAMX
|
| Annual or Semi-Annual Statement [Text Block] |
This semi-annual shareholder report contains important information about Diamond Hill Long-Short Fund (the "Fund") for the period of January 1, 2025 to June 30, 2025.
|
| Shareholder Report Annual or Semi-Annual |
semi-annual shareholder report
|
| Additional Information [Text Block] |
You can find additional information about the Fund at https://diamond-hill.com/documents. You can also request this information by contacting us at 888-226-5595 or info@diamond-hill.com or by contacting your financial advisor.
|
| Additional Information Phone Number |
888-226-5595
|
| Additional Information Email |
info@diamond-hill.com
|
| Additional Information Website |
https://diamond-hill.com/documents
|
| Expenses [Text Block] |
|
| Expenses Paid, Amount |
$ 88
|
| Expense Ratio, Percent |
1.71%
|
| Factors Affecting Performance [Text Block] |
The Fund (Ticker: DIAMX) returned 8.66% for the 6-month period ended June 30, 2025. Over that same period, the Russell 1000 Index returned 6.12% and the 60%/40% Blended Index returned 4.64%. Security selection is the primary driver of the Fund's performance during any given period — the top and bottom contributors to return are illustrated in the chart. |
| Performance Past Does Not Indicate Future [Text] |
Past performance is not indicative of future results.
|
| Line Graph [Table Text Block] |
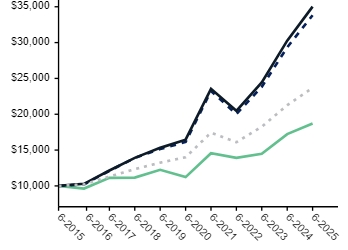
|
| Average Annual Return [Table Text Block] |
|
Investor |
8.66%
|
8.55%
|
10.75%
|
6.46%
|
|
Russell 3000 Index |
5.75
|
15.30
|
15.96
|
12.96
|
|
Russell 1000 Index |
6.12
|
15.66
|
16.30
|
13.35
|
|
60% Russell 1000/40% Bloomberg US T-Bill 1-3 Month Index |
4.64
|
11.38
|
11.08
|
8.99
|
|
| No Deduction of Taxes [Text Block] |
The performance of the above Fund does not reflect the deduction of taxes that a shareholder would pay on Fund distributions or the redemption of Fund shares.
|
| Net Assets |
$ 1,940,983,732
|
| Holdings Count | shares |
99
|
| Advisory Fees Paid, Amount |
$ 8,247,665
|
| Investment Company, Portfolio Turnover |
39.00%
|
| Additional Fund Statistics [Text Block] |
| Net Assets |
$1,940,983,732 |
| Number of Portfolio Holdings |
99 |
| Portfolio Turnover Rate |
39% |
| Total Advisory Fees Paid |
$8,247,665 |
|
Number of Long/(Short) Holdings in Portfolio
|
56/(43)
|
|
| Holdings [Text Block] |
|
Registered Investment Companies
|
28.8% |
|
Financials
|
21.7% |
|
Information Technology
|
15.8% |
|
Industrials
|
12.8% |
|
Health Care
|
12.5% |
|
Communication Services
|
10.7% |
|
Consumer Discretionary
|
6.9% |
|
Energy
|
4.2% |
|
Consumer Staples
|
3.0% |
|
Materials
|
1.7% |
|
Utilities
|
1.1% |
|
Real Estate
|
1.0% |

|
Segregated Cash with Custodian
|
35.5% |
|
Utilities
|
-0.7% |
|
Materials
|
-1.3% |
|
Real Estate
|
-1.4% |
|
Health Care
|
-2.3% |
|
Consumer Staples
|
-3.0% |
|
Financials
|
-4.1% |
|
Industrials
|
-5.0% |
|
Information Technology
|
-6.8% |
|
Consumer Discretionary
|
-10.5% |
|
Liabilities in Excess of Other Assets
|
-20.6% |

|
Long:
|
|
|
Microsoft Corp.
|
4.9 |
|
Meta Platforms, Inc., Class A
|
4.4 |
|
Citigroup, Inc.
|
4.3 |
|
American International Group, Inc.
|
3.9 |
|
Alphabet, Inc., Class A
|
3.8 |
|
Taiwan Semiconductor Manufacturing Co. Ltd. - ADR
|
3.5 |
|
WNS Holdings Ltd. - ADR
|
3.1 |
|
Parker-Hannifin Corp.
|
3.0 |
|
Salesforce, Inc.
|
2.2 |
|
Amazon.com, Inc.
|
2.2 |
|
Short:
|
|
|
International Business Machines Corp.
|
-2.4 |
|
Garmin Ltd.
|
-2.0 |
|
Royal Caribbean Cruises Ltd.
|
-1.6 |
|
Core & Main, Inc., Class A
|
-1.5 |
|
Sprouts Farmers Market, Inc.
|
-1.5 |
|
Alarm.com Holdings, Inc.
|
-1.4 |
|
Matson, Inc.
|
-1.3 |
|
Acushnet Holdings Corp.
|
-1.3 |
|
WD-40 Co.
|
-1.2 |
|
Federal Signal Corp.
|
-1.2 |
|
| Largest Holdings [Text Block] |
|
Long:
|
|
|
Microsoft Corp.
|
4.9 |
|
Meta Platforms, Inc., Class A
|
4.4 |
|
Citigroup, Inc.
|
4.3 |
|
American International Group, Inc.
|
3.9 |
|
Alphabet, Inc., Class A
|
3.8 |
|
Taiwan Semiconductor Manufacturing Co. Ltd. - ADR
|
3.5 |
|
WNS Holdings Ltd. - ADR
|
3.1 |
|
Parker-Hannifin Corp.
|
3.0 |
|
Salesforce, Inc.
|
2.2 |
|
Amazon.com, Inc.
|
2.2 |
|
Short:
|
|
|
International Business Machines Corp.
|
-2.4 |
|
Garmin Ltd.
|
-2.0 |
|
Royal Caribbean Cruises Ltd.
|
-1.6 |
|
Core & Main, Inc., Class A
|
-1.5 |
|
Sprouts Farmers Market, Inc.
|
-1.5 |
|
Alarm.com Holdings, Inc.
|
-1.4 |
|
Matson, Inc.
|
-1.3 |
|
Acushnet Holdings Corp.
|
-1.3 |
|
WD-40 Co.
|
-1.2 |
|
Federal Signal Corp.
|
-1.2 |
|
| Diamond Hill Long-Short Fund | Class I |
|
| Shareholder Report [Line Items] |
|
| Fund Name |
Diamond Hill Long-Short Fund
|
| Class Name |
Class I
|
| Trading Symbol |
DHLSX
|
| Annual or Semi-Annual Statement [Text Block] |
This semi-annual shareholder report contains important information about Diamond Hill Long-Short Fund (the "Fund") for the period of January 1, 2025 to June 30, 2025.
|
| Shareholder Report Annual or Semi-Annual |
semi-annual shareholder report
|
| Additional Information [Text Block] |
You can find additional information about the Fund at https://diamond-hill.com/documents. You can also request this information by contacting us at 888-226-5595 or info@diamond-hill.com or by contacting your financial advisor.
|
| Additional Information Phone Number |
888-226-5595
|
| Additional Information Email |
info@diamond-hill.com
|
| Additional Information Website |
https://diamond-hill.com/documents
|
| Expenses [Text Block] |
|
| Expenses Paid, Amount |
$ 74
|
| Expense Ratio, Percent |
1.42%
|
| Factors Affecting Performance [Text Block] |
The Fund (Ticker: DHLSX) returned 8.84% for the 6-month period ended June 30, 2025. Over that same period, the Russell 1000 Index returned 6.12% and the 60%/40% Blended Index returned 4.64%. Security selection is the primary driver of the Fund's performance during any given period — the top and bottom contributors to return are illustrated in the chart. |
| Performance Past Does Not Indicate Future [Text] |
Past performance is not indicative of future results.
|
| Line Graph [Table Text Block] |

|
| Average Annual Return [Table Text Block] |
|
Class I |
8.84%
|
8.89%
|
11.08%
|
6.78%
|
|
Russell 3000 Index |
5.75
|
15.30
|
15.96
|
12.96
|
|
Russell 1000 Index |
6.12
|
15.66
|
16.30
|
13.35
|
|
60% Russell 1000/40% Bloomberg US T-Bill 1-3 Month Index |
4.64
|
11.38
|
11.08
|
8.99
|
|
| No Deduction of Taxes [Text Block] |
The performance of the above Fund does not reflect the deduction of taxes that a shareholder would pay on Fund distributions or the redemption of Fund shares.
|
| Net Assets |
$ 1,940,983,732
|
| Holdings Count | shares |
99
|
| Advisory Fees Paid, Amount |
$ 8,247,665
|
| Investment Company, Portfolio Turnover |
39.00%
|
| Additional Fund Statistics [Text Block] |
| Net Assets |
$1,940,983,732 |
| Number of Portfolio Holdings |
99 |
| Portfolio Turnover Rate |
39% |
| Total Advisory Fees Paid |
$8,247,665 |
|
Number of Long/(Short) Holdings in Portfolio
|
56/(43)
|
|
| Holdings [Text Block] |
|
Registered Investment Companies
|
28.8% |
|
Financials
|
21.7% |
|
Information Technology
|
15.8% |
|
Industrials
|
12.8% |
|
Health Care
|
12.5% |
|
Communication Services
|
10.7% |
|
Consumer Discretionary
|
6.9% |
|
Energy
|
4.2% |
|
Consumer Staples
|
3.0% |
|
Materials
|
1.7% |
|
Utilities
|
1.1% |
|
Real Estate
|
1.0% |

|
Segregated Cash with Custodian
|
35.5% |
|
Utilities
|
-0.7% |
|
Materials
|
-1.3% |
|
Real Estate
|
-1.4% |
|
Health Care
|
-2.3% |
|
Consumer Staples
|
-3.0% |
|
Financials
|
-4.1% |
|
Industrials
|
-5.0% |
|
Information Technology
|
-6.8% |
|
Consumer Discretionary
|
-10.5% |
|
Liabilities in Excess of Other Assets
|
-20.6% |
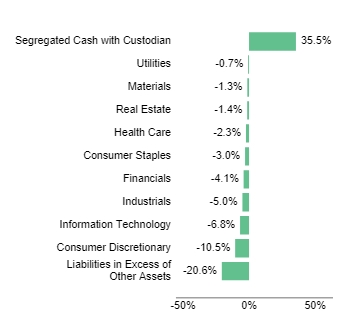
|
Long:
|
|
|
Microsoft Corp.
|
4.9 |
|
Meta Platforms, Inc., Class A
|
4.4 |
|
Citigroup, Inc.
|
4.3 |
|
American International Group, Inc.
|
3.9 |
|
Alphabet, Inc., Class A
|
3.8 |
|
Taiwan Semiconductor Manufacturing Co. Ltd. - ADR
|
3.5 |
|
WNS Holdings Ltd. - ADR
|
3.1 |
|
Parker-Hannifin Corp.
|
3.0 |
|
Salesforce, Inc.
|
2.2 |
|
Amazon.com, Inc.
|
2.2 |
|
Short:
|
|
|
International Business Machines Corp.
|
-2.4 |
|
Garmin Ltd.
|
-2.0 |
|
Royal Caribbean Cruises Ltd.
|
-1.6 |
|
Core & Main, Inc., Class A
|
-1.5 |
|
Sprouts Farmers Market, Inc.
|
-1.5 |
|
Alarm.com Holdings, Inc.
|
-1.4 |
|
Matson, Inc.
|
-1.3 |
|
Acushnet Holdings Corp.
|
-1.3 |
|
WD-40 Co.
|
-1.2 |
|
Federal Signal Corp.
|
-1.2 |
|
| Largest Holdings [Text Block] |
|
Long:
|
|
|
Microsoft Corp.
|
4.9 |
|
Meta Platforms, Inc., Class A
|
4.4 |
|
Citigroup, Inc.
|
4.3 |
|
American International Group, Inc.
|
3.9 |
|
Alphabet, Inc., Class A
|
3.8 |
|
Taiwan Semiconductor Manufacturing Co. Ltd. - ADR
|
3.5 |
|
WNS Holdings Ltd. - ADR
|
3.1 |
|
Parker-Hannifin Corp.
|
3.0 |
|
Salesforce, Inc.
|
2.2 |
|
Amazon.com, Inc.
|
2.2 |
|
Short:
|
|
|
International Business Machines Corp.
|
-2.4 |
|
Garmin Ltd.
|
-2.0 |
|
Royal Caribbean Cruises Ltd.
|
-1.6 |
|
Core & Main, Inc., Class A
|
-1.5 |
|
Sprouts Farmers Market, Inc.
|
-1.5 |
|
Alarm.com Holdings, Inc.
|
-1.4 |
|
Matson, Inc.
|
-1.3 |
|
Acushnet Holdings Corp.
|
-1.3 |
|
WD-40 Co.
|
-1.2 |
|
Federal Signal Corp.
|
-1.2 |
|
| Diamond Hill Long-Short Fund | Class Y |
|
| Shareholder Report [Line Items] |
|
| Fund Name |
Diamond Hill Long-Short Fund
|
| Class Name |
Class Y
|
| Trading Symbol |
DIAYX
|
| Annual or Semi-Annual Statement [Text Block] |
This semi-annual shareholder report contains important information about Diamond Hill Long-Short Fund (the "Fund") for the period of January 1, 2025 to June 30, 2025.
|
| Shareholder Report Annual or Semi-Annual |
semi-annual shareholder report
|
| Additional Information [Text Block] |
You can find additional information about the Fund at https://diamond-hill.com/documents. You can also request this information by contacting us at 888-226-5595 or info@diamond-hill.com or by contacting your financial advisor.
|
| Additional Information Phone Number |
888-226-5595
|
| Additional Information Email |
info@diamond-hill.com
|
| Additional Information Website |
https://diamond-hill.com/documents
|
| Expenses [Text Block] |
|
| Expenses Paid, Amount |
$ 67
|
| Expense Ratio, Percent |
1.30%
|
| Factors Affecting Performance [Text Block] |
The Fund (Ticker: DIAYX) returned 8.89% for the 6-month period ended June 30, 2025. Over that same period, the Russell 1000 Index returned 6.12% and the 60%/40% Blended Index returned 4.64%. Security selection is the primary driver of the Fund's performance during any given period — the top and bottom contributors to return are illustrated in the chart. |
| Performance Past Does Not Indicate Future [Text] |
Past performance is not indicative of future results.
|
| Line Graph [Table Text Block] |
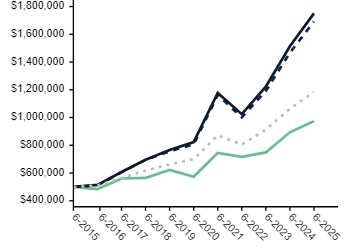
|
| Average Annual Return [Table Text Block] |
|
Class Y |
8.89%
|
9.02%
|
11.21%
|
6.90%
|
|
Russell 3000 Index |
5.75
|
15.30
|
15.96
|
12.96
|
|
Russell 1000 Index |
6.12
|
15.66
|
16.30
|
13.35
|
|
60% Russell 1000/40% Bloomberg US T-Bill 1-3 Month Index |
4.64
|
11.38
|
11.08
|
8.99
|
|
| No Deduction of Taxes [Text Block] |
The performance of the above Fund does not reflect the deduction of taxes that a shareholder would pay on Fund distributions or the redemption of Fund shares.
|
| Net Assets |
$ 1,940,983,732
|
| Holdings Count | shares |
99
|
| Advisory Fees Paid, Amount |
$ 8,247,665
|
| Investment Company, Portfolio Turnover |
39.00%
|
| Additional Fund Statistics [Text Block] |
| Net Assets |
$1,940,983,732 |
| Number of Portfolio Holdings |
99 |
| Portfolio Turnover Rate |
39% |
| Total Advisory Fees Paid |
$8,247,665 |
|
Number of Long/(Short) Holdings in Portfolio
|
56/(43)
|
|
| Holdings [Text Block] |
|
Registered Investment Companies
|
28.8% |
|
Financials
|
21.7% |
|
Information Technology
|
15.8% |
|
Industrials
|
12.8% |
|
Health Care
|
12.5% |
|
Communication Services
|
10.7% |
|
Consumer Discretionary
|
6.9% |
|
Energy
|
4.2% |
|
Consumer Staples
|
3.0% |
|
Materials
|
1.7% |
|
Utilities
|
1.1% |
|
Real Estate
|
1.0% |
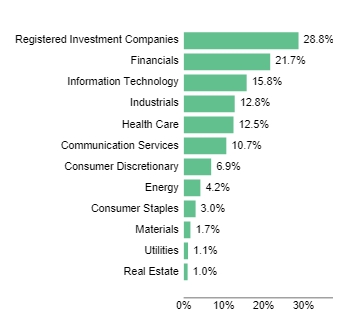
|
Segregated Cash with Custodian
|
35.5% |
|
Utilities
|
-0.7% |
|
Materials
|
-1.3% |
|
Real Estate
|
-1.4% |
|
Health Care
|
-2.3% |
|
Consumer Staples
|
-3.0% |
|
Financials
|
-4.1% |
|
Industrials
|
-5.0% |
|
Information Technology
|
-6.8% |
|
Consumer Discretionary
|
-10.5% |
|
Liabilities in Excess of Other Assets
|
-20.6% |

|
Long:
|
|
|
Microsoft Corp.
|
4.9 |
|
Meta Platforms, Inc., Class A
|
4.4 |
|
Citigroup, Inc.
|
4.3 |
|
American International Group, Inc.
|
3.9 |
|
Alphabet, Inc., Class A
|
3.8 |
|
Taiwan Semiconductor Manufacturing Co. Ltd. - ADR
|
3.5 |
|
WNS Holdings Ltd. - ADR
|
3.1 |
|
Parker-Hannifin Corp.
|
3.0 |
|
Salesforce, Inc.
|
2.2 |
|
Amazon.com, Inc.
|
2.2 |
|
Short:
|
|
|
International Business Machines Corp.
|
-2.4 |
|
Garmin Ltd.
|
-2.0 |
|
Royal Caribbean Cruises Ltd.
|
-1.6 |
|
Core & Main, Inc., Class A
|
-1.5 |
|
Sprouts Farmers Market, Inc.
|
-1.5 |
|
Alarm.com Holdings, Inc.
|
-1.4 |
|
Matson, Inc.
|
-1.3 |
|
Acushnet Holdings Corp.
|
-1.3 |
|
WD-40 Co.
|
-1.2 |
|
Federal Signal Corp.
|
-1.2 |
|
| Largest Holdings [Text Block] |
|
Long:
|
|
|
Microsoft Corp.
|
4.9 |
|
Meta Platforms, Inc., Class A
|
4.4 |
|
Citigroup, Inc.
|
4.3 |
|
American International Group, Inc.
|
3.9 |
|
Alphabet, Inc., Class A
|
3.8 |
|
Taiwan Semiconductor Manufacturing Co. Ltd. - ADR
|
3.5 |
|
WNS Holdings Ltd. - ADR
|
3.1 |
|
Parker-Hannifin Corp.
|
3.0 |
|
Salesforce, Inc.
|
2.2 |
|
Amazon.com, Inc.
|
2.2 |
|
Short:
|
|
|
International Business Machines Corp.
|
-2.4 |
|
Garmin Ltd.
|
-2.0 |
|
Royal Caribbean Cruises Ltd.
|
-1.6 |
|
Core & Main, Inc., Class A
|
-1.5 |
|
Sprouts Farmers Market, Inc.
|
-1.5 |
|
Alarm.com Holdings, Inc.
|
-1.4 |
|
Matson, Inc.
|
-1.3 |
|
Acushnet Holdings Corp.
|
-1.3 |
|
WD-40 Co.
|
-1.2 |
|
Federal Signal Corp.
|
-1.2 |
|
| Diamond Hill International Fund | Investor Class |
|
| Shareholder Report [Line Items] |
|
| Fund Name |
Diamond Hill International Fund
|
| Class Name |
Investor
|
| Trading Symbol |
DHIAX
|
| Annual or Semi-Annual Statement [Text Block] |
This semi-annual shareholder report contains important information about Diamond Hill International Fund (the "Fund") for the period of January 1, 2025 to June 30, 2025.
|
| Shareholder Report Annual or Semi-Annual |
semi-annual shareholder report
|
| Additional Information [Text Block] |
You can find additional information about the Fund at https://diamond-hill.com/documents. You can also request this information by contacting us at 888-226-5595 or info@diamond-hill.com or by contacting your financial advisor.
|
| Additional Information Phone Number |
888-226-5595
|
| Additional Information Email |
info@diamond-hill.com
|
| Additional Information Website |
https://diamond-hill.com/documents
|
| Expenses [Text Block] |
|
| Expenses Paid, Amount |
$ 62
|
| Expense Ratio, Percent |
1.15%
|
| Factors Affecting Performance [Text Block] |
The Fund (Ticker: DHIAX) returned 15.83% for the 6-month period ended June 30, 2025. Over that same period, the MSCI ACWI ex USA Index returned 17.90%. Security selection is the primary driver of the Fund's performance during any given period — the top and bottom contributors to return are illustrated in the chart. |
| Performance Past Does Not Indicate Future [Text] |
Past performance is not indicative of future results.
|
| Line Graph [Table Text Block] |
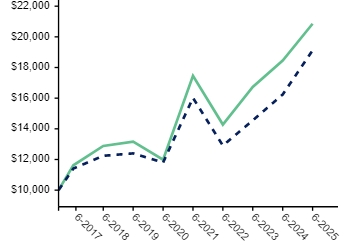
|
| Average Annual Return [Table Text Block] |
|
Investor |
15.83%
|
13.04%
|
11.71%
|
9.04%
|
|
MSCI ACWI ex USA Index |
17.90
|
17.72
|
10.13
|
7.92
|
|
| Performance Inception Date |
Dec. 30, 2016
|
| No Deduction of Taxes [Text Block] |
The performance of the above Fund does not reflect the deduction of taxes that a shareholder would pay on Fund distributions or the redemption of Fund shares.
|
| Net Assets |
$ 160,146,910
|
| Holdings Count | shares |
52
|
| Advisory Fees Paid, Amount |
$ 512,867
|
| Investment Company, Portfolio Turnover |
28.00%
|
| Additional Fund Statistics [Text Block] |
| Net Assets |
$160,146,910 |
| Number of Portfolio Holdings |
52 |
| Portfolio Turnover Rate |
28% |
| Total Advisory Fees Paid |
$512,867 |
|
| Holdings [Text Block] |
|
Industrials
|
23.6% |
|
Financials
|
18.5% |
|
Consumer Staples
|
17.0% |
|
Health Care
|
11.9% |
|
Consumer Discretionary
|
8.0% |
|
Information Technology
|
6.3% |
|
Energy
|
5.8% |
|
Registered Investment Companies
|
5.7% |
|
Communication Services
|
2.5% |
|
Materials
|
2.1% |
|
Utilities
|
2.0% |
|
Real Estate
|
1.1% |
|
Liabilities in Excess of Other Assets
|
-4.5% |

|
Taiwan Semiconductor Manufacturing Co. Ltd. - ADR
|
4.1 |
|
HDFC Bank Ltd. - ADR
|
3.8 |
|
Wal-Mart de Mexico SAB de CV
|
3.6 |
|
EXOR NV
|
3.4 |
|
Safran SA
|
3.4 |
|
Tesco plc
|
3.3 |
|
Howden Joinery Group plc
|
3.0 |
|
Krones AG
|
2.9 |
|
AIB Group plc
|
2.8 |
|
Compass Group plc
|
2.8 |
|
| Largest Holdings [Text Block] |
|
Taiwan Semiconductor Manufacturing Co. Ltd. - ADR
|
4.1 |
|
HDFC Bank Ltd. - ADR
|
3.8 |
|
Wal-Mart de Mexico SAB de CV
|
3.6 |
|
EXOR NV
|
3.4 |
|
Safran SA
|
3.4 |
|
Tesco plc
|
3.3 |
|
Howden Joinery Group plc
|
3.0 |
|
Krones AG
|
2.9 |
|
AIB Group plc
|
2.8 |
|
Compass Group plc
|
2.8 |
|
| Diamond Hill International Fund | Class I |
|
| Shareholder Report [Line Items] |
|
| Fund Name |
Diamond Hill International Fund
|
| Class Name |
Class I
|
| Trading Symbol |
DHIIX
|
| Annual or Semi-Annual Statement [Text Block] |
This semi-annual shareholder report contains important information about Diamond Hill International Fund (the "Fund") for the period of January 1, 2025 to June 30, 2025.
|
| Shareholder Report Annual or Semi-Annual |
semi-annual shareholder report
|
| Additional Information [Text Block] |
You can find additional information about the Fund at https://diamond-hill.com/documents. You can also request this information by contacting us at 888-226-5595 or info@diamond-hill.com or by contacting your financial advisor.
|
| Additional Information Phone Number |
888-226-5595
|
| Additional Information Email |
info@diamond-hill.com
|
| Additional Information Website |
https://diamond-hill.com/documents
|
| Expenses [Text Block] |
|
| Expenses Paid, Amount |
$ 46
|
| Expense Ratio, Percent |
0.86%
|
| Factors Affecting Performance [Text Block] |
The Fund (Ticker: DHIIX) returned 16.03% for the 6-month period ended June 30, 2025. Over that same period, the MSCI ACWI ex USA Index returned 17.90%. Security selection is the primary driver of the Fund's performance during any given period — the top and bottom contributors to return are illustrated in the chart. |
| Performance Past Does Not Indicate Future [Text] |
Past performance is not indicative of future results.
|
| Line Graph [Table Text Block] |
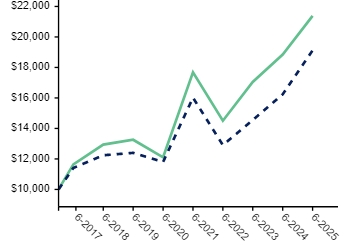
|
| Average Annual Return [Table Text Block] |
|
Class I |
16.03%
|
13.45%
|
12.05%
|
9.36%
|
|
MSCI ACWI ex USA Index |
17.90
|
17.72
|
10.13
|
7.92
|
|
| Performance Inception Date |
Dec. 30, 2016
|
| No Deduction of Taxes [Text Block] |
The performance of the above Fund does not reflect the deduction of taxes that a shareholder would pay on Fund distributions or the redemption of Fund shares.
|
| Net Assets |
$ 160,146,910
|
| Holdings Count | shares |
52
|
| Advisory Fees Paid, Amount |
$ 512,867
|
| Investment Company, Portfolio Turnover |
28.00%
|
| Additional Fund Statistics [Text Block] |
| Net Assets |
$160,146,910 |
| Number of Portfolio Holdings |
52 |
| Portfolio Turnover Rate |
28% |
| Total Advisory Fees Paid |
$512,867 |
|
| Holdings [Text Block] |
|
Industrials
|
23.6% |
|
Financials
|
18.5% |
|
Consumer Staples
|
17.0% |
|
Health Care
|
11.9% |
|
Consumer Discretionary
|
8.0% |
|
Information Technology
|
6.3% |
|
Energy
|
5.8% |
|
Registered Investment Companies
|
5.7% |
|
Communication Services
|
2.5% |
|
Materials
|
2.1% |
|
Utilities
|
2.0% |
|
Real Estate
|
1.1% |
|
Liabilities in Excess of Other Assets
|
-4.5% |
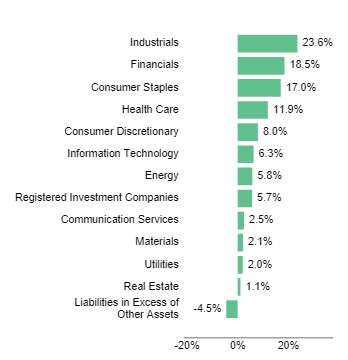
|
Taiwan Semiconductor Manufacturing Co. Ltd. - ADR
|
4.1 |
|
HDFC Bank Ltd. - ADR
|
3.8 |
|
Wal-Mart de Mexico SAB de CV
|
3.6 |
|
EXOR NV
|
3.4 |
|
Safran SA
|
3.4 |
|
Tesco plc
|
3.3 |
|
Howden Joinery Group plc
|
3.0 |
|
Krones AG
|
2.9 |
|
AIB Group plc
|
2.8 |
|
Compass Group plc
|
2.8 |
|
| Largest Holdings [Text Block] |
|
Taiwan Semiconductor Manufacturing Co. Ltd. - ADR
|
4.1 |
|
HDFC Bank Ltd. - ADR
|
3.8 |
|
Wal-Mart de Mexico SAB de CV
|
3.6 |
|
EXOR NV
|
3.4 |
|
Safran SA
|
3.4 |
|
Tesco plc
|
3.3 |
|
Howden Joinery Group plc
|
3.0 |
|
Krones AG
|
2.9 |
|
AIB Group plc
|
2.8 |
|
Compass Group plc
|
2.8 |
|
| Diamond Hill International Fund | Class Y |
|
| Shareholder Report [Line Items] |
|
| Fund Name |
Diamond Hill International Fund
|
| Class Name |
Class Y
|
| Trading Symbol |
DHIYX
|
| Annual or Semi-Annual Statement [Text Block] |
This semi-annual shareholder report contains important information about Diamond Hill International Fund (the "Fund") for the period of January 1, 2025 to June 30, 2025.
|
| Shareholder Report Annual or Semi-Annual |
semi-annual shareholder report
|
| Additional Information [Text Block] |
You can find additional information about the Fund at https://diamond-hill.com/documents. You can also request this information by contacting us at 888-226-5595 or info@diamond-hill.com or by contacting your financial advisor.
|
| Additional Information Phone Number |
888-226-5595
|
| Additional Information Email |
info@diamond-hill.com
|
| Additional Information Website |
https://diamond-hill.com/documents
|
| Expenses [Text Block] |
|
| Expenses Paid, Amount |
$ 40
|
| Expense Ratio, Percent |
0.74%
|
| Factors Affecting Performance [Text Block] |
The Fund (Ticker: DHIYX) returned 16.12% for the 6-month period ended June 30, 2025. Over that same period, the MSCI ACWI ex USA Index returned 17.90%. Security selection is the primary driver of the Fund's performance during any given period — the top and bottom contributors to return are illustrated in the chart. |
| Performance Past Does Not Indicate Future [Text] |
Past performance is not indicative of future results.
|
| Line Graph [Table Text Block] |
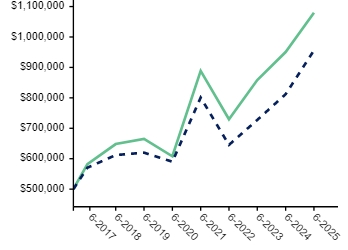
|
| Average Annual Return [Table Text Block] |
|
Class Y |
16.12%
|
13.60%
|
12.17%
|
9.48%
|
|
MSCI ACWI ex USA Index |
17.90
|
17.72
|
10.13
|
7.92
|
|
| Performance Inception Date |
Dec. 30, 2016
|
| No Deduction of Taxes [Text Block] |
The performance of the above Fund does not reflect the deduction of taxes that a shareholder would pay on Fund distributions or the redemption of Fund shares.
|
| Net Assets |
$ 160,146,910
|
| Holdings Count | shares |
52
|
| Advisory Fees Paid, Amount |
$ 512,867
|
| Investment Company, Portfolio Turnover |
28.00%
|
| Additional Fund Statistics [Text Block] |
| Net Assets |
$160,146,910 |
| Number of Portfolio Holdings |
52 |
| Portfolio Turnover Rate |
28% |
| Total Advisory Fees Paid |
$512,867 |
|
| Holdings [Text Block] |
|
Industrials
|
23.6% |
|
Financials
|
18.5% |
|
Consumer Staples
|
17.0% |
|
Health Care
|
11.9% |
|
Consumer Discretionary
|
8.0% |
|
Information Technology
|
6.3% |
|
Energy
|
5.8% |
|
Registered Investment Companies
|
5.7% |
|
Communication Services
|
2.5% |
|
Materials
|
2.1% |
|
Utilities
|
2.0% |
|
Real Estate
|
1.1% |
|
Liabilities in Excess of Other Assets
|
-4.5% |

|
Taiwan Semiconductor Manufacturing Co. Ltd. - ADR
|
4.1 |
|
HDFC Bank Ltd. - ADR
|
3.8 |
|
Wal-Mart de Mexico SAB de CV
|
3.6 |
|
EXOR NV
|
3.4 |
|
Safran SA
|
3.4 |
|
Tesco plc
|
3.3 |
|
Howden Joinery Group plc
|
3.0 |
|
Krones AG
|
2.9 |
|
AIB Group plc
|
2.8 |
|
Compass Group plc
|
2.8 |
|
| Largest Holdings [Text Block] |
|
Taiwan Semiconductor Manufacturing Co. Ltd. - ADR
|
4.1 |
|
HDFC Bank Ltd. - ADR
|
3.8 |
|
Wal-Mart de Mexico SAB de CV
|
3.6 |
|
EXOR NV
|
3.4 |
|
Safran SA
|
3.4 |
|
Tesco plc
|
3.3 |
|
Howden Joinery Group plc
|
3.0 |
|
Krones AG
|
2.9 |
|
AIB Group plc
|
2.8 |
|
Compass Group plc
|
2.8 |
|
| Diamond Hill Short Duration Securitized Bond Fund | Investor Class |
|
| Shareholder Report [Line Items] |
|
| Fund Name |
Diamond Hill Short Duration Securitized Bond Fund
|
| Class Name |
Investor
|
| Trading Symbol |
DHEAX
|
| Annual or Semi-Annual Statement [Text Block] |
This semi-annual shareholder report contains important information about Diamond Hill Short Duration Securitized Bond Fund (the "Fund") for the period of January 1, 2025 to June 30, 2025.
|
| Shareholder Report Annual or Semi-Annual |
semi-annual shareholder report
|
| Additional Information [Text Block] |
You can find additional information about the Fund at https://diamond-hill.com/documents. You can also request this information by contacting us at 888-226-5595 or info@diamond-hill.com or by contacting your financial advisor.
|
| Additional Information Phone Number |
888-226-5595
|
| Additional Information Email |
info@diamond-hill.com
|
| Additional Information Website |
https://diamond-hill.com/documents
|
| Expenses [Text Block] |
|
| Expenses Paid, Amount |
$ 41
|
| Expense Ratio, Percent |
0.81%
|
| Factors Affecting Performance [Text Block] |
The Fund (Ticker: DHEAX) returned 3.59% for the 6-month period ended June 30, 2025. Over that same period, the Bloomberg US 1-3 Year Government/Credit Index returned 2.92%. The Fund's performance was driven by strength in the asset-backed securities (ABS), non-agency commercial mortgage-backed securities (CMBS) and non-agency mortgage-backed securities (MBS) sectors. The Fund's underweight position to the Treasury market was a relative headwind. |
| Performance Past Does Not Indicate Future [Text] |
Past performance is not indicative of future results.
|
| Line Graph [Table Text Block] |
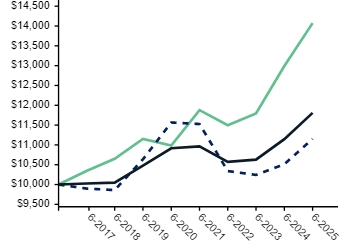
|
| Average Annual Return [Table Text Block] |
|
Investor |
3.59%
|
8.33%
|
5.08%
|
3.88%
|
|
Bloomberg US Aggregate Bond Index |
4.02
|
6.08
|
-0.73
|
1.22
|
|
Bloomberg US 1-3 Year Government/Credit Index |
2.92
|
5.94
|
1.58
|
1.87
|
|
| Performance Inception Date |
Jul. 05, 2016
|
| No Deduction of Taxes [Text Block] |
The performance of the above Fund does not reflect the deduction of taxes that a shareholder would pay on Fund distributions or the redemption of Fund shares.
|
| Net Assets |
$ 4,160,687,024
|
| Holdings Count | shares |
528
|
| Advisory Fees Paid, Amount |
$ 6,581,278
|
| Investment Company, Portfolio Turnover |
19.00%
|
| Additional Fund Statistics [Text Block] |
| Net Assets |
$4,160,687,024 |
| Number of Portfolio Holdings |
528 |
| Portfolio Turnover Rate |
19% |
| Total Advisory Fees Paid |
$6,581,278 |
|
Effective Duration
|
1.29
|
|
Weighted Average Life
|
2.10
|
|
Option-Adjusted Spread
|
263
|
|
| Holdings [Text Block] |
|
Securitized
|
86.6% |
|
Registered Investment Companies
|
6.8% |
|
Treasury
|
4.7% |
|
Corporate Credit
|
1.6% |
|
Other Assets in Excess of Liabilities
|
0.3% |

|
Firstkey Homes Trust, Series 2020-SFR2, Class A 1.266% 10/19/37
|
2.1 |
|
GNMA, Pool #DH9776 7.000% 03/20/65
|
1.3 |
|
Research-Driven Pagaya Motor Asset Trust I, Series 2025-1A, Class A 5.415% 06/27/33
|
1.3 |
|
U.S. Treasury Notes 2.250% 08/15/27
|
1.2 |
|
Firstkey Homes Trust, Series 2020-SFR1, Class A 1.339% 08/17/37
|
1.0 |
|
HTAP Trust, Series 2024-2, Class A 6.500% 04/25/42
|
1.0 |
|
Homeward Opportunities Funding Trust, Series 2024-RTL1, Class A1 7.120% 07/25/29
|
0.9 |
|
BX Commercial Mortgage Trust, Series 2025-VLT6, Class D 6.903% 03/15/30
|
0.8 |
|
LHOME Mortgage Trust, Series 2025-RTL1, Class A1 5.652% 01/25/40
|
0.8 |
|
Redwood Funding Trust, Series 2025-RR1, Class A1 6.767% 06/27/28
|
0.8 |
|
| Largest Holdings [Text Block] |
|
Firstkey Homes Trust, Series 2020-SFR2, Class A 1.266% 10/19/37
|
2.1 |
|
GNMA, Pool #DH9776 7.000% 03/20/65
|
1.3 |
|
Research-Driven Pagaya Motor Asset Trust I, Series 2025-1A, Class A 5.415% 06/27/33
|
1.3 |
|
U.S. Treasury Notes 2.250% 08/15/27
|
1.2 |
|
Firstkey Homes Trust, Series 2020-SFR1, Class A 1.339% 08/17/37
|
1.0 |
|
HTAP Trust, Series 2024-2, Class A 6.500% 04/25/42
|
1.0 |
|
Homeward Opportunities Funding Trust, Series 2024-RTL1, Class A1 7.120% 07/25/29
|
0.9 |
|
BX Commercial Mortgage Trust, Series 2025-VLT6, Class D 6.903% 03/15/30
|
0.8 |
|
LHOME Mortgage Trust, Series 2025-RTL1, Class A1 5.652% 01/25/40
|
0.8 |
|
Redwood Funding Trust, Series 2025-RR1, Class A1 6.767% 06/27/28
|
0.8 |
|
| Diamond Hill Short Duration Securitized Bond Fund | Class I |
|
| Shareholder Report [Line Items] |
|
| Fund Name |
Diamond Hill Short Duration Securitized Bond Fund
|
| Class Name |
Class I
|
| Trading Symbol |
DHEIX
|
| Annual or Semi-Annual Statement [Text Block] |
This semi-annual shareholder report contains important information about Diamond Hill Short Duration Securitized Bond Fund (the "Fund") for the period of January 1, 2025 to June 30, 2025.
|
| Shareholder Report Annual or Semi-Annual |
semi-annual shareholder report
|
| Additional Information [Text Block] |
You can find additional information about the Fund at https://diamond-hill.com/documents. You can also request this information by contacting us at 888-226-5595 or info@diamond-hill.com or by contacting your financial advisor.
|
| Additional Information Phone Number |
888-226-5595
|
| Additional Information Email |
info@diamond-hill.com
|
| Additional Information Website |
https://diamond-hill.com/documents
|
| Expenses [Text Block] |
|
| Expenses Paid, Amount |
$ 26
|
| Expense Ratio, Percent |
0.52%
|
| Factors Affecting Performance [Text Block] |
The Fund (Ticker: DHEIX) returned 3.83% for the 6-month period ended June 30, 2025. Over that same period, the Bloomberg US 1-3 Year Government/Credit Index returned 2.92%. The Fund's performance was driven by strength in the asset-backed securities (ABS), non-agency commercial mortgage-backed securities (CMBS) and non-agency mortgage-backed securities (MBS) sectors. The Fund's underweight position to the Treasury market was a relative headwind. |
| Performance Past Does Not Indicate Future [Text] |
Past performance is not indicative of future results.
|
| Line Graph [Table Text Block] |
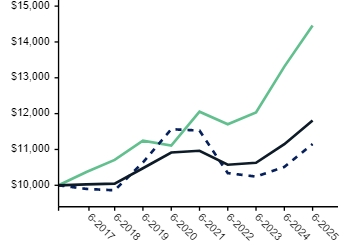
|
| Average Annual Return [Table Text Block] |
|
Class I |
3.83%
|
8.61%
|
5.41%
|
4.19%
|
|
Bloomberg US Aggregate Bond Index |
4.02
|
6.08
|
-0.73
|
1.22
|
|
Bloomberg US 1-3 Year Government/Credit Index |
2.92
|
5.94
|
1.58
|
1.87
|
|
| Performance Inception Date |
Jul. 05, 2016
|
| No Deduction of Taxes [Text Block] |
The performance of the above Fund does not reflect the deduction of taxes that a shareholder would pay on Fund distributions or the redemption of Fund shares.
|
| Net Assets |
$ 4,160,687,024
|
| Holdings Count | shares |
528
|
| Advisory Fees Paid, Amount |
$ 6,581,278
|
| Investment Company, Portfolio Turnover |
19.00%
|
| Additional Fund Statistics [Text Block] |
| Net Assets |
$4,160,687,024 |
| Number of Portfolio Holdings |
528 |
| Portfolio Turnover Rate |
19% |
| Total Advisory Fees Paid |
$6,581,278 |
|
Effective Duration
|
1.29
|
|
Weighted Average Life
|
2.10
|
|
Option-Adjusted Spread
|
263
|
|
| Holdings [Text Block] |
|
Securitized
|
86.6% |
|
Registered Investment Companies
|
6.8% |
|
Treasury
|
4.7% |
|
Corporate Credit
|
1.6% |
|
Other Assets in Excess of Liabilities
|
0.3% |

|
Firstkey Homes Trust, Series 2020-SFR2, Class A 1.266% 10/19/37
|
2.1 |
|
GNMA, Pool #DH9776 7.000% 03/20/65
|
1.3 |
|
Research-Driven Pagaya Motor Asset Trust I, Series 2025-1A, Class A 5.415% 06/27/33
|
1.3 |
|
U.S. Treasury Notes 2.250% 08/15/27
|
1.2 |
|
Firstkey Homes Trust, Series 2020-SFR1, Class A 1.339% 08/17/37
|
1.0 |
|
HTAP Trust, Series 2024-2, Class A 6.500% 04/25/42
|
1.0 |
|
Homeward Opportunities Funding Trust, Series 2024-RTL1, Class A1 7.120% 07/25/29
|
0.9 |
|
BX Commercial Mortgage Trust, Series 2025-VLT6, Class D 6.903% 03/15/30
|
0.8 |
|
LHOME Mortgage Trust, Series 2025-RTL1, Class A1 5.652% 01/25/40
|
0.8 |
|
Redwood Funding Trust, Series 2025-RR1, Class A1 6.767% 06/27/28
|
0.8 |
|
| Largest Holdings [Text Block] |
|
Firstkey Homes Trust, Series 2020-SFR2, Class A 1.266% 10/19/37
|
2.1 |
|
GNMA, Pool #DH9776 7.000% 03/20/65
|
1.3 |
|
Research-Driven Pagaya Motor Asset Trust I, Series 2025-1A, Class A 5.415% 06/27/33
|
1.3 |
|
U.S. Treasury Notes 2.250% 08/15/27
|
1.2 |
|
Firstkey Homes Trust, Series 2020-SFR1, Class A 1.339% 08/17/37
|
1.0 |
|
HTAP Trust, Series 2024-2, Class A 6.500% 04/25/42
|
1.0 |
|
Homeward Opportunities Funding Trust, Series 2024-RTL1, Class A1 7.120% 07/25/29
|
0.9 |
|
BX Commercial Mortgage Trust, Series 2025-VLT6, Class D 6.903% 03/15/30
|
0.8 |
|
LHOME Mortgage Trust, Series 2025-RTL1, Class A1 5.652% 01/25/40
|
0.8 |
|
Redwood Funding Trust, Series 2025-RR1, Class A1 6.767% 06/27/28
|
0.8 |
|
| Diamond Hill Short Duration Securitized Bond Fund | Class Y |
|
| Shareholder Report [Line Items] |
|
| Fund Name |
Diamond Hill Short Duration Securitized Bond Fund
|
| Class Name |
Class Y
|
| Trading Symbol |
DHEYX
|
| Annual or Semi-Annual Statement [Text Block] |
This semi-annual shareholder report contains important information about Diamond Hill Short Duration Securitized Bond Fund (the "Fund") for the period of January 1, 2025 to June 30, 2025.
|
| Shareholder Report Annual or Semi-Annual |
semi-annual shareholder report
|
| Additional Information [Text Block] |
You can find additional information about the Fund at https://diamond-hill.com/documents. You can also request this information by contacting us at 888-226-5595 or info@diamond-hill.com or by contacting your financial advisor.
|
| Additional Information Phone Number |
888-226-5595
|
| Additional Information Email |
info@diamond-hill.com
|
| Additional Information Website |
https://diamond-hill.com/documents
|
| Expenses [Text Block] |
|
| Expenses Paid, Amount |
$ 20
|
| Expense Ratio, Percent |
0.40%
|
| Factors Affecting Performance [Text Block] |
The Fund (Ticker: DHEYX) returned 3.79% for the 6-month period ended June 30, 2025. Over that same period, the Bloomberg US 1-3 Year Government/Credit Index returned 2.92%. The Fund's performance was driven by strength in the asset-backed securities (ABS), non-agency commercial mortgage-backed securities (CMBS) and non-agency mortgage-backed securities (MBS) sectors. The Fund's underweight position to the Treasury market was a relative headwind. |
| Performance Past Does Not Indicate Future [Text] |
Past performance is not indicative of future results.
|
| Line Graph [Table Text Block] |
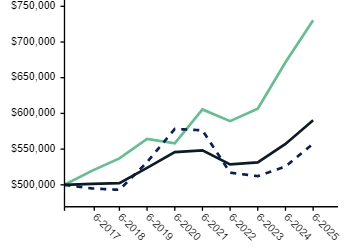
|
| Average Annual Return [Table Text Block] |
|
Class Y |
3.79%
|
8.74%
|
5.52%
|
4.31%
|
|
Bloomberg US Aggregate Bond Index |
4.02
|
6.08
|
-0.73
|
1.22
|
|
Bloomberg US 1-3 Year Government/Credit Index |
2.92
|
5.94
|
1.58
|
1.87
|
|
| Performance Inception Date |
Jul. 05, 2016
|
| No Deduction of Taxes [Text Block] |
The performance of the above Fund does not reflect the deduction of taxes that a shareholder would pay on Fund distributions or the redemption of Fund shares.
|
| Net Assets |
$ 4,160,687,024
|
| Holdings Count | shares |
528
|
| Advisory Fees Paid, Amount |
$ 6,581,278
|
| Investment Company, Portfolio Turnover |
19.00%
|
| Additional Fund Statistics [Text Block] |
| Net Assets |
$4,160,687,024 |
| Number of Portfolio Holdings |
528 |
| Portfolio Turnover Rate |
19% |
| Total Advisory Fees Paid |
$6,581,278 |
|
Effective Duration
|
1.29
|
|
Weighted Average Life
|
2.10
|
|
Option-Adjusted Spread
|
263
|
|
| Holdings [Text Block] |
|
Securitized
|
86.6% |
|
Registered Investment Companies
|
6.8% |
|
Treasury
|
4.7% |
|
Corporate Credit
|
1.6% |
|
Other Assets in Excess of Liabilities
|
0.3% |
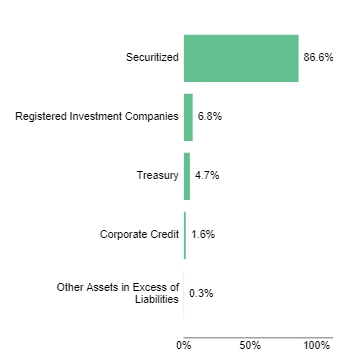
|
Firstkey Homes Trust, Series 2020-SFR2, Class A 1.266% 10/19/37
|
2.1 |
|
GNMA, Pool #DH9776 7.000% 03/20/65
|
1.3 |
|
Research-Driven Pagaya Motor Asset Trust I, Series 2025-1A, Class A 5.415% 06/27/33
|
1.3 |
|
U.S. Treasury Notes 2.250% 08/15/27
|
1.2 |
|
Firstkey Homes Trust, Series 2020-SFR1, Class A 1.339% 08/17/37
|
1.0 |
|
HTAP Trust, Series 2024-2, Class A 6.500% 04/25/42
|
1.0 |
|
Homeward Opportunities Funding Trust, Series 2024-RTL1, Class A1 7.120% 07/25/29
|
0.9 |
|
BX Commercial Mortgage Trust, Series 2025-VLT6, Class D 6.903% 03/15/30
|
0.8 |
|
LHOME Mortgage Trust, Series 2025-RTL1, Class A1 5.652% 01/25/40
|
0.8 |
|
Redwood Funding Trust, Series 2025-RR1, Class A1 6.767% 06/27/28
|
0.8 |
|
| Largest Holdings [Text Block] |
|
Firstkey Homes Trust, Series 2020-SFR2, Class A 1.266% 10/19/37
|
2.1 |
|
GNMA, Pool #DH9776 7.000% 03/20/65
|
1.3 |
|
Research-Driven Pagaya Motor Asset Trust I, Series 2025-1A, Class A 5.415% 06/27/33
|
1.3 |
|
U.S. Treasury Notes 2.250% 08/15/27
|
1.2 |
|
Firstkey Homes Trust, Series 2020-SFR1, Class A 1.339% 08/17/37
|
1.0 |
|
HTAP Trust, Series 2024-2, Class A 6.500% 04/25/42
|
1.0 |
|
Homeward Opportunities Funding Trust, Series 2024-RTL1, Class A1 7.120% 07/25/29
|
0.9 |
|
BX Commercial Mortgage Trust, Series 2025-VLT6, Class D 6.903% 03/15/30
|
0.8 |
|
LHOME Mortgage Trust, Series 2025-RTL1, Class A1 5.652% 01/25/40
|
0.8 |
|
Redwood Funding Trust, Series 2025-RR1, Class A1 6.767% 06/27/28
|
0.8 |
|
| Diamond Hill Core Bond Fund | Investor Class |
|
| Shareholder Report [Line Items] |
|
| Fund Name |
Diamond Hill Core Bond Fund
|
| Class Name |
Investor
|
| Trading Symbol |
DHRAX
|
| Annual or Semi-Annual Statement [Text Block] |
This semi-annual shareholder report contains important information about Diamond Hill Core Bond Fund (the "Fund") for the period of January 1, 2025 to June 30, 2025.
|
| Shareholder Report Annual or Semi-Annual |
semi-annual shareholder report
|
| Additional Information [Text Block] |
You can find additional information about the Fund at https://diamond-hill.com/documents. You can also request this information by contacting us at 888-226-5595 or info@diamond-hill.com or by contacting your financial advisor.
|
| Additional Information Phone Number |
888-226-5595
|
| Additional Information Email |
info@diamond-hill.com
|
| Additional Information Website |
https://diamond-hill.com/documents
|
| Expenses [Text Block] |
|
| Expenses Paid, Amount |
$ 38
|
| Expense Ratio, Percent |
0.76%
|
| Factors Affecting Performance [Text Block] |
The Fund (Ticker: DHRAX) returned 4.05% for the 6-month period ended June 30, 2025. Over that same period, the Bloomberg US Aggregate Bond Index returned 4.02%. The Fund's performance was driven by strength in the agency mortgage-back securities (MBS) and corporate credit sectors. The Fund's Treasury holdings were also nicely positive on an absolute basis, but the underweight position to the Treasury market was a relative headwind. |
| Performance Past Does Not Indicate Future [Text] |
Past performance is not indicative of future results.
|
| Line Graph [Table Text Block] |
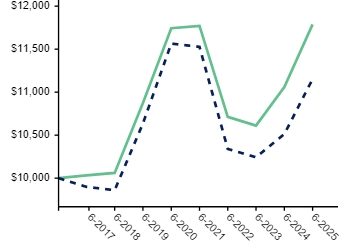
|
| Average Annual Return [Table Text Block] |
|
Investor |
4.05%
|
6.58%
|
0.08%
|
1.85%
|
|
Bloomberg US Aggregate Bond Index |
4.02
|
6.08
|
-0.73
|
1.22
|
|
| Performance Inception Date |
Jul. 05, 2016
|
| No Deduction of Taxes [Text Block] |
The performance of the above Fund does not reflect the deduction of taxes that a shareholder would pay on Fund distributions or the redemption of Fund shares.
|
| Net Assets |
$ 2,457,343,198
|
| Holdings Count | shares |
1,077
|
| Advisory Fees Paid, Amount |
$ 3,362,637
|
| Investment Company, Portfolio Turnover |
8.00%
|
| Additional Fund Statistics [Text Block] |
| Net Assets |
$2,457,343,198 |
| Number of Portfolio Holdings |
1,077 |
| Portfolio Turnover Rate |
8% |
| Total Advisory Fees Paid |
$3,362,637 |
|
Effective Duration
|
5.73
|
|
Weighted Average Life
|
7.43
|
|
Option-Adjusted Spread
|
133
|
|
| Holdings [Text Block] |
|
Securitized
|
62.0% |
|
Treasury
|
19.8% |
|
Corporate Credit
|
15.5% |
|
Registered Investment Companies
|
3.8% |
|
Government Related
|
0.0% |
|
Liabilities in Excess of Other Assets
|
-1.1% |
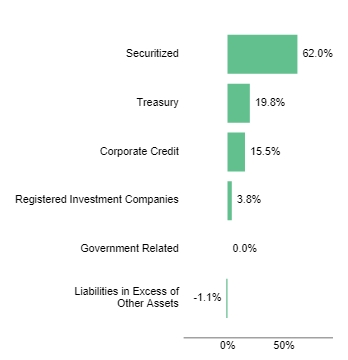
|
U.S. Treasury Bonds 3.000% 02/15/48
|
3.5 |
|
U.S. Treasury Notes 4.000% 02/15/34
|
2.4 |
|
U.S. Treasury Bonds 2.250% 08/15/46
|
1.6 |
|
U.S. Treasury Notes 0.625% 08/15/30
|
1.2 |
|
GNMA, Pool #DJ1126 7.000% 04/20/2065
|
1.2 |
|
U.S. Treasury Bonds 1.625% 11/15/50
|
1.2 |
|
U.S. Treasury Bonds 1.375% 11/15/40
|
1.2 |
|
U.S. Treasury Bonds 1.125% 08/15/40
|
1.1 |
|
FNMA, Pool #FS9979 6.000% 09/01/54
|
1.1 |
|
U.S. Treasury STRIPS 0.625% 2/15/43
|
1.0 |
|
| Largest Holdings [Text Block] |
|
U.S. Treasury Bonds 3.000% 02/15/48
|
3.5 |
|
U.S. Treasury Notes 4.000% 02/15/34
|
2.4 |
|
U.S. Treasury Bonds 2.250% 08/15/46
|
1.6 |
|
U.S. Treasury Notes 0.625% 08/15/30
|
1.2 |
|
GNMA, Pool #DJ1126 7.000% 04/20/2065
|
1.2 |
|
U.S. Treasury Bonds 1.625% 11/15/50
|
1.2 |
|
U.S. Treasury Bonds 1.375% 11/15/40
|
1.2 |
|
U.S. Treasury Bonds 1.125% 08/15/40
|
1.1 |
|
FNMA, Pool #FS9979 6.000% 09/01/54
|
1.1 |
|
U.S. Treasury STRIPS 0.625% 2/15/43
|
1.0 |
|
| Diamond Hill Core Bond Fund | Class I |
|
| Shareholder Report [Line Items] |
|
| Fund Name |
Diamond Hill Core Bond Fund
|
| Class Name |
Class I
|
| Trading Symbol |
DHRIX
|
| Annual or Semi-Annual Statement [Text Block] |
This semi-annual shareholder report contains important information about Diamond Hill Core Bond Fund (the "Fund") for the period of January 1, 2025 to June 30, 2025.
|
| Shareholder Report Annual or Semi-Annual |
semi-annual shareholder report
|
| Additional Information [Text Block] |
You can find additional information about the Fund at https://diamond-hill.com/documents. You can also request this information by contacting us at 888-226-5595 or info@diamond-hill.com or by contacting your financial advisor.
|
| Additional Information Phone Number |
888-226-5595
|
| Additional Information Email |
info@diamond-hill.com
|
| Additional Information Website |
https://diamond-hill.com/documents
|
| Expenses [Text Block] |
|
| Expenses Paid, Amount |
$ 24
|
| Expense Ratio, Percent |
0.47%
|
| Factors Affecting Performance [Text Block] |
The Fund (Ticker: DHRIX) returned 4.16% for the 6-month period ended June 30, 2025. Over that same period, the Bloomberg US Aggregate Bond Index returned 4.02%. The Fund's performance was driven by strength in the agency mortgage-back securities (MBS) and corporate credit sectors. The Fund's Treasury holdings were also nicely positive on an absolute basis, but the underweight position to the Treasury market was a relative headwind. |
| Performance Past Does Not Indicate Future [Text] |
Past performance is not indicative of future results.
|
| Line Graph [Table Text Block] |
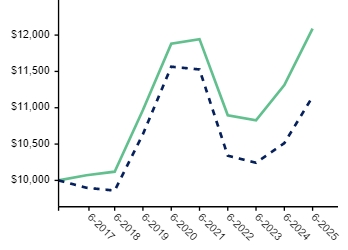
|
| Average Annual Return [Table Text Block] |
|
Class I |
4.16%
|
6.88%
|
0.35%
|
2.13%
|
|
Bloomberg US Aggregate Bond Index |
4.02
|
6.08
|
-0.73
|
1.22
|
|
| Performance Inception Date |
Jul. 05, 2016
|
| No Deduction of Taxes [Text Block] |
The performance of the above Fund does not reflect the deduction of taxes that a shareholder would pay on Fund distributions or the redemption of Fund shares.
|
| Net Assets |
$ 2,457,343,198
|
| Holdings Count | shares |
1,077
|
| Advisory Fees Paid, Amount |
$ 3,362,637
|
| Investment Company, Portfolio Turnover |
8.00%
|
| Additional Fund Statistics [Text Block] |
| Net Assets |
$2,457,343,198 |
| Number of Portfolio Holdings |
1,077 |
| Portfolio Turnover Rate |
8% |
| Total Advisory Fees Paid |
$3,362,637 |
|
Effective Duration
|
5.73
|
|
Weighted Average Life
|
7.43
|
|
Option-Adjusted Spread
|
133
|
|
| Holdings [Text Block] |
|
Securitized
|
62.0% |
|
Treasury
|
19.8% |
|
Corporate Credit
|
15.5% |
|
Registered Investment Companies
|
3.8% |
|
Government Related
|
0.0% |
|
Liabilities in Excess of Other Assets
|
-1.1% |

|
U.S. Treasury Bonds 3.000% 02/15/48
|
3.5 |
|
U.S. Treasury Notes 4.000% 02/15/34
|
2.4 |
|
U.S. Treasury Bonds 2.250% 08/15/46
|
1.6 |
|
U.S. Treasury Notes 0.625% 08/15/30
|
1.2 |
|
GNMA, Pool #DJ1126 7.000% 04/20/2065
|
1.2 |
|
U.S. Treasury Bonds 1.625% 11/15/50
|
1.2 |
|
U.S. Treasury Bonds 1.375% 11/15/40
|
1.2 |
|
U.S. Treasury Bonds 1.125% 08/15/40
|
1.1 |
|
FNMA, Pool #FS9979 6.000% 09/01/54
|
1.1 |
|
U.S. Treasury STRIPS 0.625% 2/15/43
|
1.0 |
|
| Largest Holdings [Text Block] |
|
U.S. Treasury Bonds 3.000% 02/15/48
|
3.5 |
|
U.S. Treasury Notes 4.000% 02/15/34
|
2.4 |
|
U.S. Treasury Bonds 2.250% 08/15/46
|
1.6 |
|
U.S. Treasury Notes 0.625% 08/15/30
|
1.2 |
|
GNMA, Pool #DJ1126 7.000% 04/20/2065
|
1.2 |
|
U.S. Treasury Bonds 1.625% 11/15/50
|
1.2 |
|
U.S. Treasury Bonds 1.375% 11/15/40
|
1.2 |
|
U.S. Treasury Bonds 1.125% 08/15/40
|
1.1 |
|
FNMA, Pool #FS9979 6.000% 09/01/54
|
1.1 |
|
U.S. Treasury STRIPS 0.625% 2/15/43
|
1.0 |
|
| Diamond Hill Core Bond Fund | Class Y |
|
| Shareholder Report [Line Items] |
|
| Fund Name |
Diamond Hill Core Bond Fund
|
| Class Name |
Class Y
|
| Trading Symbol |
DHRYX
|
| Annual or Semi-Annual Statement [Text Block] |
This semi-annual shareholder report contains important information about Diamond Hill Core Bond Fund (the "Fund") for the period of January 1, 2025 to June 30, 2025.
|
| Shareholder Report Annual or Semi-Annual |
semi-annual shareholder report
|
| Additional Information [Text Block] |
You can find additional information about the Fund at https://diamond-hill.com/documents. You can also request this information by contacting us at 888-226-5595 or info@diamond-hill.com or by contacting your financial advisor.
|
| Additional Information Phone Number |
888-226-5595
|
| Additional Information Email |
info@diamond-hill.com
|
| Additional Information Website |
https://diamond-hill.com/documents
|
| Expenses [Text Block] |
|
| Expenses Paid, Amount |
$ 18
|
| Expense Ratio, Percent |
0.35%
|
| Factors Affecting Performance [Text Block] |
The Fund (Ticker: DHRYX) returned 4.32% for the 6-month period ended June 30, 2025. Over that same period, the Bloomberg US Aggregate Bond Index returned 4.02%. The Fund's performance was driven by strength in the agency mortgage-back securities (MBS) and corporate credit sectors. The Fund's Treasury holdings were also nicely positive on an absolute basis, but the underweight position to the Treasury market was a relative headwind. |
| Performance Past Does Not Indicate Future [Text] |
Past performance is not indicative of future results.
|
| Line Graph [Table Text Block] |
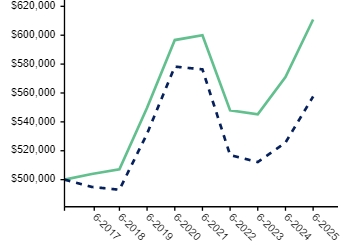
|
| Average Annual Return [Table Text Block] |
|
Class Y |
4.32%
|
6.99%
|
0.47%
|
2.25%
|
|
Bloomberg US Aggregate Bond Index |
4.02
|
6.08
|
-0.73
|
1.22
|
|
| Performance Inception Date |
Jul. 05, 2016
|
| No Deduction of Taxes [Text Block] |
The performance of the above Fund does not reflect the deduction of taxes that a shareholder would pay on Fund distributions or the redemption of Fund shares.
|
| Net Assets |
$ 2,457,343,198
|
| Holdings Count | shares |
1,077
|
| Advisory Fees Paid, Amount |
$ 3,362,637
|
| Investment Company, Portfolio Turnover |
8.00%
|
| Additional Fund Statistics [Text Block] |
| Net Assets |
$2,457,343,198 |
| Number of Portfolio Holdings |
1,077 |
| Portfolio Turnover Rate |
8% |
| Total Advisory Fees Paid |
$3,362,637 |
|
Effective Duration
|
5.73
|
|
Weighted Average Life
|
7.43
|
|
Option-Adjusted Spread
|
133
|
|
| Holdings [Text Block] |
|
Securitized
|
62.0% |
|
Treasury
|
19.8% |
|
Corporate Credit
|
15.5% |
|
Registered Investment Companies
|
3.8% |
|
Government Related
|
0.0% |
|
Liabilities in Excess of Other Assets
|
-1.1% |

|
U.S. Treasury Bonds 3.000% 02/15/48
|
3.5 |
|
U.S. Treasury Notes 4.000% 02/15/34
|
2.4 |
|
U.S. Treasury Bonds 2.250% 08/15/46
|
1.6 |
|
U.S. Treasury Notes 0.625% 08/15/30
|
1.2 |
|
GNMA, Pool #DJ1126 7.000% 04/20/2065
|
1.2 |
|
U.S. Treasury Bonds 1.625% 11/15/50
|
1.2 |
|
U.S. Treasury Bonds 1.375% 11/15/40
|
1.2 |
|
U.S. Treasury Bonds 1.125% 08/15/40
|
1.1 |
|
FNMA, Pool #FS9979 6.000% 09/01/54
|
1.1 |
|
U.S. Treasury STRIPS 0.625% 2/15/43
|
1.0 |
|
| Largest Holdings [Text Block] |
|
U.S. Treasury Bonds 3.000% 02/15/48
|
3.5 |
|
U.S. Treasury Notes 4.000% 02/15/34
|
2.4 |
|
U.S. Treasury Bonds 2.250% 08/15/46
|
1.6 |
|
U.S. Treasury Notes 0.625% 08/15/30
|
1.2 |
|
GNMA, Pool #DJ1126 7.000% 04/20/2065
|
1.2 |
|
U.S. Treasury Bonds 1.625% 11/15/50
|
1.2 |
|
U.S. Treasury Bonds 1.375% 11/15/40
|
1.2 |
|
U.S. Treasury Bonds 1.125% 08/15/40
|
1.1 |
|
FNMA, Pool #FS9979 6.000% 09/01/54
|
1.1 |
|
U.S. Treasury STRIPS 0.625% 2/15/43
|
1.0 |
|
| Diamond Hill Core Plus Bond Fund | Investor Class |
|
| Shareholder Report [Line Items] |
|
| Fund Name |
Diamond Hill Core Plus Bond Fund
|
| Class Name |
Investor
|
| Trading Symbol |
DHNAX
|
| Annual or Semi-Annual Statement [Text Block] |
This semi-annual shareholder report contains important information about Diamond Hill Core Plus Bond Fund (the "Fund") for the period of January 1, 2025 to June 30, 2025.
|
| Shareholder Report Annual or Semi-Annual |
semi-annual shareholder report
|
| Additional Information [Text Block] |
You can find additional information about the Fund at https://diamond-hill.com/documents. You can also request this information by contacting us at 888-226-5595 or info@diamond-hill.com or by contacting your financial advisor.
|
| Additional Information Phone Number |
888-226-5595
|
| Additional Information Email |
info@diamond-hill.com
|
| Additional Information Website |
https://diamond-hill.com/documents
|
| Expenses [Text Block] |
|
| Expenses Paid, Amount |
$ 44
|
| Expense Ratio, Percent |
0.86%
|
| Factors Affecting Performance [Text Block] |
The Fund (Ticker: DHNAX) returned 4.23% for the 6-month period ended June 30, 2025. Over that same period, the Bloomberg US Aggregate Bond Index returned 4.02%. The Fund's performance was driven by strength in the agency mortgage-backed securities (MBS) sector. The Fund's corporate credit exposure was also nicely positive on an absolute basis. The Fund's underweight position to the Treasury market was a relative headwind. |
| Performance Past Does Not Indicate Future [Text] |
Past performance is not indicative of future results.
|
| Line Graph [Table Text Block] |
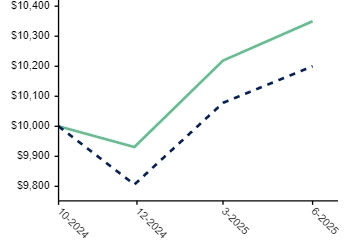
|
| Average Annual Return [Table Text Block] |
|
Investor |
4.23%
|
3.50%
|
|
Bloomberg US Aggregate Bond Index |
4.02
|
2.00
|
|
| Performance Inception Date |
Oct. 15, 2024
|
| No Deduction of Taxes [Text Block] |
The performance of the above Fund does not reflect the deduction of taxes that a shareholder would pay on Fund distributions or the redemption of Fund shares.
|
| Net Assets |
$ 60,545,885
|
| Holdings Count | shares |
349
|
| Advisory Fees Paid, Amount |
$ 89,622
|
| Investment Company, Portfolio Turnover |
31.00%
|
| Additional Fund Statistics [Text Block] |
| Net Assets |
$60,545,885 |
| Number of Portfolio Holdings |
349 |
| Portfolio Turnover Rate |
31% |
| Total Advisory Fees Paid |
$89,622 |
|
Effective Duration
|
5.68
|
|
Weighted Average Life
|
7.20
|
|
Option-Adjusted Spread
|
151
|
|
| Holdings [Text Block] |
|
Securitized
|
61.5% |
|
Corporate Credit
|
21.7% |
|
Treasury
|
16.4% |
|
Registered Investment Companies
|
2.9% |
|
Liabilities in Excess of Other Assets
|
-2.5% |

|
U.S. Treasury Notes 4.000% 02/15/34
|
4.5 |
|
U.S. Treasury Bonds 3.000% 02/15/48
|
3.7 |
|
U.S. Treasury Notes 0.625% 08/15/30
|
1.8 |
|
GNMA, Pool #DJ1126 7.000% 04/20/2065
|
1.7 |
|
FNMA, Series 2009-50, Class HZ 5.540% 02/25/49
|
1.3 |
|
GNMA, Series 2022-063, Class LM 3.500% 10/20/50
|
1.2 |
|
GNMA, Series 2014-118, Class ZD 2.500% 08/16/44
|
1.1 |
|
FNMA, Pool #BM6504 3.500% 01/01/48
|
1.1 |
|
U.S. Treasury Bonds 2.250% 08/15/46
|
1.1 |
|
U.S. Treasury Bonds 1.125% 08/15/40
|
1.0 |
|
| Largest Holdings [Text Block] |
|
U.S. Treasury Notes 4.000% 02/15/34
|
4.5 |
|
U.S. Treasury Bonds 3.000% 02/15/48
|
3.7 |
|
U.S. Treasury Notes 0.625% 08/15/30
|
1.8 |
|
GNMA, Pool #DJ1126 7.000% 04/20/2065
|
1.7 |
|
FNMA, Series 2009-50, Class HZ 5.540% 02/25/49
|
1.3 |
|
GNMA, Series 2022-063, Class LM 3.500% 10/20/50
|
1.2 |
|
GNMA, Series 2014-118, Class ZD 2.500% 08/16/44
|
1.1 |
|
FNMA, Pool #BM6504 3.500% 01/01/48
|
1.1 |
|
U.S. Treasury Bonds 2.250% 08/15/46
|
1.1 |
|
U.S. Treasury Bonds 1.125% 08/15/40
|
1.0 |
|
| Diamond Hill Core Plus Bond Fund | Class I |
|
| Shareholder Report [Line Items] |
|
| Fund Name |
Diamond Hill Core Plus Bond Fund
|
| Class Name |
Class I
|
| Trading Symbol |
DHNIX
|
| Annual or Semi-Annual Statement [Text Block] |
This semi-annual shareholder report contains important information about Diamond Hill Core Plus Bond Fund (the "Fund") for the period of January 1, 2025 to June 30, 2025.
|
| Shareholder Report Annual or Semi-Annual |
semi-annual shareholder report
|
| Additional Information [Text Block] |
You can find additional information about the Fund at https://diamond-hill.com/documents. You can also request this information by contacting us at 888-226-5595 or info@diamond-hill.com or by contacting your financial advisor.
|
| Additional Information Phone Number |
888-226-5595
|
| Additional Information Email |
info@diamond-hill.com
|
| Additional Information Website |
https://diamond-hill.com/documents
|
| Expenses [Text Block] |
|
| Expenses Paid, Amount |
$ 29
|
| Expense Ratio, Percent |
0.57%
|
| Factors Affecting Performance [Text Block] |
The Fund (Ticker: DHNIX) returned 4.31% for the 6-month period ended June 30, 2025. Over that same period, the Bloomberg US Aggregate Bond Index returned 4.02%. The Fund's performance was driven by strength in the agency mortgage-backed securities (MBS) sector. The Fund's corporate credit exposure was also nicely positive on an absolute basis. The Fund's underweight position to the Treasury market was a relative headwind. |
| Performance Past Does Not Indicate Future [Text] |
Past performance is not indicative of future results.
|
| Line Graph [Table Text Block] |
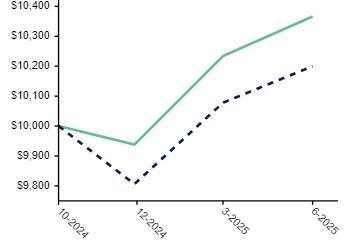
|
| Average Annual Return [Table Text Block] |
|
Class I |
4.31%
|
3.66%
|
|
Bloomberg US Aggregate Bond Index |
4.02
|
2.00
|
|
| Performance Inception Date |
Oct. 15, 2024
|
| No Deduction of Taxes [Text Block] |
The performance of the above Fund does not reflect the deduction of taxes that a shareholder would pay on Fund distributions or the redemption of Fund shares.
|
| Net Assets |
$ 60,545,885
|
| Holdings Count | shares |
349
|
| Advisory Fees Paid, Amount |
$ 89,622
|
| Investment Company, Portfolio Turnover |
31.00%
|
| Additional Fund Statistics [Text Block] |
| Net Assets |
$60,545,885 |
| Number of Portfolio Holdings |
349 |
| Portfolio Turnover Rate |
31% |
| Total Advisory Fees Paid |
$89,622 |
|
Effective Duration
|
5.68
|
|
Weighted Average Life
|
7.20
|
|
Option-Adjusted Spread
|
151
|
|
| Holdings [Text Block] |
|
Securitized
|
61.5% |
|
Corporate Credit
|
21.7% |
|
Treasury
|
16.4% |
|
Registered Investment Companies
|
2.9% |
|
Liabilities in Excess of Other Assets
|
-2.5% |

|
U.S. Treasury Notes 4.000% 02/15/34
|
4.5 |
|
U.S. Treasury Bonds 3.000% 02/15/48
|
3.7 |
|
U.S. Treasury Notes 0.625% 08/15/30
|
1.8 |
|
GNMA, Pool #DJ1126 7.000% 04/20/2065
|
1.7 |
|
FNMA, Series 2009-50, Class HZ 5.540% 02/25/49
|
1.3 |
|
GNMA, Series 2022-063, Class LM 3.500% 10/20/50
|
1.2 |
|
GNMA, Series 2014-118, Class ZD 2.500% 08/16/44
|
1.1 |
|
FNMA, Pool #BM6504 3.500% 01/01/48
|
1.1 |
|
U.S. Treasury Bonds 2.250% 08/15/46
|
1.1 |
|
U.S. Treasury Bonds 1.125% 08/15/40
|
1.0 |
|
| Largest Holdings [Text Block] |
|
U.S. Treasury Notes 4.000% 02/15/34
|
4.5 |
|
U.S. Treasury Bonds 3.000% 02/15/48
|
3.7 |
|
U.S. Treasury Notes 0.625% 08/15/30
|
1.8 |
|
GNMA, Pool #DJ1126 7.000% 04/20/2065
|
1.7 |
|
FNMA, Series 2009-50, Class HZ 5.540% 02/25/49
|
1.3 |
|
GNMA, Series 2022-063, Class LM 3.500% 10/20/50
|
1.2 |
|
GNMA, Series 2014-118, Class ZD 2.500% 08/16/44
|
1.1 |
|
FNMA, Pool #BM6504 3.500% 01/01/48
|
1.1 |
|
U.S. Treasury Bonds 2.250% 08/15/46
|
1.1 |
|
U.S. Treasury Bonds 1.125% 08/15/40
|
1.0 |
|
| Diamond Hill Core Plus Bond Fund | Class Y |
|
| Shareholder Report [Line Items] |
|
| Fund Name |
Diamond Hill Core Plus Bond Fund
|
| Class Name |
Class Y
|
| Trading Symbol |
DHNYX
|
| Annual or Semi-Annual Statement [Text Block] |
This semi-annual shareholder report contains important information about Diamond Hill Core Plus Bond Fund (the "Fund") for the period of January 1, 2025 to June 30, 2025.
|
| Shareholder Report Annual or Semi-Annual |
semi-annual shareholder report
|
| Additional Information [Text Block] |
You can find additional information about the Fund at https://diamond-hill.com/documents. You can also request this information by contacting us at 888-226-5595 or info@diamond-hill.com or by contacting your financial advisor.
|
| Additional Information Phone Number |
888-226-5595
|
| Additional Information Email |
info@diamond-hill.com
|
| Additional Information Website |
https://diamond-hill.com/documents
|
| Expenses [Text Block] |
|
| Expenses Paid, Amount |
$ 23
|
| Expense Ratio, Percent |
0.45%
|
| Factors Affecting Performance [Text Block] |
The Fund (Ticker: DHNYX) returned 4.47% for the 6-month period ended June 30, 2025. Over that same period, the Bloomberg US Aggregate Bond Index returned 4.02%. The Fund's performance was driven by strength in the agency mortgage-backed securities (MBS) sector. The Fund's corporate credit exposure was also nicely positive on an absolute basis. The Fund's underweight position to the Treasury market was a relative headwind. |
| Performance Past Does Not Indicate Future [Text] |
Past performance is not indicative of future results.
|
| Line Graph [Table Text Block] |
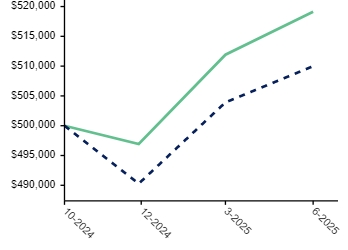
|
| Average Annual Return [Table Text Block] |
|
Class Y |
4.47%
|
3.83%
|
|
Bloomberg US Aggregate Bond Index |
4.02
|
2.00
|
|
| Performance Inception Date |
Oct. 15, 2024
|
| No Deduction of Taxes [Text Block] |
The performance of the above Fund does not reflect the deduction of taxes that a shareholder would pay on Fund distributions or the redemption of Fund shares.
|
| Net Assets |
$ 60,545,885
|
| Holdings Count | shares |
349
|
| Advisory Fees Paid, Amount |
$ 89,622
|
| Investment Company, Portfolio Turnover |
31.00%
|
| Additional Fund Statistics [Text Block] |
| Net Assets |
$60,545,885 |
| Number of Portfolio Holdings |
349 |
| Portfolio Turnover Rate |
31% |
| Total Advisory Fees Paid |
$89,622 |
|
Effective Duration
|
5.68
|
|
Weighted Average Life
|
7.20
|
|
Option-Adjusted Spread
|
151
|
|
| Holdings [Text Block] |
|
Securitized
|
61.5% |
|
Corporate Credit
|
21.7% |
|
Treasury
|
16.4% |
|
Registered Investment Companies
|
2.9% |
|
Liabilities in Excess of Other Assets
|
-2.5% |
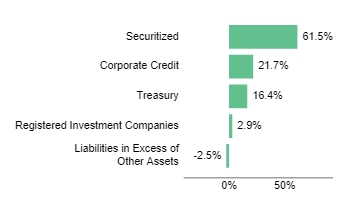
|
U.S. Treasury Notes 4.000% 02/15/34
|
4.5 |
|
U.S. Treasury Bonds 3.000% 02/15/48
|
3.7 |
|
U.S. Treasury Notes 0.625% 08/15/30
|
1.8 |
|
GNMA, Pool #DJ1126 7.000% 04/20/2065
|
1.7 |
|
FNMA, Series 2009-50, Class HZ 5.540% 02/25/49
|
1.3 |
|
GNMA, Series 2022-063, Class LM 3.500% 10/20/50
|
1.2 |
|
GNMA, Series 2014-118, Class ZD 2.500% 08/16/44
|
1.1 |
|
FNMA, Pool #BM6504 3.500% 01/01/48
|
1.1 |
|
U.S. Treasury Bonds 2.250% 08/15/46
|
1.1 |
|
U.S. Treasury Bonds 1.125% 08/15/40
|
1.0 |
|
| Largest Holdings [Text Block] |
|
U.S. Treasury Notes 4.000% 02/15/34
|
4.5 |
|
U.S. Treasury Bonds 3.000% 02/15/48
|
3.7 |
|
U.S. Treasury Notes 0.625% 08/15/30
|
1.8 |
|
GNMA, Pool #DJ1126 7.000% 04/20/2065
|
1.7 |
|
FNMA, Series 2009-50, Class HZ 5.540% 02/25/49
|
1.3 |
|
GNMA, Series 2022-063, Class LM 3.500% 10/20/50
|
1.2 |
|
GNMA, Series 2014-118, Class ZD 2.500% 08/16/44
|
1.1 |
|
FNMA, Pool #BM6504 3.500% 01/01/48
|
1.1 |
|
U.S. Treasury Bonds 2.250% 08/15/46
|
1.1 |
|
U.S. Treasury Bonds 1.125% 08/15/40
|
1.0 |
|