The Fund seeks returns that exceed the rate of inflation over the long-term.
These tables are intended to help you understand the various costs and expenses you will pay if you buy, hold and sell shares of the Fund. You may qualify for sales charge discounts if you and your family invest, or agree to invest in the future, at least $50,000 in the aggregate in specified classes of certain Allspring Funds. More information about these and other discounts is available from your financial professional and in “Share Class Features” and “Reductions and Waivers of Sales Charges” on pages 31 and 33 of the Prospectus and “Additional Purchase and Redemption Information” on page 86 of the Statement of Additional Information. Investors who purchase through certain intermediaries may be subject to different sales charge discounts than those outlined shares in these sections. Please see Appendix A on page 59 for further information.
|
Shareholder Fees (fees paid directly from your investment) | |||||
|
A |
C |
R6 |
Administrator |
Institutional | |
|
Maximum sales charge (load) imposed on purchases (as a percentage of offering price) |
4.50% |
None |
None |
None |
None |
|
Maximum deferred sales charge (load) (as a percentage of offering price) |
None1 |
1.00% |
None |
None |
None |
| 1. | Investments of $500,000 or more are not subject to a front-end sales charge but generally will be subject to a deferred sales charge of 1.00% if redeemed within 18 months from the date of purchase. |
|
Annual Fund Operating Expenses (expenses that you pay each year as a percentage of the value of your investment)1 | |||||
|
A |
C |
R6 |
Administrator |
Institutional | |
|
Management Fees2 |
0.45% |
0.45% |
0.45% |
0.45% |
0.45% |
|
Distribution (12b-1) Fees |
0.00% |
0.75% |
0.00% |
0.00% |
0.00% |
|
Other Expenses3 |
0.64% |
0.64% |
0.27% |
0.59% |
0.32% |
|
Total Annual Fund Operating Expenses |
1.09% |
1.84% |
0.72% |
1.04% |
0.77% |
|
Fee Waivers |
(0.32)% |
(0.32)% |
(0.32)% |
(0.44)% |
(0.32)% |
|
Total Annual Fund Operating Expenses After Fee Waivers4 |
0.77% |
1.52% |
0.40% |
0.60% |
0.45% |
| 1. | Expenses have been adjusted as necessary from amounts incurred during the Fund’s most recent fiscal year to reflect current fees and expenses. |
| 2. | Reflects the fees charged by Allspring Funds Management for providing investment advisory services to the master portfolio in which the Fund invests substantially all of its assets. |
| 3. | Includes other expenses allocated from the master portfolio in which the Fund invests. |
| 4. | The Manager has contractually committed through August 31, 2026, to waive fees and/or reimburse expenses to the extent necessary to cap Total Annual Fund Operating Expenses After Fee Waiver at 0.77% for Class A, 1.52% for Class C, 0.40% for Class R6, 0.60% for Administrator Class and 0.45% for Institutional Class. Brokerage commissions, stamp duty fees, interest, taxes, acquired fund fees and expenses (if any), and extraordinary expenses are excluded from the expense cap. Prior to or after the commitment expiration date, the cap may be increased or the commitment to maintain the cap may be terminated only with the approval of the Board of Trustees. |
The example below is intended to help you compare the costs of investing in the Fund with the costs of investing in other funds. The example assumes a $10,000 initial investment, 5% annual total return, and that fees and expenses remain the same as in the tables above. To the extent that the Manager is waiving fees or reimbursing expenses, the example assumes that such waiver or reimbursement will only be in place through the date noted above. Although your actual costs may be higher or lower, based on these assumptions, your costs would be:
|
Assuming you sold your shares, you would pay: |
After 1 Year |
After 3 Years |
After 5 Years |
After 10 Years |
|
Class A |
$525 |
$751 |
$994 |
$1,691 |
|
Class C |
$255 |
$548 |
$966 |
$2,132 |
|
Class R6 |
$41 |
$198 |
$369 |
$864 |
|
Administrator Class |
$61 |
$287 |
$531 |
$1,231 |
|
Institutional Class |
$46 |
$214 |
$396 |
$924 |
|
Assuming you held your shares, you would pay: |
After 1 Year |
After 3 Years |
After 5 Years |
After 10 Years |
|
Class C |
$155 |
$548 |
$966 |
$2,132 |
|
Assuming you sold your shares, you would pay: |
After 1 Year |
After 3 Years |
After 5 Years |
After 10 Years |
|
Class A |
$525 |
$751 |
$994 |
$1,691 |
|
Class C |
$255 |
$548 |
$966 |
$2,132 |
|
Class R6 |
$41 |
$198 |
$369 |
$864 |
|
Administrator Class |
$61 |
$287 |
$531 |
$1,231 |
|
Institutional Class |
$46 |
$214 |
$396 |
$924 |
|
Assuming you held your shares, you would pay: |
After 1 Year |
After 3 Years |
After 5 Years |
After 10 Years |
|
Class C |
$155 |
$548 |
$966 |
$2,132 |
The Fund pays transaction costs, such as commissions, when it buys and sells securities (or “turns over” its portfolio). A higher portfolio turnover rate may indicate higher transaction costs and may result in higher taxes when Fund shares are held in a taxable account. These costs, which are not reflected in annual fund operating expenses or in the example, affect the Fund’s performance. During the most recent fiscal year, the Fund’s portfolio turnover rate was 61%1 of the average value of its portfolio.
| 1. | The Fund changed its fiscal year-end from May 31 to April 30. The information shown for the Fund is for this shortened period. |
Under normal circumstances, we invest:
| ■ | up to 70% of the Fund’s total assets in debt securities; |
| ■ | up to 70% of the Fund’s total assets in equity securities; and |
| ■ | up to 25% of the Fund’s net assets in commodities. |
The Fund is a feeder fund that invests substantially all of its assets in the Real Return Portfolio, a master portfolio with a substantially identical investment objective and substantially similar investment strategies. We may invest in additional master portfolios, in other Allspring Funds, or directly in a portfolio of securities.
We utilize an active allocation strategy to diversify the portfolio across various investments, assets and sectors, in an attempt to generate a real return (a return in excess of the rate of inflation) over an economic cycle, consistent with an appropriate level of risk. We dynamically allocate investments to various broad asset classes across debt, equity and commodities based on our assessment of changing economic, global market, industry, and issuer conditions.
We may invest up to 70% of the Fund’s total assets in debt securities including but not limited to, inflation-indexed debt securities, corporate-issued debt, mortgage- and asset-backed securities, bank loans and government obligations. These securities may have fixed, floating or variable rates. We may invest up to 20% of the Fund’s total assets in below investment-grade debt securities, often called “high yield securities” or “junk bonds”. We do not manage the portfolio to a specific maturity or duration. We may use futures contracts to manage or adjust duration and yield curve exposure, as well as to manage risk or to enhance return.
We may invest up to 70% of the Fund’s total assets in equity securities, including but not limited to, common stock, preferred stock and real estate investment trusts (“REITs”), of domestic and foreign issuers of any market capitalization. We may invest in derivatives, such as futures and swaps, that have similar economic or financial characteristics of any security described above.
We may invest up to 25% of the Fund’s net assets in the common or preferred stock of a subsidiary of the Fund that typically invests directly or indirectly in commodity-linked derivatives such as commodity forwards, commodity futures, commodity swaps, swaps on commodity futures and other commodity-linked derivative securities; it may also invest in all other securities allowed in the Fund. These holdings may contribute more than 25% of the Fund’s risk allocation.
The Fund will incorporate a derivatives overlay strategy that contains three specific risk management components: 1.) Tactical Asset Allocation (TAA) Overlay, 2.) Tail Risk Management (TRM) and 3.) Real Return Overlay (RRO). Together these strategies will allow the Fund to attempt to manage short-term volatility, mitigate risk and/or improve returns under certain market conditions. To execute this overlay strategy, the Fund (either directly or through its subsidiary in the case of commodity exposure) invests in long and/or short positions in exchange-traded futures and/or currency
forward contracts across a variety of asset classes, which include, but are not limited to, stocks, bonds, commodities, and currencies.
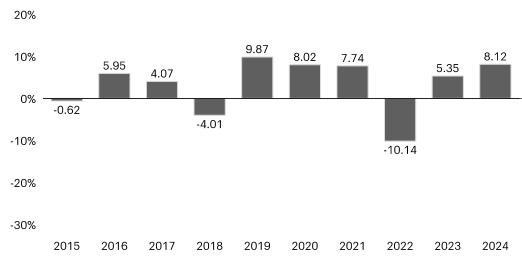
The following information provides some indication of the risks of investing in the Fund by showing changes in the Fund’s performance from year to year. The Fund’s average annual total returns are compared to the performance of one or more indices. Past performance before and after taxes is no guarantee of future results. Current month-end performance is available on the Fund’s website at www.allspringglobal.com.
|
Calendar
Year Total Returns for Class A as of 12/31 each year | ||
|
|
Highest
Quarter: |
+6.14% |
|
Lowest
Quarter: |
-7.08% | |
|
Year-to-date total return as of June 30, 2025 is +4.45% |
| |
| Highest Quarter: | +6.14% |
| Lowest Quarter: | -7.08% |
| Year-to-date total return as of June 30, 2025 is +4.45% |
|
Average Annual Total Returns for the periods ended 12/31/2024 (returns reflect applicable sales charges)1,2 | ||||
|
Inception Date of Share Class |
1 Year |
5 Year |
10 Year | |
|
Class A (before taxes) |
2/28/2003 |
3.26% |
2.61% |
2.77% |
|
Class A (after taxes on distributions) |
2/28/2003 |
2.31% |
1.26% |
1.70% |
|
Class A (after taxes on distributions and the sale of Fund Shares) |
2/28/2003 |
1.92% |
1.42% |
1.69% |
|
Class C (before taxes) |
2/28/2003 |
6.36% |
2.80% |
2.62% |
|
Class R6 (before taxes) |
10/31/2016 |
8.51% |
3.97% |
3.62% |
|
Administrator Class (before taxes) |
2/28/2003 |
8.29% |
3.75% |
3.45% |
|
Institutional Class (before taxes) |
10/31/2016 |
8.56% |
3.92% |
3.57% |
|
Real Return Blended Index (reflects no deduction for fees, expenses, or taxes)3 |
10.35% |
3.81% |
3.21% | |
|
Russell 3000® Index (reflects no deduction for fees, expenses, or taxes) |
23.81% |
13.86% |
12.55% | |
|
Bloomberg U.S. Aggregate Bond Index (reflects no deduction for fees, expenses, or taxes) |
1.25% |
-0.33% |
1.35% | |
| 1. | Historical performance shown for the Class R6 shares prior to their inception reflects the performance of the Administrator Class shares, and is not adjusted to reflect the Class R6 expenses. If these expenses had been included, returns for the Class R6 shares would be higher. |
| 2. | Historical performance shown for the Institutional Class shares prior to their inception reflects the performance of the Administrator Class shares, and includes the higher expenses applicable to the Administrator Class shares. |
| 3. | Source: Allspring Funds Management, LLC The Real Return Blended Index is comprised of 40% Russell 1000® Index, 35% Bloomberg U.S. TIPS Index and 25% Bloomberg U.S. Aggregate Bond Index. Prior to December 1, 2023, the Real Return Blended Index was comprised of 100% Bloomberg U.S. TIPS Index. |
After-tax returns are calculated using the historical highest individual federal marginal income tax rates and do not reflect the impact of state, local or foreign taxes. Actual after-tax returns depend on an investor’s tax situation and may differ from those shown, and after-tax returns shown are not relevant to tax-exempt investors or investors who hold their Fund shares through tax-deferred arrangements, such as 401(k) Plans or Individual Retirement Accounts. After-tax returns are shown for only one class of shares. After-tax returns for any other class will vary.
| [1] | Historical performance shown for the Class R6 shares prior to their inception reflects the performance of the Administrator Class shares, and is not adjusted to reflect the Class R6 expenses. If these expenses had been included, returns for the Class R6 shares would be higher. |
| [2] | Historical performance shown for the Institutional Class shares prior to their inception reflects the performance of the Administrator Class shares, and includes the higher expenses applicable to the Administrator Class shares. |