The Fund seeks long-term total return, consisting of capital appreciation and current income.
These tables are intended to help you understand the various costs and expenses you will pay if you buy, hold and sell shares of the Fund. You may qualify for sales charge discounts if you and your family invest, or agree to invest in the future, at least $50,000 in the aggregate in specified classes of certain Allspring Funds. More information about these and other discounts is available from your financial professional and in “Share Class Features” and “Reductions and Waivers of Sales Charges” on pages 31 and 33 of the Prospectus and “Additional Purchase and Redemption Information” on page 86 of the Statement of Additional Information. Investors who purchase through certain intermediaries may be subject to different sales charge discounts than those outlined shares in these sections. Please see Appendix A on page 59 for further information.
|
Shareholder Fees (fees paid directly from your investment) | ||||
|
A |
C |
Administrator |
Institutional | |
|
Maximum sales charge (load) imposed on purchases (as a percentage of offering price) |
5.75% |
None |
None |
None |
|
Maximum deferred sales charge (load) (as a percentage of offering price) |
None1 |
1.00% |
None |
None |
| 1. | Investments of $1 million or more are not subject to a front-end sales charge but generally will be subject to a deferred sales charge of 1.00% if redeemed within 18 months from the date of purchase. |
|
Annual Fund Operating Expenses (expenses that you pay each year as a percentage of the value of your investment)1 | ||||
|
A |
C |
Administrator |
Institutional | |
|
Management Fees |
0.28% |
0.28% |
0.28% |
0.28% |
|
Distribution (12b-1) Fees |
0.00% |
0.75% |
0.00% |
0.00% |
|
Other Expenses |
0.48% |
0.48% |
0.41% |
0.16% |
|
Acquired Fund Fees and Expenses |
0.44% |
0.44% |
0.44% |
0.44% |
|
Total Annual Fund Operating Expenses |
1.20% |
1.95% |
1.13% |
0.88% |
|
Fee Waivers |
(0.13)% |
(0.13)% |
(0.23)% |
(0.13)% |
|
Total Annual Fund Operating Expenses After Fee Waivers2 |
1.07% |
1.82% |
0.90% |
0.75% |
| 1. | Expenses have been adjusted as necessary from amounts incurred during the Fund’s most recent fiscal year to reflect current fees and expenses. |
| 2. | The Manager has contractually committed through August 31, 2026, to waive fees and/or reimburse expenses to the extent necessary to cap Total Annual Fund Operating Expenses After Fee Waiver at 1.07% for Class A, 1.82% for Class C, 0.90% for Administrator Class and 0.75% for Institutional Class. Brokerage commissions, stamp duty fees, interest, taxes, acquired fund fees and expenses (if any), and extraordinary expenses are excluded from the expense cap. Prior to or after the commitment expiration date, the cap may be increased or the commitment to maintain the cap may be terminated only with the approval of the Board of Trustees. |
The example below is intended to help you compare the costs of investing in the Fund with the costs of investing in other funds. The example assumes a $10,000 initial investment, 5% annual total return, and that fees and expenses remain the same as in the tables above. To the extent that the Manager is waiving fees or reimbursing expenses, the example assumes that such waiver or reimbursement will only be in place through the date noted above. Although your actual costs may be higher or lower, based on these assumptions, your costs would be:
|
Assuming you sold your shares, you would pay: |
After 1 Year |
After 3 Years |
After 5 Years |
After 10 Years |
|
Class A |
$678 |
$922 |
$1,185 |
$1,935 |
|
Class C |
$285 |
$600 |
$1,040 |
$2,264 |
|
Administrator Class |
$92 |
$336 |
$600 |
$1,354 |
|
Assuming you sold your shares, you would pay: |
After 1 Year |
After 3 Years |
After 5 Years |
After 10 Years |
|
Institutional Class |
$77 |
$268 |
$475 |
$1,072 |
|
Assuming you held your shares, you would pay: |
After 1 Year |
After 3 Years |
After 5 Years |
After 10 Years |
|
Class C |
$185 |
$600 |
$1,040 |
$2,264 |
The Fund pays transaction costs, such as commissions, when it buys and sells securities (or “turns over” its portfolio). A higher portfolio turnover rate may indicate higher transaction costs and may result in higher taxes when Fund shares are held in a taxable account. These costs, which are not reflected in annual fund operating expenses or in the example, affect the Fund’s performance. During the most recent fiscal year, the Fund’s portfolio turnover rate was 111% of the average value of its portfolio.
The Fund is a fund-of-funds that invests in various affiliated mutual funds and exchange-traded funds (“Underlying Funds”) employing a multi-asset, multi-style investment approach designed to reduce the price and return volatility of the Fund and to provide more consistent returns. The Fund may invest in Allspring Master Portfolios, in other Allspring Funds, or directly in securities. The Fund is a diversified investment, providing exposure to equity, fixed income and alternative investment strategies. The Fund invests at least 55% and up to 75% of its assets in stock funds and at least 25% and up to 45% of its assets in bond funds.
The Fund may be exposed to any asset class, including, for example, U.S. and foreign equities (including emerging market equities), U.S. and foreign fixed income securities (including emerging markets fixed income securities), and alternative investments. The Underlying Funds may gain their investment exposures directly or through investment in derivatives.
The Fund will incorporate a Tactical Asset Allocation (TAA) Overlay strategy which invests in long and/or short positions in exchange-traded futures contracts across a variety of asset classes, which include, but are not limited to, stocks, bonds, and currencies. The TAA Overlay strategy seeks to improve the Fund’s risk/return profile through the tactical use of futures contracts. The TAA Overlay uses qualitative and quantitative inputs to guide equity and fixed income exposures in the Fund. Dependent upon market conditions, the TAA Overlay may increase or decrease exposures to a given asset class.
As part of managing the Fund’s level of risk, both in absolute terms and relative to its benchmark, we may make changes to the allocations among investment styles at any time. We may use cash flows or effect transactions to accomplish these changes.
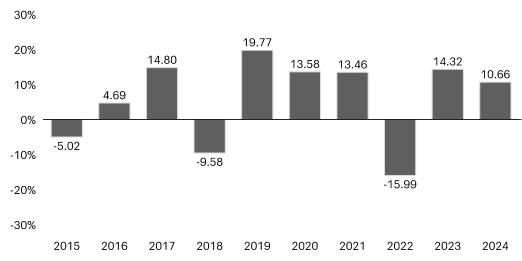
The following information provides some indication of the risks of investing in the Fund by showing changes in the Fund’s performance from year to year. The Fund’s average annual total returns are compared to the performance of one or more indices. Past performance before and after taxes is no guarantee of future results. Current month-end performance is available on the Fund’s website at www.allspringglobal.com.
|
Calendar
Year Total Returns for Class A as of 12/31 each year | ||
|
|
Highest
Quarter: |
+14.53% |
|
Lowest
Quarter: |
-15.02% | |
|
Year-to-date total return as of June 30, 2025 is +6.73% |
| |
| Highest Quarter: | +14.53% |
| Lowest Quarter: | -15.02% |
| Year-to-date total return as of June 30, 2025 is +6.73% |
|
Average Annual Total Returns for the periods ended 12/31/2024 (returns reflect applicable sales charges) | ||||
|
Inception Date of Share Class |
1 Year |
5 Year |
10 Year | |
|
Class A (before taxes) |
7/29/1996 |
4.31% |
5.24% |
4.78% |
|
Class A (after taxes on distributions) |
7/29/1996 |
1.78% |
3.16% |
3.32% |
|
Class A (after taxes on distributions and the sale of Fund Shares) |
7/29/1996 |
3.35% |
3.47% |
3.37% |
|
Class C (before taxes) |
10/3/2002 |
8.88% |
5.83% |
4.85% |
|
Administrator Class (before taxes) |
10/3/2002 |
10.78% |
7.04% |
5.77% |
|
Institutional Class (before taxes) |
11/30/2012 |
11.03% |
6.85% |
5.78% |
|
Asset Allocation Blended Index (reflects no deduction for fees, expenses, or taxes)1 |
11.92% |
7.10% |
6.99% | |
|
Russell 3000® Index (reflects no deduction for fees, expenses, or taxes) |
23.81% |
13.86% |
12.55% | |
|
Bloomberg U.S. Aggregate Bond Index (reflects no deduction for fees, expenses, or taxes) |
1.25% |
-0.33% |
1.35% | |
| 1. | Source: Allspring Funds Management, LLC. The Asset Allocation Blended Index is composed of 45% of the Russell 3000® Index, 35% of the Bloomberg U.S. Aggregate Bond Index and 20% of the MSCI ACWI ex USA Index (Net). Prior to June 16, 2018, it was comprised of 65% of the MSCI ACWI Index (Net) and 35% of the Bloomberg U.S. Aggregate Bond Index. You cannot invest directly in an index. |
After-tax returns are calculated using the historical highest individual federal marginal income tax rates and do not reflect the impact of state, local or foreign taxes. Actual after-tax returns depend on an investor’s tax situation and may differ from those shown, and after-tax returns shown are not relevant to tax-exempt investors or investors who hold their Fund shares through tax-deferred arrangements, such as 401(k) Plans or Individual Retirement Accounts. After-tax returns are shown for only one class of shares. After-tax returns for any other class will vary.