The Fund seeks a positive total return.
These tables are intended to help you understand the various costs and expenses you will pay if you buy, hold and sell shares of the Fund. You may qualify for sales charge discounts if you and your family invest, or agree to invest in the future, at least $50,000 in the aggregate in specified classes of certain Allspring Funds. More information about these and other discounts is available from your financial professional and in “Share Class Features” and “Reductions and Waivers of Sales Charges” on pages 31 and 33 of the Prospectus and “Additional Purchase and Redemption Information” on page 86 of the Statement of Additional Information. Investors who purchase through certain intermediaries may be subject to different sales charge discounts than those outlined shares in these sections. Please see Appendix A on page 59 for further information.
|
Shareholder Fees (fees paid directly from your investment) | |||||
|
A |
C |
R6 |
Administrator |
Institutional | |
|
Maximum sales charge (load) imposed on purchases (as a percentage of offering price) |
5.75% |
None |
None |
None |
None |
|
Maximum deferred sales charge (load) (as a percentage of offering price) |
None1 |
1.00% |
None |
None |
None |
| 1. | Investments of $1 million or more are not subject to a front-end sales charge but generally will be subject to a deferred sales charge of 1.00% if redeemed within 18 months from the date of purchase. |
|
Annual Fund Operating Expenses (expenses that you pay each year as a percentage of the value of your investment)1 | |||||
|
A |
C |
R6 |
Administrator |
Institutional | |
|
Management Fees |
0.23% |
0.23% |
0.23% |
0.23% |
0.23% |
|
Distribution (12b-1) Fees |
0.00% |
0.75% |
0.00% |
0.00% |
0.00% |
|
Other Expenses |
0.48% |
0.48% |
0.06% |
0.41% |
0.16% |
|
Acquired Fund Fees and Expenses |
0.49% |
0.49% |
0.49% |
0.49% |
0.49% |
|
Total Annual Fund Operating Expenses |
1.20% |
1.95% |
0.78% |
1.13% |
0.88% |
|
Fee Waivers |
(0.01)% |
(0.01)% |
(0.01)% |
(0.07)% |
(0.06)% |
|
Total Annual Fund Operating Expenses After Fee Waivers2 |
1.19% |
1.94% |
0.77% |
1.06% |
0.82% |
| 1. | Expenses have been adjusted as necessary from amounts incurred during the Fund’s most recent fiscal year to reflect current fees and expenses. |
| 2. | The Manager has contractually committed through August 31, 2026, to waive fees and/or reimburse expenses to the extent necessary to cap Total Annual Fund Operating Expenses After Fee Waiver at 0.70% for Class A, 1.45% for Class C, 0.28% for Class R6, 0.57% for Administrator Class and 0.33% for Institutional Class. Brokerage commissions, stamp duty fees, interest, taxes, acquired fund fees and expenses (if any), and extraordinary expenses are excluded from the expense cap. Prior to or after the commitment expiration date, the cap may be increased or the commitment to maintain the cap may be terminated only with the approval of the Board of Trustees. |
The example below is intended to help you compare the costs of investing in the Fund with the costs of investing in other funds. The example assumes a $10,000 initial investment, 5% annual total return, and that fees and expenses remain the same as in the tables above. To the extent that the Manager is waiving fees or reimbursing expenses, the example assumes that such waiver or reimbursement will only be in place through the date noted above. Although your actual costs may be higher or lower, based on these assumptions, your costs would be:
|
Assuming you sold your shares, you would pay: |
After 1 Year |
After 3 Years |
After 5 Years |
After 10 Years |
|
Class A |
$689 |
$932 |
$1,194 |
$1,941 |
|
Class C |
$297 |
$610 |
$1,049 |
$2,270 |
|
Class R6 |
$78 |
$247 |
$430 |
$961 |
|
Assuming you sold your shares, you would pay: |
After 1 Year |
After 3 Years |
After 5 Years |
After 10 Years |
|
Administrator Class |
$108 |
$351 |
$614 |
$1,364 |
|
Institutional Class |
$83 |
$274 |
$480 |
$1,075 |
|
Assuming you held your shares, you would pay: |
After 1 Year |
After 3 Years |
After 5 Years |
After 10 Years |
|
Class C |
$197 |
$610 |
$1,049 |
$2,270 |
|
Assuming you sold your shares, you would pay: |
After 1 Year |
After 3 Years |
After 5 Years |
After 10 Years |
|
Administrator Class |
$108 |
$351 |
$614 |
$1,364 |
|
Institutional Class |
$83 |
$274 |
$480 |
$1,075 |
|
Assuming you held your shares, you would pay: |
After 1 Year |
After 3 Years |
After 5 Years |
After 10 Years |
|
Class C |
$197 |
$610 |
$1,049 |
$2,270 |
The Fund pays transaction costs, such as commissions, when it buys and sells securities (or “turns over” its portfolio). A higher portfolio turnover rate may indicate higher transaction costs and may result in higher taxes when Fund shares are held in a taxable account. These costs, which are not reflected in annual fund operating expenses or in the example, affect the Fund’s performance. During the most recent fiscal year, the Fund’s portfolio turnover rate was 43% of the average value of its portfolio.
Under normal circumstances, we invest:
| ■ | Up to 60% of the Fund’s total assets in U.S. and non-U.S. equity, including emerging market equity funds; |
| ■ | Up to 60% of the Fund’s total assets in U.S. and non-U.S. fixed income, including emerging market debt funds; and |
| ■ | Up to 60% of the Fund’s total assets in alternative investment funds |
The Fund is a fund-of-funds that employs a multi-asset, multi-style investment approach by investing in various affiliated mutual funds as well as affiliated and unaffiliated exchange-traded funds. We dynamically allocate investments to various broad asset classes across equity, fixed income, and alternative investments, including commodities, based on our assessment of changing economic, global market, industry, and issuer conditions. Within these asset classes, we utilize an active allocation strategy to diversify the portfolio among investments that provide efficient upside returns while managing downside risk across most market cycles with the goal of generating a positive absolute return over an economic cycle.
Equity holdings are diversified across a wide range of equity funds, including but not limited to funds that invest in U.S. large company securities, U.S. small company securities and international developed and emerging markets. Fixed income holdings are diversified across a wide range of fixed income funds that invest in short- to long-term income-producing securities issued by U.S. and international developed and emerging markets issuers, including but not limited to, U.S. Government obligations, corporate bonds and below investment-grade bonds (often called “high yield” securities or “junk bonds”). Alternative investment holdings are allocated across funds that use alternative investment strategies, which may include, but are not limited to, risk premia (i.e., sources of excess return which result from systematic risks and/or behavioral biases existing within the financial markets), managed futures, merger arbitrage, global multi-asset, long-short, market neutral, systematic, or other tactical investment strategies.
The Fund may indirectly gain exposure to commodity-linked derivatives such as commodity forwards, commodity futures, commodity swaps, swaps on commodity futures and other commodity-linked derivative securities through an investment in an affiliated fund.
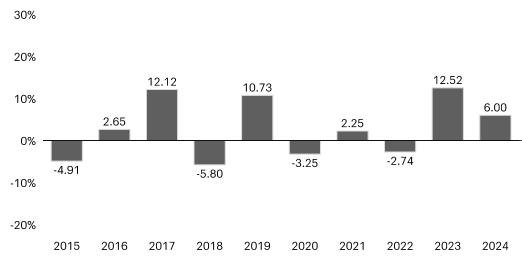
The following information provides some indication of the risks of investing in the Fund by showing changes in the Fund’s performance from year to year. The Fund’s average annual total returns are compared to the performance of one or more indices. Past performance before and after taxes is no guarantee of future results. Current month-end performance is available on the Fund’s website at www.allspringglobal.com.
|
Calendar
Year Total Returns for Class A as of 12/31 each year | ||
|
|
Highest
Quarter: |
+7.50% |
|
Lowest
Quarter: |
-16.05% | |
|
Year-to-date total return as of June 30, 2025 is +0.10% |
| |
| Highest Quarter: | +7.50% |
| Lowest Quarter: | -16.05% |
| Year-to-date total return as of June 30, 2025 is +0.10% |
|
Average Annual Total Returns for the periods ended 12/31/2024 (returns reflect applicable sales charges) | ||||
|
Inception Date of Share Class |
1 Year |
5 Year |
10 Year | |
|
Class A (before taxes) |
3/1/2012 |
-0.07% |
1.58% |
2.13% |
|
Class A (after taxes on distributions) |
3/1/2012 |
-4.07% |
0.18% |
1.14% |
|
Class A (after taxes on distributions and the sale of Fund Shares) |
3/1/2012 |
-0.04% |
0.79% |
1.34% |
|
Class C (before taxes) |
3/1/2012 |
4.22% |
2.10% |
2.16% |
|
Class R6 (before taxes) |
10/31/2014 |
6.53% |
3.23% |
3.19% |
|
Administrator Class (before taxes) |
3/1/2012 |
6.16% |
3.02% |
2.90% |
|
Institutional Class (before taxes) |
11/30/2012 |
6.42% |
3.17% |
3.10% |
|
Absolute Return Blended Index (reflects no deduction for fees, expenses, or taxes)1 |
7.62% |
4.49% |
4.78% | |
|
MSCI ACWI Index (Net) (reflects no deduction for fees, expenses, or taxes) |
17.49% |
10.06% |
9.23% | |
|
Bloomberg Global Aggregate Index Hedged (USD) (reflects no deduction for fees, expenses, or taxes) |
3.40% |
0.48% |
2.01% | |
| 1. | Source: Allspring Funds Management, LLC. The Absolute Return Blended Index is comprised of 35% MSCI ACWI Index (Net), 35% Bloomberg U.S. TIPS Index and 30% Bloomberg Global Aggregate Index Hedged (USD). You cannot invest directly in an index. |
After-tax returns are calculated using the historical highest individual federal marginal income tax rates and do not reflect the impact of state, local or foreign taxes. Actual after-tax returns depend on an investor’s tax situation and may differ from those shown, and after-tax returns shown are not relevant to tax-exempt investors or investors who hold their Fund shares through tax-deferred arrangements, such as 401(k) Plans or Individual Retirement Accounts. After-tax returns are shown for only one class of shares. After-tax returns for any other class will vary.