Shareholder Report
|
12 Months Ended |
|
Sep. 30, 2024
USD ($)
Holding
|
|---|
| Shareholder Report [Line Items] |
|
| Document Type |
N-CSR/A
|
| Amendment Flag |
true
|
| Amendment Description |
Amended filing for 9/30/2024 Timothy NCSR.
|
| Registrant Name |
TIMOTHY PLAN
|
| Entity Central Index Key |
0000916490
|
| Entity Investment Company Type |
N-1A
|
| Document Period End Date |
Sep. 30, 2024
|
| C000012348 |
|
| Shareholder Report [Line Items] |
|
| Fund Name |
Timothy Plan Conservative Growth Fund
|
| Class Name |
Class A
|
| Trading Symbol |
TCGAX
|
| Annual or Semi-Annual Statement [Text Block] |
This annual shareholder report contains important information about Timothy Plan Conservative Growth Fund for the period of October 1, 2023 to September 30, 2024.
|
| Shareholder Report Annual or Semi-Annual |
Annual Shareholder Report
|
| Additional Information [Text Block] |
You can find additional information about the Fund at https://fund.timothyplan.com. You can also request this information by contacting us at (800) 846-7526.
|
| Additional Information Phone Number |
(800) 846-7526
|
| Additional Information Website |
https://fund.timothyplan.com
|
| Expenses [Text Block] |
What were the Fund’s costs for the last year?(based on a hypothetical $10,000 investment) Class Name | Costs of a $10,000 investment | Costs paid as a percentage of a $10,000 investment |
|---|
Class A | $97 | 0.90% |
|---|
|
| Expenses Paid, Amount |
$ 97
|
| Expense Ratio, Percent |
0.90%
|
| Performance Past Does Not Indicate Future [Text] |
The Fund's past performance is not a good predictor of how the Fund will perform in the future.
|
| Average Annual Return [Table Text Block] |
Average Annual Total Returns | 1 Year | 5 Years | 10 Years |
|---|
Timothy Plan Conservative Growth Fund | | | |
|---|
Without Load | 14.71% | 3.64% | 2.84% |
|---|
With Load | 8.35% | 2.47% | 2.26% |
|---|
Dow Jones Moderate Portfolio Index | 20.62% | 6.50% | 6.18% |
|---|
Russell 3000® Index | 35.19% | 15.26% | 12.83% |
|---|
The Fund's past performance is not a good predictor of how the Fund will perform in the future. The graph and table do not reflect the deduction of taxes that a shareholder would pay on fund distributions or redemption of fund shares. |
| No Deduction of Taxes [Text Block] |
The graph and table do not reflect the deduction of taxes that a shareholder would pay on fund distributions or redemption of fund shares.
|
| AssetsNet |
$ 38,518,717
|
| Holdings Count | Holding |
9
|
| Advisory Fees Paid, Amount |
$ 56,692
|
| InvestmentCompanyPortfolioTurnover |
4.00%
|
| Additional Fund Statistics [Text Block] |
Net Assets | $38,518,717 |
|---|
Number of Portfolio Holdings | 9 |
|---|
Advisory Fee | $56,692 |
|---|
Portfolio Turnover | 4% |
|---|
|
| Holdings [Text Block] |
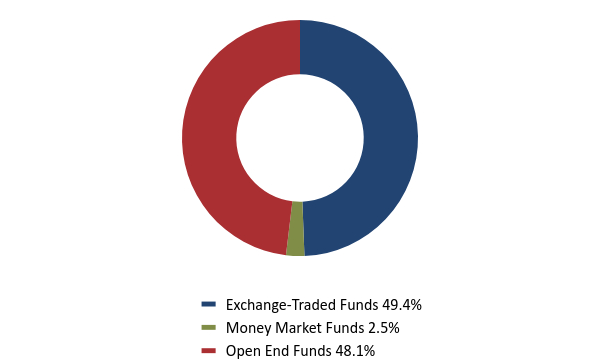
Asset Weighting (% of total investments)Value | Value |
|---|
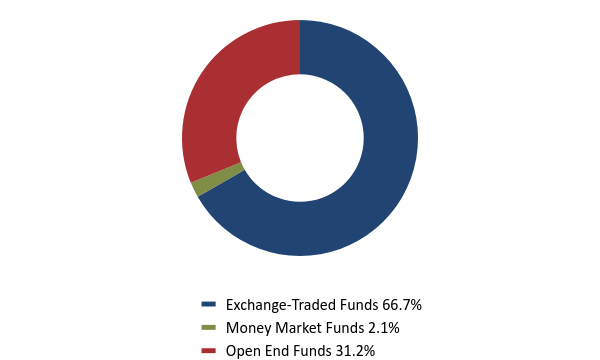
Exchange-Traded Funds | 49.4% | Money Market Funds | 2.5% | Open End Funds | 48.1% |
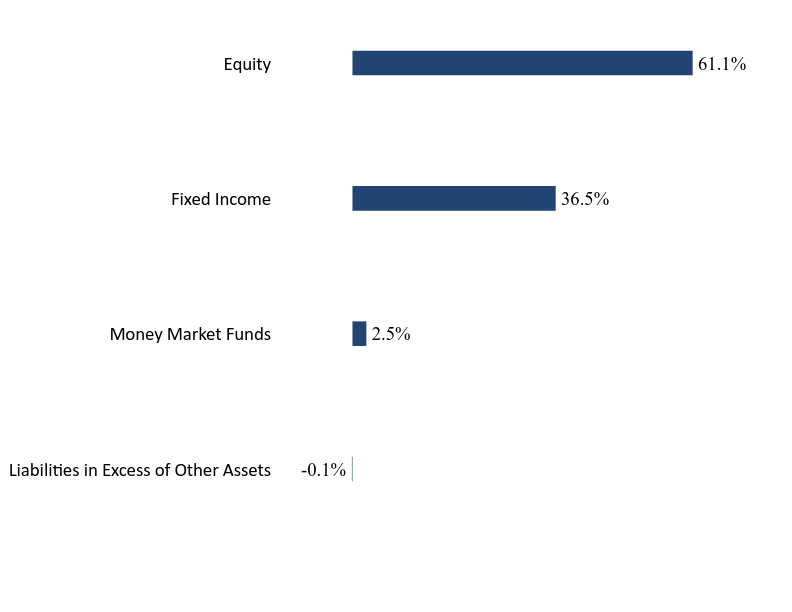
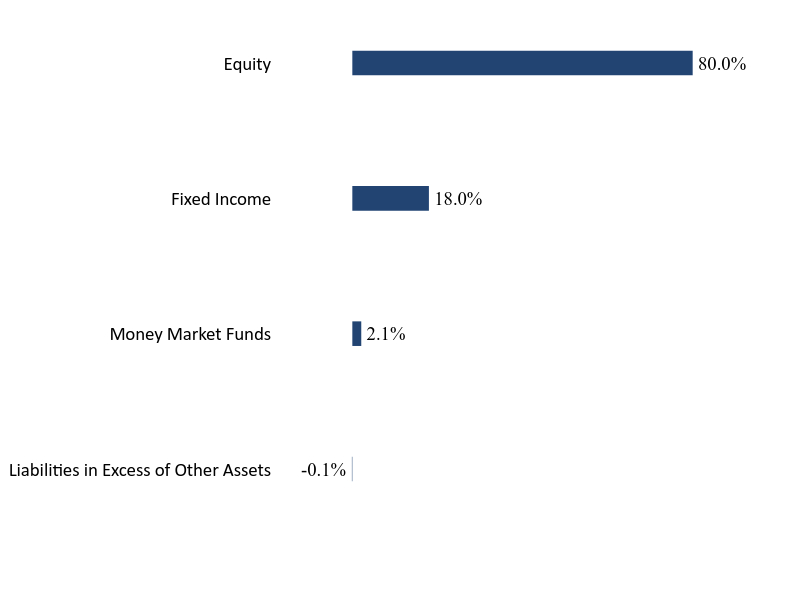
Sector Weighting (% of net assets)Value | Value |
|---|
Liabilities in Excess of Other Assets | -0.1% | Money Market Funds | 2.5% | Fixed Income | 36.5% | Equity | 61.1% |
Top 10 Holdings (% of net assets)Holding Name | % of Net Assets |
|---|
Timothy Plan Fixed Income Fund, Class A | 30.0% |
|---|
Timothy Plan Market Neutral ETF | 15.0% |
|---|
Timothy Plan US Large/Mid Cap Core Enhanced ETF | 12.2% |
|---|
Timothy Plan International Fund, Class A | 11.6% |
|---|
Timothy Plan International ETF | 9.1% |
|---|
Timothy Plan US Small Cap Core ETF | 7.1% |
|---|
Timothy Plan High Yield Bond Fund, Class A | 6.5% |
|---|
Timothy Plan High Dividend Stock Enhanced ETF | 6.1% |
|---|
Fidelity Government Portfolio, Institutional Class | 2.5% |
|---|
|
| C000012350 |
|
| Shareholder Report [Line Items] |
|
| Fund Name |
Timothy Plan Conservative Growth Fund
|
| Class Name |
Class C
|
| Trading Symbol |
TCVCX
|
| Annual or Semi-Annual Statement [Text Block] |
This annual shareholder report contains important information about Timothy Plan Conservative Growth Fund for the period of October 1, 2023 to September 30, 2024.
|
| Shareholder Report Annual or Semi-Annual |
Annual Shareholder Report
|
| Additional Information [Text Block] |
You can find additional information about the Fund at https://fund.timothyplan.com. You can also request this information by contacting us at (800) 846-7526.
|
| Additional Information Phone Number |
(800) 846-7526
|
| Additional Information Website |
https://fund.timothyplan.com
|
| Expenses [Text Block] |
What were the Fund’s costs for the last year?(based on a hypothetical $10,000 investment) Class Name | Costs of a $10,000 investment | Costs paid as a percentage of a $10,000 investment |
|---|
Class C | $150 | 1.40% |
|---|
|
| Expenses Paid, Amount |
$ 150
|
| Expense Ratio, Percent |
1.40%
|
| Performance Past Does Not Indicate Future [Text] |
The Fund's past performance is not a good predictor of how the Fund will perform in the future.
|
| Average Annual Return [Table Text Block] |
Average Annual Total Returns | 1 Year | 5 Years | 10 Years |
|---|
Timothy Plan Conservative Growth Fund | 14.14% | 2.92% | 2.11% |
|---|
Dow Jones Moderate Portfolio Index | 20.62% | 6.50% | 6.18% |
|---|
Russell 3000® Index | 35.19% | 15.26% | 12.83% |
|---|
The Fund's past performance is not a good predictor of how the Fund will perform in the future. The graph and table do not reflect the deduction of taxes that a shareholder would pay on fund distributions or redemption of fund shares. |
| No Deduction of Taxes [Text Block] |
The graph and table do not reflect the deduction of taxes that a shareholder would pay on fund distributions or redemption of fund shares.
|
| AssetsNet |
$ 38,518,717
|
| Holdings Count | Holding |
9
|
| Advisory Fees Paid, Amount |
$ 56,692
|
| InvestmentCompanyPortfolioTurnover |
4.00%
|
| Additional Fund Statistics [Text Block] |
Net Assets | $38,518,717 |
|---|
Number of Portfolio Holdings | 9 |
|---|
Advisory Fee | $56,692 |
|---|
Portfolio Turnover | 4% |
|---|
|
| Holdings [Text Block] |
Asset Weighting (% of total investments)Value | Value |
|---|
Exchange-Traded Funds | 49.4% | Money Market Funds | 2.5% | Open End Funds | 48.1% |
Sector Weighting (% of net assets)Value | Value |
|---|
Liabilities in Excess of Other Assets | -0.1% | Money Market Funds | 2.5% | Fixed Income | 36.5% | Equity | 61.1% |
Top 10 Holdings (% of net assets)Holding Name | % of Net Assets |
|---|
Timothy Plan Fixed Income Fund, Class A | 30.0% |
|---|
Timothy Plan Market Neutral ETF | 15.0% |
|---|
Timothy Plan US Large/Mid Cap Core Enhanced ETF | 12.2% |
|---|
Timothy Plan International Fund, Class A | 11.6% |
|---|
Timothy Plan International ETF | 9.1% |
|---|
Timothy Plan US Small Cap Core ETF | 7.1% |
|---|
Timothy Plan High Yield Bond Fund, Class A | 6.5% |
|---|
Timothy Plan High Dividend Stock Enhanced ETF | 6.1% |
|---|
Fidelity Government Portfolio, Institutional Class | 2.5% |
|---|
|
| C000126999 |
|
| Shareholder Report [Line Items] |
|
| Fund Name |
Timothy Plan Conservative Growth Fund
|
| Class Name |
Class I
|
| Trading Symbol |
TIICX
|
| Annual or Semi-Annual Statement [Text Block] |
This annual shareholder report contains important information about Timothy Plan Conservative Growth Fund for the period of October 1, 2023 to September 30, 2024.
|
| Shareholder Report Annual or Semi-Annual |
Annual Shareholder Report
|
| Additional Information [Text Block] |
You can find additional information about the Fund at https://fund.timothyplan.com. You can also request this information by contacting us at (800) 846-7526.
|
| Additional Information Phone Number |
(800) 846-7526
|
| Additional Information Website |
https://fund.timothyplan.com
|
| Expenses [Text Block] |
What were the Fund’s costs for the last year?(based on a hypothetical $10,000 investment) Class Name | Costs of a $10,000 investment | Costs paid as a percentage of a $10,000 investment |
|---|
Class I | $70 | 0.65% |
|---|
|
| Expenses Paid, Amount |
$ 70
|
| Expense Ratio, Percent |
0.65%
|
| Performance Past Does Not Indicate Future [Text] |
The Fund's past performance is not a good predictor of how the Fund will perform in the future.
|
| Average Annual Return [Table Text Block] |
Average Annual Total Returns | 1 Year | Since Inception (September 1, 2023) |
|---|
Timothy Plan Conservative Growth Fund | 14.49% | 10.57% |
|---|
Dow Jones Moderate Portfolio Index | 20.62% | 15.24% |
|---|
Russell 3000® Index | 35.19% | 26.04% |
|---|
The Fund's past performance is not a good predictor of how the Fund will perform in the future. The graph and table do not reflect the deduction of taxes that a shareholder would pay on fund distributions or redemption of fund shares. |
| Performance Inception Date |
Sep. 01, 2023
|
| No Deduction of Taxes [Text Block] |
The graph and table do not reflect the deduction of taxes that a shareholder would pay on fund distributions or redemption of fund shares.
|
| AssetsNet |
$ 38,518,717
|
| Holdings Count | Holding |
9
|
| Advisory Fees Paid, Amount |
$ 56,692
|
| InvestmentCompanyPortfolioTurnover |
4.00%
|
| Additional Fund Statistics [Text Block] |
Net Assets | $38,518,717 |
|---|
Number of Portfolio Holdings | 9 |
|---|
Advisory Fee | $56,692 |
|---|
Portfolio Turnover | 4% |
|---|
|
| Holdings [Text Block] |
Asset Weighting (% of total investments)Value | Value |
|---|
Exchange-Traded Funds | 49.4% | Money Market Funds | 2.5% | Open End Funds | 48.1% |
Sector Weighting (% of net assets)Value | Value |
|---|
Liabilities in Excess of Other Assets | -0.1% | Money Market Funds | 2.5% | Fixed Income | 36.5% | Equity | 61.1% |
Top 10 Holdings (% of net assets)Holding Name | % of Net Assets |
|---|
Timothy Plan Fixed Income Fund, Class A | 30.0% |
|---|
Timothy Plan Market Neutral ETF | 15.0% |
|---|
Timothy Plan US Large/Mid Cap Core Enhanced ETF | 12.2% |
|---|
Timothy Plan International Fund, Class A | 11.6% |
|---|
Timothy Plan International ETF | 9.1% |
|---|
Timothy Plan US Small Cap Core ETF | 7.1% |
|---|
Timothy Plan High Yield Bond Fund, Class A | 6.5% |
|---|
Timothy Plan High Dividend Stock Enhanced ETF | 6.1% |
|---|
Fidelity Government Portfolio, Institutional Class | 2.5% |
|---|
|
| C000080683 |
|
| Shareholder Report [Line Items] |
|
| Fund Name |
Timothy Plan Defensive Strategies Fund
|
| Class Name |
Class A
|
| Trading Symbol |
TPDAX
|
| Annual or Semi-Annual Statement [Text Block] |
This annual shareholder report contains important information about Timothy Plan Defensive Strategies Fund for the period of October 1, 2023 to September 30, 2024.
|
| Shareholder Report Annual or Semi-Annual |
Annual Shareholder Report
|
| Additional Information [Text Block] |
You can find additional information about the Fund at https://fund.timothyplan.com. You can also request this information by contacting us at (800) 846-7526.
|
| Additional Information Phone Number |
(800) 846-7526
|
| Additional Information Website |
https://fund.timothyplan.com
|
| Expenses [Text Block] |
What were the Fund’s costs for the last year?(based on a hypothetical $10,000 investment) Class Name | Costs of a $10,000 investment | Costs paid as a percentage of a $10,000 investment |
|---|
Class A | $128 | 1.19% |
|---|
|
| Expenses Paid, Amount |
$ 128
|
| Expense Ratio, Percent |
1.19%
|
| Performance Past Does Not Indicate Future [Text] |
The Fund's past performance is not a good predictor of how the Fund will perform in the future.
|
| Average Annual Return [Table Text Block] |
Average Annual Total Returns | 1 Year | 5 Years | 10 Years |
|---|
Timothy Plan Defensive Strategies Fund | | | |
|---|
Without Load | 15.92% | 6.83% | 4.08% |
|---|
With Load | 9.51% | 5.63% | 3.49% |
|---|
Russell 3000® Index | 35.19% | 15.26% | 12.83% |
|---|
33% BB USTreas1-3YR / 33% BB Comm / 34% MSCI REIT GROSS | 14.01% | 5.57% | 3.60% |
|---|
The Fund's past performance is not a good predictor of how the Fund will perform in the future. The graph and table do not reflect the deduction of taxes that a shareholder would pay on fund distributions or redemption of fund shares. |
| No Deduction of Taxes [Text Block] |
The graph and table do not reflect the deduction of taxes that a shareholder would pay on fund distributions or redemption of fund shares.
|
| AssetsNet |
$ 79,330,603
|
| Holdings Count | Holding |
198
|
| Advisory Fees Paid, Amount |
$ 330,329
|
| InvestmentCompanyPortfolioTurnover |
19.00%
|
| Additional Fund Statistics [Text Block] |
Net Assets | $79,330,603 |
|---|
Number of Portfolio Holdings | 198 |
|---|
Advisory Fee (net of waivers) | $330,329 |
|---|
Portfolio Turnover | 19% |
|---|
|
| Holdings [Text Block] |
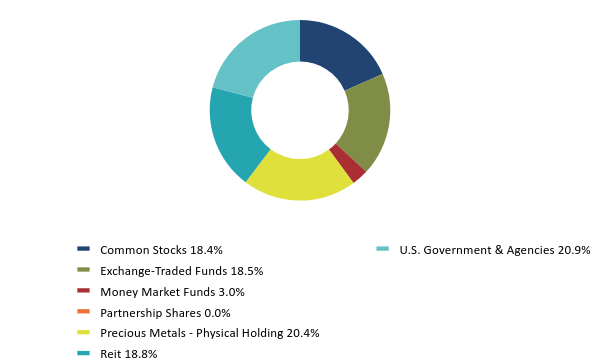
Asset Weighting (% of total investments)Value | Value |
|---|
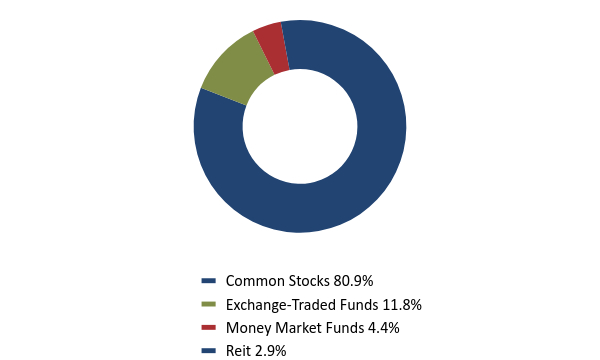
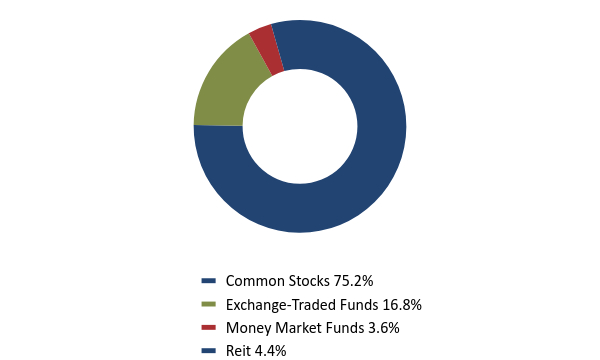
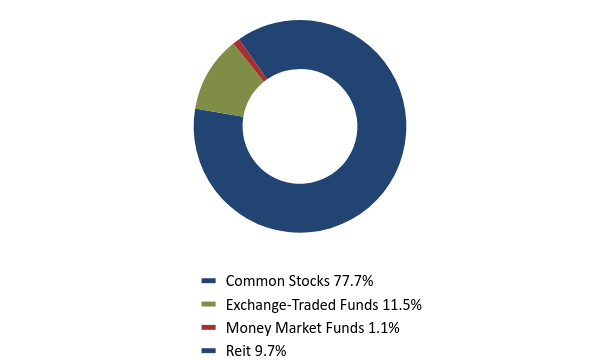
Common Stocks | 18.4% | Exchange-Traded Funds | 18.5% | Money Market Funds | 3.0% | Partnership Shares | 0.0% | Precious Metals - Physical Holding | 20.4% | Reit | 18.8% | U.S. Government & Agencies | 20.9% |
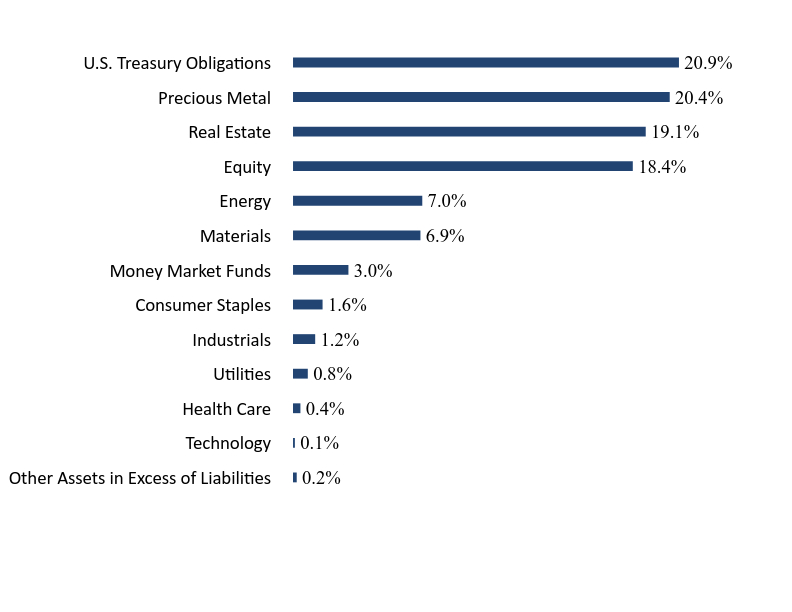
Sector Weighting (% of net assets)Value | Value |
|---|
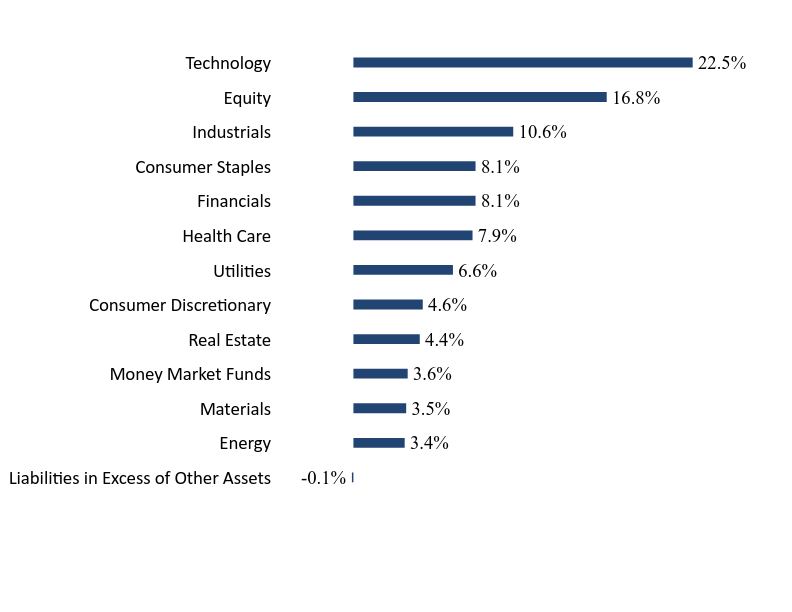
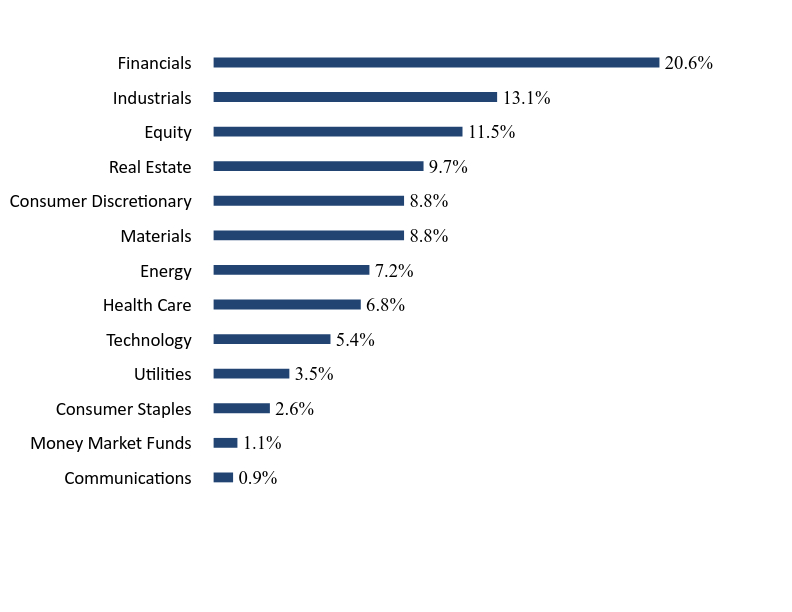
Other Assets in Excess of Liabilities | 0.2% | Technology | 0.1% | Health Care | 0.4% | Utilities | 0.8% | Industrials | 1.2% | Consumer Staples | 1.6% | Money Market Funds | 3.0% | Materials | 6.9% | Energy | 7.0% | Equity | 18.4% | Real Estate | 19.1% | Precious Metal | 20.4% | U.S. Treasury Obligations | 20.9% |
Top 10 Holdings (% of net assets)Holding Name | % of Net Assets |
|---|
GOLD BARS - XAU BGN CURNCY | 20.4% |
|---|
Timothy Plan Market Neutral ETF | 18.4% |
|---|
United States Treasury Inflation Indexed Bonds | 3.4% |
|---|
Fidelity Government Portfolio, Institutional Class | 3.0% |
|---|
United States Treasury Inflation Indexed Bonds | 2.9% |
|---|
United States Treasury Inflation Indexed Bonds | 2.9% |
|---|
United States Treasury Inflation Indexed Bonds | 2.5% |
|---|
United States Treasury Inflation Indexed Bonds | 2.2% |
|---|
United States Treasury Inflation Indexed Bonds | 2.0% |
|---|
United States Treasury Inflation Indexed Bonds | 1.9% |
|---|
|
| C000080684 |
|
| Shareholder Report [Line Items] |
|
| Fund Name |
Timothy Plan Defensive Strategies Fund
|
| Class Name |
Class C
|
| Trading Symbol |
TPDCX
|
| Annual or Semi-Annual Statement [Text Block] |
This annual shareholder report contains important information about Timothy Plan Defensive Strategies Fund for the period of October 1, 2023 to September 30, 2024.
|
| Shareholder Report Annual or Semi-Annual |
Annual Shareholder Report
|
| Additional Information [Text Block] |
You can find additional information about the Fund at https://fund.timothyplan.com. You can also request this information by contacting us at (800) 846-7526.
|
| Additional Information Phone Number |
(800) 846-7526
|
| Additional Information Website |
https://fund.timothyplan.com
|
| Expenses [Text Block] |
What were the Fund’s costs for the last year?(based on a hypothetical $10,000 investment) Class Name | Costs of a $10,000 investment | Costs paid as a percentage of a $10,000 investment |
|---|
Class C | $209 | 1.94% |
|---|
|
| Expenses Paid, Amount |
$ 209
|
| Expense Ratio, Percent |
1.94%
|
| Performance Past Does Not Indicate Future [Text] |
The Fund's past performance is not a good predictor of how the Fund will perform in the future.
|
| Average Annual Return [Table Text Block] |
Average Annual Total Returns | 1 Year | 5 Years | 10 Years |
|---|
Timothy Plan Defensive Strategies Fund | 15.13% | 6.05% | 3.30% |
|---|
33% BB USTreas1-3YR / 33% BB Comm / 34% MSCI REIT GROSS | 14.01% | 5.57% | 3.60% |
|---|
Russell 3000® Index | 35.19% | 15.26% | 12.83% |
|---|
The Fund's past performance is not a good predictor of how the Fund will perform in the future. The graph and table do not reflect the deduction of taxes that a shareholder would pay on fund distributions or redemption of fund shares. |
| No Deduction of Taxes [Text Block] |
The graph and table do not reflect the deduction of taxes that a shareholder would pay on fund distributions or redemption of fund shares.
|
| AssetsNet |
$ 79,330,603
|
| Holdings Count | Holding |
198
|
| Advisory Fees Paid, Amount |
$ 330,329
|
| InvestmentCompanyPortfolioTurnover |
19.00%
|
| Additional Fund Statistics [Text Block] |
Net Assets | $79,330,603 |
|---|
Number of Portfolio Holdings | 198 |
|---|
Advisory Fee (net of waivers) | $330,329 |
|---|
Portfolio Turnover | 19% |
|---|
|
| Holdings [Text Block] |
Asset Weighting (% of total investments)Value | Value |
|---|
Common Stocks | 18.4% | Exchange-Traded Funds | 18.5% | Money Market Funds | 3.0% | Partnership Shares | 0.0% | Precious Metals - Physical Holding | 20.4% | Reit | 18.8% | U.S. Government & Agencies | 20.9% |
Sector Weighting (% of net assets)Value | Value |
|---|
Other Assets in Excess of Liabilities | 0.2% | Technology | 0.1% | Health Care | 0.4% | Utilities | 0.8% | Industrials | 1.2% | Consumer Staples | 1.6% | Money Market Funds | 3.0% | Materials | 6.9% | Energy | 7.0% | Equity | 18.4% | Real Estate | 19.1% | Precious Metal | 20.4% | U.S. Treasury Obligations | 20.9% |
Top 10 Holdings (% of net assets)Holding Name | % of Net Assets |
|---|
GOLD BARS - XAU BGN CURNCY | 20.4% |
|---|
Timothy Plan Market Neutral ETF | 18.4% |
|---|
United States Treasury Inflation Indexed Bonds | 3.4% |
|---|
Fidelity Government Portfolio, Institutional Class | 3.0% |
|---|
United States Treasury Inflation Indexed Bonds | 2.9% |
|---|
United States Treasury Inflation Indexed Bonds | 2.9% |
|---|
United States Treasury Inflation Indexed Bonds | 2.5% |
|---|
United States Treasury Inflation Indexed Bonds | 2.2% |
|---|
United States Treasury Inflation Indexed Bonds | 2.0% |
|---|
United States Treasury Inflation Indexed Bonds | 1.9% |
|---|
|
| C000127002 |
|
| Shareholder Report [Line Items] |
|
| Fund Name |
Timothy Plan Defensive Strategies Fund
|
| Class Name |
Class I
|
| Trading Symbol |
TPDIX
|
| Annual or Semi-Annual Statement [Text Block] |
This annual shareholder report contains important information about Timothy Plan Defensive Strategies Fund for the period of October 1, 2023 to September 30, 2024.
|
| Shareholder Report Annual or Semi-Annual |
Annual Shareholder Report
|
| Additional Information [Text Block] |
You can find additional information about the Fund at https://fund.timothyplan.com. You can also request this information by contacting us at (800) 846-7526.
|
| Additional Information Phone Number |
(800) 846-7526
|
| Additional Information Website |
https://fund.timothyplan.com
|
| Expenses [Text Block] |
What were the Fund’s costs for the last year?(based on a hypothetical $10,000 investment) Class Name | Costs of a $10,000 investment | Costs paid as a percentage of a $10,000 investment |
|---|
Class I | $102 | 0.94% |
|---|
|
| Expenses Paid, Amount |
$ 102
|
| Expense Ratio, Percent |
0.94%
|
| Performance Past Does Not Indicate Future [Text] |
The Fund's past performance is not a good predictor of how the Fund will perform in the future.
|
| Average Annual Return [Table Text Block] |
Average Annual Total Returns | 1 Year | 5 Years | 10 Years |
|---|
Timothy Plan Defensive Strategies Fund | 16.20% | 7.08% | 4.34% |
|---|
33% BB USTreas1-3YR / 33% BB Comm / 34% MSCI REIT GROSS | 14.01% | 5.57% | 3.60% |
|---|
Russell 3000® Index | 35.19% | 15.26% | 12.83% |
|---|
The Fund's past performance is not a good predictor of how the Fund will perform in the future. The graph and table do not reflect the deduction of taxes that a shareholder would pay on fund distributions or redemption of fund shares. |
| No Deduction of Taxes [Text Block] |
The graph and table do not reflect the deduction of taxes that a shareholder would pay on fund distributions or redemption of fund shares.
|
| AssetsNet |
$ 79,330,603
|
| Holdings Count | Holding |
198
|
| Advisory Fees Paid, Amount |
$ 330,329
|
| InvestmentCompanyPortfolioTurnover |
19.00%
|
| Additional Fund Statistics [Text Block] |
Net Assets | $79,330,603 |
|---|
Number of Portfolio Holdings | 198 |
|---|
Advisory Fee (net of waivers) | $330,329 |
|---|
Portfolio Turnover | 19% |
|---|
|
| Holdings [Text Block] |
Asset Weighting (% of total investments)Value | Value |
|---|
Common Stocks | 18.4% | Exchange-Traded Funds | 18.5% | Money Market Funds | 3.0% | Partnership Shares | 0.0% | Precious Metals - Physical Holding | 20.4% | Reit | 18.8% | U.S. Government & Agencies | 20.9% |
Sector Weighting (% of net assets)Value | Value |
|---|
Other Assets in Excess of Liabilities | 0.2% | Technology | 0.1% | Health Care | 0.4% | Utilities | 0.8% | Industrials | 1.2% | Consumer Staples | 1.6% | Money Market Funds | 3.0% | Materials | 6.9% | Energy | 7.0% | Equity | 18.4% | Real Estate | 19.1% | Precious Metal | 20.4% | U.S. Treasury Obligations | 20.9% |
Top 10 Holdings (% of net assets)Holding Name | % of Net Assets |
|---|
GOLD BARS - XAU BGN CURNCY | 20.4% |
|---|
Timothy Plan Market Neutral ETF | 18.4% |
|---|
United States Treasury Inflation Indexed Bonds | 3.4% |
|---|
Fidelity Government Portfolio, Institutional Class | 3.0% |
|---|
United States Treasury Inflation Indexed Bonds | 2.9% |
|---|
United States Treasury Inflation Indexed Bonds | 2.9% |
|---|
United States Treasury Inflation Indexed Bonds | 2.5% |
|---|
United States Treasury Inflation Indexed Bonds | 2.2% |
|---|
United States Treasury Inflation Indexed Bonds | 2.0% |
|---|
United States Treasury Inflation Indexed Bonds | 1.9% |
|---|
|
| C000012336 |
|
| Shareholder Report [Line Items] |
|
| Fund Name |
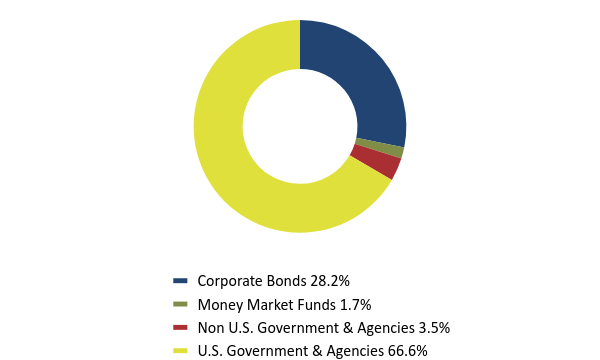
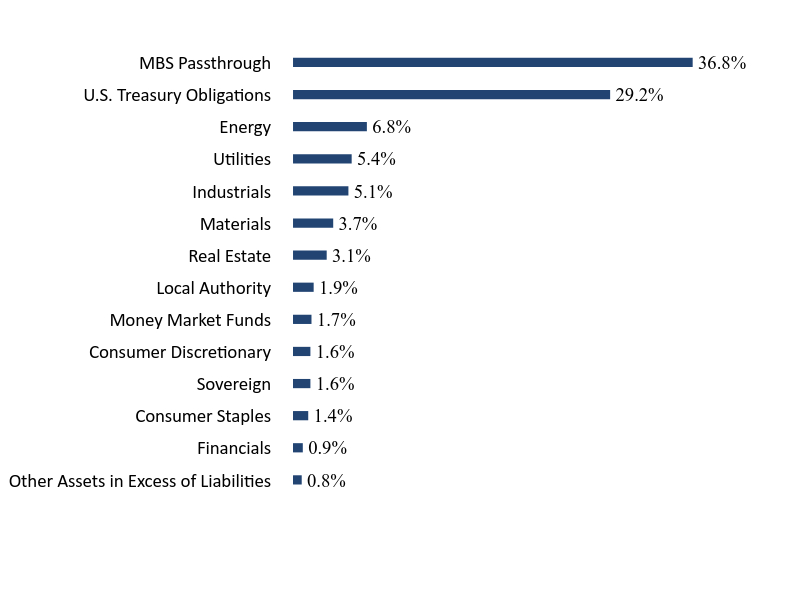
Timothy Plan Fixed Income Fund
|
| Class Name |
Class A
|
| Trading Symbol |
TFIAX
|
| Annual or Semi-Annual Statement [Text Block] |
This annual shareholder report contains important information about Timothy Plan Fixed Income Fund for the period of October 1, 2023 to September 30, 2024.
|
| Shareholder Report Annual or Semi-Annual |
Annual Shareholder Report
|
| Additional Information [Text Block] |
You can find additional information about the Fund at https://fund.timothyplan.com. You can also request this information by contacting us at (800) 846-7526.
|
| Additional Information Phone Number |
(800) 846-7526
|
| Additional Information Website |
https://fund.timothyplan.com
|
| Expenses [Text Block] |
What were the Fund’s costs for the last year?(based on a hypothetical $10,000 investment) Class Name | Costs of a $10,000 investment | Costs paid as a percentage of a $10,000 investment |
|---|
Class A | $113 | 1.07% |
|---|
|
| Expenses Paid, Amount |
$ 113
|
| Expense Ratio, Percent |
1.07%
|
| Performance Past Does Not Indicate Future [Text] |
The Fund's past performance is not a good predictor of how the Fund will perform in the future.
|
| Average Annual Return [Table Text Block] |
Average Annual Total Returns | 1 Year | 5 Years | 10 Years |
|---|
Timothy Plan Fixed Income Fund | | | |
|---|
Without Load | 10.37% | -0.45% | 0.66% |
|---|
With Load | 5.39% | -1.37% | 0.20% |
|---|
Bloomberg U.S. Aggregate Bond Index | 11.57% | 0.33% | 1.84% |
|---|
The Fund's past performance is not a good predictor of how the Fund will perform in the future. The graph and table do not reflect the deduction of taxes that a shareholder would pay on fund distributions or redemption of fund shares. |
| No Deduction of Taxes [Text Block] |
The graph and table do not reflect the deduction of taxes that a shareholder would pay on fund distributions or redemption of fund shares.
|
| AssetsNet |
$ 115,024,650
|
| Holdings Count | Holding |
105
|
| Advisory Fees Paid, Amount |
$ 446,879
|
| InvestmentCompanyPortfolioTurnover |
50.00%
|
| Additional Fund Statistics [Text Block] |
Net Assets | $115,024,650 |
|---|
Number of Portfolio Holdings | 105 |
|---|
Advisory Fee (net of waivers) | $446,879 |
|---|
Portfolio Turnover | 50% |
|---|
|
| Holdings [Text Block] |
Asset Weighting (% of total investments)Value | Value |
|---|
Corporate Bonds | 28.2% | Money Market Funds | 1.7% | Non U.S. Government & Agencies | 3.5% | U.S. Government & Agencies | 66.6% |
Sector Weighting (% of net assets)Value | Value |
|---|
Other Assets in Excess of Liabilities | 0.8% | Financials | 0.9% | Consumer Staples | 1.4% | Sovereign | 1.6% | Consumer Discretionary | 1.6% | Money Market Funds | 1.7% | Local Authority | 1.9% | Real Estate | 3.1% | Materials | 3.7% | Industrials | 5.1% | Utilities | 5.4% | Energy | 6.8% | U.S. Treasury Obligations | 29.2% | MBS Passthrough | 36.8% |
Top 10 Holdings (% of net assets)Holding Name | % of Net Assets |
|---|
United States Treasury Note, 4.375%, 05/15/34 | 8.4% |
|---|
United States Treasury Note, 4.625%, 05/15/54 | 7.9% |
|---|
United States Treasury Note, 4.625%, 04/30/29 | 4.4% |
|---|
United States Treasury Note, 4.500%, 02/15/44 | 3.1% |
|---|
United States Treasury Note, 4.875%, 04/30/26 | 2.9% |
|---|
Phillips 66 Company, 3.605%, 02/15/25 | 1.9% |
|---|
Province of Ontario Canada, 2.500%, 04/27/26 | 1.9% |
|---|
CSX Corporation, 3.250%, 06/01/27 | 1.9% |
|---|
NiSource, Inc., 3.490%, 05/15/27 | 1.9% |
|---|
American Electric Power Company, Inc., 3.200%, 11/13/27 | 1.9% |
|---|
|
| C000012338 |
|
| Shareholder Report [Line Items] |
|
| Fund Name |
Timothy Plan Fixed Income Fund
|
| Class Name |
Class C
|
| Trading Symbol |
TFICX
|
| Annual or Semi-Annual Statement [Text Block] |
This annual shareholder report contains important information about Timothy Plan Fixed Income Fund for the period of October 1, 2023 to September 30, 2024.
|
| Shareholder Report Annual or Semi-Annual |
Annual Shareholder Report
|
| Additional Information [Text Block] |
You can find additional information about the Fund at https://fund.timothyplan.com. You can also request this information by contacting us at (800) 846-7526.
|
| Additional Information Phone Number |
(800) 846-7526
|
| Additional Information Website |
https://fund.timothyplan.com
|
| Expenses [Text Block] |
What were the Fund’s costs for the last year?(based on a hypothetical $10,000 investment) Class Name | Costs of a $10,000 investment | Costs paid as a percentage of a $10,000 investment |
|---|
Class C | $191 | 1.82% |
|---|
|
| Expenses Paid, Amount |
$ 191
|
| Expense Ratio, Percent |
1.82%
|
| Performance Past Does Not Indicate Future [Text] |
The Fund's past performance is not a good predictor of how the Fund will perform in the future.
|
| Average Annual Return [Table Text Block] |
Average Annual Total Returns | 1 Year | 5 Years | 10 Years |
|---|
Timothy Plan Fixed Income Fund | 9.51% | -1.21% | -0.10% |
|---|
Bloomberg U.S. Aggregate Bond Index | 11.57% | 0.33% | 1.84% |
|---|
The Fund's past performance is not a good predictor of how the Fund will perform in the future. The graph and table do not reflect the deduction of taxes that a shareholder would pay on fund distributions or redemption of fund shares. |
| No Deduction of Taxes [Text Block] |
The graph and table do not reflect the deduction of taxes that a shareholder would pay on fund distributions or redemption of fund shares.
|
| AssetsNet |
$ 115,024,650
|
| Holdings Count | Holding |
105
|
| Advisory Fees Paid, Amount |
$ 446,879
|
| InvestmentCompanyPortfolioTurnover |
50.00%
|
| Additional Fund Statistics [Text Block] |
Net Assets | $115,024,650 |
|---|
Number of Portfolio Holdings | 105 |
|---|
Advisory Fee (net of waivers) | $446,879 |
|---|
Portfolio Turnover | 50% |
|---|
|
| Holdings [Text Block] |
Asset Weighting (% of total investments)Value | Value |
|---|
Corporate Bonds | 28.2% | Money Market Funds | 1.7% | Non U.S. Government & Agencies | 3.5% | U.S. Government & Agencies | 66.6% |
Sector Weighting (% of net assets)Value | Value |
|---|
Other Assets in Excess of Liabilities | 0.8% | Financials | 0.9% | Consumer Staples | 1.4% | Sovereign | 1.6% | Consumer Discretionary | 1.6% | Money Market Funds | 1.7% | Local Authority | 1.9% | Real Estate | 3.1% | Materials | 3.7% | Industrials | 5.1% | Utilities | 5.4% | Energy | 6.8% | U.S. Treasury Obligations | 29.2% | MBS Passthrough | 36.8% |
Top 10 Holdings (% of net assets)Holding Name | % of Net Assets |
|---|
United States Treasury Note, 4.375%, 05/15/34 | 8.4% |
|---|
United States Treasury Note, 4.625%, 05/15/54 | 7.9% |
|---|
United States Treasury Note, 4.625%, 04/30/29 | 4.4% |
|---|
United States Treasury Note, 4.500%, 02/15/44 | 3.1% |
|---|
United States Treasury Note, 4.875%, 04/30/26 | 2.9% |
|---|
Phillips 66 Company, 3.605%, 02/15/25 | 1.9% |
|---|
Province of Ontario Canada, 2.500%, 04/27/26 | 1.9% |
|---|
CSX Corporation, 3.250%, 06/01/27 | 1.9% |
|---|
NiSource, Inc., 3.490%, 05/15/27 | 1.9% |
|---|
American Electric Power Company, Inc., 3.200%, 11/13/27 | 1.9% |
|---|
|
| C000126995 |
|
| Shareholder Report [Line Items] |
|
| Fund Name |
Timothy Plan Fixed Income Fund
|
| Class Name |
Class I
|
| Trading Symbol |
TPFIX
|
| Annual or Semi-Annual Statement [Text Block] |
This annual shareholder report contains important information about Timothy Plan Fixed Income Fund for the period of October 1, 2023 to September 30, 2024.
|
| Shareholder Report Annual or Semi-Annual |
Annual Shareholder Report
|
| Additional Information [Text Block] |
You can find additional information about the Fund at https://fund.timothyplan.com. You can also request this information by contacting us at (800) 846-7526.
|
| Additional Information Phone Number |
(800) 846-7526
|
| Additional Information Website |
https://fund.timothyplan.com
|
| Expenses [Text Block] |
What were the Fund’s costs for the last year?(based on a hypothetical $10,000 investment) Class Name | Costs of a $10,000 investment | Costs paid as a percentage of a $10,000 investment |
|---|
Class I | $86 | 0.82% |
|---|
|
| Expenses Paid, Amount |
$ 86
|
| Expense Ratio, Percent |
0.82%
|
| Performance Past Does Not Indicate Future [Text] |
The Fund's past performance is not a good predictor of how the Fund will perform in the future.
|
| Average Annual Return [Table Text Block] |
Average Annual Total Returns | 1 Year | 5 Years | 10 Years |
|---|
Timothy Plan Fixed Income Fund | 10.76% | -0.21% | 0.93% |
|---|
Bloomberg U.S. Aggregate Bond Index | 11.57% | 0.33% | 1.84% |
|---|
The Fund's past performance is not a good predictor of how the Fund will perform in the future. The graph and table do not reflect the deduction of taxes that a shareholder would pay on fund distributions or redemption of fund shares. |
| No Deduction of Taxes [Text Block] |
The graph and table do not reflect the deduction of taxes that a shareholder would pay on fund distributions or redemption of fund shares.
|
| AssetsNet |
$ 115,024,650
|
| Holdings Count | Holding |
105
|
| Advisory Fees Paid, Amount |
$ 446,879
|
| InvestmentCompanyPortfolioTurnover |
50.00%
|
| Additional Fund Statistics [Text Block] |
Net Assets | $115,024,650 |
|---|
Number of Portfolio Holdings | 105 |
|---|
Advisory Fee (net of waivers) | $446,879 |
|---|
Portfolio Turnover | 50% |
|---|
|
| Holdings [Text Block] |
Asset Weighting (% of total investments)Value | Value |
|---|
Corporate Bonds | 28.2% | Money Market Funds | 1.7% | Non U.S. Government & Agencies | 3.5% | U.S. Government & Agencies | 66.6% |
Sector Weighting (% of net assets)Value | Value |
|---|
Other Assets in Excess of Liabilities | 0.8% | Financials | 0.9% | Consumer Staples | 1.4% | Sovereign | 1.6% | Consumer Discretionary | 1.6% | Money Market Funds | 1.7% | Local Authority | 1.9% | Real Estate | 3.1% | Materials | 3.7% | Industrials | 5.1% | Utilities | 5.4% | Energy | 6.8% | U.S. Treasury Obligations | 29.2% | MBS Passthrough | 36.8% |
Top 10 Holdings (% of net assets)Holding Name | % of Net Assets |
|---|
United States Treasury Note, 4.375%, 05/15/34 | 8.4% |
|---|
United States Treasury Note, 4.625%, 05/15/54 | 7.9% |
|---|
United States Treasury Note, 4.625%, 04/30/29 | 4.4% |
|---|
United States Treasury Note, 4.500%, 02/15/44 | 3.1% |
|---|
United States Treasury Note, 4.875%, 04/30/26 | 2.9% |
|---|
Phillips 66 Company, 3.605%, 02/15/25 | 1.9% |
|---|
Province of Ontario Canada, 2.500%, 04/27/26 | 1.9% |
|---|
CSX Corporation, 3.250%, 06/01/27 | 1.9% |
|---|
NiSource, Inc., 3.490%, 05/15/27 | 1.9% |
|---|
American Electric Power Company, Inc., 3.200%, 11/13/27 | 1.9% |
|---|
|
| C000130991 |
|
| Shareholder Report [Line Items] |
|
| Fund Name |
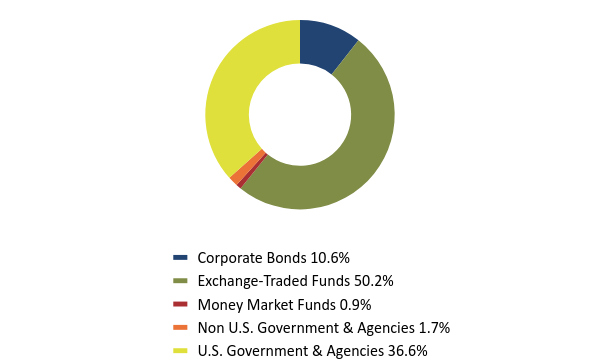
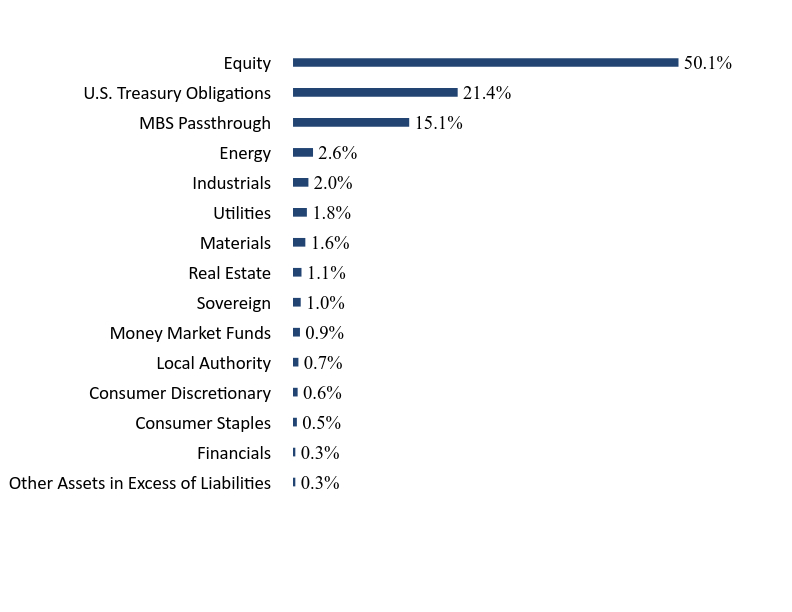
Timothy Plan Growth & Income Fund
|
| Class Name |
Class A
|
| Trading Symbol |
TGIAX
|
| Annual or Semi-Annual Statement [Text Block] |
This annual shareholder report contains important information about Timothy Plan Growth & Income Fund for the period of October 1, 2023 to September 30, 2024.
|
| Shareholder Report Annual or Semi-Annual |
Annual Shareholder Report
|
| Additional Information [Text Block] |
You can find additional information about the Fund at https://fund.timothyplan.com. You can also request this information by contacting us at (800) 846-7526.
|
| Additional Information Phone Number |
(800) 846-7526
|
| Additional Information Website |
https://fund.timothyplan.com
|
| Expenses [Text Block] |
What were the Fund’s costs for the last year?(based on a hypothetical $10,000 investment) Class Name | Costs of a $10,000 investment | Costs paid as a percentage of a $10,000 investment |
|---|
Class A | $170 | 1.59% |
|---|
|
| Expenses Paid, Amount |
$ 170
|
| Expense Ratio, Percent |
1.59%
|
| Performance Past Does Not Indicate Future [Text] |
The Fund's past performance is not a good predictor of how the Fund will perform in the future.
|
| Average Annual Return [Table Text Block] |
Average Annual Total Returns | 1 Year | 5 Years | 10 Years |
|---|
Timothy Plan Growth & Income Fund | | | |
|---|
Without Load | 13.32% | 3.46% | 1.92% |
|---|
With Load | 7.06% | 2.29% | 1.34% |
|---|
S&P 500® Index | 36.35% | 15.98% | 13.38% |
|---|
40% BB US Aggregate Bond / 60% Russell 1000 Value | 21.13% | 6.79% | 6.50% |
|---|
The Fund's past performance is not a good predictor of how the Fund will perform in the future. The graph and table do not reflect the deduction of taxes that a shareholder would pay on fund distributions or redemption of fund shares. |
| No Deduction of Taxes [Text Block] |
The graph and table do not reflect the deduction of taxes that a shareholder would pay on fund distributions or redemption of fund shares.
|
| AssetsNet |
$ 19,068,361
|
| Holdings Count | Holding |
89
|
| Advisory Fees Paid, Amount |
$ 69,131
|
| InvestmentCompanyPortfolioTurnover |
53.00%
|
| Additional Fund Statistics [Text Block] |
Net Assets | $19,068,361 |
|---|
Number of Portfolio Holdings | 89 |
|---|
Advisory Fee (net of waivers) | $69,131 |
|---|
Portfolio Turnover | 53% |
|---|
|
| Holdings [Text Block] |
Asset Weighting (% of total investments)Value | Value |
|---|
Corporate Bonds | 10.6% | Exchange-Traded Funds | 50.2% | Money Market Funds | 0.9% | Non U.S. Government & Agencies | 1.7% | U.S. Government & Agencies | 36.6% |
Sector Weighting (% of net assets)Value | Value |
|---|
Other Assets in Excess of Liabilities | 0.3% | Financials | 0.3% | Consumer Staples | 0.5% | Consumer Discretionary | 0.6% | Local Authority | 0.7% | Money Market Funds | 0.9% | Sovereign | 1.0% | Real Estate | 1.1% | Materials | 1.6% | Utilities | 1.8% | Industrials | 2.0% | Energy | 2.6% | MBS Passthrough | 15.1% | U.S. Treasury Obligations | 21.4% | Equity | 50.1% |
Top 10 Holdings (% of net assets)Holding Name | % of Net Assets |
|---|
Timothy Plan High Dividend Stock Enhanced ETF | 50.1% |
|---|
United States Treasury Note | 5.9% |
|---|
United States Treasury Note | 4.1% |
|---|
United States Treasury Note | 3.6% |
|---|
United States Treasury Note | 2.7% |
|---|
United States Treasury Note | 1.9% |
|---|
United States Treasury Note | 1.8% |
|---|
United States Treasury Note | 1.4% |
|---|
Israel Government International Bond | 1.0% |
|---|
Fidelity Government Portfolio, Institutional Class | 0.9% |
|---|
|
| C000130992 |
|
| Shareholder Report [Line Items] |
|
| Fund Name |
Timothy Plan Growth & Income Fund
|
| Class Name |
Class C
|
| Trading Symbol |
TGCIX
|
| Annual or Semi-Annual Statement [Text Block] |
This annual shareholder report contains important information about Timothy Plan Growth & Income Fund for the period of October 1, 2023 to September 30, 2024.
|
| Shareholder Report Annual or Semi-Annual |
Annual Shareholder Report
|
| Additional Information [Text Block] |
You can find additional information about the Fund at https://fund.timothyplan.com. You can also request this information by contacting us at (800) 846-7526.
|
| Additional Information Phone Number |
(800) 846-7526
|
| Additional Information Website |
https://fund.timothyplan.com
|
| Expenses [Text Block] |
What were the Fund’s costs for the last year?(based on a hypothetical $10,000 investment) Class Name | Costs of a $10,000 investment | Costs paid as a percentage of a $10,000 investment |
|---|
Class C | $249 | 2.34% |
|---|
|
| Expenses Paid, Amount |
$ 249
|
| Expense Ratio, Percent |
2.34%
|
| Performance Past Does Not Indicate Future [Text] |
The Fund's past performance is not a good predictor of how the Fund will perform in the future.
|
| Average Annual Return [Table Text Block] |
Average Annual Total Returns | 1 Year | 5 Years | 10 Years |
|---|
Timothy Plan Growth & Income Fund | 12.47% | 2.69% | 1.16% |
|---|
40% BB US Aggregate Bond / 60% Russell 1000 Value | 21.13% | 6.79% | 6.50% |
|---|
S&P 500® Index | 36.35% | 15.98% | 13.38% |
|---|
The Fund's past performance is not a good predictor of how the Fund will perform in the future. The graph and table do not reflect the deduction of taxes that a shareholder would pay on fund distributions or redemption of fund shares. |
| No Deduction of Taxes [Text Block] |
The graph and table do not reflect the deduction of taxes that a shareholder would pay on fund distributions or redemption of fund shares.
|
| AssetsNet |
$ 19,068,361
|
| Holdings Count | Holding |
89
|
| Advisory Fees Paid, Amount |
$ 69,131
|
| InvestmentCompanyPortfolioTurnover |
53.00%
|
| Additional Fund Statistics [Text Block] |
Net Assets | $19,068,361 |
|---|
Number of Portfolio Holdings | 89 |
|---|
Advisory Fee (net of waivers) | $69,131 |
|---|
Portfolio Turnover | 53% |
|---|
|
| Holdings [Text Block] |
Asset Weighting (% of total investments)Value | Value |
|---|
Corporate Bonds | 10.6% | Exchange-Traded Funds | 50.2% | Money Market Funds | 0.9% | Non U.S. Government & Agencies | 1.7% | U.S. Government & Agencies | 36.6% |
Sector Weighting (% of net assets)Value | Value |
|---|
Other Assets in Excess of Liabilities | 0.3% | Financials | 0.3% | Consumer Staples | 0.5% | Consumer Discretionary | 0.6% | Local Authority | 0.7% | Money Market Funds | 0.9% | Sovereign | 1.0% | Real Estate | 1.1% | Materials | 1.6% | Utilities | 1.8% | Industrials | 2.0% | Energy | 2.6% | MBS Passthrough | 15.1% | U.S. Treasury Obligations | 21.4% | Equity | 50.1% |
Top 10 Holdings (% of net assets)Holding Name | % of Net Assets |
|---|
Timothy Plan High Dividend Stock Enhanced ETF | 50.1% |
|---|
United States Treasury Note | 5.9% |
|---|
United States Treasury Note | 4.1% |
|---|
United States Treasury Note | 3.6% |
|---|
United States Treasury Note | 2.7% |
|---|
United States Treasury Note | 1.9% |
|---|
United States Treasury Note | 1.8% |
|---|
United States Treasury Note | 1.4% |
|---|
Israel Government International Bond | 1.0% |
|---|
Fidelity Government Portfolio, Institutional Class | 0.9% |
|---|
|
| C000130993 |
|
| Shareholder Report [Line Items] |
|
| Fund Name |
Timothy Plan Growth & Income Fund
|
| Class Name |
Class I
|
| Trading Symbol |
TIGIX
|
| Annual or Semi-Annual Statement [Text Block] |
This annual shareholder report contains important information about Timothy Plan Growth & Income Fund for the period of October 1, 2023 to September 30, 2024.
|
| Shareholder Report Annual or Semi-Annual |
Annual Shareholder Report
|
| Additional Information [Text Block] |
You can find additional information about the Fund at https://fund.timothyplan.com. You can also request this information by contacting us at (800) 846-7526.
|
| Additional Information Phone Number |
(800) 846-7526
|
| Additional Information Website |
https://fund.timothyplan.com
|
| Expenses [Text Block] |
What were the Fund’s costs for the last year?(based on a hypothetical $10,000 investment) Class Name | Costs of a $10,000 investment | Costs paid as a percentage of a $10,000 investment |
|---|
Class I | $143 | 1.34% |
|---|
|
| Expenses Paid, Amount |
$ 143
|
| Expense Ratio, Percent |
1.34%
|
| Performance Past Does Not Indicate Future [Text] |
The Fund's past performance is not a good predictor of how the Fund will perform in the future.
|
| Average Annual Return [Table Text Block] |
Average Annual Total Returns | 1 Year | 5 Years | 10 Years |
|---|
Timothy Plan Growth & Income Fund | 13.59% | 3.73% | 2.17% |
|---|
40% BB US Aggregate Bond / 60% Russell 1000 Value | 21.13% | 6.79% | 6.50% |
|---|
S&P 500® Index | 36.35% | 15.98% | 13.38% |
|---|
The Fund's past performance is not a good predictor of how the Fund will perform in the future. The graph and table do not reflect the deduction of taxes that a shareholder would pay on fund distributions or redemption of fund shares. |
| No Deduction of Taxes [Text Block] |
The graph and table do not reflect the deduction of taxes that a shareholder would pay on fund distributions or redemption of fund shares.
|
| AssetsNet |
$ 19,068,361
|
| Holdings Count | Holding |
89
|
| Advisory Fees Paid, Amount |
$ 69,131
|
| InvestmentCompanyPortfolioTurnover |
53.00%
|
| Additional Fund Statistics [Text Block] |
Net Assets | $19,068,361 |
|---|
Number of Portfolio Holdings | 89 |
|---|
Advisory Fee (net of waivers) | $69,131 |
|---|
Portfolio Turnover | 53% |
|---|
|
| Holdings [Text Block] |
Asset Weighting (% of total investments)Value | Value |
|---|
Corporate Bonds | 10.6% | Exchange-Traded Funds | 50.2% | Money Market Funds | 0.9% | Non U.S. Government & Agencies | 1.7% | U.S. Government & Agencies | 36.6% |
Sector Weighting (% of net assets)Value | Value |
|---|
Other Assets in Excess of Liabilities | 0.3% | Financials | 0.3% | Consumer Staples | 0.5% | Consumer Discretionary | 0.6% | Local Authority | 0.7% | Money Market Funds | 0.9% | Sovereign | 1.0% | Real Estate | 1.1% | Materials | 1.6% | Utilities | 1.8% | Industrials | 2.0% | Energy | 2.6% | MBS Passthrough | 15.1% | U.S. Treasury Obligations | 21.4% | Equity | 50.1% |
Top 10 Holdings (% of net assets)Holding Name | % of Net Assets |
|---|
Timothy Plan High Dividend Stock Enhanced ETF | 50.1% |
|---|
United States Treasury Note | 5.9% |
|---|
United States Treasury Note | 4.1% |
|---|
United States Treasury Note | 3.6% |
|---|
United States Treasury Note | 2.7% |
|---|
United States Treasury Note | 1.9% |
|---|
United States Treasury Note | 1.8% |
|---|
United States Treasury Note | 1.4% |
|---|
Israel Government International Bond | 1.0% |
|---|
Fidelity Government Portfolio, Institutional Class | 0.9% |
|---|
|
| C000049122 |
|
| Shareholder Report [Line Items] |
|
| Fund Name |
Timothy Plan High Yield Bond Fund
|
| Class Name |
Class A
|
| Trading Symbol |
TPHAX
|
| Annual or Semi-Annual Statement [Text Block] |
This annual shareholder report contains important information about Timothy Plan High Yield Bond Fund for the period of October 1, 2023 to September 30, 2024.
|
| Shareholder Report Annual or Semi-Annual |
Annual Shareholder Report
|
| Additional Information [Text Block] |
You can find additional information about the Fund at https://fund.timothyplan.com. You can also request this information by contacting us at (800) 846-7526.
|
| Additional Information Phone Number |
(800) 846-7526
|
| Additional Information Website |
https://fund.timothyplan.com
|
| Expenses [Text Block] |
What were the Fund’s costs for the last year?(based on a hypothetical $10,000 investment) Class Name | Costs of a $10,000 investment | Costs paid as a percentage of a $10,000 investment |
|---|
Class A | $123 | 1.14% |
|---|
|
| Expenses Paid, Amount |
$ 123
|
| Expense Ratio, Percent |
1.14%
|
| Performance Past Does Not Indicate Future [Text] |
The Fund's past performance is not a good predictor of how the Fund will perform in the future.
|
| Average Annual Return [Table Text Block] |
Average Annual Total Returns | 1 Year | 5 Years | 10 Years |
|---|
Timothy Plan High Yield Bond Fund | | | |
|---|
Without Load | 15.07% | 4.25% | 4.07% |
|---|
With Load | 9.92% | 3.30% | 3.59% |
|---|
Bloomberg U.S. High Yield Ba/B 3% Issuer Cap Index | 14.63% | 4.47% | 4.96% |
|---|
ICE BofA U.S. Broad Market Bond Index | 11.58% | 0.31% | 1.87% |
|---|
The Fund's past performance is not a good predictor of how the Fund will perform in the future. The graph and table do not reflect the deduction of taxes that a shareholder would pay on fund distributions or redemption of fund shares. |
| No Deduction of Taxes [Text Block] |
The graph and table do not reflect the deduction of taxes that a shareholder would pay on fund distributions or redemption of fund shares.
|
| AssetsNet |
$ 182,833,032
|
| Holdings Count | Holding |
144
|
| Advisory Fees Paid, Amount |
$ 882,416
|
| InvestmentCompanyPortfolioTurnover |
33.00%
|
| Additional Fund Statistics [Text Block] |
Net Assets | $182,833,032 |
|---|
Number of Portfolio Holdings | 144 |
|---|
Advisory Fee (net of waivers) | $882,416 |
|---|
Portfolio Turnover | 33% |
|---|
|
| Holdings [Text Block] |
Asset Weighting (% of total investments)Value | Value |
|---|
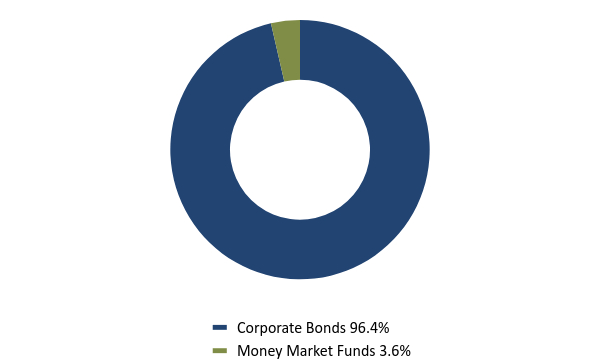
Corporate Bonds | 96.4% | Money Market Funds | 3.6% |
Sector Weighting (% of net assets)Value | Value |
|---|
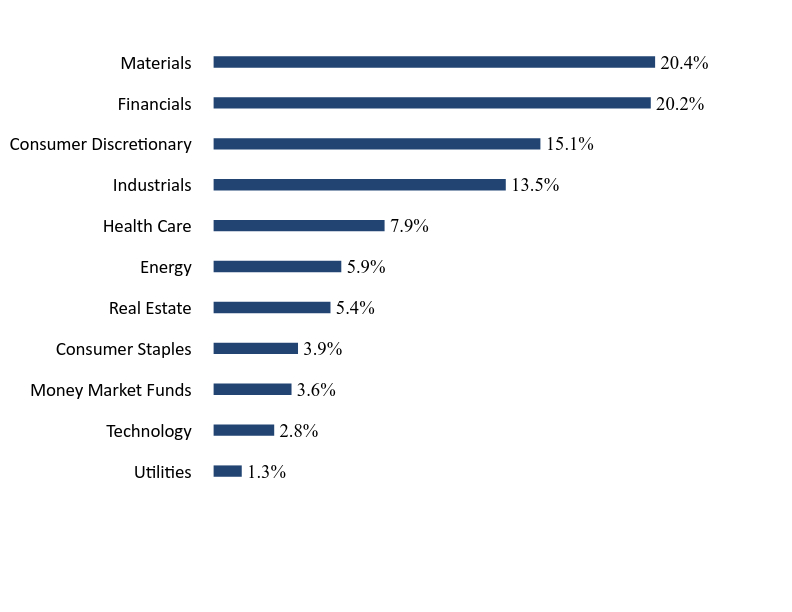
Utilities | 1.3% | Technology | 2.8% | Money Market Funds | 3.6% | Consumer Staples | 3.9% | Real Estate | 5.4% | Energy | 5.9% | Health Care | 7.9% | Industrials | 13.5% | Consumer Discretionary | 15.1% | Financials | 20.2% | Materials | 20.4% |
Top 10 Holdings (% of net assets)Holding Name | % of Net Assets |
|---|
Fidelity Government Portfolio, Institutional Class | 3.6% |
|---|
Burford Capital Global Finance, LLC | 2.2% |
|---|
Mauser Packaging Solutions Holding Company | 1.9% |
|---|
Howard Hughes Corporation (The) | 1.8% |
|---|
Enviri Corporation | 1.7% |
|---|
Ken Garff Automotive, LLC | 1.7% |
|---|
Interface, Inc. | 1.6% |
|---|
Chemours Company (The) | 1.5% |
|---|
TMS International Corporation | 1.5% |
|---|
Mativ Holdings, Inc. | 1.4% |
|---|
|
| C000065171 |
|
| Shareholder Report [Line Items] |
|
| Fund Name |
Timothy Plan High Yield Bond Fund
|
| Class Name |
Class C
|
| Trading Symbol |
TPHCX
|
| Annual or Semi-Annual Statement [Text Block] |
This annual shareholder report contains important information about Timothy Plan High Yield Bond Fund for the period of October 1, 2023 to September 30, 2024.
|
| Shareholder Report Annual or Semi-Annual |
Annual Shareholder Report
|
| Additional Information [Text Block] |
You can find additional information about the Fund at https://fund.timothyplan.com. You can also request this information by contacting us at (800) 846-7526.
|
| Additional Information Phone Number |
(800) 846-7526
|
| Additional Information Website |
https://fund.timothyplan.com
|
| Expenses [Text Block] |
What were the Fund’s costs for the last year?(based on a hypothetical $10,000 investment) Class Name | Costs of a $10,000 investment | Costs paid as a percentage of a $10,000 investment |
|---|
Class C | $202 | 1.89% |
|---|
|
| Expenses Paid, Amount |
$ 202
|
| Expense Ratio, Percent |
1.89%
|
| Performance Past Does Not Indicate Future [Text] |
The Fund's past performance is not a good predictor of how the Fund will perform in the future.
|
| Average Annual Return [Table Text Block] |
Average Annual Total Returns | 1 Year | 5 Years | 10 Years |
|---|
Timothy Plan High Yield Bond Fund | 14.14% | 3.48% | 3.29% |
|---|
Bloomberg U.S. High Yield Ba/B 3% Issuer Cap Index | 14.63% | 4.47% | 4.96% |
|---|
ICE BofA U.S. Broad Market Bond Index | 11.58% | 0.31% | 1.87% |
|---|
The Fund's past performance is not a good predictor of how the Fund will perform in the future. The graph and table do not reflect the deduction of taxes that a shareholder would pay on fund distributions or redemption of fund shares. |
| No Deduction of Taxes [Text Block] |
The graph and table do not reflect the deduction of taxes that a shareholder would pay on fund distributions or redemption of fund shares.
|
| AssetsNet |
$ 182,833,032
|
| Holdings Count | Holding |
144
|
| Advisory Fees Paid, Amount |
$ 882,416
|
| InvestmentCompanyPortfolioTurnover |
33.00%
|
| Additional Fund Statistics [Text Block] |
Net Assets | $182,833,032 |
|---|
Number of Portfolio Holdings | 144 |
|---|
Advisory Fee (net of waivers) | $882,416 |
|---|
Portfolio Turnover | 33% |
|---|
|
| Holdings [Text Block] |
Asset Weighting (% of total investments)Value | Value |
|---|
Corporate Bonds | 96.4% | Money Market Funds | 3.6% |
Sector Weighting (% of net assets)Value | Value |
|---|
Utilities | 1.3% | Technology | 2.8% | Money Market Funds | 3.6% | Consumer Staples | 3.9% | Real Estate | 5.4% | Energy | 5.9% | Health Care | 7.9% | Industrials | 13.5% | Consumer Discretionary | 15.1% | Financials | 20.2% | Materials | 20.4% |
Top 10 Holdings (% of net assets)Holding Name | % of Net Assets |
|---|
Fidelity Government Portfolio, Institutional Class | 3.6% |
|---|
Burford Capital Global Finance, LLC | 2.2% |
|---|
Mauser Packaging Solutions Holding Company | 1.9% |
|---|
Howard Hughes Corporation (The) | 1.8% |
|---|
Enviri Corporation | 1.7% |
|---|
Ken Garff Automotive, LLC | 1.7% |
|---|
Interface, Inc. | 1.6% |
|---|
Chemours Company (The) | 1.5% |
|---|
TMS International Corporation | 1.5% |
|---|
Mativ Holdings, Inc. | 1.4% |
|---|
|
| C000127001 |
|
| Shareholder Report [Line Items] |
|
| Fund Name |
Timothy Plan High Yield Bond Fund
|
| Class Name |
Class I
|
| Trading Symbol |
TPHIX
|
| Annual or Semi-Annual Statement [Text Block] |
This annual shareholder report contains important information about Timothy Plan High Yield Bond Fund for the period of October 1, 2023 to September 30, 2024.
|
| Shareholder Report Annual or Semi-Annual |
Annual Shareholder Report
|
| Additional Information [Text Block] |
You can find additional information about the Fund at https://fund.timothyplan.com. You can also request this information by contacting us at (800) 846-7526.
|
| Additional Information Phone Number |
(800) 846-7526
|
| Additional Information Website |
https://fund.timothyplan.com
|
| Expenses [Text Block] |
What were the Fund’s costs for the last year?(based on a hypothetical $10,000 investment) Class Name | Costs of a $10,000 investment | Costs paid as a percentage of a $10,000 investment |
|---|
Class I | $96 | 0.89% |
|---|
|
| Expenses Paid, Amount |
$ 96
|
| Expense Ratio, Percent |
0.89%
|
| Performance Past Does Not Indicate Future [Text] |
The Fund's past performance is not a good predictor of how the Fund will perform in the future.
|
| Average Annual Return [Table Text Block] |
Average Annual Total Returns | 1 Year | 5 Years | 10 Years |
|---|
Timothy Plan High Yield Bond Fund | 15.34% | 4.53% | 4.34% |
|---|
Bloomberg U.S. High Yield Ba/B 3% Issuer Cap Index | 14.63% | 4.47% | 4.96% |
|---|
ICE BofA U.S. Broad Market Bond Index | 11.58% | 0.31% | 1.87% |
|---|
The Fund's past performance is not a good predictor of how the Fund will perform in the future. The graph and table do not reflect the deduction of taxes that a shareholder would pay on fund distributions or redemption of fund shares. |
| No Deduction of Taxes [Text Block] |
The graph and table do not reflect the deduction of taxes that a shareholder would pay on fund distributions or redemption of fund shares.
|
| AssetsNet |
$ 182,833,032
|
| Holdings Count | Holding |
144
|
| Advisory Fees Paid, Amount |
$ 882,416
|
| InvestmentCompanyPortfolioTurnover |
33.00%
|
| Additional Fund Statistics [Text Block] |
Net Assets | $182,833,032 |
|---|
Number of Portfolio Holdings | 144 |
|---|
Advisory Fee (net of waivers) | $882,416 |
|---|
Portfolio Turnover | 33% |
|---|
|
| Holdings [Text Block] |
Asset Weighting (% of total investments)Value | Value |
|---|
Corporate Bonds | 96.4% | Money Market Funds | 3.6% |
Sector Weighting (% of net assets)Value | Value |
|---|
Utilities | 1.3% | Technology | 2.8% | Money Market Funds | 3.6% | Consumer Staples | 3.9% | Real Estate | 5.4% | Energy | 5.9% | Health Care | 7.9% | Industrials | 13.5% | Consumer Discretionary | 15.1% | Financials | 20.2% | Materials | 20.4% |
Top 10 Holdings (% of net assets)Holding Name | % of Net Assets |
|---|
Fidelity Government Portfolio, Institutional Class | 3.6% |
|---|
Burford Capital Global Finance, LLC | 2.2% |
|---|
Mauser Packaging Solutions Holding Company | 1.9% |
|---|
Howard Hughes Corporation (The) | 1.8% |
|---|
Enviri Corporation | 1.7% |
|---|
Ken Garff Automotive, LLC | 1.7% |
|---|
Interface, Inc. | 1.6% |
|---|
Chemours Company (The) | 1.5% |
|---|
TMS International Corporation | 1.5% |
|---|
Mativ Holdings, Inc. | 1.4% |
|---|
|
| C000049121 |
|
| Shareholder Report [Line Items] |
|
| Fund Name |
Timothy Plan International Fund
|
| Class Name |
Class A
|
| Trading Symbol |
TPIAX
|
| Shareholder Report Annual or Semi-Annual |
Annual Shareholder Report
|
| Material Fund Change Notice [Text Block] |
This report describes changes to the Fund that occurred during the reporting period.
|
| Additional Information Phone Number |
(800) 846-7526
|
| Additional Information Website |
https://fund.timothyplan.com
|
| Expenses [Text Block] |
What were the Fund’s costs for the last year?(based on a hypothetical $10,000 investment) Class Name | Costs of a $10,000 investment | Costs paid as a percentage of a $10,000 investment |
|---|
Class A | $180 | 1.59% |
|---|
|
| Expenses Paid, Amount |
$ 180
|
| Expense Ratio, Percent |
1.59%
|
| Performance Past Does Not Indicate Future [Text] |
The Fund's past performance is not a good predictor of how the Fund will perform in the future.
|
| Average Annual Return [Table Text Block] |
Average Annual Total Returns | 1 Year | 5 Years | 10 Years |
|---|
Timothy Plan International Fund | | | |
|---|
Without Load | 26.74% | 9.06% | 5.24% |
|---|
With Load | 19.80% | 7.83% | 4.64% |
|---|
MSCI ACWI ex USA Index | 25.35% | 7.59% | 5.22% |
|---|
The Fund's past performance is not a good predictor of how the Fund will perform in the future. The graph and table do not reflect the deduction of taxes that a shareholder would pay on fund distributions or redemption of fund shares. |
| No Deduction of Taxes [Text Block] |
The graph and table do not reflect the deduction of taxes that a shareholder would pay on fund distributions or redemption of fund shares.
|
| AssetsNet |
$ 182,644,980
|
| Holdings Count | Holding |
51
|
| Advisory Fees Paid, Amount |
$ 1,559,578
|
| InvestmentCompanyPortfolioTurnover |
18.00%
|
| Additional Fund Statistics [Text Block] |
Net Assets | $182,644,980 |
|---|
Number of Portfolio Holdings | 51 |
|---|
Advisory Fee (net of waivers) | $1,559,578 |
|---|
Portfolio Turnover | 18% |
|---|
|
| Holdings [Text Block] |
Asset Weighting (% of total investments)Value | Value |
|---|
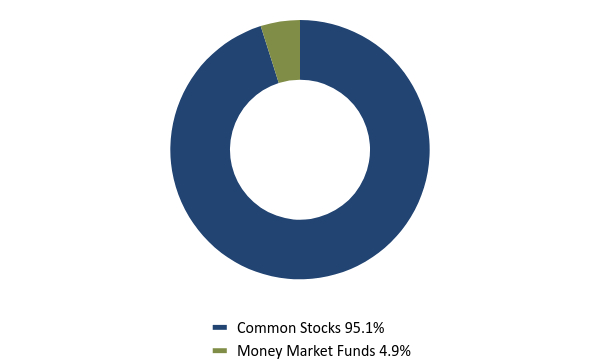
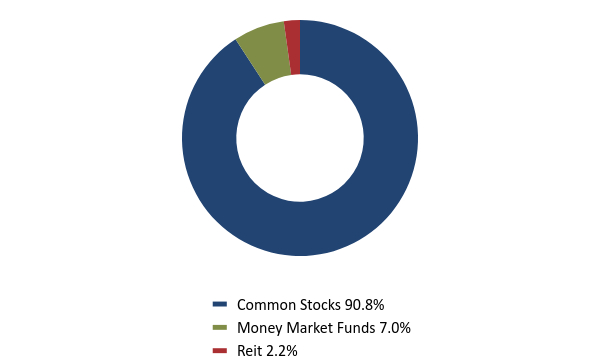
Common Stocks | 95.1% | Money Market Funds | 4.9% |
Sector Weighting (% of net assets)Value | Value |
|---|
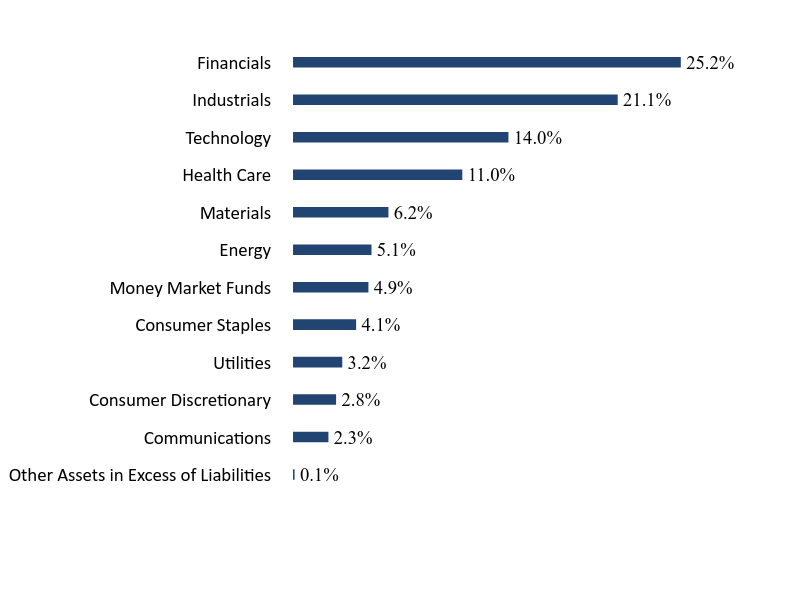
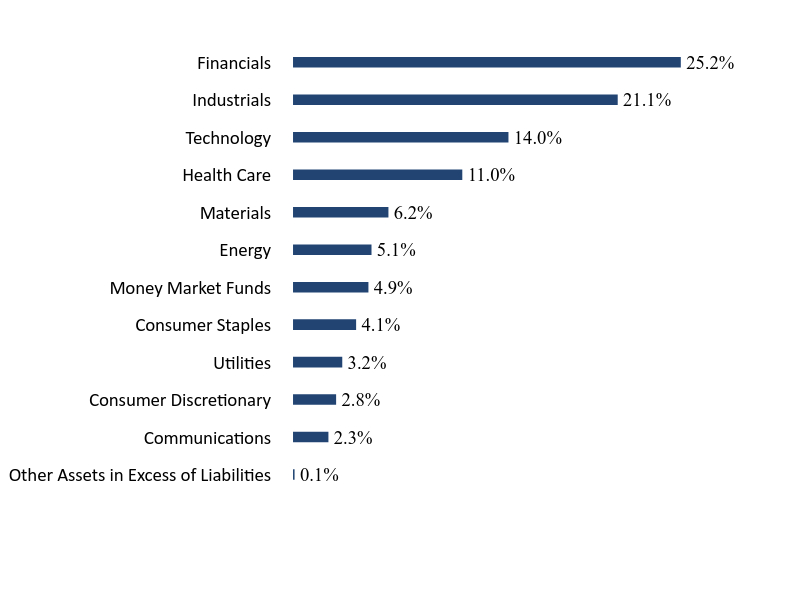
Other Assets in Excess of Liabilities | 0.1% | Communications | 2.3% | Consumer Discretionary | 2.8% | Utilities | 3.2% | Consumer Staples | 4.1% | Money Market Funds | 4.9% | Energy | 5.1% | Materials | 6.2% | Health Care | 11.0% | Technology | 14.0% | Industrials | 21.1% | Financials | 25.2% |
Top 10 Holdings (% of net assets)Holding Name | % of Net Assets |
|---|
Fidelity Government Portfolio, Institutional Class | 4.9% |
|---|
Alcon, Inc. | 3.4% |
|---|
London Stock Exchange Group plc | 3.0% |
|---|
CRH plc | 2.9% |
|---|
Canadian Pacific Kansas City Ltd. | 2.9% |
|---|
Techtronic Industries Company Ltd. | 2.8% |
|---|
ASM International N.V. | 2.7% |
|---|
Taiwan Semiconductor Manufacturing Company Ltd. | 2.7% |
|---|
Hoya Corporation | 2.7% |
|---|
Safran S.A. | 2.6% |
|---|
|
| C000065170 |
|
| Shareholder Report [Line Items] |
|
| Fund Name |
Timothy Plan International Fund
|
| Class Name |
Class C
|
| Trading Symbol |
TPICX
|
| Shareholder Report Annual or Semi-Annual |
Annual Shareholder Report
|
| Material Fund Change Notice [Text Block] |
This report describes changes to the Fund that occurred during the reporting period.
|
| Additional Information Phone Number |
(800) 846-7526
|
| Additional Information Website |
https://fund.timothyplan.com
|
| Expenses [Text Block] |
What were the Fund’s costs for the last year?(based on a hypothetical $10,000 investment) Class Name | Costs of a $10,000 investment | Costs paid as a percentage of a $10,000 investment |
|---|
Class C | $264 | 2.34% |
|---|
|
| Expenses Paid, Amount |
$ 264
|
| Expense Ratio, Percent |
2.34%
|
| Performance Past Does Not Indicate Future [Text] |
The Fund's past performance is not a good predictor of how the Fund will perform in the future.
|
| Average Annual Return [Table Text Block] |
Average Annual Total Returns | 1 Year | 5 Years | 10 Years |
|---|
Timothy Plan International Fund | 25.81% | 8.26% | 4.46% |
|---|
MSCI ACWI ex USA Index | 25.35% | 7.59% | 5.22% |
|---|
The Fund's past performance is not a good predictor of how the Fund will perform in the future. The graph and table do not reflect the deduction of taxes that a shareholder would pay on fund distributions or redemption of fund shares. |
| No Deduction of Taxes [Text Block] |
The graph and table do not reflect the deduction of taxes that a shareholder would pay on fund distributions or redemption of fund shares.
|
| AssetsNet |
$ 182,644,980
|
| Holdings Count | Holding |
51
|
| Advisory Fees Paid, Amount |
$ 1,559,578
|
| InvestmentCompanyPortfolioTurnover |
18.00%
|
| Additional Fund Statistics [Text Block] |
Net Assets | $182,644,980 |
|---|
Number of Portfolio Holdings | 51 |
|---|
Advisory Fee (net of waivers) | $1,559,578 |
|---|
Portfolio Turnover | 18% |
|---|
|
| Holdings [Text Block] |
Asset Weighting (% of total investments)Value | Value |
|---|
Common Stocks | 95.1% | Money Market Funds | 4.9% |
Sector Weighting (% of net assets)Value | Value |
|---|
Other Assets in Excess of Liabilities | 0.1% | Communications | 2.3% | Consumer Discretionary | 2.8% | Utilities | 3.2% | Consumer Staples | 4.1% | Money Market Funds | 4.9% | Energy | 5.1% | Materials | 6.2% | Health Care | 11.0% | Technology | 14.0% | Industrials | 21.1% | Financials | 25.2% |
Top 10 Holdings (% of net assets)Holding Name | % of Net Assets |
|---|
Fidelity Government Portfolio, Institutional Class | 4.9% |
|---|
Alcon, Inc. | 3.4% |
|---|
London Stock Exchange Group plc | 3.0% |
|---|
CRH plc | 2.9% |
|---|
Canadian Pacific Kansas City Ltd. | 2.9% |
|---|
Techtronic Industries Company Ltd. | 2.8% |
|---|
ASM International N.V. | 2.7% |
|---|
Taiwan Semiconductor Manufacturing Company Ltd. | 2.7% |
|---|
Hoya Corporation | 2.7% |
|---|
Safran S.A. | 2.6% |
|---|
|
| C000127000 |
|
| Shareholder Report [Line Items] |
|
| Fund Name |
Timothy Plan International Fund
|
| Class Name |
Class I
|
| Trading Symbol |
TPIIX
|
| Shareholder Report Annual or Semi-Annual |
Annual Shareholder Report
|
| Material Fund Change Notice [Text Block] |
This report describes changes to the Fund that occurred during the reporting period.
|
| Additional Information Phone Number |
(800) 846-7526
|
| Additional Information Website |
https://fund.timothyplan.com
|
| Expenses [Text Block] |
What were the Fund’s costs for the last year?(based on a hypothetical $10,000 investment) Class Name | Costs of a $10,000 investment | Costs paid as a percentage of a $10,000 investment |
|---|
Class I | $152 | 1.34% |
|---|
|
| Expenses Paid, Amount |
$ 152
|
| Expense Ratio, Percent |
1.34%
|
| Performance Past Does Not Indicate Future [Text] |
The Fund's past performance is not a good predictor of how the Fund will perform in the future.
|
| Average Annual Return [Table Text Block] |
Average Annual Total Returns | 1 Year | 5 Years | 10 Years |
|---|
Timothy Plan International Fund | 27.13% | 9.36% | 5.52% |
|---|
MSCI ACWI ex USA Index | 25.35% | 7.59% | 5.22% |
|---|
The Fund's past performance is not a good predictor of how the Fund will perform in the future. The graph and table do not reflect the deduction of taxes that a shareholder would pay on fund distributions or redemption of fund shares. |
| No Deduction of Taxes [Text Block] |
The graph and table do not reflect the deduction of taxes that a shareholder would pay on fund distributions or redemption of fund shares.
|
| AssetsNet |
$ 182,644,980
|
| Holdings Count | Holding |
51
|
| Advisory Fees Paid, Amount |
$ 1,559,578
|
| InvestmentCompanyPortfolioTurnover |
18.00%
|
| Additional Fund Statistics [Text Block] |
Net Assets | $182,644,980 |
|---|
Number of Portfolio Holdings | 51 |
|---|
Advisory Fee (net of waivers) | $1,559,578 |
|---|
Portfolio Turnover | 18% |
|---|
|
| Holdings [Text Block] |
Asset Weighting (% of total investments)Value | Value |
|---|
Common Stocks | 95.1% | Money Market Funds | 4.9% |
Sector Weighting (% of net assets)Value | Value |
|---|
Other Assets in Excess of Liabilities | 0.1% | Communications | 2.3% | Consumer Discretionary | 2.8% | Utilities | 3.2% | Consumer Staples | 4.1% | Money Market Funds | 4.9% | Energy | 5.1% | Materials | 6.2% | Health Care | 11.0% | Technology | 14.0% | Industrials | 21.1% | Financials | 25.2% |
Top 10 Holdings (% of net assets)Holding Name | % of Net Assets |
|---|
Fidelity Government Portfolio, Institutional Class | 4.9% |
|---|
Alcon, Inc. | 3.4% |
|---|
London Stock Exchange Group plc | 3.0% |
|---|
CRH plc | 2.9% |
|---|
Canadian Pacific Kansas City Ltd. | 2.9% |
|---|
Techtronic Industries Company Ltd. | 2.8% |
|---|
ASM International N.V. | 2.7% |
|---|
Taiwan Semiconductor Manufacturing Company Ltd. | 2.7% |
|---|
Hoya Corporation | 2.7% |
|---|
Safran S.A. | 2.6% |
|---|
|
| C000104306 |
|
| Shareholder Report [Line Items] |
|
| Fund Name |
Timothy Plan Israel Common Values Fund
|
| Class Name |
Class A
|
| Trading Symbol |
TPAIX
|
| Annual or Semi-Annual Statement [Text Block] |
This annual shareholder report contains important information about Timothy Plan Israel Common Values Fund for the period of October 1, 2023 to September 30, 2024.
|
| Shareholder Report Annual or Semi-Annual |
Annual Shareholder Report
|
| Additional Information [Text Block] |
You can find additional information about the Fund at https://fund.timothyplan.com. You can also request this information by contacting us at (800) 846-7526.
|
| Additional Information Phone Number |
(800) 846-7526
|
| Additional Information Website |
https://fund.timothyplan.com
|
| Expenses [Text Block] |
What were the Fund’s costs for the last year?(based on a hypothetical $10,000 investment) Class Name | Costs of a $10,000 investment | Costs paid as a percentage of a $10,000 investment |
|---|
Class A | $189 | 1.77% |
|---|
|
| Expenses Paid, Amount |
$ 189
|
| Expense Ratio, Percent |
1.77%
|
| Performance Past Does Not Indicate Future [Text] |
The Fund's past performance is not a good predictor of how the Fund will perform in the future.
|
| Average Annual Return [Table Text Block] |
Average Annual Total Returns | 1 Year | 5 Years | 10 Years |
|---|
Timothy Plan Israel Common Values Fund | | | |
|---|
Without Load | 13.75% | 4.48% | 6.46% |
|---|
With Load | 7.47% | 3.30% | 5.85% |
|---|
Israel TA-125 Index | 16.35% | 5.30% | 4.83% |
|---|
The Fund's past performance is not a good predictor of how the Fund will perform in the future. The graph and table do not reflect the deduction of taxes that a shareholder would pay on fund distributions or redemption of fund shares. |
| No Deduction of Taxes [Text Block] |
The graph and table do not reflect the deduction of taxes that a shareholder would pay on fund distributions or redemption of fund shares.
|
| AssetsNet |
$ 99,977,879
|
| Holdings Count | Holding |
57
|
| Advisory Fees Paid, Amount |
$ 979,623
|
| InvestmentCompanyPortfolioTurnover |
9.00%
|
| Additional Fund Statistics [Text Block] |
Net Assets | $99,977,879 |
|---|
Number of Portfolio Holdings | 57 |
|---|
Advisory Fee | $979,623 |
|---|
Portfolio Turnover | 9% |
|---|
|
| Holdings [Text Block] |
Asset Weighting (% of total investments)Value | Value |
|---|
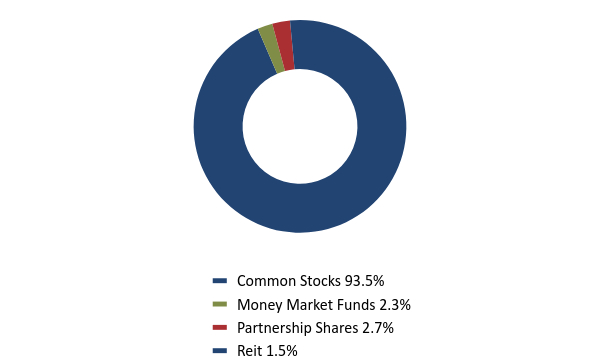
Common Stocks | 93.5% | Money Market Funds | 2.3% | Partnership Shares | 2.7% | Reit | 1.5% |
Sector Weighting (% of net assets)Value | Value |
|---|
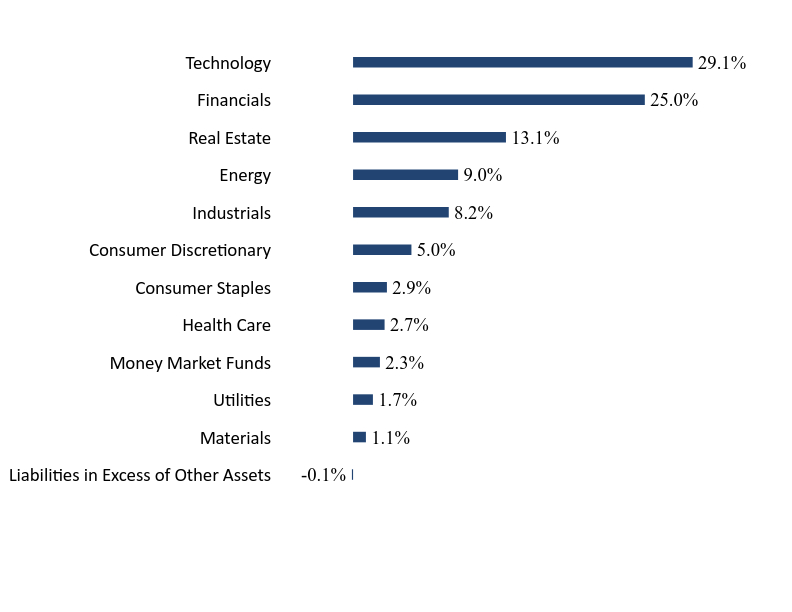
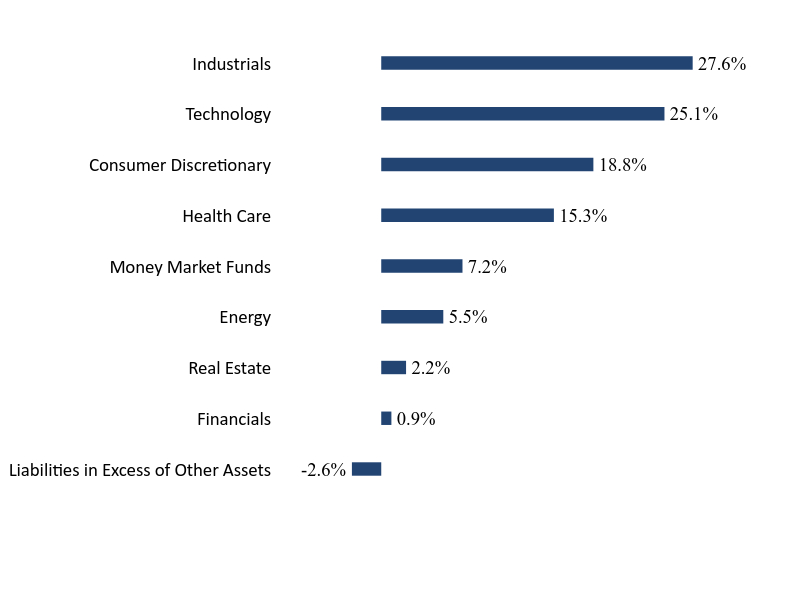
Liabilities in Excess of Other Assets | -0.1% | Materials | 1.1% | Utilities | 1.7% | Money Market Funds | 2.3% | Health Care | 2.7% | Consumer Staples | 2.9% | Consumer Discretionary | 5.0% | Industrials | 8.2% | Energy | 9.0% | Real Estate | 13.1% | Financials | 25.0% | Technology | 29.1% |
Top 10 Holdings (% of net assets)Holding Name | % of Net Assets |
|---|
Nova Ltd. | 5.0% |
|---|
Bank Leumi Le-Israel BM | 4.7% |
|---|
Bank Hapoalim BM | 4.1% |
|---|
CyberArk Software Ltd. | 4.1% |
|---|
Mizrahi Tefahot Bank Ltd. | 3.7% |
|---|
Nice Ltd. | 3.7% |
|---|
Elbit Systems Ltd. | 3.6% |
|---|
Tel Aviv Stock Exchange Ltd. | 3.5% |
|---|
Azrieli Group Ltd. | 3.1% |
|---|
Israel Discount Bank Ltd., Class A | 2.9% |
|---|
|
| C000104307 |
|
| Shareholder Report [Line Items] |
|
| Fund Name |
Timothy Plan Israel Common Values Fund
|
| Class Name |
Class C
|
| Trading Symbol |
TPCIX
|
| Annual or Semi-Annual Statement [Text Block] |
This annual shareholder report contains important information about Timothy Plan Israel Common Values Fund for the period of October 1, 2023 to September 30, 2024.
|
| Shareholder Report Annual or Semi-Annual |
Annual Shareholder Report
|
| Additional Information [Text Block] |
You can find additional information about the Fund at https://fund.timothyplan.com. You can also request this information by contacting us at (800) 846-7526.
|
| Additional Information Phone Number |
(800) 846-7526
|
| Additional Information Website |
https://fund.timothyplan.com
|
| Expenses [Text Block] |
What were the Fund’s costs for the last year?(based on a hypothetical $10,000 investment) Class Name | Costs of a $10,000 investment | Costs paid as a percentage of a $10,000 investment |
|---|
Class C | $268 | 2.52% |
|---|
|
| Expenses Paid, Amount |
$ 268
|
| Expense Ratio, Percent |
2.52%
|
| Performance Past Does Not Indicate Future [Text] |
The Fund's past performance is not a good predictor of how the Fund will perform in the future.
|
| Average Annual Return [Table Text Block] |
Average Annual Total Returns | 1 Year | 5 Years | 10 Years |
|---|
Timothy Plan Israel Common Values Fund | 12.85% | 3.70% | 5.66% |
|---|
Israel TA-125 Index | 16.35% | 5.30% | 4.83% |
|---|
The Fund's past performance is not a good predictor of how the Fund will perform in the future. The graph and table do not reflect the deduction of taxes that a shareholder would pay on fund distributions or redemption of fund shares. |
| No Deduction of Taxes [Text Block] |
The graph and table do not reflect the deduction of taxes that a shareholder would pay on fund distributions or redemption of fund shares.
|
| AssetsNet |
$ 99,977,879
|
| Holdings Count | Holding |
57
|
| Advisory Fees Paid, Amount |
$ 979,623
|
| InvestmentCompanyPortfolioTurnover |
9.00%
|
| Additional Fund Statistics [Text Block] |
Net Assets | $99,977,879 |
|---|
Number of Portfolio Holdings | 57 |
|---|
Advisory Fee | $979,623 |
|---|
Portfolio Turnover | 9% |
|---|
|
| Holdings [Text Block] |
Asset Weighting (% of total investments)Value | Value |
|---|
Common Stocks | 93.5% | Money Market Funds | 2.3% | Partnership Shares | 2.7% | Reit | 1.5% |
Sector Weighting (% of net assets)Value | Value |
|---|
Liabilities in Excess of Other Assets | -0.1% | Materials | 1.1% | Utilities | 1.7% | Money Market Funds | 2.3% | Health Care | 2.7% | Consumer Staples | 2.9% | Consumer Discretionary | 5.0% | Industrials | 8.2% | Energy | 9.0% | Real Estate | 13.1% | Financials | 25.0% | Technology | 29.1% |
Top 10 Holdings (% of net assets)Holding Name | % of Net Assets |
|---|
Nova Ltd. | 5.0% |
|---|
Bank Leumi Le-Israel BM | 4.7% |
|---|
Bank Hapoalim BM | 4.1% |
|---|
CyberArk Software Ltd. | 4.1% |
|---|
Mizrahi Tefahot Bank Ltd. | 3.7% |
|---|
Nice Ltd. | 3.7% |
|---|
Elbit Systems Ltd. | 3.6% |
|---|
Tel Aviv Stock Exchange Ltd. | 3.5% |
|---|
Azrieli Group Ltd. | 3.1% |
|---|
Israel Discount Bank Ltd., Class A | 2.9% |
|---|
|
| C000127003 |
|
| Shareholder Report [Line Items] |
|
| Fund Name |
Timothy Plan Israel Common Values Fund
|
| Class Name |
Class I
|
| Trading Symbol |
TICIX
|
| Annual or Semi-Annual Statement [Text Block] |
This annual shareholder report contains important information about Timothy Plan Israel Common Values Fund for the period of October 1, 2023 to September 30, 2024.
|
| Shareholder Report Annual or Semi-Annual |
Annual Shareholder Report
|
| Additional Information [Text Block] |
You can find additional information about the Fund at https://fund.timothyplan.com. You can also request this information by contacting us at (800) 846-7526.
|
| Additional Information Phone Number |
(800) 846-7526
|
| Additional Information Website |
https://fund.timothyplan.com
|
| Expenses [Text Block] |
What were the Fund’s costs for the last year?(based on a hypothetical $10,000 investment) Class Name | Costs of a $10,000 investment | Costs paid as a percentage of a $10,000 investment |
|---|
Class I | $163 | 1.52% |
|---|
|
| Expenses Paid, Amount |
$ 163
|
| Expense Ratio, Percent |
1.52%
|
| Performance Past Does Not Indicate Future [Text] |
The Fund's past performance is not a good predictor of how the Fund will perform in the future.
|
| Average Annual Return [Table Text Block] |
Average Annual Total Returns | 1 Year | 5 Years | 10 Years |
|---|
Timothy Plan Israel Common Values Fund | 14.00% | 4.74% | 6.73% |
|---|
Israel TA-125 Index | 16.35% | 5.30% | 4.83% |
|---|
The Fund's past performance is not a good predictor of how the Fund will perform in the future. The graph and table do not reflect the deduction of taxes that a shareholder would pay on fund distributions or redemption of fund shares. |
| No Deduction of Taxes [Text Block] |
The graph and table do not reflect the deduction of taxes that a shareholder would pay on fund distributions or redemption of fund shares.
|
| AssetsNet |
$ 99,977,879
|
| Holdings Count | Holding |
57
|
| Advisory Fees Paid, Amount |
$ 979,623
|
| InvestmentCompanyPortfolioTurnover |
9.00%
|
| Additional Fund Statistics [Text Block] |
Net Assets | $99,977,879 |
|---|
Number of Portfolio Holdings | 57 |
|---|
Advisory Fee | $979,623 |
|---|
Portfolio Turnover | 9% |
|---|
|
| Holdings [Text Block] |
Asset Weighting (% of total investments)Value | Value |
|---|
Common Stocks | 93.5% | Money Market Funds | 2.3% | Partnership Shares | 2.7% | Reit | 1.5% |
Sector Weighting (% of net assets)Value | Value |
|---|
Liabilities in Excess of Other Assets | -0.1% | Materials | 1.1% | Utilities | 1.7% | Money Market Funds | 2.3% | Health Care | 2.7% | Consumer Staples | 2.9% | Consumer Discretionary | 5.0% | Industrials | 8.2% | Energy | 9.0% | Real Estate | 13.1% | Financials | 25.0% | Technology | 29.1% |
Top 10 Holdings (% of net assets)Holding Name | % of Net Assets |
|---|
Nova Ltd. | 5.0% |
|---|
Bank Leumi Le-Israel BM | 4.7% |
|---|
Bank Hapoalim BM | 4.1% |
|---|
CyberArk Software Ltd. | 4.1% |
|---|
Mizrahi Tefahot Bank Ltd. | 3.7% |
|---|
Nice Ltd. | 3.7% |
|---|
Elbit Systems Ltd. | 3.6% |
|---|
Tel Aviv Stock Exchange Ltd. | 3.5% |
|---|
Azrieli Group Ltd. | 3.1% |
|---|
Israel Discount Bank Ltd., Class A | 2.9% |
|---|
|
| C000012342 |
|
| Shareholder Report [Line Items] |
|
| Fund Name |
Timothy Plan Large/Mid Cap Growth Fund
|
| Class Name |
Class A
|
| Trading Symbol |
TLGAX
|
| Annual or Semi-Annual Statement [Text Block] |
This annual shareholder report contains important information about Timothy Plan Large/Mid Cap Growth Fund for the period of October 1, 2023 to September 30, 2024.
|
| Shareholder Report Annual or Semi-Annual |
Annual Shareholder Report
|
| Additional Information [Text Block] |
You can find additional information about the Fund at https://fund.timothyplan.com. You can also request this information by contacting us at (800) 846-7526.
|
| Additional Information Phone Number |
(800) 846-7526
|
| Additional Information Website |
https://fund.timothyplan.com
|
| Expenses [Text Block] |
What were the Fund’s costs for the last year?(based on a hypothetical $10,000 investment) Class Name | Costs of a $10,000 investment | Costs paid as a percentage of a $10,000 investment |
|---|
Class A | $150 | 1.27% |
|---|
|
| Expenses Paid, Amount |
$ 150
|
| Expense Ratio, Percent |
1.27%
|
| Performance Past Does Not Indicate Future [Text] |
The Fund's past performance is not a good predictor of how the Fund will perform in the future.
|
| Average Annual Return [Table Text Block] |
Average Annual Total Returns | 1 Year | 5 Years | 10 Years |
|---|
Timothy Plan Large/Mid Cap Growth Fund | | | |
|---|
Without Load | 36.13% | 15.08% | 10.63% |
|---|
With Load | 28.61% | 13.78% | 10.01% |
|---|
Russell 1000® Growth Index | 42.19% | 19.74% | 16.52% |
|---|
Russell 1000® Index | 35.68% | 15.64% | 13.10% |
|---|
The Fund's past performance is not a good predictor of how the Fund will perform in the future. The graph and table do not reflect the deduction of taxes that a shareholder would pay on fund distributions or redemption of fund shares. |
| No Deduction of Taxes [Text Block] |
The graph and table do not reflect the deduction of taxes that a shareholder would pay on fund distributions or redemption of fund shares.
|
| AssetsNet |
$ 216,606,938
|
| Holdings Count | Holding |
53
|
| Advisory Fees Paid, Amount |
$ 1,295,172
|
| InvestmentCompanyPortfolioTurnover |
53.00%
|
| Additional Fund Statistics [Text Block] |
Net Assets | $216,606,938 |
|---|
Number of Portfolio Holdings | 53 |
|---|
Advisory Fee (net of waivers) | $1,295,172 |
|---|
Portfolio Turnover | 53% |
|---|
|
| Holdings [Text Block] |
Asset Weighting (% of total investments)Value | Value |
|---|
Common Stocks | 80.9% | Exchange-Traded Funds | 11.8% | Money Market Funds | 4.4% | Reit | 2.9% |
Sector Weighting (% of net assets)Value | Value |
|---|
Liabilities in Excess of Other Assets | -0.1% | Real Estate | 3.0% | Consumer Staples | 4.0% | Financials | 4.2% | Money Market Funds | 4.4% | Materials | 5.5% | Consumer Discretionary | 7.4% | Industrials | 10.8% | Health Care | 11.6% | Equity | 11.8% | Technology | 37.4% |
Top 10 Holdings (% of net assets)Holding Name | % of Net Assets |
|---|
Timothy Plan US Large/Mid Cap Core Enhanced ETF | 9.6% |
|---|
NVIDIA Corporation | 9.6% |
|---|
Fidelity Government Portfolio, Institutional Class | 4.4% |
|---|
Costco Wholesale Corporation | 4.0% |
|---|
Broadcom, Inc. | 3.2% |
|---|
ServiceNow, Inc. | 3.2% |
|---|
Tesla, Inc. | 2.7% |
|---|
Arthur J Gallagher & Company | 2.7% |
|---|
Linde plc | 2.6% |
|---|
Stryker Corporation | 2.4% |
|---|
|
| C000012344 |
|
| Shareholder Report [Line Items] |
|
| Fund Name |
Timothy Plan Large/Mid Cap Growth Fund
|
| Class Name |
Class C
|
| Trading Symbol |
TLGCX
|
| Annual or Semi-Annual Statement [Text Block] |
This annual shareholder report contains important information about Timothy Plan Large/Mid Cap Growth Fund for the period of October 1, 2023 to September 30, 2024.
|
| Shareholder Report Annual or Semi-Annual |
Annual Shareholder Report
|
| Additional Information [Text Block] |
You can find additional information about the Fund at https://fund.timothyplan.com. You can also request this information by contacting us at (800) 846-7526.
|
| Additional Information Phone Number |
(800) 846-7526
|
| Additional Information Website |
https://fund.timothyplan.com
|
| Expenses [Text Block] |
What were the Fund’s costs for the last year?(based on a hypothetical $10,000 investment) Class Name | Costs of a $10,000 investment | Costs paid as a percentage of a $10,000 investment |
|---|
Class C | $237 | 2.02% |
|---|
|
| Expenses Paid, Amount |
$ 237
|
| Expense Ratio, Percent |
2.02%
|
| Performance Past Does Not Indicate Future [Text] |
The Fund's past performance is not a good predictor of how the Fund will perform in the future.
|
| Average Annual Return [Table Text Block] |
Average Annual Total Returns | 1 Year | 5 Years | 10 Years |
|---|
Timothy Plan Large/Mid Cap Growth Fund | 35.14% | 14.22% | 9.80% |
|---|
Russell 1000® Growth Index | 42.19% | 19.74% | 16.52% |
|---|
Russell 1000® Index | 35.68% | 15.64% | 13.10% |
|---|
The Fund's past performance is not a good predictor of how the Fund will perform in the future. The graph and table do not reflect the deduction of taxes that a shareholder would pay on fund distributions or redemption of fund shares. |
| No Deduction of Taxes [Text Block] |
The graph and table do not reflect the deduction of taxes that a shareholder would pay on fund distributions or redemption of fund shares.
|
| AssetsNet |
$ 216,606,938
|
| Holdings Count | Holding |
53
|
| Advisory Fees Paid, Amount |
$ 1,295,172
|
| InvestmentCompanyPortfolioTurnover |
53.00%
|
| Additional Fund Statistics [Text Block] |
Net Assets | $216,606,938 |
|---|
Number of Portfolio Holdings | 53 |
|---|
Advisory Fee (net of waivers) | $1,295,172 |
|---|
Portfolio Turnover | 53% |
|---|
|
| Holdings [Text Block] |
Asset Weighting (% of total investments)Value | Value |
|---|
Common Stocks | 80.9% | Exchange-Traded Funds | 11.8% | Money Market Funds | 4.4% | Reit | 2.9% |
Sector Weighting (% of net assets)Value | Value |
|---|
Liabilities in Excess of Other Assets | -0.1% | Real Estate | 3.0% | Consumer Staples | 4.0% | Financials | 4.2% | Money Market Funds | 4.4% | Materials | 5.5% | Consumer Discretionary | 7.4% | Industrials | 10.8% | Health Care | 11.6% | Equity | 11.8% | Technology | 37.4% |
Top 10 Holdings (% of net assets)Holding Name | % of Net Assets |
|---|
Timothy Plan US Large/Mid Cap Core Enhanced ETF | 9.6% |
|---|
NVIDIA Corporation | 9.6% |
|---|
Fidelity Government Portfolio, Institutional Class | 4.4% |
|---|
Costco Wholesale Corporation | 4.0% |
|---|
Broadcom, Inc. | 3.2% |
|---|
ServiceNow, Inc. | 3.2% |
|---|
Tesla, Inc. | 2.7% |
|---|
Arthur J Gallagher & Company | 2.7% |
|---|
Linde plc | 2.6% |
|---|
Stryker Corporation | 2.4% |
|---|
|
| C000126997 |
|
| Shareholder Report [Line Items] |
|
| Fund Name |
Timothy Plan Large/Mid Cap Growth Fund
|
| Class Name |
Class I
|
| Trading Symbol |
TPLIX
|
| Annual or Semi-Annual Statement [Text Block] |
This annual shareholder report contains important information about Timothy Plan Large/Mid Cap Growth Fund for the period of October 1, 2023 to September 30, 2024.
|
| Shareholder Report Annual or Semi-Annual |
Annual Shareholder Report
|
| Additional Information [Text Block] |
You can find additional information about the Fund at https://fund.timothyplan.com. You can also request this information by contacting us at (800) 846-7526.
|
| Additional Information Phone Number |
(800) 846-7526
|
| Additional Information Website |
https://fund.timothyplan.com
|
| Expenses [Text Block] |
What were the Fund’s costs for the last year?(based on a hypothetical $10,000 investment) Class Name | Costs of a $10,000 investment | Costs paid as a percentage of a $10,000 investment |
|---|
Class I | $121 | 1.02% |
|---|
|
| Expenses Paid, Amount |
$ 121
|
| Expense Ratio, Percent |
1.02%
|
| Performance Past Does Not Indicate Future [Text] |
The Fund's past performance is not a good predictor of how the Fund will perform in the future.
|
| Average Annual Return [Table Text Block] |
Average Annual Total Returns | 1 Year | 5 Years | 10 Years |
|---|
Timothy Plan Large/Mid Cap Growth Fund | 36.49% | 15.38% | 10.90% |
|---|
Russell 1000® Growth Index | 42.19% | 19.74% | 16.52% |
|---|
Russell 1000® Index | 35.68% | 15.64% | 13.10% |
|---|
The Fund's past performance is not a good predictor of how the Fund will perform in the future. The graph and table do not reflect the deduction of taxes that a shareholder would pay on fund distributions or redemption of fund shares. |
| No Deduction of Taxes [Text Block] |
The graph and table do not reflect the deduction of taxes that a shareholder would pay on fund distributions or redemption of fund shares.
|
| AssetsNet |
$ 216,606,938
|
| Holdings Count | Holding |
53
|
| Advisory Fees Paid, Amount |
$ 1,295,172
|
| InvestmentCompanyPortfolioTurnover |
53.00%
|
| Additional Fund Statistics [Text Block] |
Net Assets | $216,606,938 |
|---|
Number of Portfolio Holdings | 53 |
|---|
Advisory Fee (net of waivers) | $1,295,172 |
|---|
Portfolio Turnover | 53% |
|---|
|
| Holdings [Text Block] |
Asset Weighting (% of total investments)Value | Value |
|---|
Common Stocks | 80.9% | Exchange-Traded Funds | 11.8% | Money Market Funds | 4.4% | Reit | 2.9% |
Sector Weighting (% of net assets)Value | Value |
|---|
Liabilities in Excess of Other Assets | -0.1% | Real Estate | 3.0% | Consumer Staples | 4.0% | Financials | 4.2% | Money Market Funds | 4.4% | Materials | 5.5% | Consumer Discretionary | 7.4% | Industrials | 10.8% | Health Care | 11.6% | Equity | 11.8% | Technology | 37.4% |
Top 10 Holdings (% of net assets)Holding Name | % of Net Assets |
|---|
Timothy Plan US Large/Mid Cap Core Enhanced ETF | 9.6% |
|---|
NVIDIA Corporation | 9.6% |
|---|
Fidelity Government Portfolio, Institutional Class | 4.4% |
|---|
Costco Wholesale Corporation | 4.0% |
|---|
Broadcom, Inc. | 3.2% |
|---|
ServiceNow, Inc. | 3.2% |
|---|
Tesla, Inc. | 2.7% |
|---|
Arthur J Gallagher & Company | 2.7% |
|---|
Linde plc | 2.6% |
|---|
Stryker Corporation | 2.4% |
|---|
|
| C000012333 |
|
| Shareholder Report [Line Items] |
|
| Fund Name |
Timothy Plan Large/Mid Cap Value Fund
|
| Class Name |
Class A
|
| Trading Symbol |
TLVAX
|
| Annual or Semi-Annual Statement [Text Block] |
This annual shareholder report contains important information about Timothy Plan Large/Mid Cap Value Fund for the period of October 1, 2023 to September 30, 2024.
|
| Shareholder Report Annual or Semi-Annual |
Annual Shareholder Report
|
| Additional Information [Text Block] |
You can find additional information about the Fund at https://fund.timothyplan.com. You can also request this information by contacting us at (800) 846-7526.
|
| Additional Information Phone Number |
(800) 846-7526
|
| Additional Information Website |
https://fund.timothyplan.com
|
| Expenses [Text Block] |
What were the Fund’s costs for the last year?(based on a hypothetical $10,000 investment) Class Name | Costs of a $10,000 investment | Costs paid as a percentage of a $10,000 investment |
|---|
Class A | $136 | 1.19% |
|---|
|
| Expenses Paid, Amount |
$ 136
|
| Expense Ratio, Percent |
1.19%
|
| Performance Past Does Not Indicate Future [Text] |
The Fund's past performance is not a good predictor of how the Fund will perform in the future.
|
| Average Annual Return [Table Text Block] |
Average Annual Total Returns | 1 Year | 5 Years | 10 Years |
|---|
Timothy Plan Large/Mid Cap Value Fund | | | |
|---|
Without Load | 28.18% | 12.23% | 9.75% |
|---|
With Load | 21.13% | 10.97% | 9.13% |
|---|
S&P 500® Index | 36.35% | 15.98% | 13.38% |
|---|
The Fund's past performance is not a good predictor of how the Fund will perform in the future. The graph and table do not reflect the deduction of taxes that a shareholder would pay on fund distributions or redemption of fund shares. |
| No Deduction of Taxes [Text Block] |
The graph and table do not reflect the deduction of taxes that a shareholder would pay on fund distributions or redemption of fund shares.
|
| AssetsNet |
$ 354,857,874
|
| Holdings Count | Holding |
44
|
| Advisory Fees Paid, Amount |
$ 2,036,126
|
| InvestmentCompanyPortfolioTurnover |
34.00%
|
| Additional Fund Statistics [Text Block] |
Net Assets | $354,857,874 |
|---|
Number of Portfolio Holdings | 44 |
|---|
Advisory Fee (net of waivers) | $2,036,126 |
|---|
Portfolio Turnover | 34% |
|---|
|
| Holdings [Text Block] |
Asset Weighting (% of total investments)Value | Value |
|---|
Common Stocks | 75.2% | Exchange-Traded Funds | 16.8% | Money Market Funds | 3.6% | Reit | 4.4% |
Sector Weighting (% of net assets)Value | Value |
|---|
Liabilities in Excess of Other Assets | -0.1% | Energy | 3.4% | Materials | 3.5% | Money Market Funds | 3.6% | Real Estate | 4.4% | Consumer Discretionary | 4.6% | Utilities | 6.6% | Health Care | 7.9% | Financials | 8.1% | Consumer Staples | 8.1% | Industrials | 10.6% | Equity | 16.8% | Technology | 22.5% |
Top 10 Holdings (% of net assets)Holding Name | % of Net Assets |
|---|
Timothy Plan US Large/Mid Cap Core Enhanced ETF | 7.1% |
|---|
Timothy Plan High Dividend Stock Enhanced ETF | 6.3% |
|---|
Fidelity Government Portfolio, Institutional Class | 3.6% |
|---|
Monolithic Power Systems, Inc. | 2.7% |
|---|
O'Reilly Automotive, Inc. | 2.6% |
|---|
CACI International, Inc., Class A | 2.5% |
|---|
WEC Energy Group, Inc. | 2.4% |
|---|
Arthur J Gallagher & Company | 2.4% |
|---|
McCormick & Company, Inc. | 2.4% |
|---|
Hubbell, Inc. | 2.3% |
|---|
|
| C000012335 |
|
| Shareholder Report [Line Items] |
|
| Fund Name |
Timothy Plan Large/Mid Cap Value Fund
|
| Class Name |
Class C
|
| Trading Symbol |
TLVCX
|
| Annual or Semi-Annual Statement [Text Block] |
This annual shareholder report contains important information about Timothy Plan Large/Mid Cap Value Fund for the period of October 1, 2023 to September 30, 2024.
|
| Shareholder Report Annual or Semi-Annual |
Annual Shareholder Report
|
| Additional Information [Text Block] |
You can find additional information about the Fund at https://fund.timothyplan.com. You can also request this information by contacting us at (800) 846-7526.
|
| Additional Information Phone Number |
(800) 846-7526
|
| Additional Information Website |
https://fund.timothyplan.com
|
| Expenses [Text Block] |
What were the Fund’s costs for the last year?(based on a hypothetical $10,000 investment) Class Name | Costs of a $10,000 investment | Costs paid as a percentage of a $10,000 investment |
|---|
Class C | $220 | 1.94% |
|---|
|
| Expenses Paid, Amount |
$ 220
|
| Expense Ratio, Percent |
1.94%
|
| Performance Past Does Not Indicate Future [Text] |
The Fund's past performance is not a good predictor of how the Fund will perform in the future.
|
| Average Annual Return [Table Text Block] |
Average Annual Total Returns | 1 Year | 5 Years | 10 Years |
|---|
Timothy Plan Large/Mid Cap Value Fund | 27.23% | 11.39% | 8.93% |
|---|
S&P 500® Index | 36.35% | 15.98% | 13.38% |
|---|
The Fund's past performance is not a good predictor of how the Fund will perform in the future. The graph and table do not reflect the deduction of taxes that a shareholder would pay on fund distributions or redemption of fund shares. |
| No Deduction of Taxes [Text Block] |
The graph and table do not reflect the deduction of taxes that a shareholder would pay on fund distributions or redemption of fund shares.
|
| AssetsNet |
$ 354,857,874
|
| Holdings Count | Holding |
44
|
| Advisory Fees Paid, Amount |
$ 2,036,126
|
| InvestmentCompanyPortfolioTurnover |
34.00%
|
| Additional Fund Statistics [Text Block] |
Net Assets | $354,857,874 |
|---|
Number of Portfolio Holdings | 44 |
|---|
Advisory Fee (net of waivers) | $2,036,126 |
|---|
Portfolio Turnover | 34% |
|---|
|
| Holdings [Text Block] |
Asset Weighting (% of total investments)Value | Value |
|---|
Common Stocks | 75.2% | Exchange-Traded Funds | 16.8% | Money Market Funds | 3.6% | Reit | 4.4% |
Sector Weighting (% of net assets)Value | Value |
|---|
Liabilities in Excess of Other Assets | -0.1% | Energy | 3.4% | Materials | 3.5% | Money Market Funds | 3.6% | Real Estate | 4.4% | Consumer Discretionary | 4.6% | Utilities | 6.6% | Health Care | 7.9% | Financials | 8.1% | Consumer Staples | 8.1% | Industrials | 10.6% | Equity | 16.8% | Technology | 22.5% |
Top 10 Holdings (% of net assets)Holding Name | % of Net Assets |
|---|
Timothy Plan US Large/Mid Cap Core Enhanced ETF | 7.1% |
|---|
Timothy Plan High Dividend Stock Enhanced ETF | 6.3% |
|---|
Fidelity Government Portfolio, Institutional Class | 3.6% |
|---|
Monolithic Power Systems, Inc. | 2.7% |
|---|
O'Reilly Automotive, Inc. | 2.6% |
|---|
CACI International, Inc., Class A | 2.5% |
|---|
WEC Energy Group, Inc. | 2.4% |
|---|
Arthur J Gallagher & Company | 2.4% |
|---|
McCormick & Company, Inc. | 2.4% |
|---|
Hubbell, Inc. | 2.3% |
|---|
|
| C000126994 |
|
| Shareholder Report [Line Items] |
|
| Fund Name |
Timothy Plan Large/Mid Cap Value Fund
|
| Class Name |
Class I
|
| Trading Symbol |
TMVIX
|
| Annual or Semi-Annual Statement [Text Block] |
This annual shareholder report contains important information about Timothy Plan Large/Mid Cap Value Fund for the period of October 1, 2023 to September 30, 2024.
|
| Shareholder Report Annual or Semi-Annual |
Annual Shareholder Report
|
| Additional Information [Text Block] |
You can find additional information about the Fund at https://fund.timothyplan.com. You can also request this information by contacting us at (800) 846-7526.
|
| Additional Information Phone Number |
(800) 846-7526
|
| Additional Information Website |
https://fund.timothyplan.com
|
| Expenses [Text Block] |
What were the Fund’s costs for the last year?(based on a hypothetical $10,000 investment) Class Name | Costs of a $10,000 investment | Costs paid as a percentage of a $10,000 investment |
|---|
Class I | $107 | 0.94% |
|---|
|
| Expenses Paid, Amount |
$ 107
|
| Expense Ratio, Percent |
0.94%
|
| Performance Past Does Not Indicate Future [Text] |
The Fund's past performance is not a good predictor of how the Fund will perform in the future.
|
| Average Annual Return [Table Text Block] |
Average Annual Total Returns | 1 Year | 5 Years | 10 Years |
|---|
Timothy Plan Large/Mid Cap Value Fund | 28.53% | 12.52% | 10.90% |
|---|
S&P 500® Index | 36.35% | 15.98% | 13.38% |
|---|
The Fund's past performance is not a good predictor of how the Fund will perform in the future. The graph and table do not reflect the deduction of taxes that a shareholder would pay on fund distributions or redemption of fund shares. |
| No Deduction of Taxes [Text Block] |
The graph and table do not reflect the deduction of taxes that a shareholder would pay on fund distributions or redemption of fund shares.
|
| AssetsNet |
$ 354,857,874
|
| Holdings Count | Holding |
44
|
| Advisory Fees Paid, Amount |
$ 2,036,126
|
| InvestmentCompanyPortfolioTurnover |
34.00%
|
| Additional Fund Statistics [Text Block] |
Net Assets | $354,857,874 |
|---|
Number of Portfolio Holdings | 44 |
|---|
Advisory Fee (net of waivers) | $2,036,126 |
|---|
Portfolio Turnover | 34% |
|---|
|
| Holdings [Text Block] |
Asset Weighting (% of total investments)Value | Value |
|---|
Common Stocks | 75.2% | Exchange-Traded Funds | 16.8% | Money Market Funds | 3.6% | Reit | 4.4% |
Sector Weighting (% of net assets)Value | Value |
|---|
Liabilities in Excess of Other Assets | -0.1% | Energy | 3.4% | Materials | 3.5% | Money Market Funds | 3.6% | Real Estate | 4.4% | Consumer Discretionary | 4.6% | Utilities | 6.6% | Health Care | 7.9% | Financials | 8.1% | Consumer Staples | 8.1% | Industrials | 10.6% | Equity | 16.8% | Technology | 22.5% |
Top 10 Holdings (% of net assets)Holding Name | % of Net Assets |
|---|
Timothy Plan US Large/Mid Cap Core Enhanced ETF | 7.1% |
|---|
Timothy Plan High Dividend Stock Enhanced ETF | 6.3% |
|---|
Fidelity Government Portfolio, Institutional Class | 3.6% |
|---|
Monolithic Power Systems, Inc. | 2.7% |
|---|
O'Reilly Automotive, Inc. | 2.6% |
|---|
CACI International, Inc., Class A | 2.5% |
|---|
WEC Energy Group, Inc. | 2.4% |
|---|
Arthur J Gallagher & Company | 2.4% |
|---|
McCormick & Company, Inc. | 2.4% |
|---|
Hubbell, Inc. | 2.3% |
|---|
|
| C000012330 |
|
| Shareholder Report [Line Items] |
|
| Fund Name |
Timothy Plan Small Cap Value Fund
|
| Class Name |
Class A
|
| Trading Symbol |
TPLNX
|
| Annual or Semi-Annual Statement [Text Block] |
This annual shareholder report contains important information about Timothy Plan Small Cap Value Fund for the period of October 1, 2023 to September 30, 2024.
|
| Shareholder Report Annual or Semi-Annual |
Annual Shareholder Report
|
| Additional Information [Text Block] |
You can find additional information about the Fund at https://fund.timothyplan.com. You can also request this information by contacting us at (800) 846-7526.
|
| Additional Information Phone Number |
(800) 846-7526
|
| Additional Information Website |
https://fund.timothyplan.com
|
| Expenses [Text Block] |
What were the Fund’s costs for the last year?(based on a hypothetical $10,000 investment) Class Name | Costs of a $10,000 investment | Costs paid as a percentage of a $10,000 investment |
|---|
Class A | $149 | 1.33% |
|---|
|
| Expenses Paid, Amount |
$ 149
|
| Expense Ratio, Percent |
1.33%
|
| Performance Past Does Not Indicate Future [Text] |
The Fund's past performance is not a good predictor of how the Fund will perform in the future.
|
| Average Annual Return [Table Text Block] |
Average Annual Total Returns | 1 Year | 5 Years | 10 Years |
|---|
Timothy Plan Small Cap Value Fund | | | |
|---|
Without Load | 24.15% | 8.78% | 8.27% |
|---|
With Load | 17.31% | 7.55% | 7.66% |
|---|
Russell 2000® Index | 26.76% | 9.39% | 8.78% |
|---|
Russell 3000® Index | 35.19% | 15.26% | 12.83% |
|---|
The Fund's past performance is not a good predictor of how the Fund will perform in the future. The graph and table do not reflect the deduction of taxes that a shareholder would pay on fund distributions or redemption of fund shares. |
| No Deduction of Taxes [Text Block] |
The graph and table do not reflect the deduction of taxes that a shareholder would pay on fund distributions or redemption of fund shares.
|
| AssetsNet |
$ 195,874,164
|
| Holdings Count | Holding |
62
|
| Advisory Fees Paid, Amount |
$ 1,298,344
|
| InvestmentCompanyPortfolioTurnover |
50.00%
|
| Additional Fund Statistics [Text Block] |
Net Assets | $195,874,164 |
|---|
Number of Portfolio Holdings | 62 |
|---|
Advisory Fee (net of waivers) | $1,298,344 |
|---|
Portfolio Turnover | 50% |
|---|
|
| Holdings [Text Block] |
Asset Weighting (% of total investments)Value | Value |
|---|
Common Stocks | 77.7% | Exchange-Traded Funds | 11.5% | Money Market Funds | 1.1% | Reit | 9.7% |
Sector Weighting (% of net assets)Value | Value |
|---|
Communications | 0.9% | Money Market Funds | 1.1% | Consumer Staples | 2.6% | Utilities | 3.5% | Technology | 5.4% | Health Care | 6.8% | Energy | 7.2% | Materials | 8.8% | Consumer Discretionary | 8.8% | Real Estate | 9.7% | Equity | 11.5% | Industrials | 13.1% | Financials | 20.6% |
Top 10 Holdings (% of net assets)Holding Name | % of Net Assets |
|---|
Timothy Plan US Small Cap Core ETF | 11.5% |
|---|
GMS, Inc. | 1.9% |
|---|
Century Communities, Inc. | 1.9% |
|---|
Moog, Inc., Class A | 1.9% |
|---|
Boise Cascade Company | 1.9% |
|---|
Stepan Company | 1.9% |
|---|
PotlatchDeltic Corporation | 1.9% |
|---|
Piper Sandler Cos | 1.9% |
|---|
Merit Medical Systems, Inc. | 1.8% |
|---|
First Bancorp | 1.8% |
|---|
|
| C000012332 |
|
| Shareholder Report [Line Items] |
|
| Fund Name |
Timothy Plan Small Cap Value Fund
|
| Class Name |
Class C
|
| Trading Symbol |
TSVCX
|
| Annual or Semi-Annual Statement [Text Block] |
This annual shareholder report contains important information about Timothy Plan Small Cap Value Fund for the period of October 1, 2023 to September 30, 2024.
|
| Shareholder Report Annual or Semi-Annual |
Annual Shareholder Report
|
| Additional Information [Text Block] |
You can find additional information about the Fund at https://fund.timothyplan.com. You can also request this information by contacting us at (800) 846-7526.
|
| Additional Information Phone Number |
(800) 846-7526
|
| Additional Information Website |
https://fund.timothyplan.com
|
| Expenses [Text Block] |
What were the Fund’s costs for the last year?(based on a hypothetical $10,000 investment) Class Name | Costs of a $10,000 investment | Costs paid as a percentage of a $10,000 investment |
|---|
Class C | $232 | 2.08% |
|---|
|
| Expenses Paid, Amount |
$ 232
|
| Expense Ratio, Percent |
2.08%
|
| Performance Past Does Not Indicate Future [Text] |
The Fund's past performance is not a good predictor of how the Fund will perform in the future.
|
| Average Annual Return [Table Text Block] |
Average Annual Total Returns | 1 Year | 5 Years | 10 Years |
|---|
Timothy Plan Small Cap Value Fund | 23.28% | 7.97% | 7.46% |
|---|
Russell 2000® Index | 26.76% | 9.39% | 8.78% |
|---|
Russell 3000® Index | 35.19% | 15.26% | 12.83% |
|---|
The Fund's past performance is not a good predictor of how the Fund will perform in the future. The graph and table do not reflect the deduction of taxes that a shareholder would pay on fund distributions or redemption of fund shares. |
| No Deduction of Taxes [Text Block] |
The graph and table do not reflect the deduction of taxes that a shareholder would pay on fund distributions or redemption of fund shares.
|
| AssetsNet |
$ 195,874,164
|
| Holdings Count | Holding |
62
|
| Advisory Fees Paid, Amount |
$ 1,298,344
|
| InvestmentCompanyPortfolioTurnover |
50.00%
|
| Additional Fund Statistics [Text Block] |
Net Assets | $195,874,164 |
|---|
Number of Portfolio Holdings | 62 |
|---|
Advisory Fee (net of waivers) | $1,298,344 |
|---|
Portfolio Turnover | 50% |
|---|
|
| Holdings [Text Block] |
Asset Weighting (% of total investments)Value | Value |
|---|
Common Stocks | 77.7% | Exchange-Traded Funds | 11.5% | Money Market Funds | 1.1% | Reit | 9.7% |
Sector Weighting (% of net assets)Value | Value |
|---|
Communications | 0.9% | Money Market Funds | 1.1% | Consumer Staples | 2.6% | Utilities | 3.5% | Technology | 5.4% | Health Care | 6.8% | Energy | 7.2% | Materials | 8.8% | Consumer Discretionary | 8.8% | Real Estate | 9.7% | Equity | 11.5% | Industrials | 13.1% | Financials | 20.6% |
Top 10 Holdings (% of net assets)Holding Name | % of Net Assets |
|---|
Timothy Plan US Small Cap Core ETF | 11.5% |
|---|
GMS, Inc. | 1.9% |
|---|
Century Communities, Inc. | 1.9% |
|---|
Moog, Inc., Class A | 1.9% |
|---|
Boise Cascade Company | 1.9% |
|---|
Stepan Company | 1.9% |
|---|
PotlatchDeltic Corporation | 1.9% |
|---|
Piper Sandler Cos | 1.9% |
|---|
Merit Medical Systems, Inc. | 1.8% |
|---|
First Bancorp | 1.8% |
|---|
|
| C000126993 |
|
| Shareholder Report [Line Items] |
|
| Fund Name |
Timothy Plan Small Cap Value Fund
|
| Class Name |
Class I
|
| Trading Symbol |
TPVIX
|
| Annual or Semi-Annual Statement [Text Block] |
This annual shareholder report contains important information about Timothy Plan Small Cap Value Fund for the period of October 1, 2023 to September 30, 2024.
|
| Shareholder Report Annual or Semi-Annual |
Annual Shareholder Report
|
| Additional Information [Text Block] |
You can find additional information about the Fund at https://fund.timothyplan.com. You can also request this information by contacting us at (800) 846-7526.
|
| Additional Information Phone Number |
(800) 846-7526
|
| Additional Information Website |
https://fund.timothyplan.com
|
| Expenses [Text Block] |
What were the Fund’s costs for the last year?(based on a hypothetical $10,000 investment) Class Name | Costs of a $10,000 investment | Costs paid as a percentage of a $10,000 investment |
|---|
Class I | $121 | 1.08% |
|---|
|
| Expenses Paid, Amount |
$ 121
|
| Expense Ratio, Percent |
1.08%
|
| Performance Past Does Not Indicate Future [Text] |
The Fund's past performance is not a good predictor of how the Fund will perform in the future.
|
| Average Annual Return [Table Text Block] |
Average Annual Total Returns | 1 Year | 5 Years | 10 Years |
|---|
Timothy Plan Small Cap Value Fund | 24.45% | 9.04% | 8.54% |
|---|
Russell 2000® Index | 26.76% | 9.39% | 8.78% |
|---|
Russell 3000® Index | 35.19% | 15.26% | 12.83% |
|---|
The Fund's past performance is not a good predictor of how the Fund will perform in the future. The graph and table do not reflect the deduction of taxes that a shareholder would pay on fund distributions or redemption of fund shares. |
| No Deduction of Taxes [Text Block] |
The graph and table do not reflect the deduction of taxes that a shareholder would pay on fund distributions or redemption of fund shares.
|
| AssetsNet |
$ 195,874,164
|
| Holdings Count | Holding |
62
|
| Advisory Fees Paid, Amount |
$ 1,298,344
|
| InvestmentCompanyPortfolioTurnover |
50.00%
|
| Additional Fund Statistics [Text Block] |
Net Assets | $195,874,164 |
|---|
Number of Portfolio Holdings | 62 |
|---|
Advisory Fee (net of waivers) | $1,298,344 |
|---|
Portfolio Turnover | 50% |
|---|
|
| Holdings [Text Block] |
Asset Weighting (% of total investments)Value | Value |
|---|
Common Stocks | 77.7% | Exchange-Traded Funds | 11.5% | Money Market Funds | 1.1% | Reit | 9.7% |
Sector Weighting (% of net assets)Value | Value |
|---|
Communications | 0.9% | Money Market Funds | 1.1% | Consumer Staples | 2.6% | Utilities | 3.5% | Technology | 5.4% | Health Care | 6.8% | Energy | 7.2% | Materials | 8.8% | Consumer Discretionary | 8.8% | Real Estate | 9.7% | Equity | 11.5% | Industrials | 13.1% | Financials | 20.6% |
Top 10 Holdings (% of net assets)Holding Name | % of Net Assets |
|---|
Timothy Plan US Small Cap Core ETF | 11.5% |
|---|
GMS, Inc. | 1.9% |
|---|
Century Communities, Inc. | 1.9% |
|---|
Moog, Inc., Class A | 1.9% |
|---|
Boise Cascade Company | 1.9% |
|---|
Stepan Company | 1.9% |
|---|
PotlatchDeltic Corporation | 1.9% |
|---|
Piper Sandler Cos | 1.9% |
|---|
Merit Medical Systems, Inc. | 1.8% |
|---|
First Bancorp | 1.8% |
|---|
|
| C000012339 |
|
| Shareholder Report [Line Items] |
|
| Fund Name |
Timothy Plan Small/Mid Cap Growth Fund
|
| Class Name |
Class A
|
| Trading Symbol |
TAAGX
|
| Annual or Semi-Annual Statement [Text Block] |
This annual shareholder report contains important information about Timothy Plan Small/Mid Cap Growth Fund for the period of October 1, 2023 to September 30, 2024.
|
| Shareholder Report Annual or Semi-Annual |
Annual Shareholder Report
|
| Additional Information [Text Block] |
You can find additional information about the Fund at https://fund.timothyplan.com. You can also request this information by contacting us at (800) 846-7526.
|
| Additional Information Phone Number |
(800) 846-7526
|
| Additional Information Website |
https://fund.timothyplan.com
|
| Expenses [Text Block] |
What were the Fund’s costs for the last year?(based on a hypothetical $10,000 investment) Class Name | Costs of a $10,000 investment | Costs paid as a percentage of a $10,000 investment |
|---|
Class A | $180 | 1.48% |
|---|
|
| Expenses Paid, Amount |
$ 180
|
| Expense Ratio, Percent |
1.48%
|
| Performance Past Does Not Indicate Future [Text] |
The Fund's past performance is not a good predictor of how the Fund will perform in the future.
|
| Average Annual Return [Table Text Block] |
Average Annual Total Returns | 1 Year | 5 Years | 10 Years |
|---|
Timothy Plan Small/Mid Cap Growth Fund | | | |
|---|
Without Load | 42.75% | 15.75% | 9.56% |
|---|
With Load | 34.90% | 14.44% | 8.94% |
|---|
Russell 3000® Index | 35.19% | 15.26% | 12.83% |
|---|
Russell Midcap® Growth Index | 29.33% | 11.48% | 11.30% |
|---|
The Fund's past performance is not a good predictor of how the Fund will perform in the future. The graph and table do not reflect the deduction of taxes that a shareholder would pay on fund distributions or redemption of fund shares. |
| No Deduction of Taxes [Text Block] |
The graph and table do not reflect the deduction of taxes that a shareholder would pay on fund distributions or redemption of fund shares.
|
| AssetsNet |
$ 72,026,174
|
| Holdings Count | Holding |
40
|
| Advisory Fees Paid, Amount |
$ 472,346
|
| InvestmentCompanyPortfolioTurnover |
95.00%
|
| Additional Fund Statistics [Text Block] |
Net Assets | $72,026,174 |
|---|
Number of Portfolio Holdings | 40 |
|---|
Advisory Fee (net of waivers) | $472,346 |
|---|
Portfolio Turnover | 95% |
|---|
|
| Holdings [Text Block] |
Asset Weighting (% of total investments)Value | Value |
|---|
Common Stocks | 90.8% | Money Market Funds | 7.0% | Reit | 2.2% |
Sector Weighting (% of net assets)Value | Value |
|---|
Liabilities in Excess of Other Assets | -2.6% | Financials | 0.9% | Real Estate | 2.2% | Energy | 5.5% | Money Market Funds | 7.2% | Health Care | 15.3% | Consumer Discretionary | 18.8% | Technology | 25.1% | Industrials | 27.6% |
Top 10 Holdings (% of net assets)Holding Name | % of Net Assets |
|---|
Fidelity Government Portfolio, Institutional Class | 7.2% |
|---|
Comfort Systems USA, Inc. | 4.7% |
|---|
Toll Brothers, Inc. | 4.5% |
|---|
Clean Harbors, Inc. | 3.9% |
|---|
Monolithic Power Systems, Inc. | 3.9% |
|---|
Parker-Hannifin Corporation | 3.7% |
|---|
Burlington Stores, Inc. | 3.6% |
|---|
Marvell Technology, Inc. | 3.6% |
|---|
Deckers Outdoor Corporation | 3.6% |
|---|
Tenet Healthcare Corporation | 3.5% |
|---|
|
| C000012341 |
|
| Shareholder Report [Line Items] |
|
| Fund Name |
Timothy Plan Small/Mid Cap Growth Fund
|
| Class Name |
Class C
|
| Trading Symbol |
TCAGX
|
| Annual or Semi-Annual Statement [Text Block] |
This annual shareholder report contains important information about Timothy Plan Small/Mid Cap Growth Fund for the period of October 1, 2023 to September 30, 2024.
|
| Shareholder Report Annual or Semi-Annual |
Annual Shareholder Report
|
| Additional Information [Text Block] |
You can find additional information about the Fund at https://fund.timothyplan.com. You can also request this information by contacting us at (800) 846-7526.
|
| Additional Information Phone Number |
(800) 846-7526
|
| Additional Information Website |
https://fund.timothyplan.com
|
| Expenses [Text Block] |
What were the Fund’s costs for the last year?(based on a hypothetical $10,000 investment) Class Name | Costs of a $10,000 investment | Costs paid as a percentage of a $10,000 investment |
|---|
Class C | $270 | 2.23% |
|---|
|
| Expenses Paid, Amount |
$ 270
|
| Expense Ratio, Percent |
2.23%
|
| Performance Past Does Not Indicate Future [Text] |
The Fund's past performance is not a good predictor of how the Fund will perform in the future.
|
| Average Annual Return [Table Text Block] |
Average Annual Total Returns | 1 Year | 5 Years | 10 Years |
|---|
Timothy Plan Small/Mid Cap Growth Fund | 41.68% | 14.89% | 8.74% |
|---|
Russell 3000® Index | 35.19% | 15.26% | 12.83% |
|---|
Russell Midcap® Growth Index | 29.33% | 11.48% | 11.30% |
|---|
The Fund's past performance is not a good predictor of how the Fund will perform in the future. The graph and table do not reflect the deduction of taxes that a shareholder would pay on fund distributions or redemption of fund shares. |
| No Deduction of Taxes [Text Block] |
The graph and table do not reflect the deduction of taxes that a shareholder would pay on fund distributions or redemption of fund shares.
|
| AssetsNet |
$ 72,026,174
|
| Holdings Count | Holding |
40
|
| Advisory Fees Paid, Amount |
$ 472,346
|
| InvestmentCompanyPortfolioTurnover |
95.00%
|
| Additional Fund Statistics [Text Block] |
Net Assets | $72,026,174 |
|---|
Number of Portfolio Holdings | 40 |
|---|
Advisory Fee (net of waivers) | $472,346 |
|---|
Portfolio Turnover | 95% |
|---|
|
| Holdings [Text Block] |
Asset Weighting (% of total investments)Value | Value |
|---|
Common Stocks | 90.8% | Money Market Funds | 7.0% | Reit | 2.2% |
Sector Weighting (% of net assets)Value | Value |
|---|
Liabilities in Excess of Other Assets | -2.6% | Financials | 0.9% | Real Estate | 2.2% | Energy | 5.5% | Money Market Funds | 7.2% | Health Care | 15.3% | Consumer Discretionary | 18.8% | Technology | 25.1% | Industrials | 27.6% |
Top 10 Holdings (% of net assets)Holding Name | % of Net Assets |
|---|
Fidelity Government Portfolio, Institutional Class | 7.2% |
|---|
Comfort Systems USA, Inc. | 4.7% |
|---|
Toll Brothers, Inc. | 4.5% |
|---|
Clean Harbors, Inc. | 3.9% |
|---|
Monolithic Power Systems, Inc. | 3.9% |
|---|
Parker-Hannifin Corporation | 3.7% |
|---|
Burlington Stores, Inc. | 3.6% |
|---|
Marvell Technology, Inc. | 3.6% |
|---|
Deckers Outdoor Corporation | 3.6% |
|---|
Tenet Healthcare Corporation | 3.5% |
|---|
|
| C000126996 |
|
| Shareholder Report [Line Items] |
|
| Fund Name |
Timothy Plan Small/Mid Cap Growth Fund
|
| Class Name |
Class I
|
| Trading Symbol |
TIAGX
|
| Annual or Semi-Annual Statement [Text Block] |
This annual shareholder report contains important information about Timothy Plan Small/Mid Cap Growth Fund for the period of October 1, 2023 to September 30, 2024.
|
| Shareholder Report Annual or Semi-Annual |
Annual Shareholder Report
|
| Additional Information [Text Block] |
You can find additional information about the Fund at https://fund.timothyplan.com. You can also request this information by contacting us at (800) 846-7526.
|
| Additional Information Phone Number |
(800) 846-7526
|
| Additional Information Website |
https://fund.timothyplan.com
|
| Expenses [Text Block] |
What were the Fund’s costs for the last year?(based on a hypothetical $10,000 investment) Class Name | Costs of a $10,000 investment | Costs paid as a percentage of a $10,000 investment |
|---|
Class I | $150 | 1.23% |
|---|
|
| Expenses Paid, Amount |
$ 150
|
| Expense Ratio, Percent |
1.23%
|
| Performance Past Does Not Indicate Future [Text] |
The Fund's past performance is not a good predictor of how the Fund will perform in the future.
|
| Average Annual Return [Table Text Block] |
Average Annual Total Returns | 1 Year | 5 Years | 10 Years |
|---|
Timothy Plan Small/Mid Cap Growth Fund | 43.24% | 16.02% | 9.83% |
|---|
Russell 3000® Index | 35.19% | 15.26% | 12.83% |
|---|
Russell Midcap® Growth Index | 29.33% | 11.48% | 11.30% |
|---|
The Fund's past performance is not a good predictor of how the Fund will perform in the future. The graph and table do not reflect the deduction of taxes that a shareholder would pay on fund distributions or redemption of fund shares. |
| No Deduction of Taxes [Text Block] |
The graph and table do not reflect the deduction of taxes that a shareholder would pay on fund distributions or redemption of fund shares.
|
| AssetsNet |
$ 72,026,174
|
| Holdings Count | Holding |
40
|
| Advisory Fees Paid, Amount |
$ 472,346
|
| InvestmentCompanyPortfolioTurnover |
95.00%
|
| Additional Fund Statistics [Text Block] |
Net Assets | $72,026,174 |
|---|
Number of Portfolio Holdings | 40 |
|---|
Advisory Fee (net of waivers) | $472,346 |
|---|
Portfolio Turnover | 95% |
|---|
|
| Holdings [Text Block] |
Asset Weighting (% of total investments)Value | Value |
|---|
Common Stocks | 90.8% | Money Market Funds | 7.0% | Reit | 2.2% |
Sector Weighting (% of net assets)Value | Value |
|---|
Liabilities in Excess of Other Assets | -2.6% | Financials | 0.9% | Real Estate | 2.2% | Energy | 5.5% | Money Market Funds | 7.2% | Health Care | 15.3% | Consumer Discretionary | 18.8% | Technology | 25.1% | Industrials | 27.6% |
Top 10 Holdings (% of net assets)Holding Name | % of Net Assets |
|---|
Fidelity Government Portfolio, Institutional Class | 7.2% |
|---|
Comfort Systems USA, Inc. | 4.7% |
|---|
Toll Brothers, Inc. | 4.5% |
|---|
Clean Harbors, Inc. | 3.9% |
|---|
Monolithic Power Systems, Inc. | 3.9% |
|---|
Parker-Hannifin Corporation | 3.7% |
|---|
Burlington Stores, Inc. | 3.6% |
|---|
Marvell Technology, Inc. | 3.6% |
|---|
Deckers Outdoor Corporation | 3.6% |
|---|
Tenet Healthcare Corporation | 3.5% |
|---|
|
| C000012345 |
|
| Shareholder Report [Line Items] |
|
| Fund Name |
Timothy Plan Strategic Growth Fund
|
| Class Name |
Class A
|
| Trading Symbol |
TSGAX
|
| Annual or Semi-Annual Statement [Text Block] |
This annual shareholder report contains important information about Timothy Plan Strategic Growth Fund for the period of October 1, 2023 to September 30, 2024.
|
| Shareholder Report Annual or Semi-Annual |
Annual Shareholder Report
|
| Additional Information [Text Block] |
You can find additional information about the Fund at https://fund.timothyplan.com. You can also request this information by contacting us at (800) 846-7526.
|
| Additional Information Phone Number |
(800) 846-7526
|
| Additional Information Website |
https://fund.timothyplan.com
|
| Expenses [Text Block] |
What were the Fund’s costs for the last year?(based on a hypothetical $10,000 investment) Class Name | Costs of a $10,000 investment | Costs paid as a percentage of a $10,000 investment |
|---|
Class A | $97 | 0.89% |
|---|
|
| Expenses Paid, Amount |
$ 97
|
| Expense Ratio, Percent |
0.89%
|
| Performance Past Does Not Indicate Future [Text] |
The Fund's past performance is not a good predictor of how the Fund will perform in the future.
|
| Average Annual Return [Table Text Block] |
Average Annual Total Returns | 1 Year | 5 Years | 10 Years |
|---|
Timothy Plan Strategic Growth Fund | | | |
|---|
Without Load | 17.23% | 5.19% | 3.59% |
|---|
With Load | 10.80% | 4.01% | 3.01% |
|---|
Dow Jones Moderately Aggressive Portfolio Index | 24.10% | 8.96% | 7.86% |
|---|
Russell 3000® Index | 35.19% | 15.26% | 12.83% |
|---|
The Fund's past performance is not a good predictor of how the Fund will perform in the future. The graph and table do not reflect the deduction of taxes that a shareholder would pay on fund distributions or redemption of fund shares. |
| No Deduction of Taxes [Text Block] |
The graph and table do not reflect the deduction of taxes that a shareholder would pay on fund distributions or redemption of fund shares.
|
| AssetsNet |
$ 33,757,663
|
| Holdings Count | Holding |
9
|
| Advisory Fees Paid, Amount |
$ 49,623
|
| InvestmentCompanyPortfolioTurnover |
3.00%
|
| Additional Fund Statistics [Text Block] |
Net Assets | $33,757,663 |
|---|
Number of Portfolio Holdings | 9 |
|---|
Advisory Fee | $49,623 |
|---|
Portfolio Turnover | 3% |
|---|
|
| Holdings [Text Block] |
Asset Weighting (% of total investments)Value | Value |
|---|
Exchange-Traded Funds | 66.7% | Money Market Funds | 2.1% | Open End Funds | 31.2% |
Sector Weighting (% of net assets)Value | Value |
|---|
Liabilities in Excess of Other Assets | -0.1% | Money Market Funds | 2.1% | Fixed Income | 18.0% | Equity | 80.0% |
Top 10 Holdings (% of net assets)Holding Name | % of Net Assets |
|---|
Timothy Plan International ETF | 16.2% |
|---|
Timothy Plan US Large/Mid Cap Core Enhanced ETF | 15.4% |
|---|
Timothy Plan Market Neutral ETF | 15.0% |
|---|
Timothy Plan International Fund, Class A | 13.2% |
|---|
Timothy Plan US Small Cap Core ETF | 12.1% |
|---|
Timothy Plan Fixed Income Fund, Class A | 12.0% |
|---|
Timothy Plan High Dividend Stock Enhanced ETF | 8.1% |
|---|
Timothy Plan High Yield Bond Fund, Class A | 6.0% |
|---|
Fidelity Government Portfolio, Institutional Class | 2.1% |
|---|
|
| C000012347 |
|
| Shareholder Report [Line Items] |
|
| Fund Name |
Timothy Plan Strategic Growth Fund
|
| Class Name |
Class C
|
| Trading Symbol |
TSGCX
|
| Annual or Semi-Annual Statement [Text Block] |
This annual shareholder report contains important information about Timothy Plan Strategic Growth Fund for the period of October 1, 2023 to September 30, 2024.
|
| Shareholder Report Annual or Semi-Annual |
Annual Shareholder Report
|
| Additional Information [Text Block] |
You can find additional information about the Fund at https://fund.timothyplan.com. You can also request this information by contacting us at (800) 846-7526.
|
| Additional Information Phone Number |
(800) 846-7526
|
| Additional Information Website |
https://fund.timothyplan.com
|
| Expenses [Text Block] |
What were the Fund’s costs for the last year?(based on a hypothetical $10,000 investment) Class Name | Costs of a $10,000 investment | Costs paid as a percentage of a $10,000 investment |
|---|
Class C | $151 | 1.39% |
|---|
|
| Expenses Paid, Amount |
$ 151
|
| Expense Ratio, Percent |
1.39%
|
| Performance Past Does Not Indicate Future [Text] |
The Fund's past performance is not a good predictor of how the Fund will perform in the future.
|
| Average Annual Return [Table Text Block] |
Average Annual Total Returns | 1 Year | 5 Years | 10 Years |
|---|
Timothy Plan Strategic Growth Fund | 16.61% | 4.50% | 2.86% |
|---|
Dow Jones Moderately Aggressive Portfolio Index | 24.10% | 8.96% | 7.86% |
|---|
Russell 3000® Index | 35.19% | 15.26% | 12.83% |
|---|
The Fund's past performance is not a good predictor of how the Fund will perform in the future. The graph and table do not reflect the deduction of taxes that a shareholder would pay on fund distributions or redemption of fund shares. |
| No Deduction of Taxes [Text Block] |
The graph and table do not reflect the deduction of taxes that a shareholder would pay on fund distributions or redemption of fund shares.
|
| AssetsNet |
$ 33,757,663
|
| Holdings Count | Holding |
9
|
| Advisory Fees Paid, Amount |
$ 49,623
|
| InvestmentCompanyPortfolioTurnover |
3.00%
|
| Additional Fund Statistics [Text Block] |
Net Assets | $33,757,663 |
|---|
Number of Portfolio Holdings | 9 |
|---|
Advisory Fee | $49,623 |
|---|
Portfolio Turnover | 3% |
|---|
|
| Holdings [Text Block] |
Asset Weighting (% of total investments)Value | Value |
|---|
Exchange-Traded Funds | 66.7% | Money Market Funds | 2.1% | Open End Funds | 31.2% |
Sector Weighting (% of net assets)Value | Value |
|---|
Liabilities in Excess of Other Assets | -0.1% | Money Market Funds | 2.1% | Fixed Income | 18.0% | Equity | 80.0% |
Top 10 Holdings (% of net assets)Holding Name | % of Net Assets |
|---|
Timothy Plan International ETF | 16.2% |
|---|
Timothy Plan US Large/Mid Cap Core Enhanced ETF | 15.4% |
|---|
Timothy Plan Market Neutral ETF | 15.0% |
|---|
Timothy Plan International Fund, Class A | 13.2% |
|---|
Timothy Plan US Small Cap Core ETF | 12.1% |
|---|
Timothy Plan Fixed Income Fund, Class A | 12.0% |
|---|
Timothy Plan High Dividend Stock Enhanced ETF | 8.1% |
|---|
Timothy Plan High Yield Bond Fund, Class A | 6.0% |
|---|
Fidelity Government Portfolio, Institutional Class | 2.1% |
|---|
|
| C000126998 |
|
| Shareholder Report [Line Items] |
|
| Fund Name |
Timothy Plan Strategic Growth Fund
|
| Class Name |
Class I
|
| Trading Symbol |
TISGX
|
| Annual or Semi-Annual Statement [Text Block] |
This annual shareholder report contains important information about Timothy Plan Strategic Growth Fund for the period of October 1, 2023 to September 30, 2024.
|
| Shareholder Report Annual or Semi-Annual |
Annual Shareholder Report
|
| Additional Information [Text Block] |
You can find additional information about the Fund at https://fund.timothyplan.com. You can also request this information by contacting us at (800) 846-7526.
|
| Additional Information Phone Number |
(800) 846-7526
|
| Additional Information Website |
https://fund.timothyplan.com
|
| Expenses [Text Block] |
What were the Fund’s costs for the last year?(based on a hypothetical $10,000 investment) Class Name | Costs of a $10,000 investment | Costs paid as a percentage of a $10,000 investment |
|---|
Class I | $70 | 0.64% |
|---|
|
| Expenses Paid, Amount |
$ 70
|
| Expense Ratio, Percent |
0.64%
|
| Performance Past Does Not Indicate Future [Text] |
The Fund's past performance is not a good predictor of how the Fund will perform in the future.
|
| Average Annual Return [Table Text Block] |
Average Annual Total Returns | 1 Year | Since Inception (September 1, 2023) |
|---|
Timothy Plan Strategic Growth Fund | 17.33% | 12.52% |
|---|
Dow Jones Moderately Aggressive Portfolio Index | 24.10% | 17.82% |
|---|
Russell 3000® Index | 35.19% | 26.04% |
|---|
The Fund's past performance is not a good predictor of how the Fund will perform in the future. The graph and table do not reflect the deduction of taxes that a shareholder would pay on fund distributions or redemption of fund shares. |
| Performance Inception Date |
Sep. 01, 2023
|
| No Deduction of Taxes [Text Block] |
The graph and table do not reflect the deduction of taxes that a shareholder would pay on fund distributions or redemption of fund shares.
|
| AssetsNet |
$ 33,757,663
|
| Holdings Count | Holding |
9
|
| Advisory Fees Paid, Amount |
$ 49,623
|
| InvestmentCompanyPortfolioTurnover |
3.00%
|
| Additional Fund Statistics [Text Block] |
Net Assets | $33,757,663 |
|---|
Number of Portfolio Holdings | 9 |
|---|
Advisory Fee | $49,623 |
|---|
Portfolio Turnover | 3% |
|---|
|
| Holdings [Text Block] |
Asset Weighting (% of total investments)Value | Value |
|---|
Exchange-Traded Funds | 66.7% | Money Market Funds | 2.1% | Open End Funds | 31.2% |
Sector Weighting (% of net assets)Value | Value |
|---|
Liabilities in Excess of Other Assets | -0.1% | Money Market Funds | 2.1% | Fixed Income | 18.0% | Equity | 80.0% |
Top 10 Holdings (% of net assets)Holding Name | % of Net Assets |
|---|
Timothy Plan International ETF | 16.2% |
|---|
Timothy Plan US Large/Mid Cap Core Enhanced ETF | 15.4% |
|---|
Timothy Plan Market Neutral ETF | 15.0% |
|---|
Timothy Plan International Fund, Class A | 13.2% |
|---|
Timothy Plan US Small Cap Core ETF | 12.1% |
|---|
Timothy Plan Fixed Income Fund, Class A | 12.0% |
|---|
Timothy Plan High Dividend Stock Enhanced ETF | 8.1% |
|---|
Timothy Plan High Yield Bond Fund, Class A | 6.0% |
|---|
Fidelity Government Portfolio, Institutional Class | 2.1% |
|---|
|