Shareholder Report
|
6 Months Ended |
|
Jun. 30, 2025
USD ($)
Holding
|
|---|
| Shareholder Report [Line Items] |
|
| Document Type |
N-CSRS
|
| Amendment Flag |
false
|
| Registrant Name |
SCHWARTZ INVESTMENT TRUST
|
| Entity Central Index Key |
0000891160
|
| Entity Investment Company Type |
N-1A
|
| Document Period End Date |
Jun. 30, 2025
|
| C000004202 |
|
| Shareholder Report [Line Items] |
|
| Fund Name |
Ave Maria Value Focused Fund
|
| Trading Symbol |
AVERX
|
| Annual or Semi-Annual Statement [Text Block] |
This semi-annual shareholder report contains important information about Ave Maria Value Focused Fund (the "Fund") for the period of January 1, 2025 to June 30, 2025.
|
| Shareholder Report Annual or Semi-Annual |
Semi-Annual Shareholder Report
|
| Additional Information [Text Block] |
You can find additional information about the Fund at https://avemariafunds.com/reports.php. You can also request this information by contacting us at (888) 726-9331.
|
| Material Fund Change Notice [Text Block] |
This report describes changes to the Fund that occurred during the reporting period.
|
| Additional Information Phone Number |
(888) 726-9331
|
| Additional Information Website |
<span style="font-weight: 700; box-sizing: border-box; color: rgb(0, 0, 0); display: inline; flex-wrap: nowrap; font-size: 10.6667px; grid-area: auto; line-height: 16px; margin: 0px; overflow: visible; text-align: left; text-align-last: left; white-space-collapse: preserve-breaks;">https://avemariafunds.com/reports.php</span>
|
| Expenses [Text Block] |
What were the Fund’s annualized costs for the last six months?(based on a hypothetical $10,000 investment) Fund Name | Costs of a $10,000 investment | Costs paid as a percentage of a $10,000 investment |
|---|
Ave Maria Value Focused Fund | $61 | 1.21% |
|---|
|
| Expenses Paid, Amount |
$ 61
|
| Expense Ratio, Percent |
1.21%
|
| Factors Affecting Performance [Text Block] |
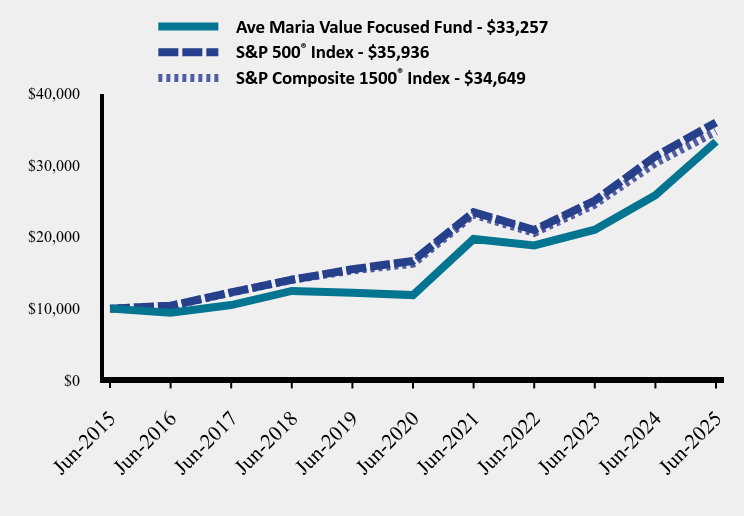
How did the Fund perform during the reporting period? The Ave Maria Value Focused Fund (“the Fund”) had a total return of 4.36% for the 6-months ended June 30, 2025, compared to the total return of 5.61% for the S&P 1500® Index. The Fund’s best performing stocks during the 6-month period included Wheaton Precious Metals Corporation (+53%), Franco-Nevada Corporation (+38%), and XPEL, Inc. (+30%). The main detractors from performance included YETI Holdings, Inc. (-23%), Chemed Corporation (-18%), and Simply Good Foods Company, Inc. (-12%). The Fund owns a diversified portfolio of 25 companies, across a broad array of industries, with an emphasis on industrials, energy, royalties, and real estate. Texas Pacific Land Corporation remains the largest holding in the Fund at 17.1% of net assets. The Fund continues to be managed with a long-term focus, using a value-oriented investment approach based upon fundamental security analysis. |
| Performance Past Does Not Indicate Future [Text] |
The Fund's past performance is not a good predictor of how the Fund will perform in the future.
|
| Line Graph [Table Text Block] |
| Ave Maria Value Focused Fund | S&P 500® Index | S&P Composite 1500® Index |
|---|
Jun-2015 | $10,000 | $10,000 | $10,000 |
|---|
Jun-2016 | $9,434 | $10,399 | $10,364 |
|---|
Jun-2017 | $10,495 | $12,260 | $12,239 |
|---|
Jun-2018 | $12,462 | $14,023 | $14,013 |
|---|
Jun-2019 | $12,225 | $15,483 | $15,318 |
|---|
Jun-2020 | $11,887 | $16,645 | $16,250 |
|---|
Jun-2021 | $19,693 | $23,436 | $23,095 |
|---|
Jun-2022 | $18,803 | $20,948 | $20,550 |
|---|
Jun-2023 | $20,989 | $25,053 | $24,504 |
|---|
Jun-2024 | $25,791 | $31,204 | $30,267 |
|---|
Jun-2025 | $33,257 | $35,936 | $34,649 |
|---|
|
| Average Annual Return [Table Text Block] |
| 6 Months | 1 Year | 5 Years | 10 Years |
|---|
Ave Maria Value Focused Fund | 4.36% | 28.95% | 22.85% | 12.77% |
|---|
S&P 500® Index | 6.20% | 15.16% | 16.64% | 13.65% |
|---|
S&P Composite 1500® Index | 5.61% | 14.48% | 16.35% | 13.23% |
|---|
|
| No Deduction of Taxes [Text Block] |
The graph and table do not reflect the deduction of taxes that a shareholder would pay on fund distributions or redemption of fund shares.
|
| Updated Performance Information Location [Text Block] |
Call (888) 726-9331 or visit https://avemariafunds.com/AVERX-value-focused.php for updated performance information.
|
| AssetsNet |
$ 93,258,718
|
| Holdings Count | Holding |
28
|
| Advisory Fees Paid, Amount |
$ 360,226
|
| InvestmentCompanyPortfolioTurnover |
18.00%
|
| Additional Fund Statistics [Text Block] |
- Net Assets$93,258,718
- Number of Portfolio Holdings28
- Total Expense Ratio1.21%
- Advisory Fee (net of recoupments)
$360,226
- Portfolio turnover (six months)18%
|
| Holdings [Text Block] |
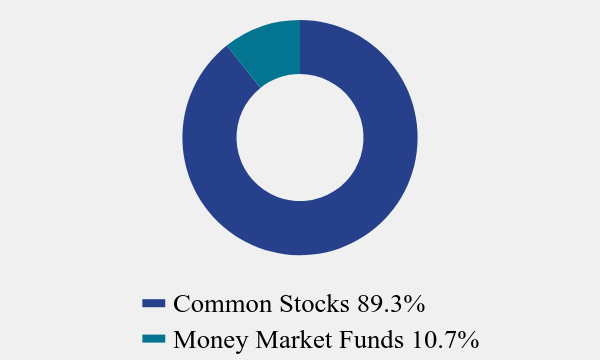
Asset Weighting (% of total investments)Value | Value |
|---|
Common Stocks | 89.3% | Money Market Funds | 10.7% |
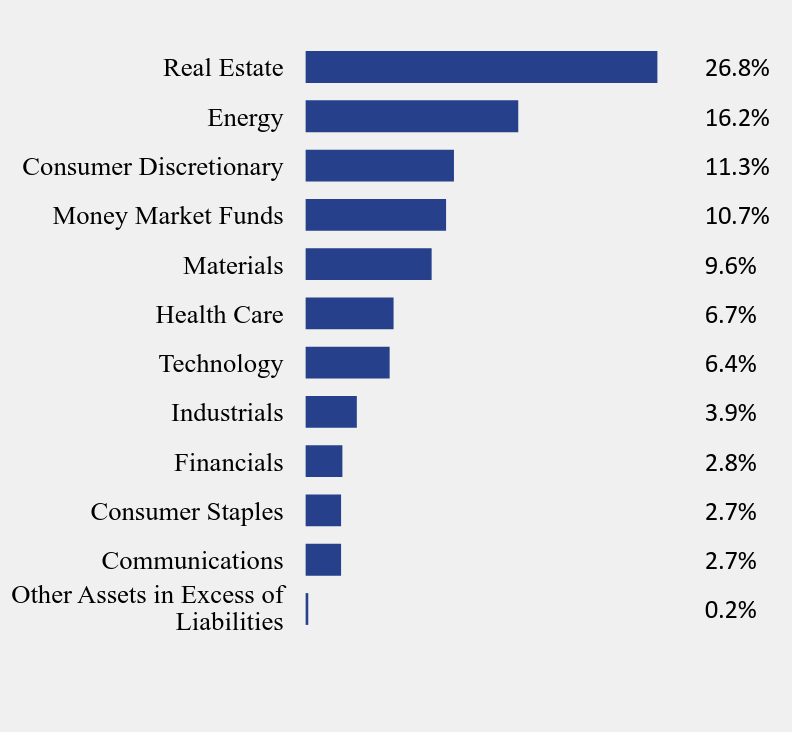
Sector Weighting (% of net assets)Value | Value |
|---|
Other Assets in Excess of Liabilities | 0.2% | Communications | 2.7% | Consumer Staples | 2.7% | Financials | 2.8% | Industrials | 3.9% | Technology | 6.4% | Health Care | 6.7% | Materials | 9.6% | Money Market Funds | 10.7% | Consumer Discretionary | 11.3% | Energy | 16.2% | Real Estate | 26.8% |
|
| Largest Holdings [Text Block] |
Top 10 Holdings (% of net assets)Holding Name | % of Net Assets |
|---|
Texas Pacific Land Corporation | 17.1% |
|---|
Landbridge Company, LLC - Class A | 6.2% |
|---|
Masco Corporation | 4.1% |
|---|
Chevron Corporation | 4.0% |
|---|
Franco-Nevada Corporation | 4.0% |
|---|
A.O. Smith Corporation | 3.9% |
|---|
Wheaton Precious Metals Corporation | 3.9% |
|---|
Chemed Corporation | 3.8% |
|---|
ConocoPhillips | 3.6% |
|---|
Schlumberger Ltd. | 3.5% |
|---|
|
| Material Fund Change [Text Block] |
During the period, shareholders of the Fund approved a new advisory agreement (with substantially similar terms as the existing advisory agreement) with the Adviser in connection with a change of control of the Adviser. Other than the change in the ownership structure of the Adviser, the operations of the Adviser stayed the same and the same personnel of the Adviser continue to provide investment advisory services to the Fund. The Fund also changed its name and ticker from Schwartz Value Focused Fund (RCMFX) to the Ave Maria Value Focused Fund (AVERX) and adopted a strategy to invest at least 80% of its net assets in morally responsible companies. |
| C000004203 |
|
| Shareholder Report [Line Items] |
|
| Fund Name |
Ave Maria Value Fund
|
| Trading Symbol |
AVEMX
|
| Annual or Semi-Annual Statement [Text Block] |
This semi-annual shareholder report contains important information about Ave Maria Value Fund (the "Fund") for the period of January 1, 2025 to June 30, 2025.
|
| Shareholder Report Annual or Semi-Annual |
Semi-Annual Shareholder Report
|
| Additional Information [Text Block] |
You can find additional information about the Fund at https://avemariafunds.com/reports.php. You can also request this information by contacting us at (888) 726-9331.
|
| Material Fund Change Notice [Text Block] |
This report describes changes to the Fund that occurred during the reporting period.
|
| Additional Information Phone Number |
(888) 726-9331
|
| Additional Information Website |
<span style="font-weight: 700; box-sizing: border-box; color: rgb(0, 0, 0); display: inline; flex-wrap: nowrap; font-size: 12px; grid-area: auto; line-height: 18px; margin: 0px; overflow: visible; text-align: left; text-align-last: left; white-space-collapse: preserve-breaks;">https://avemariafunds.com/reports.php</span>
|
| Expenses [Text Block] |
What were the Fund’s annualized costs for the last six months?(based on a hypothetical $10,000 investment) Fund Name | Costs of a $10,000 investment | Costs paid as a percentage of a $10,000 investment |
|---|
Ave Maria Value Fund | $46 | 0.91% |
|---|
|
| Expenses Paid, Amount |
$ 46
|
| Expense Ratio, Percent |
0.91%
|
| Performance Past Does Not Indicate Future [Text] |
The Fund's past performance is not a good predictor of how the Fund will perform in the future.
|
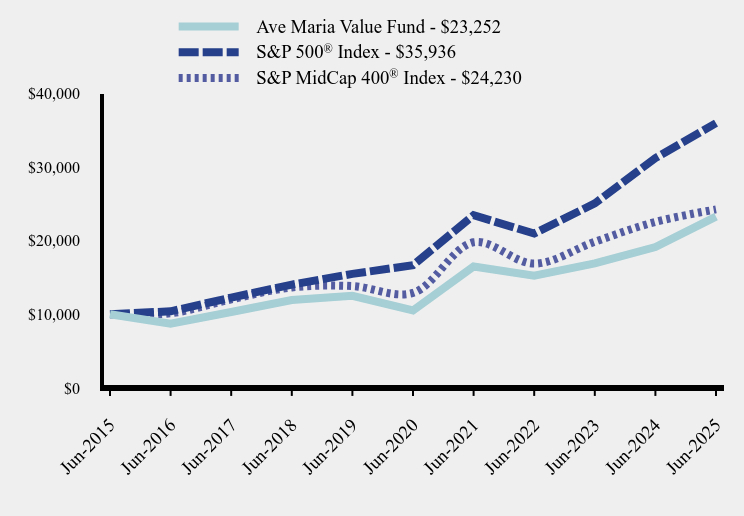
| Line Graph [Table Text Block] |
| Ave Maria Value Fund | S&P 500® Index | S&P MidCap 400® Index |
|---|
Jun-2015 | $10,000 | $10,000 | $10,000 |
|---|
Jun-2016 | $8,711 | $10,399 | $10,133 |
|---|
Jun-2017 | $10,299 | $12,260 | $12,014 |
|---|
Jun-2018 | $11,937 | $14,023 | $13,637 |
|---|
Jun-2019 | $12,502 | $15,483 | $13,822 |
|---|
Jun-2020 | $10,514 | $16,645 | $12,897 |
|---|
Jun-2021 | $16,481 | $23,436 | $19,763 |
|---|
Jun-2022 | $15,228 | $20,948 | $16,870 |
|---|
Jun-2023 | $16,906 | $25,053 | $19,840 |
|---|
Jun-2024 | $19,126 | $31,204 | $22,533 |
|---|
Jun-2025 | $23,252 | $35,936 | $24,230 |
|---|
|
| Average Annual Return [Table Text Block] |
Average Annual Total Returns as of 6/30/2025 | 6 Months | 1 Year | 5 Years | 10 Years |
|---|
Ave Maria Value Fund | 5.33% | 21.57% | 17.20% | 8.80% |
|---|
S&P 500® Index | 6.20% | 15.16% | 16.64% | 13.65% |
|---|
S&P MidCap 400® Index | 0.20% | 7.53% | 13.44% | 9.25% |
|---|
The Fund's past performance is not a good predictor of how the Fund will perform in the future. The graph and table do not reflect the deduction of taxes that a shareholder would pay on fund distributions or redemption of fund shares. Call (888) 726-9331 or visit https://avemariafunds.com/AVEMX-value.php for updated performance information. |
| No Deduction of Taxes [Text Block] |
The graph and table do not reflect the deduction of taxes that a shareholder would pay on fund distributions or redemption of fund shares.
|
| Updated Performance Information Location [Text Block] |
Call (888) 726-9331 or visit https://avemariafunds.com/AVEMX-value.php for updated performance information.
|
| AssetsNet |
$ 506,987,401
|
| Holdings Count | Holding |
32
|
| Advisory Fees Paid, Amount |
$ 1,813,699
|
| InvestmentCompanyPortfolioTurnover |
6.00%
|
| Additional Fund Statistics [Text Block] |
- Net Assets$506,987,401
- Number of Portfolio Holdings32
- Total Expense Ratio0.91%
- Advisory Fee
$1,813,699
- Portfolio turnover (six months)6%
|
| Holdings [Text Block] |
Asset Weighting (% of total investments)Value | Value |
|---|
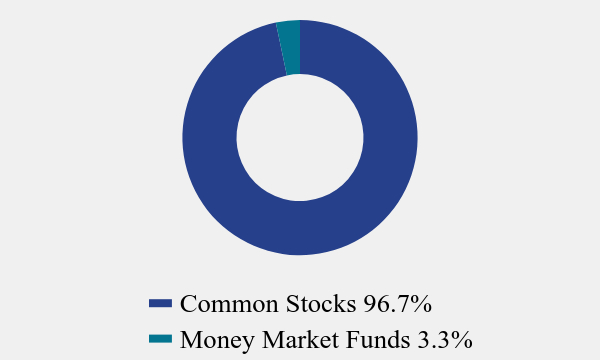
Common Stocks | 96.7% | Money Market Funds | 3.3% |
Top 10 Holdings (% of net assets)Holding Name | % of Net Assets |
|---|
Texas Pacific Land Corporation | 13.9% |
|---|
Haemonetics Corporation | 4.9% |
|---|
Landbridge Company, LLC - Class A | 4.7% |
|---|
TD SYNNEX Corporation | 4.5% |
|---|
Wheaton Precious Metals Corporation | 4.0% |
|---|
Hingham Institution For Savings (The) | 4.0% |
|---|
Brown & Brown, Inc. | 3.6% |
|---|
Mirion Technologies, Inc. | 3.5% |
|---|
CDW Corporation | 3.4% |
|---|
Expand Energy Corporation | 3.4% |
|---|
Sector Weighting (% of net assets)Value | Value |
|---|
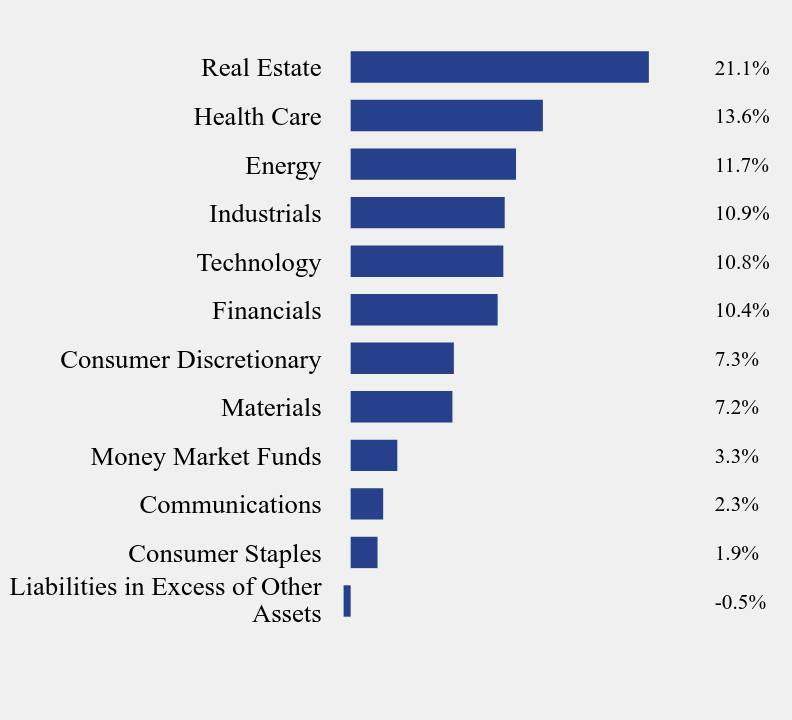
Liabilities in Excess of Other Assets | -0.5% | Consumer Staples | 1.9% | Communications | 2.3% | Money Market Funds | 3.3% | Materials | 7.2% | Consumer Discretionary | 7.3% | Financials | 10.4% | Technology | 10.8% | Industrials | 10.9% | Energy | 11.7% | Health Care | 13.6% | Real Estate | 21.1% |
|
| Material Fund Change [Text Block] |
During the period, shareholders of the Fund approved a new advisory agreement (with substantially similar terms as the existing advisory agreement) with the Adviser in connection with a change of control of the Adviser. Other than the change in the ownership structure of the Adviser, the operations of the Adviser stayed the same and the same personnel of the Adviser continue to provide investment advisory services to the Fund. |
| C000004204 |
|
| Shareholder Report [Line Items] |
|
| Fund Name |
Ave Maria Growth Fund
|
| Trading Symbol |
AVEGX
|
| Annual or Semi-Annual Statement [Text Block] |
This semi-annual shareholder report contains important information about Ave Maria Growth Fund (the "Fund") for the period of January 1, 2025 to June 30, 2025.
|
| Shareholder Report Annual or Semi-Annual |
Semi-Annual Shareholder Report
|
| Additional Information [Text Block] |
You can find additional information about the Fund at https://avemariafunds.com/reports.php. You can also request this information by contacting us at (888) 726-9331.
|
| Material Fund Change Notice [Text Block] |
This report describes changes to the Fund that occurred during the reporting period.
|
| Additional Information Phone Number |
(888) 726-9331
|
| Additional Information Website |
<span style="font-weight: 700; box-sizing: border-box; color: rgb(0, 0, 0); display: inline; flex-wrap: nowrap; font-size: 12px; grid-area: auto; line-height: 18px; margin: 0px; overflow: visible; text-align: left; text-align-last: left; white-space-collapse: preserve-breaks;">https://avemariafunds.com/reports.php</span>
|
| Expenses [Text Block] |
What were the Fund’s annualized costs for the last six months?(based on a hypothetical $10,000 investment) Fund Name | Costs of a $10,000 investment | Costs paid as a percentage of a $10,000 investment |
|---|
Ave Maria Growth Fund | $46 | 0.90% |
|---|
|
| Expenses Paid, Amount |
$ 46
|
| Expense Ratio, Percent |
0.90%
|
| Performance Past Does Not Indicate Future [Text] |
The Fund's past performance is not a good predictor of how the Fund will perform in the future.
|
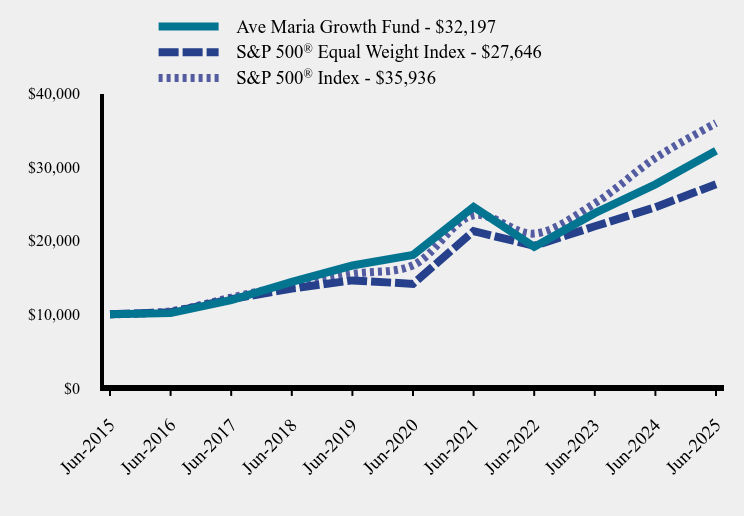
| Line Graph [Table Text Block] |
| Ave Maria Growth Fund | S&P 500® Equal Weight Index | S&P 500® Index |
|---|
Jun-2015 | $10,000 | $10,000 | $10,000 |
|---|
Jun-2016 | $10,151 | $10,273 | $10,399 |
|---|
Jun-2017 | $11,932 | $12,047 | $12,260 |
|---|
Jun-2018 | $14,384 | $13,490 | $14,023 |
|---|
Jun-2019 | $16,612 | $14,593 | $15,483 |
|---|
Jun-2020 | $18,047 | $14,119 | $16,645 |
|---|
Jun-2021 | $24,568 | $21,279 | $23,436 |
|---|
Jun-2022 | $19,137 | $19,283 | $20,948 |
|---|
Jun-2023 | $23,721 | $21,936 | $25,053 |
|---|
Jun-2024 | $27,630 | $24,523 | $31,204 |
|---|
Jun-2025 | $32,197 | $27,646 | $35,936 |
|---|
|
| Average Annual Return [Table Text Block] |
Average Annual Total Returns as of 6/30/2025 | 6 Months | 1 Year | 5 Years | 10 Years |
|---|
Ave Maria Growth Fund | 7.55% | 16.53% | 12.27% | 12.40% |
|---|
S&P 500® Equal Weight Index | 4.82% | 12.73% | 14.38% | 10.70% |
|---|
S&P 500® Index | 6.20% | 15.16% | 16.64% | 13.65% |
|---|
The Fund's past performance is not a good predictor of how the Fund will perform in the future. The graph and table do not reflect the deduction of taxes that a shareholder would pay on fund distributions or redemption of fund shares. Call (888) 726-9331 or visit https://avemariafunds.com/AVEGX-growth.php for updated performance information. |
| No Deduction of Taxes [Text Block] |
The graph and table do not reflect the deduction of taxes that a shareholder would pay on fund distributions or redemption of fund shares.
|
| Updated Performance Information Location [Text Block] |
Call (888) 726-9331 or visit https://avemariafunds.com/AVEGX-growth.php for updated performance information.
|
| AssetsNet |
$ 1,134,515,237
|
| Holdings Count | Holding |
31
|
| Advisory Fees Paid, Amount |
$ 3,999,913
|
| InvestmentCompanyPortfolioTurnover |
8.00%
|
| Additional Fund Statistics [Text Block] |
- Net Assets$1,134,515,237
- Number of Portfolio Holdings31
- Total Expense Ratio0.90%
- Advisory Fee
$3,999,913
- Portfolio turnover (six months)8%
|
| Holdings [Text Block] |
Asset Weighting (% of total investments)Value | Value |
|---|
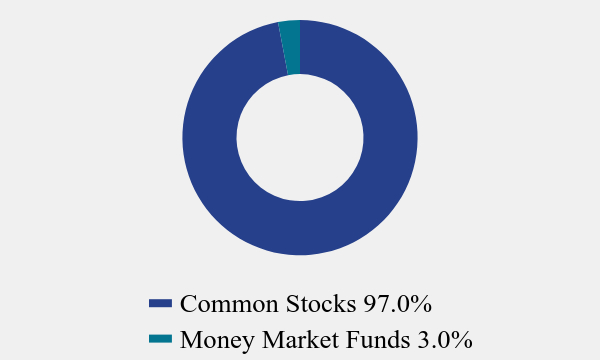
Common Stocks | 97.0% | Money Market Funds | 3.0% |
Top 10 Holdings (% of net assets)Holding Name | % of Net Assets |
|---|
NVIDIA Corporation | 8.6% |
|---|
API Group Corporation | 8.1% |
|---|
Mastercard, Inc. - Class A | 7.0% |
|---|
HEICO Corporation - Class A | 6.4% |
|---|
O'Reilly Automotive, Inc. | 6.1% |
|---|
Copart, Inc. | 4.9% |
|---|
Roper Technologies, Inc. | 4.8% |
|---|
S&P Global, Inc. | 4.5% |
|---|
Texas Instruments, Inc. | 4.4% |
|---|
AptarGroup, Inc. | 3.7% |
|---|
Sector Weighting (% of net assets)Value | Value |
|---|
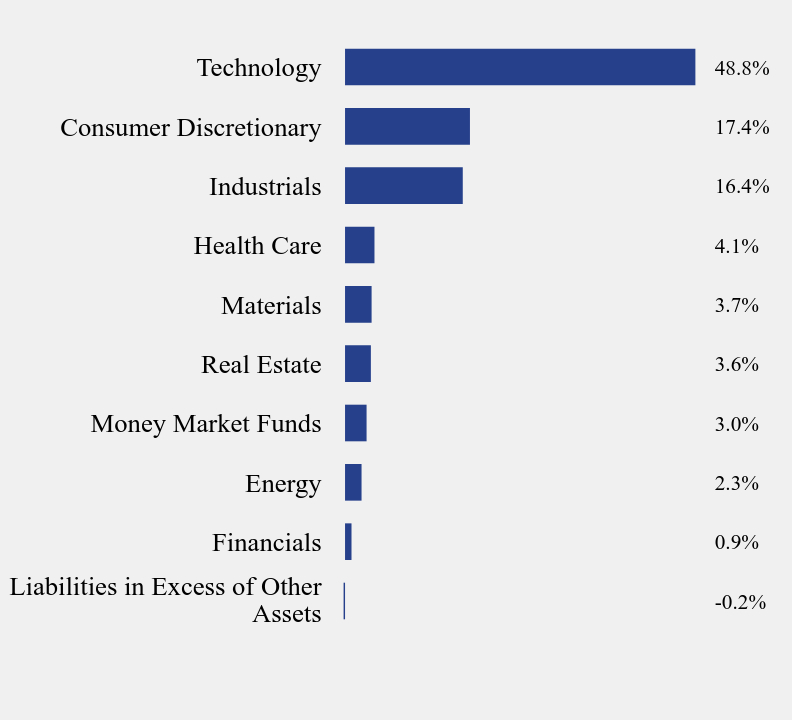
Liabilities in Excess of Other Assets | -0.2% | Financials | 0.9% | Energy | 2.3% | Money Market Funds | 3.0% | Real Estate | 3.6% | Materials | 3.7% | Health Care | 4.1% | Industrials | 16.4% | Consumer Discretionary | 17.4% | Technology | 48.8% |
|
| Material Fund Change [Text Block] |
During the period, shareholders of the Fund approved a new advisory agreement (with substantially similar terms as the existing advisory agreement) with the Adviser in connection with a change of control of the Adviser. Other than the change in the ownership structure of the Adviser, the operations of the Adviser stayed the same and the same personnel of the Adviser continue to provide investment advisory services to the Fund. |
| C000004205 |
|
| Shareholder Report [Line Items] |
|
| Fund Name |
Ave Maria Rising Dividend Fund
|
| Trading Symbol |
AVEDX
|
| Annual or Semi-Annual Statement [Text Block] |
This semi-annual shareholder report contains important information about Ave Maria Rising Dividend Fund (the "Fund") for the period of January 1, 2025 to June 30, 2025.
|
| Shareholder Report Annual or Semi-Annual |
Semi-Annual Shareholder Report
|
| Additional Information [Text Block] |
You can find additional information about the Fund at https://avemariafunds.com/reports.php. You can also request this information by contacting us at (888) 726-9331.
|
| Material Fund Change Notice [Text Block] |
This report describes changes to the Fund that occurred during the reporting period.
|
| Additional Information Phone Number |
(888) 726-9331
|
| Additional Information Website |
<span style="font-weight: 700; box-sizing: border-box; color: rgb(0, 0, 0); display: inline; flex-wrap: nowrap; font-size: 10.6667px; grid-area: auto; line-height: 16px; margin: 0px; overflow: visible; text-align: left; text-align-last: left; white-space-collapse: preserve-breaks;">https://avemariafunds.com/reports.php</span>
|
| Expenses [Text Block] |
What were the Fund’s annualized costs for the last six months?(based on a hypothetical $10,000 investment) Fund Name | Costs of a $10,000 investment | Costs paid as a percentage of a $10,000 investment |
|---|
Ave Maria Rising Dividend Fund | $45 | 0.90% |
|---|
|
| Expenses Paid, Amount |
$ 45
|
| Expense Ratio, Percent |
0.90%
|
| Performance Past Does Not Indicate Future [Text] |
The Fund's past performance is not a good predictor of how the Fund will perform in the future.
|
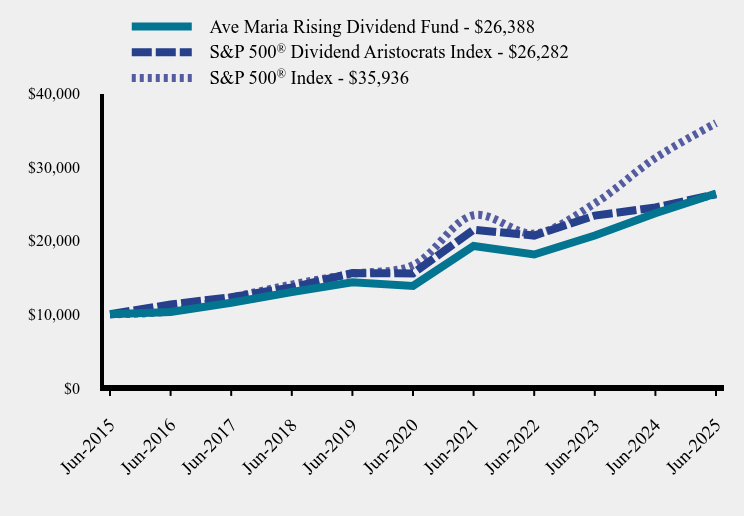
| Line Graph [Table Text Block] |
| Ave Maria Rising Dividend Fund | S&P 500® Dividend Aristocrats Index | S&P 500® Index |
|---|
Jun-2015 | $10,000 | $10,000 | $10,000 |
|---|
Jun-2016 | $10,306 | $11,326 | $10,399 |
|---|
Jun-2017 | $11,554 | $12,318 | $12,260 |
|---|
Jun-2018 | $13,022 | $13,638 | $14,023 |
|---|
Jun-2019 | $14,325 | $15,590 | $15,483 |
|---|
Jun-2020 | $13,846 | $15,543 | $16,645 |
|---|
Jun-2021 | $19,269 | $21,469 | $23,436 |
|---|
Jun-2022 | $18,115 | $20,678 | $20,948 |
|---|
Jun-2023 | $20,691 | $23,394 | $25,053 |
|---|
Jun-2024 | $23,715 | $24,487 | $31,204 |
|---|
Jun-2025 | $26,388 | $26,282 | $35,936 |
|---|
|
| Average Annual Return [Table Text Block] |
Average Annual Total Returns as of 6/30/2025 | 6 Months | 1 Year | 5 Years | 10 Years |
|---|
Ave Maria Rising Dividend Fund | 3.65% | 11.27% | 13.77% | 10.19% |
|---|
S&P 500® Dividend Aristocrats Index | 2.42% | 7.33% | 11.08% | 10.15% |
|---|
S&P 500® Index | 6.20% | 15.16% | 16.64% | 13.65% |
|---|
The Fund's past performance is not a good predictor of how the Fund will perform in the future. The graph and table do not reflect the deduction of taxes that a shareholder would pay on fund distributions or redemption of fund shares. Call (888) 726-9331 or visit https://avemariafunds.com/AVEDX-rising-dividend.php for updated performance information. |
| No Deduction of Taxes [Text Block] |
The graph and table do not reflect the deduction of taxes that a shareholder would pay on fund distributions or redemption of fund shares.
|
| Updated Performance Information Location [Text Block] |
Call (888) 726-9331 or visit https://avemariafunds.com/AVEDX-rising-dividend.php for updated performance information.
|
| AssetsNet |
$ 1,084,018,878
|
| Holdings Count | Holding |
36
|
| Advisory Fees Paid, Amount |
$ 4,011,705
|
| InvestmentCompanyPortfolioTurnover |
5.00%
|
| Additional Fund Statistics [Text Block] |
- Net Assets$1,084,018,878
- Number of Portfolio Holdings36
- Total Expense Ratio0.90%
- Advisory Fee
$4,011,705
- Portfolio turnover (six months)5%
|
| Holdings [Text Block] |
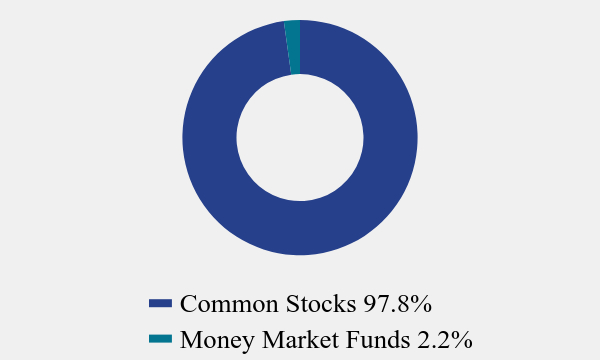
Asset Weighting (% of total investments)Value | Value |
|---|
Common Stocks | 97.8% | Money Market Funds | 2.2% |
Top 10 Holdings (% of net assets)Holding Name | % of Net Assets |
|---|
Texas Pacific Land Corporation | 5.4% |
|---|
Chubb Ltd. | 4.1% |
|---|
Mastercard, Inc. - Class A | 3.9% |
|---|
Texas Instruments, Inc. | 3.8% |
|---|
Moody's Corporation | 3.7% |
|---|
Brown & Brown, Inc. | 3.6% |
|---|
Fastenal Company | 3.5% |
|---|
Broadridge Financial Solutions, Inc. | 3.4% |
|---|
Genuine Parts Company | 3.4% |
|---|
Accenture plc - Class A | 3.4% |
|---|
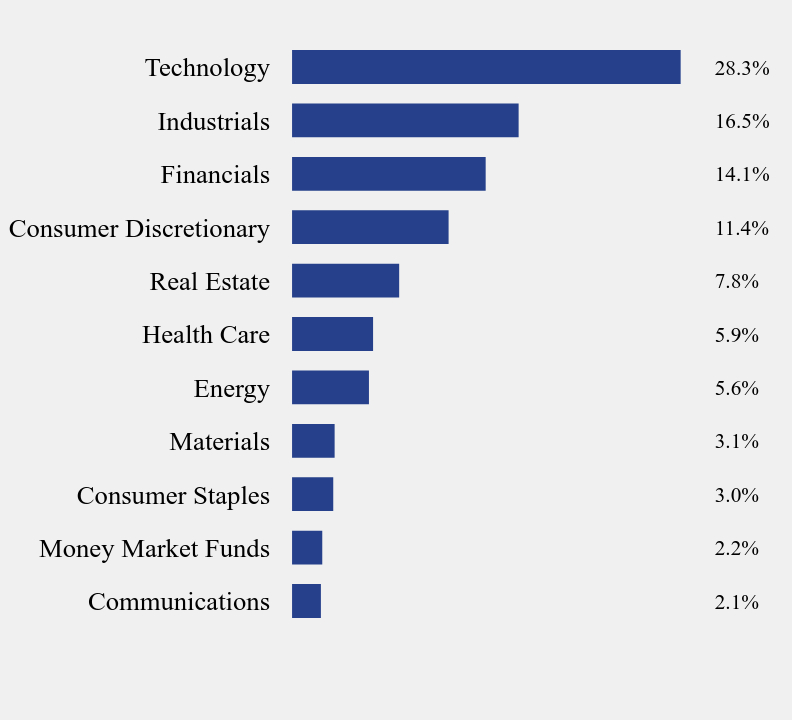
Sector Weighting (% of net assets)Value | Value |
|---|
Communications | 2.1% | Money Market Funds | 2.2% | Consumer Staples | 3.0% | Materials | 3.1% | Energy | 5.6% | Health Care | 5.9% | Real Estate | 7.8% | Consumer Discretionary | 11.4% | Financials | 14.1% | Industrials | 16.5% | Technology | 28.3% |
|
| Material Fund Change [Text Block] |
During the period, shareholders of the Fund approved a new advisory agreement (with substantially similar terms as the existing advisory agreement) with the Adviser in connection with a change of control of the Adviser. Other than the change in the ownership structure of the Adviser, the operations of the Adviser stayed the same and the same personnel of the Adviser continue to provide investment advisory services to the Fund. |
| C000088418 |
|
| Shareholder Report [Line Items] |
|
| Fund Name |
Ave Maria World Equity Fund
|
| Trading Symbol |
AVEWX
|
| Annual or Semi-Annual Statement [Text Block] |
This semi-annual shareholder report contains important information about Ave Maria World Equity Fund (the "Fund") for the period of January 1, 2025 to June 30, 2025.
|
| Shareholder Report Annual or Semi-Annual |
Semi-Annual Shareholder Report
|
| Additional Information [Text Block] |
You can find additional information about the Fund at https://avemariafunds.com/reports.php. You can also request this information by contacting us at (888) 726-9331.
|
| Material Fund Change Notice [Text Block] |
This report describes changes to the Fund that occurred during the reporting period.
|
| Additional Information Phone Number |
(888) 726-9331
|
| Additional Information Website |
<span style="font-weight: 700; box-sizing: border-box; color: rgb(0, 0, 0); display: inline; flex-wrap: nowrap; font-size: 10.6667px; grid-area: auto; line-height: 16px; margin: 0px; overflow: visible; text-align: left; text-align-last: left; white-space-collapse: preserve-breaks;">https://avemariafunds.com/reports.php</span>
|
| Expenses [Text Block] |
What were the Fund’s annualized costs for the last six months?(based on a hypothetical $10,000 investment) Fund Name | Costs of a $10,000 investment | Costs paid as a percentage of a $10,000 investment |
|---|
Ave Maria World Equity Fund | $54 | 1.04% |
|---|
|
| Expenses Paid, Amount |
$ 54
|
| Expense Ratio, Percent |
1.04%
|
| Performance Past Does Not Indicate Future [Text] |
The Fund's past performance is not a good predictor of how the Fund will perform in the future.
|
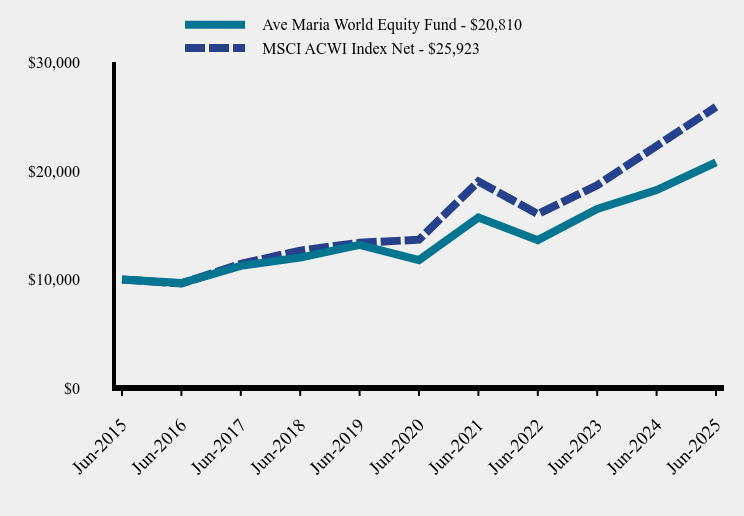
| Line Graph [Table Text Block] |
| Ave Maria World Equity Fund | MSCI ACWI Index Net |
|---|
Jun-2015 | $10,000 | $10,000 |
|---|
Jun-2016 | $9,668 | $9,627 |
|---|
Jun-2017 | $11,260 | $11,436 |
|---|
Jun-2018 | $12,024 | $12,662 |
|---|
Jun-2019 | $13,192 | $13,389 |
|---|
Jun-2020 | $11,790 | $13,672 |
|---|
Jun-2021 | $15,713 | $19,040 |
|---|
Jun-2022 | $13,628 | $16,041 |
|---|
Jun-2023 | $16,499 | $18,693 |
|---|
Jun-2024 | $18,252 | $22,315 |
|---|
Jun-2025 | $20,810 | $25,923 |
|---|
|
| Average Annual Return [Table Text Block] |
Average Annual Total Returns as of 6/30/2025 | 6 Months | 1 Year | 5 Years | 10 Years |
|---|
Ave Maria World Equity Fund | 11.16% | 14.01% | 12.03% | 7.60% |
|---|
MSCI ACWI Index Net | 10.05% | 16.17% | 13.65% | 9.99% |
|---|
The Fund's past performance is not a good predictor of how the Fund will perform in the future. The graph and table do not reflect the deduction of taxes that a shareholder would pay on fund distributions or redemption of fund shares. Call (888) 726-9331 or visit https://avemariafunds.com/AVEWX-world-equity.php for updated performance information. |
| No Deduction of Taxes [Text Block] |
The graph and table do not reflect the deduction of taxes that a shareholder would pay on fund distributions or redemption of fund shares.
|
| Updated Performance Information Location [Text Block] |
Call (888) 726-9331 or visit https://avemariafunds.com/AVEWX-world-equity.php for updated performance information.
|
| AssetsNet |
$ 130,912,398
|
| Holdings Count | Holding |
51
|
| Advisory Fees Paid, Amount |
$ 439,800
|
| InvestmentCompanyPortfolioTurnover |
7.00%
|
| Additional Fund Statistics [Text Block] |
Net Assets | $130,912,398 |
|---|
Number of Portfolio Holdings | 51 |
|---|
Total Expense Ratio | 1.04% |
|---|
Advisory Fee
| $439,800 |
|---|
Portfolio turnover (six months) | 7% |
|---|
|
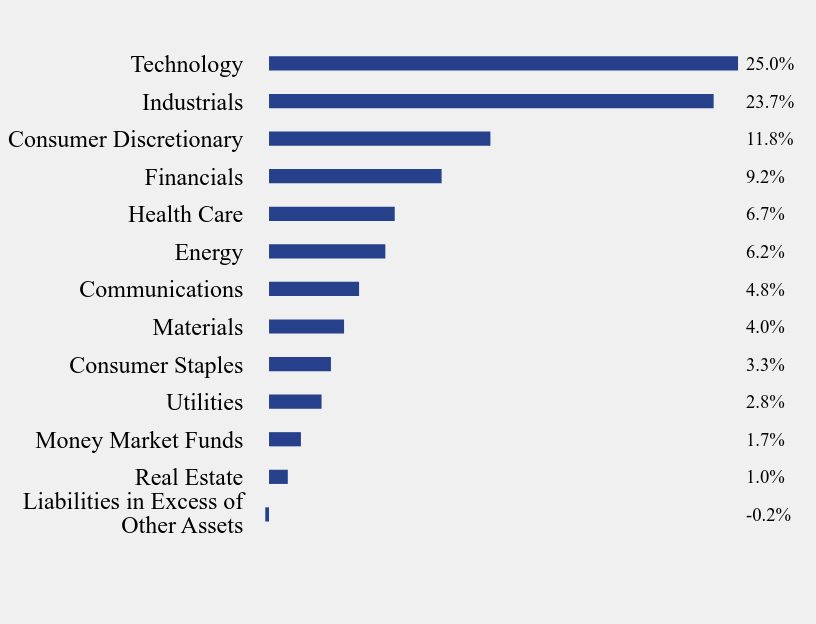
| Holdings [Text Block] |
Sector Weighting (% of net assets)Value | Value |
|---|
Liabilities in Excess of Other Assets | -0.2% | Real Estate | 1.0% | Money Market Funds | 1.7% | Utilities | 2.8% | Consumer Staples | 3.3% | Materials | 4.0% | Communications | 4.8% | Energy | 6.2% | Health Care | 6.7% | Financials | 9.2% | Consumer Discretionary | 11.8% | Industrials | 23.7% | Technology | 25.0% |
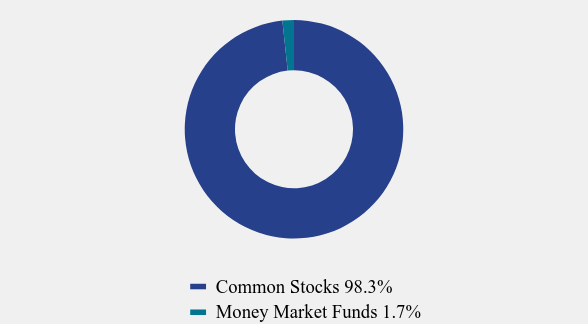
Asset Weighting (% of total investments)Value | Value |
|---|
Common Stocks | 98.3% | Money Market Funds | 1.7% |
Top 10 Holdings (% of net assets)Holding Name | % of Net Assets |
|---|
SAP SE | 5.1% |
|---|
Mastercard, Inc. - Class A | 4.3% |
|---|
Eaton Corporation plc | 4.3% |
|---|
GFL Environmental, Inc. | 4.1% |
|---|
SharkNinja, Inc. | 3.8% |
|---|
Taiwan Semiconductor Manufacturing Company Ltd. - ADR | 3.6% |
|---|
StoneCo Ltd. - Class A | 3.4% |
|---|
HDFC Bank Ltd. - ADR | 2.9% |
|---|
Hammond Power Solutions, Inc. - Class A | 2.9% |
|---|
Comfort Systems USA, Inc. | 2.7% |
|---|
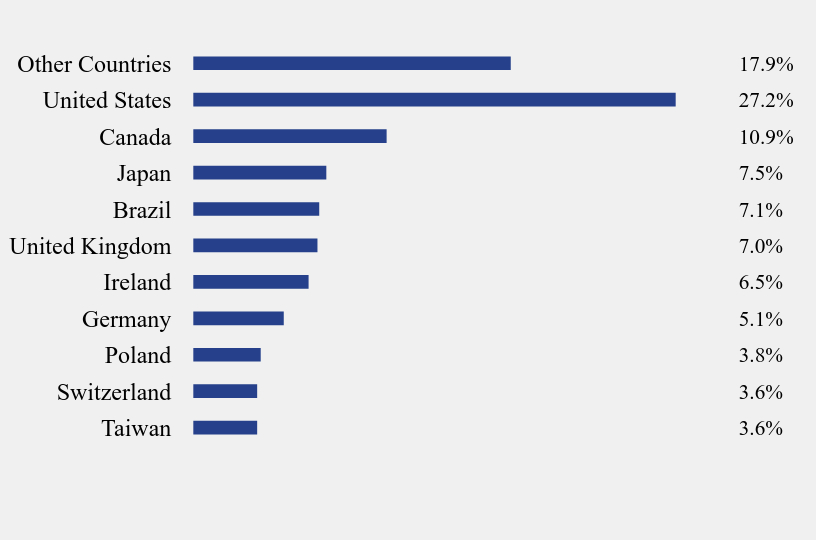
Country Weighting (% of net assets)Value | Value |
|---|
Taiwan | 3.6% | Switzerland | 3.6% | Poland | 3.8% | Germany | 5.1% | Ireland | 6.5% | United Kingdom | 7.0% | Brazil | 7.1% | Japan | 7.5% | Canada | 10.9% | United States | 27.2% | Other Countries | 17.9% |
|
| Material Fund Change [Text Block] |
During the period, shareholders of the Fund approved a new advisory agreement (with substantially similar terms as the existing advisory agreement) with the Adviser in connection with a change of control of the Adviser. Other than the change in the ownership structure of the Adviser, the operations of the Adviser stayed the same and the same personnel of the Adviser continue to provide investment advisory services to the Fund.
|
| C000219050 |
|
| Shareholder Report [Line Items] |
|
| Fund Name |
Ave Maria Growth Focused Fund
|
| Trading Symbol |
AVEAX
|
| Annual or Semi-Annual Statement [Text Block] |
This semi-annual shareholder report contains important information about Ave Maria Growth Focused Fund (the "Fund") for the period of January 1, 2025 to June 30, 2025.
|
| Shareholder Report Annual or Semi-Annual |
Semi-Annual Shareholder Report
|
| Additional Information [Text Block] |
You can find additional information about the Fund at https://avemariafunds.com/reports.php. You can also request this information by contacting us at (888) 726-9331.
|
| Material Fund Change Notice [Text Block] |
This report describes changes to the Fund that occurred during the reporting period.
|
| Additional Information Phone Number |
(888) 726-9331
|
| Additional Information Website |
<span style="font-weight: 700; box-sizing: border-box; color: rgb(0, 0, 0); display: inline; flex-wrap: nowrap; font-size: 10.6667px; grid-area: auto; line-height: 16px; margin: 0px; overflow: visible; text-align: left; text-align-last: left; white-space-collapse: preserve-breaks;">https://avemariafunds.com/reports.php</span>
|
| Expenses [Text Block] |
What were the Fund’s annualized costs for the last six months?(based on a hypothetical $10,000 investment) Fund Name | Costs of a $10,000 investment | Costs paid as a percentage of a $10,000 investment |
|---|
Ave Maria Growth Focused Fund | $57 | 1.10% |
|---|
|
| Expenses Paid, Amount |
$ 57
|
| Expense Ratio, Percent |
1.10%
|
| Performance Past Does Not Indicate Future [Text] |
The Fund's past performance is not a good predictor of how the Fund will perform in the future.
|
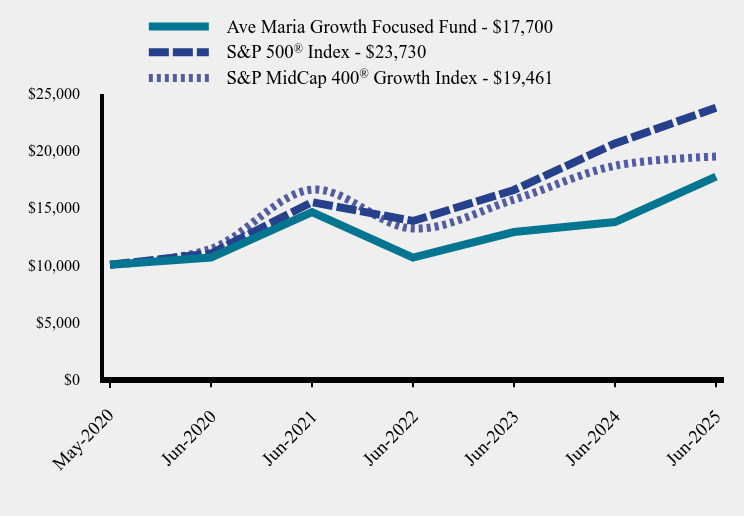
| Line Graph [Table Text Block] |
| Ave Maria Growth Focused Fund | S&P 500® Index | S&P MidCap 400® Growth Index |
|---|
May-2020 | $10,000 | $10,000 | $10,000 |
|---|
Jun-2020 | $10,630 | $10,992 | $11,393 |
|---|
Jun-2021 | $14,598 | $15,476 | $16,569 |
|---|
Jun-2022 | $10,628 | $13,833 | $13,172 |
|---|
Jun-2023 | $12,863 | $16,543 | $15,704 |
|---|
Jun-2024 | $13,734 | $20,606 | $18,659 |
|---|
Jun-2025 | $17,700 | $23,730 | $19,461 |
|---|
|
| Average Annual Return [Table Text Block] |
Average Annual Total Returns as of 6/30/2025 | 6 Months | 1 Year | 5 Years | Since Inception (May 1, 2020) |
|---|
Ave Maria Growth Focused Fund | 10.26% | 28.88% | 10.74% | 11.69% |
|---|
S&P 500® Index | 6.20% | 15.16% | 16.64% | 18.21% |
|---|
S&P MidCap 400® Growth Index | 0.48% | 4.30% | 11.30% | 13.76% |
|---|
The Fund's past performance is not a good predictor of how the Fund will perform in the future. The graph and table do not reflect the deduction of taxes that a shareholder would pay on fund distributions or redemption of fund shares. Call (888) 726-9331 or visit https://avemariafunds.com/AVEAX-growth-focused.php for updated performance information. |
| Performance Inception Date |
May 01, 2020
|
| No Deduction of Taxes [Text Block] |
The graph and table do not reflect the deduction of taxes that a shareholder would pay on fund distributions or redemption of fund shares.
|
| Updated Performance Information Location [Text Block] |
Call (888) 726-9331 or visit https://avemariafunds.com/AVEAX-growth-focused.php for updated performance information.
|
| AssetsNet |
$ 67,315,732
|
| Holdings Count | Holding |
16
|
| Advisory Fees Paid, Amount |
$ 222,791
|
| InvestmentCompanyPortfolioTurnover |
11.00%
|
| Additional Fund Statistics [Text Block] |
- Net Assets$67,315,732
- Number of Portfolio Holdings16
- Total Expense Ratio1.10%
- Advisory Fee
$222,791
- Portfolio turnover (six months)11%
|
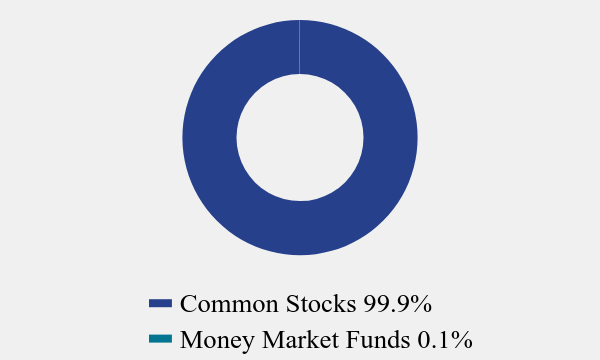
| Holdings [Text Block] |
Asset Weighting (% of total investments)Value | Value |
|---|
Common Stocks | 99.9% | Money Market Funds | 0.1% |
Top 10 Holdings (% of net assets)Holding Name | % of Net Assets |
|---|
API Group Corporation | 21.9% |
|---|
eDreams ODIGEO S.A. | 17.9% |
|---|
Brookfield Corporation | 7.8% |
|---|
Brookfield Wealth Solutions Ltd. | 7.8% |
|---|
GFL Environmental, Inc. | 7.7% |
|---|
SigmaRoc plc | 6.7% |
|---|
Landbridge Company, LLC - Class A | 5.4% |
|---|
Secure Waste Infrastructure Corporation | 5.4% |
|---|
Apollo Global Management, Inc. | 4.7% |
|---|
DigitalBridge Group, Inc. | 3.9% |
|---|
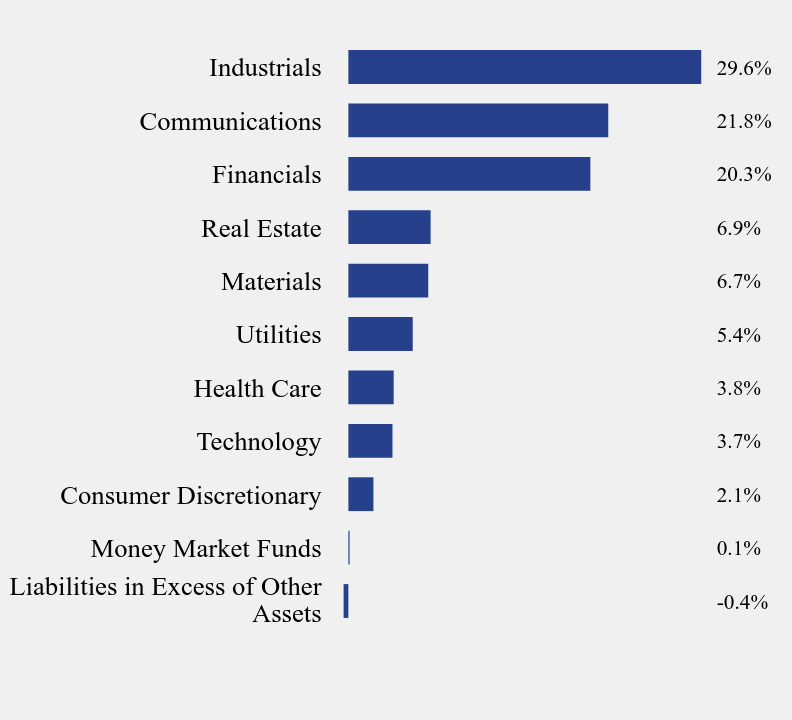
Sector Weighting (% of net assets)Value | Value |
|---|
Liabilities in Excess of Other Assets | -0.4% | Money Market Funds | 0.1% | Consumer Discretionary | 2.1% | Technology | 3.7% | Health Care | 3.8% | Utilities | 5.4% | Materials | 6.7% | Real Estate | 6.9% | Financials | 20.3% | Communications | 21.8% | Industrials | 29.6% |
|
| Material Fund Change [Text Block] |
During the period, shareholders of the Fund approved a new advisory agreement (with substantially similar terms as the existing advisory agreement) with the Adviser in connection with a change of control of the Adviser. Other than the change in the ownership structure of the Adviser, the operations of the Adviser stayed the same and the same personnel of the Adviser continue to provide investment advisory services to the Fund. The Fund also changed its name from the Ave Maria Focused Fund to the Ave Maria Growth Focused Fund. |
| C000004207 |
|
| Shareholder Report [Line Items] |
|
| Fund Name |
Ave Maria Bond Fund
|
| Trading Symbol |
AVEFX
|
| Annual or Semi-Annual Statement [Text Block] |
This semi-annual shareholder report contains important information about Ave Maria Bond Fund (the "Fund") for the period of January 1, 2025 to June 30, 2025.
|
| Shareholder Report Annual or Semi-Annual |
Semi-Annual Shareholder Report
|
| Additional Information [Text Block] |
You can find additional information about the Fund at https://avemariafunds.com/reports.php. You can also request this information by contacting us at (888) 726-9931.
|
| Material Fund Change Notice [Text Block] |
This report describes changes to the Fund that occurred during the reporting period.
|
| Additional Information Phone Number |
(888) 726-9931
|
| Additional Information Website |
<span style="font-weight: 700; box-sizing: border-box; color: rgb(0, 0, 0); display: inline; flex-wrap: nowrap; font-size: 12px; grid-area: auto; line-height: 18px; margin: 0px; overflow: visible; text-align: left; text-align-last: left; white-space-collapse: preserve-breaks;">https://avemariafunds.com/reports.php</span>
|
| Expenses [Text Block] |
What were the Fund’s annualized costs for the last six months?(based on a hypothetical $10,000 investment) Fund Name | Costs of a $10,000 investment | Costs paid as a percentage of a $10,000 investment |
|---|
Ave Maria Bond Fund | $20 | 0.40% |
|---|
|
| Expenses Paid, Amount |
$ 20
|
| Expense Ratio, Percent |
0.40%
|
| Performance Past Does Not Indicate Future [Text] |
The Fund's past performance is not a good predictor of how the Fund will perform in the future.
|
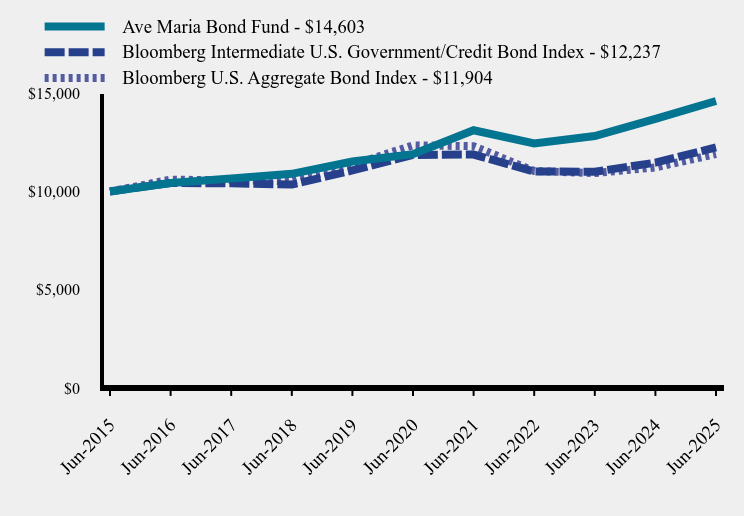
| Line Graph [Table Text Block] |
| Ave Maria Bond Fund | Bloomberg Intermediate U.S. Government/Credit Bond Index | Bloomberg U.S. Aggregate Bond Index |
|---|
Jun-2015 | $10,000 | $10,000 | $10,000 |
|---|
Jun-2016 | $10,434 | $10,433 | $10,600 |
|---|
Jun-2017 | $10,661 | $10,411 | $10,567 |
|---|
Jun-2018 | $10,895 | $10,351 | $10,525 |
|---|
Jun-2019 | $11,521 | $11,068 | $11,353 |
|---|
Jun-2020 | $11,896 | $11,856 | $12,345 |
|---|
Jun-2021 | $13,113 | $11,879 | $12,304 |
|---|
Jun-2022 | $12,446 | $11,014 | $11,038 |
|---|
Jun-2023 | $12,822 | $11,003 | $10,934 |
|---|
Jun-2024 | $13,690 | $11,465 | $11,222 |
|---|
Jun-2025 | $14,603 | $12,237 | $11,904 |
|---|
|
| Average Annual Return [Table Text Block] |
Average Annual Total Returns as of 6/30/2025 | 6 Months | 1 Year | 5 Years | 10 Years |
|---|
Ave Maria Bond Fund | 3.42% | 6.67% | 4.19% | 3.86% |
|---|
Bloomberg Intermediate U.S. Government/Credit Bond Index | 4.13% | 6.74% | 0.64% | 2.04% |
|---|
Bloomberg U.S. Aggregate Bond Index | 4.02% | 6.08% | -0.73% | 1.76% |
|---|
The Fund's past performance is not a good predictor of how the Fund will perform in the future. The graph and table do not reflect the deduction of taxes that a shareholder would pay on fund distributions or redemption of fund shares. Call (888) 726-9931 or visit https://avemariafunds.com/AVEFX-bond.php for updated performance information. |
| No Deduction of Taxes [Text Block] |
The graph and table do not reflect the deduction of taxes that a shareholder would pay on fund distributions or redemption of fund shares.
|
| Updated Performance Information Location [Text Block] |
Call (888) 726-9931 or visit https://avemariafunds.com/AVEFX-bond.php for updated performance information.
|
| AssetsNet |
$ 752,442,215
|
| Holdings Count | Holding |
178
|
| Advisory Fees Paid, Amount |
$ 894,008
|
| InvestmentCompanyPortfolioTurnover |
8.00%
|
| Additional Fund Statistics [Text Block] |
- Net Assets$752,442,215
- Number of Portfolio Holdings178
- Total Expense Ratio0.40%
- Advisory Fee
$894,008
- Portfolio turnover (six months)8%
|
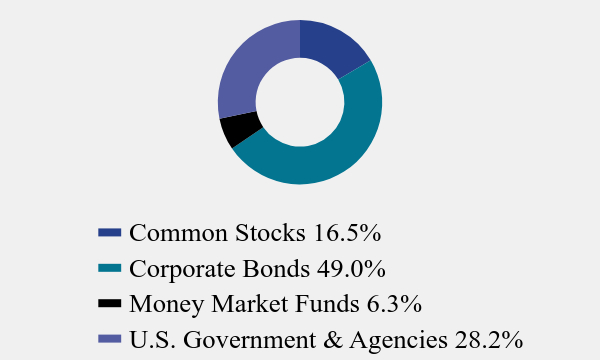
| Holdings [Text Block] |
Asset Weighting (% of total investments)Value | Value |
|---|
Common Stocks | 16.5% | Corporate Bonds | 49.0% | Money Market Funds | 6.3% | U.S. Government & Agencies | 28.2% |
Top 10 Holdings (% of net assets)Holding Name | % of Net Assets |
|---|
Coca-Cola Europacific Partners plc | 1.9% |
|---|
Watsco, Inc. | 1.5% |
|---|
Western Union Company (The) | 1.4% |
|---|
Illinois Tool Works, Inc., 2.650%, due 11/15/26 | 1.4% |
|---|
U.S. Treasury Notes, 4.625%, due 09/30/30 | 1.4% |
|---|
U.S. Treasury Notes, 4.500%, due 11/15/33 | 1.4% |
|---|
U.S. Treasury Notes, 4.375%, due 01/31/32 | 1.4% |
|---|
U.S. Treasury Notes, 4.250%, due 06/30/29 | 1.4% |
|---|
U.S. Treasury Notes, 4.125%, due 07/31/28 | 1.3% |
|---|
U.S. Treasury Notes, 4.125%, due 07/31/31 | 1.3% |
|---|
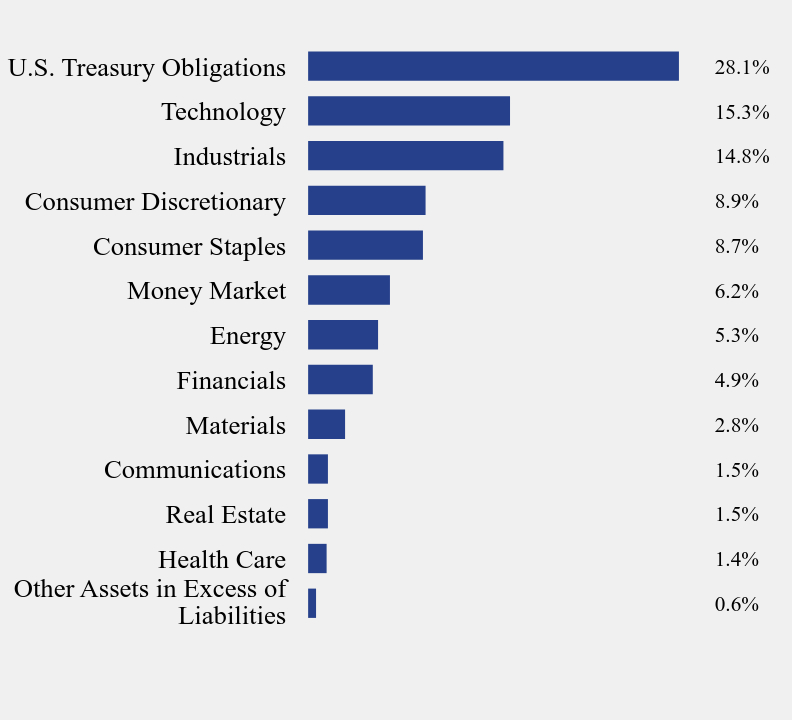
Sector Weighting (% of net assets)Value | Value |
|---|
Other Assets in Excess of Liabilities | 0.6% | Health Care | 1.4% | Real Estate | 1.5% | Communications | 1.5% | Materials | 2.8% | Financials | 4.9% | Energy | 5.3% | Money Market | 6.2% | Consumer Staples | 8.7% | Consumer Discretionary | 8.9% | Industrials | 14.8% | Technology | 15.3% | U.S. Treasury Obligations | 28.1% |
|
| Material Fund Change [Text Block] |
During the period, shareholders of the Fund approved a new advisory agreement (with substantially similar terms as the existing advisory agreement) with the Adviser in connection with a change of control of the Adviser. Other than the change in the ownership structure of the Adviser, the operations of the Adviser stayed the same and the same personnel of the Adviser continue to provide investment advisory services to the Fund. Also, Mr. James T. Peregoy, CFA, Portfolio Manager and Head Trader of the Adviser, was added as a co-portfolio manager of the Fund. |