Shareholder Report
Jun. 30, 2025
USD ($)
Holding
invesco.com/reports
. You can also request this information by contacting us at
(800) 959-4246.
What Were The Fund Costs For The Last
Six Months
?
(Based on a hypothetical $10,000 investment)
Fund (Class) | Costs of a $10,000 investment | Costs paid as a percentage of a $10,000 investment* |
| Invesco Oppenheimer V.I. International Growth Fund (Series I) | $ 53 | 1.00 % † |
* | Annualized. |
† | Reflects fee waivers and/or expense reimbursements, without which expenses would have been higher. |
What Are Key Statistics About The Fund?
(as of June 30, 2025)
| Fund net assets | $ 317,591,332 |
| Total number of portfolio holdings | 63 |
| Portfolio turnover rate | 28 % |
What Comprised The Fund's Holdings?
(as of June 30, 2025)
Top ten holdings*
(% of net assets)
| Taiwan Semiconductor Manufacturing Co. Ltd. | 3.65 % |
| Dollarama, Inc. | 3.46 % |
| BAE Systems PLC | 3.02 % |
| Reliance Industries Ltd. | 2.90 % |
| ResMed, Inc. | 2.84 % |
| Siemens AG | 2.78 % |
| Universal Music Group N.V. | 2.77 % |
| Tencent Holdings Ltd. | 2.64 % |
| AstraZeneca PLC | 2.39 % |
| Sartorius Stedim Biotech | 2.38 % |
| * Excluding money market fund holdings, if any. |
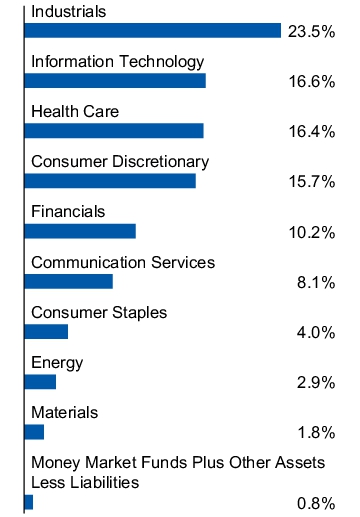
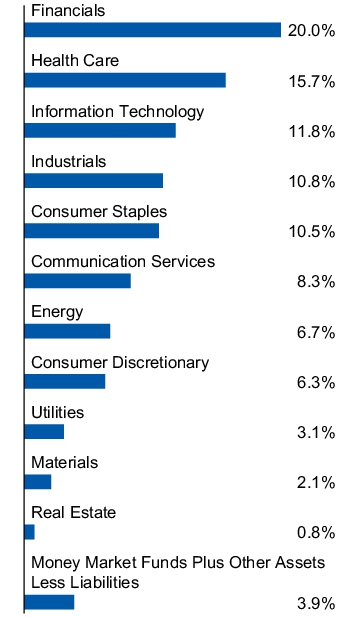
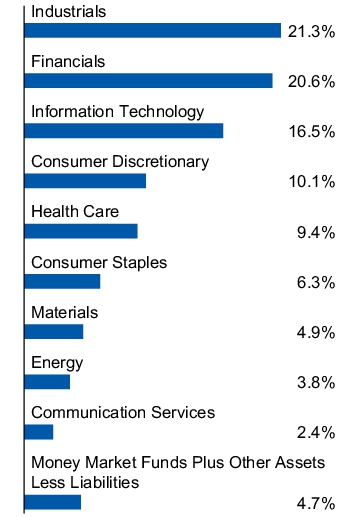
Sector allocation
(% of net assets)

Top ten holdings*
(% of net assets)
| Taiwan Semiconductor Manufacturing Co. Ltd. | 3.65 % |
| Dollarama, Inc. | 3.46 % |
| BAE Systems PLC | 3.02 % |
| Reliance Industries Ltd. | 2.90 % |
| ResMed, Inc. | 2.84 % |
| Siemens AG | 2.78 % |
| Universal Music Group N.V. | 2.77 % |
| Tencent Holdings Ltd. | 2.64 % |
| AstraZeneca PLC | 2.39 % |
| Sartorius Stedim Biotech | 2.38 % |
| * Excluding money market fund holdings, if any. |
invesco.com/reports
. You can also request this information by contacting us at
(800) 959-4246.
What Were The Fund Costs For The Last
Six Months
?
(Based on a hypothetical $10,000 investment)
Fund (Class) | Costs of a $10,000 investment | Costs paid as a percentage of a $10,000 investment* |
| Invesco Oppenheimer V.I. International Growth Fund (Series II) | $ 66 | 1.25 % † |
* | Annualized. |
† | Reflects fee waivers and/or expense reimbursements, without which expenses would have been higher. |
What Are Key Statistics About The Fund?
(as of June 30, 2025)
| Fund net assets | $ 317,591,332 |
| Total number of portfolio holdings | 63 |
| Portfolio turnover rate | 28 % |
What Comprised The Fund's Holdings?
(as of June 30, 2025)
Top ten holdings*
(% of net assets)
| Taiwan Semiconductor Manufacturing Co. Ltd. | 3.65 % |
| Dollarama, Inc. | 3.46 % |
| BAE Systems PLC | 3.02 % |
| Reliance Industries Ltd. | 2.90 % |
| ResMed, Inc. | 2.84 % |
| Siemens AG | 2.78 % |
| Universal Music Group N.V. | 2.77 % |
| Tencent Holdings Ltd. | 2.64 % |
| AstraZeneca PLC | 2.39 % |
| Sartorius Stedim Biotech | 2.38 % |
| * Excluding money market fund holdings, if any. |
Sector allocation
(% of net assets)
Top ten holdings*
(% of net assets)
| Taiwan Semiconductor Manufacturing Co. Ltd. | 3.65 % |
| Dollarama, Inc. | 3.46 % |
| BAE Systems PLC | 3.02 % |
| Reliance Industries Ltd. | 2.90 % |
| ResMed, Inc. | 2.84 % |
| Siemens AG | 2.78 % |
| Universal Music Group N.V. | 2.77 % |
| Tencent Holdings Ltd. | 2.64 % |
| AstraZeneca PLC | 2.39 % |
| Sartorius Stedim Biotech | 2.38 % |
| * Excluding money market fund holdings, if any. |
invesco.com/reports
. You can also request this information by contacting us at
(800) 959-4246.
What Were The Fund Costs For The Last
Six Months
?
(Based on a hypothetical $10,000 investment)
Fund (Class) | Costs of a $10,000 investment | Costs paid as a percentage of a $10,000 investment* |
| Invesco V.I. American Franchise Fund (Series I) | $ 43 | 0.85 % |
* | Annualized. |
What Are Key Statistics About The Fund?
(as of June 30, 2025)
| Fund net assets | $ 894,987,483 |
| Total number of portfolio holdings | 62 |
| Portfolio turnover rate | 27 % |
What Comprised The Fund's Holdings?
(as of June 30, 2025)
Top ten holdings*
(% of net assets)
| NVIDIA Corp. | 11.39 % |
| Microsoft Corp. | 9.34 % |
| Amazon.com, Inc. | 7.21 % |
| Meta Platforms, Inc., Class A | 6.74 % |
| Broadcom, Inc. | 4.24 % |
| Apple, Inc. | 3.49 % |
| Netflix, Inc. | 3.46 % |
| Alphabet, Inc., Class A | 3.06 % |
| Visa, Inc., Class A | 2.57 % |
| ServiceNow, Inc. | 2.46 % |
| * Excluding money market fund holdings, if any. |
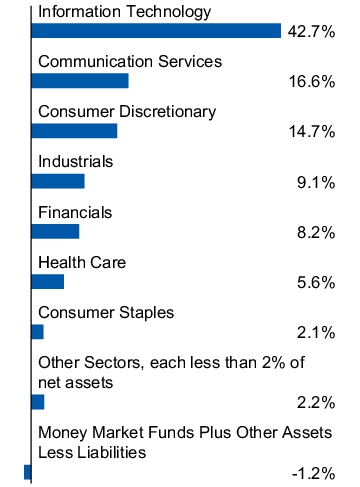
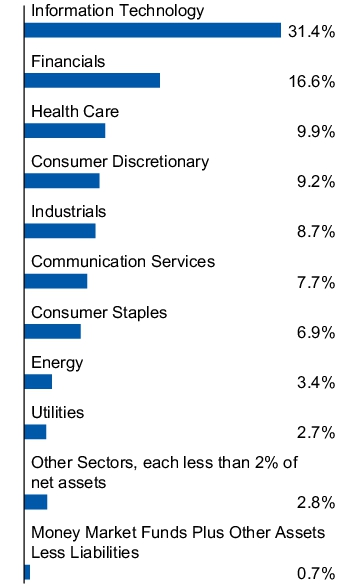
Sector allocation
(% of net assets)
Top ten holdings*
(% of net assets)
| NVIDIA Corp. | 11.39 % |
| Microsoft Corp. | 9.34 % |
| Amazon.com, Inc. | 7.21 % |
| Meta Platforms, Inc., Class A | 6.74 % |
| Broadcom, Inc. | 4.24 % |
| Apple, Inc. | 3.49 % |
| Netflix, Inc. | 3.46 % |
| Alphabet, Inc., Class A | 3.06 % |
| Visa, Inc., Class A | 2.57 % |
| ServiceNow, Inc. | 2.46 % |
| * Excluding money market fund holdings, if any. |
invesco.com/reports
. You can also request this information by contacting us at (800) 959-4246.
What Were The Fund Costs For The Last
Six Months
?
(Based on a hypothetical $10,000 investment)
Fund (Class) | Costs of a $10,000 investment | Costs paid as a percentage of a $10,000 investment* |
| Invesco V.I. American Franchise Fund (Series II) | $ 56 | 1.10 % |
* | Annualized. |
What Are Key Statistics About The Fund?
(as of June 30, 2025)
| Fund net assets | $ 894,987,483 |
| Total number of portfolio holdings | 62 |
| Portfolio turnover rate | 27 % |
What Comprised The Fund's Holdings?
(as of June 30, 2025)
Top ten holdings*
(% of net assets)
| NVIDIA Corp. | 11.39 % |
| Microsoft Corp. | 9.34 % |
| Amazon.com, Inc. | 7.21 % |
| Meta Platforms, Inc., Class A | 6.74 % |
| Broadcom, Inc. | 4.24 % |
| Apple, Inc. | 3.49 % |
| Netflix, Inc. | 3.46 % |
| Alphabet, Inc., Class A | 3.06 % |
| Visa, Inc., Class A | 2.57 % |
| ServiceNow, Inc. | 2.46 % |
| * Excluding money market fund holdings, if any. |
Sector allocation
(% of net assets)

Top ten holdings*
(% of net assets)
| NVIDIA Corp. | 11.39 % |
| Microsoft Corp. | 9.34 % |
| Amazon.com, Inc. | 7.21 % |
| Meta Platforms, Inc., Class A | 6.74 % |
| Broadcom, Inc. | 4.24 % |
| Apple, Inc. | 3.49 % |
| Netflix, Inc. | 3.46 % |
| Alphabet, Inc., Class A | 3.06 % |
| Visa, Inc., Class A | 2.57 % |
| ServiceNow, Inc. | 2.46 % |
| * Excluding money market fund holdings, if any. |
invesco.com/reports
. You can also request this information by contacting us at (800) 959-4246.
What Were The Fund Costs For The Last
Six Months
?
(Based on a hypothetical $10,000 investment)
Fund (Class) | Costs of a $10,000 investment | Costs paid as a percentage of a $10,000 investment* |
| Invesco V.I. American Value Fund (Series I) | $ 44 | 0.88 % |
* | Annualized. |
What Are Key Statistics About The Fund?
(as of June 30, 2025)
| Fund net assets | $ 359,100,783 |
| Total number of portfolio holdings | 75 |
| Portfolio turnover rate | 38 % |
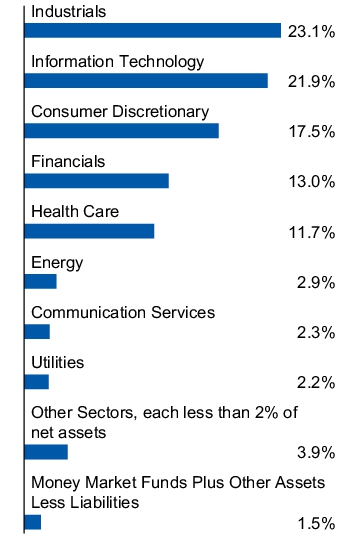
What Comprised The Fund's Holdings?
(as of June 30, 2025)
Top ten holdings*
(% of net assets)
| Fidelity National Information Services, Inc. | 3.18 % |
| AppLovin Corp., Class A | 2.95 % |
| Lumentum Holdings, Inc. | 2.71 % |
| Coherent Corp. | 2.69 % |
| Newmont Corp. | 2.58 % |
| Huntington Bancshares, Inc. | 2.47 % |
| Cameco Corp. | 2.46 % |
| Centene Corp. | 2.45 % |
| NRG Energy, Inc. | 2.43 % |
| Globe Life, Inc. | 2.36 % |
| * Excluding money market fund holdings, if any. |
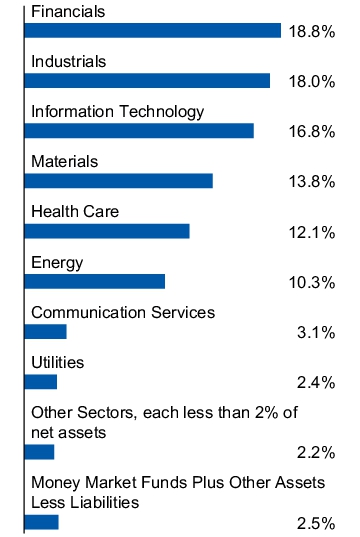
Sector allocation
(% of net assets)
Top ten holdings*
(% of net assets)
| Fidelity National Information Services, Inc. | 3.18 % |
| AppLovin Corp., Class A | 2.95 % |
| Lumentum Holdings, Inc. | 2.71 % |
| Coherent Corp. | 2.69 % |
| Newmont Corp. | 2.58 % |
| Huntington Bancshares, Inc. | 2.47 % |
| Cameco Corp. | 2.46 % |
| Centene Corp. | 2.45 % |
| NRG Energy, Inc. | 2.43 % |
| Globe Life, Inc. | 2.36 % |
| * Excluding money market fund holdings, if any. |
invesco.com/reports
. You can also request this information by contacting us at (800) 959-4246.
What Were The Fund Costs For The Last
Six Months
?
(Based on a hypothetical $10,000 investment)
Fund (Class) | Costs of a $10,000 investment | Costs paid as a percentage of a $10,000 investment* |
| Invesco V.I. American Value Fund (Series II) | $ 57 | 1.13 % |
* | Annualized. |
What Are Key Statistics About The Fund?
(as of June 30, 2025)
| Fund net assets | $ 359,100,783 |
| Total number of portfolio holdings | 75 |
| Portfolio turnover rate | 38 % |
What Comprised The Fund's Holdings?
(as of June 30, 2025)
Top ten holdings*
(% of net assets)
| Fidelity National Information Services, Inc. | 3.18 % |
| AppLovin Corp., Class A | 2.95 % |
| Lumentum Holdings, Inc. | 2.71 % |
| Coherent Corp. | 2.69 % |
| Newmont Corp. | 2.58 % |
| Huntington Bancshares, Inc. | 2.47 % |
| Cameco Corp. | 2.46 % |
| Centene Corp. | 2.45 % |
| NRG Energy, Inc. | 2.43 % |
| Globe Life, Inc. | 2.36 % |
| * Excluding money market fund holdings, if any. |
Sector allocation
(% of net assets)

Top ten holdings*
(% of net assets)
| Fidelity National Information Services, Inc. | 3.18 % |
| AppLovin Corp., Class A | 2.95 % |
| Lumentum Holdings, Inc. | 2.71 % |
| Coherent Corp. | 2.69 % |
| Newmont Corp. | 2.58 % |
| Huntington Bancshares, Inc. | 2.47 % |
| Cameco Corp. | 2.46 % |
| Centene Corp. | 2.45 % |
| NRG Energy, Inc. | 2.43 % |
| Globe Life, Inc. | 2.36 % |
| * Excluding money market fund holdings, if any. |
invesco.com/reports
. You can also request this information by contacting us at (800) 959-4246.
What Were The Fund Costs For The Last
Six Months
?
(Based on a hypothetical $10,000 investment)
Fund (Class) | Costs of a $10,000 investment | Costs paid as a percentage of a $10,000 investment* |
| Invesco V.I. Balanced-Risk Allocation Fund (Series I) | $ 35 | 0.70 % † |
* | Annualized. |
† | Reflects fee waivers and/or expense reimbursements, without which expenses would have been higher. |
What Are Key Statistics About The Fund?
(as of June 30, 2025)
| Fund net assets | $ 414,866,345 |
| Total number of portfolio holdings | 142 |
| Portfolio turnover rate | 14 % |
What Comprised The Fund's Holdings?
(as of June 30, 2025)
Target risk contribution and
notional asset weights
Asset Class | Target Risk Contribution* | Notional Asset Exposure Weights** |
| Equities and Options | 49.94 % | 54.79 % |
| Fixed Income | 21.33 % | 59.00 % |
| Commodities | 28.73 % | 20.98 % |
| Total | 100.00 % | 134.77 % |
| * Reflects the risk that each asset class is expected to contribute to the overall risk of the Fund as measured by standard deviation and estimates of risk based on historical data. Standard deviation measures the annualized fluctuations (volatility) of monthly returns. ** Proprietary models determine the Notional Asset Weights necessary to achieve the Target Risk Contributions. Total Notional Asset Weight greater than 100% is achieved through derivatives and other instruments that create leverage. |
Security type allocation
(% of net assets)
invesco.com/reports
. You can also request this information by contacting us at
(800) 959-4246.
What Were The Fund Costs For The Last
Six Months
?
(Based on a hypothetical $10,000 investment)
Fund (Class) | Costs of a $10,000 investment | Costs paid as a percentage of a $10,000 investment* |
| Invesco V.I. Balanced-Risk Allocation Fund (Series II) | $ 48 | 0.95 % † |
* | Annualized. |
† | Reflects fee waivers and/or expense reimbursements, without which expenses would have been higher. |
What Are Key Statistics About The Fund?
(as of June 30, 2025)
| Fund net assets | $ 414,866,345 |
| Total number of portfolio holdings | 142 |
| Portfolio turnover rate | 14 % |
What Comprised The Fund's Holdings?
(as of June 30, 2025)
Target risk contribution and
notional asset weights
Asset Class | Target Risk Contribution* | Notional Asset Exposure Weights** |
| Equities and Options | 49.94 % | 54.79 % |
| Fixed Income | 21.33 % | 59.00 % |
| Commodities | 28.73 % | 20.98 % |
| Total | 100.00 % | 134.77 % |
| * Reflects the risk that each asset class is expected to contribute to the overall risk of the Fund as measured by standard deviation and estimates of risk based on historical data. Standard deviation measures the annualized fluctuations (volatility) of monthly returns. ** Proprietary models determine the Notional Asset Weights necessary to achieve the Target Risk Contributions. Total Notional Asset Weight greater than 100% is achieved through derivatives and other instruments that create leverage. |
Security type allocation
(% of net assets)

invesco.com/reports
. You can also request this information by contacting us at
(800) 959-4246.
What Were The Fund Costs For The Last
Six Months
?
(Based on a hypothetical $10,000 investment)
Fund (Class) | Costs of a $10,000 investment | Costs paid as a percentage of a $10,000 investment* |
| Invesco V.I. Comstock Fund (Series I) | $ 39 | 0.75 % |
* | Annualized. |
What Are Key Statistics About The Fund?
(as of June 30, 2025)
| Fund net assets | $ 1,440,735,376 |
| Total number of portfolio holdings | 96 |
| Portfolio turnover rate | 11 % |
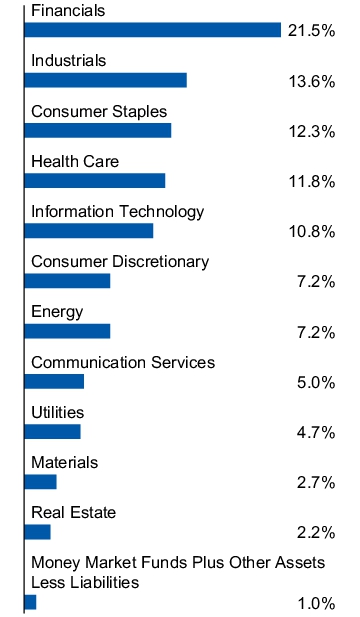
What Comprised The Fund's Holdings?
(as of June 30, 2025)
Top ten holdings*
(% of net assets)
| Bank of America Corp. | 3.33 % |
| Microsoft Corp. | 2.97 % |
| Wells Fargo & Co. | 2.89 % |
| Cisco Systems, Inc. | 2.73 % |
| CVS Health Corp. | 2.35 % |
| State Street Corp. | 2.15 % |
| Meta Platforms, Inc., Class A | 2.04 % |
| Alphabet, Inc., Class A | 2.04 % |
| Johnson Controls International PLC | 1.95 % |
| Philip Morris International, Inc. | 1.84 % |
| * Excluding money market fund holdings, if any. |
Sector allocation
(% of net assets)
Top ten holdings*
(% of net assets)
| Bank of America Corp. | 3.33 % |
| Microsoft Corp. | 2.97 % |
| Wells Fargo & Co. | 2.89 % |
| Cisco Systems, Inc. | 2.73 % |
| CVS Health Corp. | 2.35 % |
| State Street Corp. | 2.15 % |
| Meta Platforms, Inc., Class A | 2.04 % |
| Alphabet, Inc., Class A | 2.04 % |
| Johnson Controls International PLC | 1.95 % |
| Philip Morris International, Inc. | 1.84 % |
| * Excluding money market fund holdings, if any. |
invesco.com/reports
. You can also request this information by contacting us at
(800) 959-4246.
What Were The Fund Costs For The Last
Six Months
?
(Based on a hypothetical $10,000 investment)
Fund (Class) | Costs of a $10,000 investment | Costs paid as a percentage of a $10,000 investment* |
| Invesco V.I. Comstock Fund (Series II) | $ 51 | 1.00 % |
* | Annualized. |
What Are Key Statistics About The Fund?
(as of June 30, 2025)
| Fund net assets | $ 1,440,735,376 |
| Total number of portfolio holdings | 96 |
| Portfolio turnover rate | 11 % |
What Comprised The Fund's Holdings?
(as of June 30, 2025)
Top ten holdings*
(% of net assets)
| Bank of America Corp. | 3.33 % |
| Microsoft Corp. | 2.97 % |
| Wells Fargo & Co. | 2.89 % |
| Cisco Systems, Inc. | 2.73 % |
| CVS Health Corp. | 2.35 % |
| State Street Corp. | 2.15 % |
| Meta Platforms, Inc., Class A | 2.04 % |
| Alphabet, Inc., Class A | 2.04 % |
| Johnson Controls International PLC | 1.95 % |
| Philip Morris International, Inc. | 1.84 % |
| * Excluding money market fund holdings, if any. |
Sector allocation
(% of net assets)

Top ten holdings*
(% of net assets)
| Bank of America Corp. | 3.33 % |
| Microsoft Corp. | 2.97 % |
| Wells Fargo & Co. | 2.89 % |
| Cisco Systems, Inc. | 2.73 % |
| CVS Health Corp. | 2.35 % |
| State Street Corp. | 2.15 % |
| Meta Platforms, Inc., Class A | 2.04 % |
| Alphabet, Inc., Class A | 2.04 % |
| Johnson Controls International PLC | 1.95 % |
| Philip Morris International, Inc. | 1.84 % |
| * Excluding money market fund holdings, if any. |
invesco.com/reports
. You can also request this information by contacting us at
(800) 959-4246.
What Were The Fund Costs For The Last
Six Months
?
(Based on a hypothetical $10,000 investment)
Fund (Class) | Costs of a $10,000 investment | Costs paid as a percentage of a $10,000 investment* |
| Invesco V.I. Core Equity Fund (Series I) | $ 41 | 0.80 % |
* | Annualized. |
What Are Key Statistics About The Fund?
(as of June 30, 2025)
| Fund net assets | $ 756,391,604 |
| Total number of portfolio holdings | 72 |
| Portfolio turnover rate | 17 % |
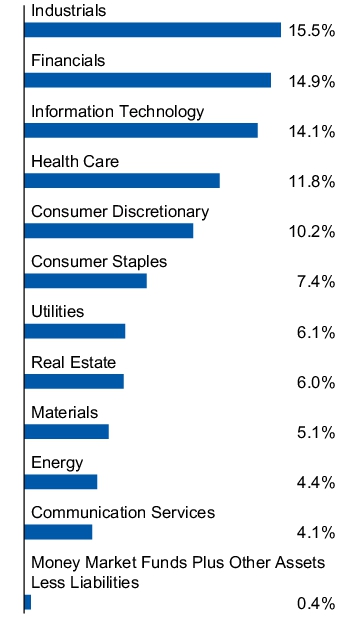
What Comprised The Fund's Holdings?
(as of June 30, 2025)
Top ten holdings*
(% of net assets)
| Microsoft Corp. | 7.95 % |
| NVIDIA Corp. | 7.18 % |
| Apple, Inc. | 4.56 % |
| Amazon.com, Inc. | 4.56 % |
| Alphabet, Inc., Class A | 3.85 % |
| Meta Platforms, Inc., Class A | 3.32 % |
| JPMorgan Chase & Co. | 3.21 % |
| Broadcom, Inc. | 2.74 % |
| Walmart, Inc. | 1.88 % |
| Procter & Gamble Co. (The) | 1.79 % |
| * Excluding money market fund holdings, if any. |
Sector allocation
(% of net assets)
Top ten holdings*
(% of net assets)
| Microsoft Corp. | 7.95 % |
| NVIDIA Corp. | 7.18 % |
| Apple, Inc. | 4.56 % |
| Amazon.com, Inc. | 4.56 % |
| Alphabet, Inc., Class A | 3.85 % |
| Meta Platforms, Inc., Class A | 3.32 % |
| JPMorgan Chase & Co. | 3.21 % |
| Broadcom, Inc. | 2.74 % |
| Walmart, Inc. | 1.88 % |
| Procter & Gamble Co. (The) | 1.79 % |
| * Excluding money market fund holdings, if any. |
invesco.com/reports
. You can also request this information by contacting us at
(800) 959-4246.
What Were The Fund Costs For The Last
Six Months
?
(Based on a hypothetical $10,000 investment)
Fund (Class) | Costs of a $10,000 investment | Costs paid as a percentage of a $10,000 investment* |
| Invesco V.I. Core Equity Fund (Series II) | $ 54 | 1.05 % |
* | Annualized. |
What Are Key Statistics About The Fund?
(as of June 30, 2025)
| Fund net assets | $ 756,391,604 |
| Total number of portfolio holdings | 72 |
| Portfolio turnover rate | 17 % |
What Comprised The Fund's Holdings?
(as of June 30, 2025)
Top ten holdings*
(% of net assets)
| Microsoft Corp. | 7.95 % |
| NVIDIA Corp. | 7.18 % |
| Apple, Inc. | 4.56 % |
| Amazon.com, Inc. | 4.56 % |
| Alphabet, Inc., Class A | 3.85 % |
| Meta Platforms, Inc., Class A | 3.32 % |
| JPMorgan Chase & Co. | 3.21 % |
| Broadcom, Inc. | 2.74 % |
| Walmart, Inc. | 1.88 % |
| Procter & Gamble Co. (The) | 1.79 % |
| * Excluding money market fund holdings, if any. |
Sector allocation
(% of net assets)

Top ten holdings*
(% of net assets)
| Microsoft Corp. | 7.95 % |
| NVIDIA Corp. | 7.18 % |
| Apple, Inc. | 4.56 % |
| Amazon.com, Inc. | 4.56 % |
| Alphabet, Inc., Class A | 3.85 % |
| Meta Platforms, Inc., Class A | 3.32 % |
| JPMorgan Chase & Co. | 3.21 % |
| Broadcom, Inc. | 2.74 % |
| Walmart, Inc. | 1.88 % |
| Procter & Gamble Co. (The) | 1.79 % |
| * Excluding money market fund holdings, if any. |
invesco.com/reports
. You can also request this information by contacting us at
(800) 959-4246.
What Were The Fund Costs For The Last
Six Months
?
(Based on a hypothetical $10,000 investment)
Fund (Class) | Costs of a $10,000 investment | Costs paid as a percentage of a $10,000 investment* |
| Invesco V.I. Core Plus Bond Fund (Series I) | $ 30 | 0.59 % † |
* | Annualized. |
† | Reflects fee waivers and/or expense reimbursements, without which expenses would have been higher. |
What Are Key Statistics About The Fund?
(as of June 30, 2025)
| Fund net assets | $ 141,884,572 |
| Total number of portfolio holdings | 1,451 |
| Portfolio turnover rate | 282 % |
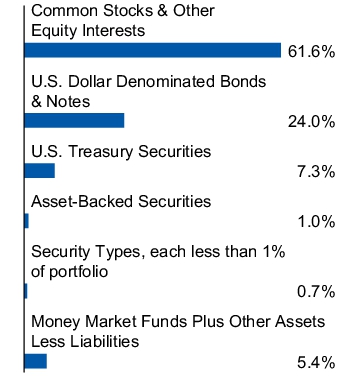
What Comprised The Fund's Holdings?
(as of June 30, 2025)
Top ten holdings*
(% of net assets)
| Uniform Mortgage-Backed Securities, TBA, 5.50%, 07/01/2055 | 4.20 % |
| Uniform Mortgage-Backed Securities, TBA, 2.50%, 07/01/2055 | 3.76 % |
| Uniform Mortgage-Backed Securities, TBA, 5.00%, 07/01/2055 | 3.50 % |
| Uniform Mortgage-Backed Securities, TBA, 3.00%, 07/01/2055 | 3.34 % |
| Uniform Mortgage-Backed Securities, TBA, 6.00%, 07/01/2055 | 3.22 % |
| U.S. Treasury Notes, 4.25%, 05/15/2035 | 3.18 % |
| U.S. Treasury Bonds, 4.63%, 02/15/2055 | 2.47 % |
| U.S. Treasury Bonds, 5.00%, 05/15/2045 | 2.29 % |
| U.S. Treasury Notes, 3.75%, 06/30/2027 | 2.06 % |
| Uniform Mortgage-Backed Securities, TBA, 3.50%, 07/01/2055 | 1.86 % |
| * Excluding money market fund holdings, if any. |
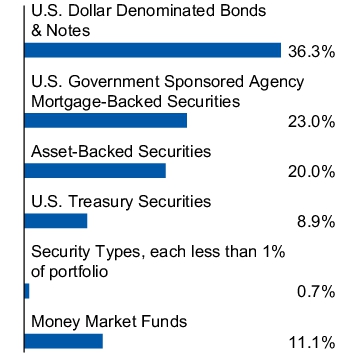
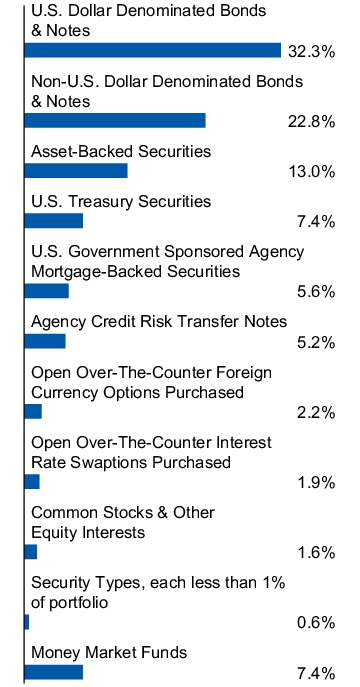
Security type allocation
(% of total investments)

Top ten holdings*
(% of net assets)
| Uniform Mortgage-Backed Securities, TBA, 5.50%, 07/01/2055 | 4.20 % |
| Uniform Mortgage-Backed Securities, TBA, 2.50%, 07/01/2055 | 3.76 % |
| Uniform Mortgage-Backed Securities, TBA, 5.00%, 07/01/2055 | 3.50 % |
| Uniform Mortgage-Backed Securities, TBA, 3.00%, 07/01/2055 | 3.34 % |
| Uniform Mortgage-Backed Securities, TBA, 6.00%, 07/01/2055 | 3.22 % |
| U.S. Treasury Notes, 4.25%, 05/15/2035 | 3.18 % |
| U.S. Treasury Bonds, 4.63%, 02/15/2055 | 2.47 % |
| U.S. Treasury Bonds, 5.00%, 05/15/2045 | 2.29 % |
| U.S. Treasury Notes, 3.75%, 06/30/2027 | 2.06 % |
| Uniform Mortgage-Backed Securities, TBA, 3.50%, 07/01/2055 | 1.86 % |
| * Excluding money market fund holdings, if any. |
invesco.com/reports
. You can also request this information by contacting us at
(800) 959-4246.
What Were The Fund Costs For The Last
Six Months
?
(Based on a hypothetical $10,000 investment)
Fund (Class) | Costs of a $10,000 investment | Costs paid as a percentage of a $10,000 investment* |
| Invesco V.I. Core Plus Bond Fund (Series II) | $ 42 | 0.84 % † |
* | Annualized. |
† | Reflects fee waivers and/or expense reimbursements, without which expenses would have been higher. |
What Are Key Statistics About The Fund?
(as of June 30, 2025)
| Fund net assets | $ 141,884,572 |
| Total number of portfolio holdings | 1,451 |
| Portfolio turnover rate | 282 % |
What
Comprised
The Fund's Holdings?(as of June 30, 2025)
Top ten holdings*
(% of net assets)
| Uniform Mortgage-Backed Securities, TBA, 5.50%, 07/01/2055 | 4.20 % |
| Uniform Mortgage-Backed Securities, TBA, 2.50%, 07/01/2055 | 3.76 % |
| Uniform Mortgage-Backed Securities, TBA, 5.00%, 07/01/2055 | 3.50 % |
| Uniform Mortgage-Backed Securities, TBA, 3.00%, 07/01/2055 | 3.34 % |
| Uniform Mortgage-Backed Securities, TBA, 6.00%, 07/01/2055 | 3.22 % |
| U.S. Treasury Notes, 4.25%, 05/15/2035 | 3.18 % |
| U.S. Treasury Bonds, 4.63%, 02/15/2055 | 2.47 % |
| U.S. Treasury Bonds, 5.00%, 05/15/2045 | 2.29 % |
| U.S. Treasury Notes, 3.75%, 06/30/2027 | 2.06 % |
| Uniform Mortgage-Backed Securities, TBA, 3.50%, 07/01/2055 | 1.86 % |
| * Excluding money market fund holdings, if any. |
Security type allocation
(% of total investments)
Top ten holdings*
(% of net assets)
| Uniform Mortgage-Backed Securities, TBA, 5.50%, 07/01/2055 | 4.20 % |
| Uniform Mortgage-Backed Securities, TBA, 2.50%, 07/01/2055 | 3.76 % |
| Uniform Mortgage-Backed Securities, TBA, 5.00%, 07/01/2055 | 3.50 % |
| Uniform Mortgage-Backed Securities, TBA, 3.00%, 07/01/2055 | 3.34 % |
| Uniform Mortgage-Backed Securities, TBA, 6.00%, 07/01/2055 | 3.22 % |
| U.S. Treasury Notes, 4.25%, 05/15/2035 | 3.18 % |
| U.S. Treasury Bonds, 4.63%, 02/15/2055 | 2.47 % |
| U.S. Treasury Bonds, 5.00%, 05/15/2045 | 2.29 % |
| U.S. Treasury Notes, 3.75%, 06/30/2027 | 2.06 % |
| Uniform Mortgage-Backed Securities, TBA, 3.50%, 07/01/2055 | 1.86 % |
| * Excluding money market fund holdings, if any. |
invesco.com/reports
. You can also request this information by contacting us at
(800) 959-4246.
What Were The Fund Costs For The Last
S
ix
Months?
(Based on a hypothetical $10,000 investment)
Fund (Class) |
Costs of a $10,000 investment |
Costs paid as a percentage of a $10,000 investment* |
| Invesco V.I. Discovery Large Cap Fund (Series I) |
$ 41 |
0.80 % † |
* |
Annualized. |
|
† |
Reflects fee waivers and/or expense reimbursements, without which expenses would have been higher. |
What Are Key Statistics About The Fund?
(as of June 30, 2025)
| Fund net assets | $ 807,154,336 |
| Total number of portfolio holdings | 62 |
| Portfolio turnover rate | 32 % |
What Comprised The Fund's Holdings?
(as of June 30, 2025)
Top ten holdings*
(% of net assets)
| NVIDIA Corp. | 11.17 % |
| Microsoft Corp. | 8.95 % |
| Amazon.com, Inc. | 6.79 % |
| Meta Platforms, Inc., Class A | 6.32 % |
| Broadcom, Inc. | 4.00 % |
| Netflix, Inc. | 3.93 % |
| Apple, Inc. | 3.37 % |
| Alphabet, Inc., Class C | 2.95 % |
| Boston Scientific Corp. | 2.19 % |
| Mastercard, Inc., Class A | 1.93 % |
| * Excluding money market fund holdings, if any. |
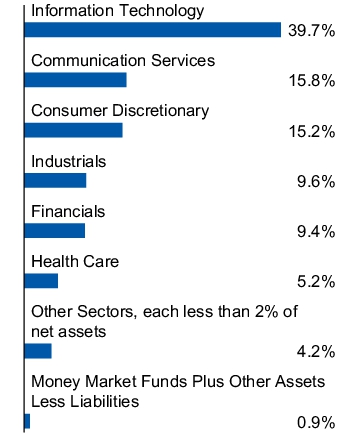
Sector allocation
(% of net assets)
Top ten holdings*
(% of net assets)
| NVIDIA Corp. | 11.17 % |
| Microsoft Corp. | 8.95 % |
| Amazon.com, Inc. | 6.79 % |
| Meta Platforms, Inc., Class A | 6.32 % |
| Broadcom, Inc. | 4.00 % |
| Netflix, Inc. | 3.93 % |
| Apple, Inc. | 3.37 % |
| Alphabet, Inc., Class C | 2.95 % |
| Boston Scientific Corp. | 2.19 % |
| Mastercard, Inc., Class A | 1.93 % |
| * Excluding money market fund holdings, if any. |
invesco.com/reports
. You can also request this information by contacting us at
(800) 959-4246.
What Were The Fund Costs For The Last
Six Months
?
(Based on a hypothetical $10,000 investment)
Fund (Class) |
Costs of a $10,000 investment |
Costs paid as a percentage of a $10,000 investment* |
| Invesco V.I. Discovery Large Cap Fund (Series II) |
$ 53 |
1.05 % † |
* |
Annualized. |
|
† |
Reflects fee waivers and/or expense reimbursements, without which expenses would have been higher. |
What Are Key Statistics About The Fund?
(as of June 30, 2025)
| Fund net assets | $ 807,154,336 |
| Total number of portfolio holdings | 62 |
| Portfolio turnover rate | 32 % |
What Comprised The Fund's Holdings?
(as of June 30, 2025)
Top ten holdings*
(% of net assets)
| NVIDIA Corp. | 11.17 % |
| Microsoft Corp. | 8.95 % |
| Amazon.com, Inc. | 6.79 % |
| Meta Platforms, Inc., Class A | 6.32 % |
| Broadcom, Inc. | 4.00 % |
| Netflix, Inc. | 3.93 % |
| Apple, Inc. | 3.37 % |
| Alphabet, Inc., Class C | 2.95 % |
| Boston Scientific Corp. | 2.19 % |
| Mastercard, Inc., Class A | 1.93 % |
| * Excluding money market fund holdings, if any. |
Sector allocation
(% of net assets)

Top ten holdings*
(% of net assets)
| NVIDIA Corp. | 11.17 % |
| Microsoft Corp. | 8.95 % |
| Amazon.com, Inc. | 6.79 % |
| Meta Platforms, Inc., Class A | 6.32 % |
| Broadcom, Inc. | 4.00 % |
| Netflix, Inc. | 3.93 % |
| Apple, Inc. | 3.37 % |
| Alphabet, Inc., Class C | 2.95 % |
| Boston Scientific Corp. | 2.19 % |
| Mastercard, Inc., Class A | 1.93 % |
| * Excluding money market fund holdings, if any. |
invesco.com/reports
. You can also request this information by contacting us at
(800) 959-4246.
What Were The Fund Costs For The Last
Six Months
?
(Based on a hypothetical $10,000 investment)
Fund (Class) | Costs of a $10,000 investment | Costs paid as a percentage of a $10,000 investment* |
| Invesco V.I. Discovery Mid Cap Growth Fund (Series I) | $ 43 | 0.86 % |
* | Annualized. |
What Are Key Statistics About The Fund?
(as of June 30, 2025)
| Fund net assets | $ 956,849,323 |
| Total number of portfolio holdings | 84 |
| Portfolio turnover rate | 55 % |
What Comprised The Fund's Holdings?
(as of June 30, 2025)
Top ten holdings*
(% of net assets)
| Hilton Worldwide Holdings, Inc. | 2.77 % |
| Howmet Aerospace, Inc. | 2.74 % |
| Axon Enterprise, Inc. | 2.64 % |
| Palantir Technologies, Inc., Class A | 2.20 % |
| Cloudflare, Inc., Class A | 2.20 % |
| Encompass Health Corp. | 2.18 % |
| Flex Ltd. | 2.05 % |
| CyberArk Software Ltd. | 2.03 % |
| Cencora, Inc. | 1.97 % |
| Tradeweb Markets, Inc., Class A | 1.94 % |
| * Excluding money market fund holdings , if any. |
Sector allocation
(% of net assets)
Top ten holdings*
(% of net assets)
| Hilton Worldwide Holdings, Inc. | 2.77 % |
| Howmet Aerospace, Inc. | 2.74 % |
| Axon Enterprise, Inc. | 2.64 % |
| Palantir Technologies, Inc., Class A | 2.20 % |
| Cloudflare, Inc., Class A | 2.20 % |
| Encompass Health Corp. | 2.18 % |
| Flex Ltd. | 2.05 % |
| CyberArk Software Ltd. | 2.03 % |
| Cencora, Inc. | 1.97 % |
| Tradeweb Markets, Inc., Class A | 1.94 % |
| * Excluding money market fund holdings , if any. |
invesco.com/reports
. You can also request this information by contacting us at
(800) 959-4246.
What Were The Fund Costs For The Last
Six Months
?
(Based on a hypothetical $10,000 investment)
Fund (Class) | Costs of a $10,000 investment | Costs paid as a percentage of a $10,000 investment* |
| Invesco V.I. Discovery Mid Cap Growth Fund (Series II) | $ 56 | 1.11 % |
* | Annualized. |
What Are Key Statistics About The Fund?
(as of June 30, 2025)
| Fund net assets | $ 956,849,323 |
| Total number of portfolio holdings | 84 |
| Portfolio turnover rate | 55 % |
What Comprised The Fund's Holdings?
(as of June 30, 2025)
Top ten holdings*
(% of net assets)
| Hilton Worldwide Holdings, Inc. | 2.77 % |
| Howmet Aerospace, Inc. | 2.74 % |
| Axon Enterprise, Inc. | 2.64 % |
| Palantir Technologies, Inc., Class A | 2.20 % |
| Cloudflare, Inc., Class A | 2.20 % |
| Encompass Health Corp. | 2.18 % |
| Flex Ltd. | 2.05 % |
| CyberArk Software Ltd. | 2.03 % |
| Cencora, Inc. | 1.97 % |
| Tradeweb Markets, Inc., Class A | 1.94 % |
| * Excluding money market fund holdings, if any. |
Sector allocation
(% of net assets)

Top ten holdings*
(% of net assets)
| Hilton Worldwide Holdings, Inc. | 2.77 % |
| Howmet Aerospace, Inc. | 2.74 % |
| Axon Enterprise, Inc. | 2.64 % |
| Palantir Technologies, Inc., Class A | 2.20 % |
| Cloudflare, Inc., Class A | 2.20 % |
| Encompass Health Corp. | 2.18 % |
| Flex Ltd. | 2.05 % |
| CyberArk Software Ltd. | 2.03 % |
| Cencora, Inc. | 1.97 % |
| Tradeweb Markets, Inc., Class A | 1.94 % |
| * Excluding money market fund holdings, if any. |
invesco.com/reports
. You can also request this information by contacting us at
(800) 959-4246.
What Were The Fund Costs For The Last
Six Months
?
(Based on a hypothetical $10,000 investment)
Fund (Class) | Costs of a $10,000 investment | Costs paid as a percentage of a $10,000 investment* |
| Invesco V.I. Diversified Dividend Fund (Series I) | $ 35 | 0.68 % |
* | Annualized. |
What Are Key Statistics About The Fund?
(as of June 30, 2025)
| Fund net assets | $ 445,397,960 |
| Total number of portfolio holdings | 83 |
| Portfolio turnover rate | 33 % |
What Comprised The Fund's Holdings?
(as of June 30, 2025)
Top ten holdings*
(% of net assets)
| JPMorgan Chase & Co. | 4.06 % |
| Walmart, Inc. | 2.61 % |
| Bank of America Corp. | 2.53 % |
| Chevron Corp. | 2.51 % |
| Philip Morris International, Inc. | 2.43 % |
| Microsoft Corp. | 2.42 % |
| Lowe's Cos., Inc. | 2.28 % |
| Cisco Systems, Inc. | 2.22 % |
| Wells Fargo & Co. | 2.15 % |
| Johnson & Johnson | 2.12 % |
| * Excluding money market fund holdings, if any. |
Sector allocation
(% of net assets)

Top ten holdings*
(% of net assets)
| JPMorgan Chase & Co. | 4.06 % |
| Walmart, Inc. | 2.61 % |
| Bank of America Corp. | 2.53 % |
| Chevron Corp. | 2.51 % |
| Philip Morris International, Inc. | 2.43 % |
| Microsoft Corp. | 2.42 % |
| Lowe's Cos., Inc. | 2.28 % |
| Cisco Systems, Inc. | 2.22 % |
| Wells Fargo & Co. | 2.15 % |
| Johnson & Johnson | 2.12 % |
| * Excluding money market fund holdings, if any. |
invesco.com/reports
. You can also request this information by contacting us at
(800) 959-4246.
What Were The Fund Costs For The Last
Six Months
?
(Based on a hypothetical $10,000 investment)
Fund (Class) | Costs of a $10,000 investment | Costs paid as a percentage of a $10,000 investment* |
| Invesco V.I. Diversified Dividend Fund (Series II) | $ 48 | 0.93 % |
* | Annualized. |
What Are Key Statistics About The Fund?
(as of June 30, 2025)
| Fund net assets | $ 445,397,960 |
| Total number of portfolio holdings | 83 |
| Portfolio turnover rate | 33 % |
What Comprised The Fund's Holdings?
(as of June 30, 2025)
Top ten holdings*
(% of net assets)
| JPMorgan Chase & Co. | 4.06 % |
| Walmart, Inc. | 2.61 % |
| Bank of America Corp. | 2.53 % |
| Chevron Corp. | 2.51 % |
| Philip Morris International, Inc. | 2.43 % |
| Microsoft Corp. | 2.42 % |
| Lowe's Cos., Inc. | 2.28 % |
| Cisco Systems, Inc. | 2.22 % |
| Wells Fargo & Co. | 2.15 % |
| Johnson & Johnson | 2.12 % |
| * Excluding money market fund holdings, if any. |
Sector allocation
(% of net assets)
Top ten holdings*
(% of net assets)
| JPMorgan Chase & Co. | 4.06 % |
| Walmart, Inc. | 2.61 % |
| Bank of America Corp. | 2.53 % |
| Chevron Corp. | 2.51 % |
| Philip Morris International, Inc. | 2.43 % |
| Microsoft Corp. | 2.42 % |
| Lowe's Cos., Inc. | 2.28 % |
| Cisco Systems, Inc. | 2.22 % |
| Wells Fargo & Co. | 2.15 % |
| Johnson & Johnson | 2.12 % |
| * Excluding money market fund holdings, if any. |
invesco.com/reports
. You can also request this information by contacting us at
(800) 959-4246.
What Were The Fund Costs For The Last
Six Months
?
(Based on a hypothetical $10,000 investment)
Fund (Class) | Costs of a $10,000 investment | Costs paid as a percentage of a $10,000 investment* |
| Invesco V.I. Equally-Weighted S&P 500 Fund (Series I) | $ 17 | 0.33 % |
* | Annualized. |
What Are Key Statistics About The Fund?
(as of June 30, 2025)
| Fund net assets | $ 484,766,714 |
| Total number of portfolio holdings | 509 |
| Portfolio turnover rate | 11 % |
What Comprised The Fund's Holdings?
(as of June 30, 2025)
Top ten holdings*
(% of net assets)
| Coinbase Global, Inc., Class A | 0.27 % |
| Oracle Corp. | 0.24 % |
| Jabil, Inc. | 0.24 % |
| Carnival Corp. | 0.23 % |
| Advanced Micro Devices, Inc. | 0.23 % |
| Northern Trust Corp. | 0.23 % |
| Royal Caribbean Cruises Ltd. | 0.23 % |
| Vistra Corp. | 0.23 % |
| Estee Lauder Cos., Inc. (The), Class A | 0.23 % |
| Western Digital Corp. | 0.23 % |
| * Excluding money market fund holdings, if any. |
Sector allocation
(% of net assets)

Top ten holdings*
(% of net assets)
| Coinbase Global, Inc., Class A | 0.27 % |
| Oracle Corp. | 0.24 % |
| Jabil, Inc. | 0.24 % |
| Carnival Corp. | 0.23 % |
| Advanced Micro Devices, Inc. | 0.23 % |
| Northern Trust Corp. | 0.23 % |
| Royal Caribbean Cruises Ltd. | 0.23 % |
| Vistra Corp. | 0.23 % |
| Estee Lauder Cos., Inc. (The), Class A | 0.23 % |
| Western Digital Corp. | 0.23 % |
| * Excluding money market fund holdings, if any. |
invesco.com/reports
. You can also request this information by contacting us at
(800) 959-4246.
What Were The Fund Costs For The Last
Six Months
?
(Based on a hypothetical $10,000 investment)
Fund (Class) | Costs of a $10,000 investment | Costs paid as a percentage of a $10,000 investment* |
| Invesco V.I. Equally-Weighted S&P 500 Fund (Series II) | $ 29 | 0.58 % |
* | Annualized. |
What Are Key Statistics About The Fund?
(as of June 30, 2025)
| Fund net assets | $ 484,766,714 |
| Total number of portfolio holdings | 509 |
| Portfolio turnover rate | 11 % |
What Comprised The Fund's Holdings?
(as of June 30, 2025)
Top ten holdings*
(% of net assets)
| Coinbase Global, Inc., Class A | 0.27 % |
| Oracle Corp. | 0.24 % |
| Jabil, Inc. | 0.24 % |
| Carnival Corp. | 0.23 % |
| Advanced Micro Devices, Inc. | 0.23 % |
| Northern Trust Corp. | 0.23 % |
| Royal Caribbean Cruises Ltd. | 0.23 % |
| Vistra Corp. | 0.23 % |
| Estee Lauder Cos., Inc. (The), Class A | 0.23 % |
| Western Digital Corp. | 0.23 % |
| * Excluding money market fund holdings, if any. |
Sector allocation
(% of net assets)
Top ten holdings*
(% of net assets)
| Coinbase Global, Inc., Class A | 0.27 % |
| Oracle Corp. | 0.24 % |
| Jabil, Inc. | 0.24 % |
| Carnival Corp. | 0.23 % |
| Advanced Micro Devices, Inc. | 0.23 % |
| Northern Trust Corp. | 0.23 % |
| Royal Caribbean Cruises Ltd. | 0.23 % |
| Vistra Corp. | 0.23 % |
| Estee Lauder Cos., Inc. (The), Class A | 0.23 % |
| Western Digital Corp. | 0.23 % |
| * Excluding money market fund holdings, if any. |
invesco.com/reports
. You can also request this information by contacting us at
(800) 959-4246.
What Were The Fund Costs For The Last
Six Months
?
(Based on a hypothetical $10,000 investment)
Fund (Class) | Costs of a $10,000 investment | Costs paid as a percentage of a $10,000 investment* |
| Invesco V.I. Equity and Income Fund (Series I) | $ 28 | 0.56 % |
* | Annualized. |
What Are Key Statistics About The Fund?
(as of June 30, 2025)
| Fund net assets | $ 1,381,922,511 |
| Total number of portfolio holdings | 1,220 |
| Portfolio turnover rate | 59 % |
What Comprised The Fund's Holdings?
(as of June 30, 2025)
Top ten holdings*
(% of net assets)
| Wells Fargo & Co. | 2.34 % |
| Bank of America Corp. | 2.18 % |
| U.S. Treasury Notes, 3.75%, 06/30/2027 | 2.06 % |
| Amazon.com, Inc. | 1.89 % |
| Microsoft Corp. | 1.67 % |
| U.S. Treasury Notes, 3.88%, 06/15/2028 | 1.52 % |
| U.S. Treasury Notes, 4.00%, 06/30/2032 | 1.47 % |
| Microchip Technology, Inc. | 1.45 % |
| Philip Morris International, Inc. | 1.44 % |
| Parker-Hannifin Corp. | 1.31 % |
| * Excluding money market fund holdings, if any. |
Security type allocation
(% of net assets)
Top ten holdings*
(% of net assets)
| Wells Fargo & Co. | 2.34 % |
| Bank of America Corp. | 2.18 % |
| U.S. Treasury Notes, 3.75%, 06/30/2027 | 2.06 % |
| Amazon.com, Inc. | 1.89 % |
| Microsoft Corp. | 1.67 % |
| U.S. Treasury Notes, 3.88%, 06/15/2028 | 1.52 % |
| U.S. Treasury Notes, 4.00%, 06/30/2032 | 1.47 % |
| Microchip Technology, Inc. | 1.45 % |
| Philip Morris International, Inc. | 1.44 % |
| Parker-Hannifin Corp. | 1.31 % |
| * Excluding money market fund holdings, if any. |
invesco.com/reports
. You can also request this information by contacting us at
(800) 959-4246.
What Were The Fund Costs For The Last
Six Months
?
(Based on a hypothetical $10,000 investment)
Fund (Class) | Costs of a $10,000 investment | Costs paid as a percentage of a $10,000 investment* |
| Invesco V.I. Equity and Income Fund (Series II) | $ 41 | 0.81 % |
* | Annualized. |
What Are Key Statistics About The Fund?
(as of June 30, 2025)
| Fund net assets | $ 1,381,922,511 |
| Total number of portfolio holdings | 1,220 |
| Portfolio turnover rate | 59 % |
What Comprised The Fund's Holdings?
(as of June 30, 2025)
Top ten holdings*
(% of net assets)
| Wells Fargo & Co. | 2.34 % |
| Bank of America Corp. | 2.18 % |
| U.S. Treasury Notes, 3.75%, 06/30/2027 | 2.06 % |
| Amazon.com, Inc. | 1.89 % |
| Microsoft Corp. | 1.67 % |
| U.S. Treasury Notes, 3.88%, 06/15/2028 | 1.52 % |
| U.S. Treasury Notes, 4.00%, 06/30/2032 | 1.47 % |
| Microchip Technology, Inc. | 1.45 % |
| Philip Morris International, Inc. | 1.44 % |
| Parker-Hannifin Corp. | 1.31 % |
| * Excluding money market fund holdings, if any. |
Security type allocation
(% of net assets)

Top ten holdings*
(% of net assets)
| Wells Fargo & Co. | 2.34 % |
| Bank of America Corp. | 2.18 % |
| U.S. Treasury Notes, 3.75%, 06/30/2027 | 2.06 % |
| Amazon.com, Inc. | 1.89 % |
| Microsoft Corp. | 1.67 % |
| U.S. Treasury Notes, 3.88%, 06/15/2028 | 1.52 % |
| U.S. Treasury Notes, 4.00%, 06/30/2032 | 1.47 % |
| Microchip Technology, Inc. | 1.45 % |
| Philip Morris International, Inc. | 1.44 % |
| Parker-Hannifin Corp. | 1.31 % |
| * Excluding money market fund holdings, if any. |
semi-annual shareholder report
contains important information about Invesco V.I. EQV International Equity Fund (the “Fund”) for the period January 1, 2025 to June 30, 2025.
invesco.com/reports
. You can also request this information by contacting us at
(800) 959-4246.
What Were The Fund Costs For The Last
Six Months
?
(Based on a hypothetical $10,000 investment)
Fund (Class) | Costs of a $10,000 investment | Costs paid as a percentage of a $10,000 investment* |
| Invesco V.I. EQV International Equity Fund (Series I) | $ 47 | 0.90 % |
* | Annualized. |
What Are Key Statistics About The Fund?
(as of June 30, 2025)
| Fund net assets | $ 1,186,444,521 |
| Total number of portfolio holdings | 84 |
| Portfolio turnover rate | 22 % |
What Comprised The Fund's Holdings?
(as of June 30, 2025)
Top ten holdings*
(% of net assets)
| Taiwan Semiconductor Manufacturing Co. Ltd., ADR | 3.68 % |
| Investor AB, Class B | 3.20 % |
| HDFC Bank Ltd., ADR | 2.24 % |
| RELX PLC | 2.19 % |
| RB Global, Inc. | 2.12 % |
| FinecoBank Banca Fineco S.p.A. | 1.95 % |
| Keyence Corp. | 1.92 % |
| Sony Group Corp. | 1.88 % |
| BAE Systems PLC | 1.76 % |
| Techtronic Industries Co. Ltd. | 1.75 % |
| * Excluding money market fund holdings, if any. |
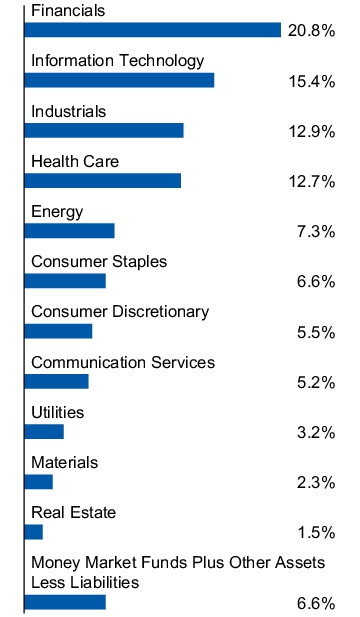
Sector allocation
(% of net assets)
Top ten holdings*
(% of net assets)
| Taiwan Semiconductor Manufacturing Co. Ltd., ADR | 3.68 % |
| Investor AB, Class B | 3.20 % |
| HDFC Bank Ltd., ADR | 2.24 % |
| RELX PLC | 2.19 % |
| RB Global, Inc. | 2.12 % |
| FinecoBank Banca Fineco S.p.A. | 1.95 % |
| Keyence Corp. | 1.92 % |
| Sony Group Corp. | 1.88 % |
| BAE Systems PLC | 1.76 % |
| Techtronic Industries Co. Ltd. | 1.75 % |
| * Excluding money market fund holdings, if any. |
invesco.com/reports
. You can also request this information by contacting us at
(800) 959-4246.
What Were The Fund Costs For The Last
Six Months
?
(Based on a hypothetical $10,000 investment)
Fund (Class) | Costs of a $10,000 investment | Costs paid as a percentage of a $10,000 investment* |
| Invesco V.I. EQV International Equity Fund (Series II) | $ 60 | 1.15 % |
* | Annualized. |
What Are Key Statistics About The Fund?
(as of June 30, 2025)
| Fund net assets | $ 1,186,444,521 |
| Total number of portfolio holdings | 84 |
| Portfolio turnover rate | 22 % |
What Comprised The Fund's Holdings?
(as of June 30, 2025)
Top ten holdings*
(% of net assets)
| Taiwan Semiconductor Manufacturing Co. Ltd., ADR | 3.68 % |
| Investor AB, Class B | 3.20 % |
| HDFC Bank Ltd., ADR | 2.24 % |
| RELX PLC | 2.19 % |
| RB Global, Inc. | 2.12 % |
| FinecoBank Banca Fineco S.p.A. | 1.95 % |
| Keyence Corp. | 1.92 % |
| Sony Group Corp. | 1.88 % |
| BAE Systems PLC | 1.76 % |
| Techtronic Industries Co. Ltd. | 1.75 % |
| * Excluding money market fund holdings, if any. |
Sector allocation
(% of net assets)

Top ten holdings*
(% of net assets)
| Taiwan Semiconductor Manufacturing Co. Ltd., ADR | 3.68 % |
| Investor AB, Class B | 3.20 % |
| HDFC Bank Ltd., ADR | 2.24 % |
| RELX PLC | 2.19 % |
| RB Global, Inc. | 2.12 % |
| FinecoBank Banca Fineco S.p.A. | 1.95 % |
| Keyence Corp. | 1.92 % |
| Sony Group Corp. | 1.88 % |
| BAE Systems PLC | 1.76 % |
| Techtronic Industries Co. Ltd. | 1.75 % |
| * Excluding money market fund holdings, if any. |
invesco.com/reports
. You can also request this information by contacting us at
(800) 959-4246.
What Were The Fund Costs For The Last
Six Months
?
(Based on a hypothetical $10,000 investment)
Fund (Class) | Costs of a $10,000 investment | Costs paid as a percentage of a $10,000 investment* |
| Invesco V.I. Global Core Equity Fund (Series I) | $ 50 | 0.96 % |
* | Annualized. |
What Are Key Statistics About The Fund?
(as of June 30, 2025)
| Fund net assets | $ 76,030,358 |
| Total number of portfolio holdings | 66 |
| Portfolio turnover rate | 45 % |
What Comprised The Fund's Holdings?
(as of June 30, 2025)
Top ten holdings*
(% of net assets)
| Microsoft Corp. | 6.93 % |
| Amazon.com, Inc. | 3.85 % |
| 3i Group PLC | 3.51 % |
| Meta Platforms, Inc., Class A | 3.48 % |
| NVIDIA Corp. | 3.48 % |
| Constellation Software, Inc. | 3.02 % |
| Apple, Inc. | 2.66 % |
| Canadian Pacific Kansas City Ltd. | 2.61 % |
| Taiwan Semiconductor Manufacturing Co. Ltd. | 2.36 % |
| Mastercard, Inc., Class A | 2.13 % |
| * Excluding money market fund holdings, if any. |
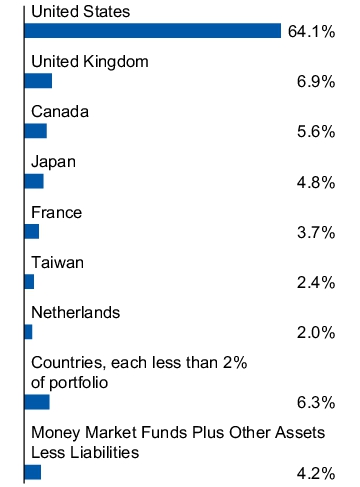
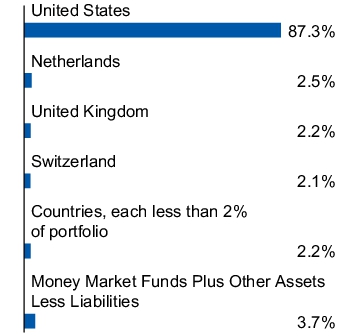
Country allocation
(% of net assets)

Top ten holdings*
(% of net assets)
| Microsoft Corp. | 6.93 % |
| Amazon.com, Inc. | 3.85 % |
| 3i Group PLC | 3.51 % |
| Meta Platforms, Inc., Class A | 3.48 % |
| NVIDIA Corp. | 3.48 % |
| Constellation Software, Inc. | 3.02 % |
| Apple, Inc. | 2.66 % |
| Canadian Pacific Kansas City Ltd. | 2.61 % |
| Taiwan Semiconductor Manufacturing Co. Ltd. | 2.36 % |
| Mastercard, Inc., Class A | 2.13 % |
| * Excluding money market fund holdings, if any. |
invesco.com/reports
. You can also request this information by contacting us at
(800) 959-4246.
What Were The Fund Costs For The Last
Six Months
?
(Based on a hypothetical $10,000 investment)
Fund (Class) | Costs of a $10,000 investment | Costs paid as a percentage of a $10,000 investment* |
| Invesco V.I. Global Core Equity Fund (Series II) | $ 63 | 1.21 % |
* | Annualized. |
What Are Key Statistics About The Fund?
(as of June 30, 2025)
| Fund net assets | $ 76,030,358 |
| Total number of portfolio holdings | 66 |
| Portfolio turnover rate | 45 % |
What Comprised The Fund's Holdings?
(as of June 30, 2025)
Top ten holdings*
(% of net assets)
| Microsoft Corp. | 6.93 % |
| Amazon.com, Inc. | 3.85 % |
| 3i Group PLC | 3.51 % |
| Meta Platforms, Inc., Class A | 3.48 % |
| NVIDIA Corp. | 3.48 % |
| Constellation Software, Inc. | 3.02 % |
| Apple, Inc. | 2.66 % |
| Canadian Pacific Kansas City Ltd. | 2.61 % |
| Taiwan Semiconductor Manufacturing Co. Ltd. | 2.36 % |
| Mastercard, Inc., Class A | 2.13 % |
| * Excluding money market fund holdings, if any. |
Country allocation
(% of net assets)
Top ten holdings*
(% of net assets)
| Microsoft Corp. | 6.93 % |
| Amazon.com, Inc. | 3.85 % |
| 3i Group PLC | 3.51 % |
| Meta Platforms, Inc., Class A | 3.48 % |
| NVIDIA Corp. | 3.48 % |
| Constellation Software, Inc. | 3.02 % |
| Apple, Inc. | 2.66 % |
| Canadian Pacific Kansas City Ltd. | 2.61 % |
| Taiwan Semiconductor Manufacturing Co. Ltd. | 2.36 % |
| Mastercard, Inc., Class A | 2.13 % |
| * Excluding money market fund holdings, if any. |
invesco.com/reports
. You can also request this information by contacting us at
(800) 959-4246.
What Were The Fund Costs For The Last
Six Months
?
(Based on a hypothetical $10,000 investment)
Fund (Class) | Costs of a $10,000 investment | Costs paid as a percentage of a $10,000 investment* |
| Invesco V.I. Global Fund (Series I) | $ 42 | 0.81 % |
* | Annualized. |
What Are Key Statistics About The Fund?
(as of June 30, 2025)
| Fund net assets | $ 1,824,928,243 |
| Total number of portfolio holdings | 65 |
| Portfolio turnover rate | 12 % |
What Comprised The Fund's Holdings?
(as of June 30, 2025)
Top ten holdings*
(% of net assets)
| Meta Platforms, Inc., Class A | 9.19 % |
| Alphabet, Inc., Class A | 8.47 % |
| SAP SE | 4.57 % |
| NVIDIA Corp. | 4.33 % |
| DLF Ltd. | 4.18 % |
| S&P Global, Inc. | 4.14 % |
| Intuit, Inc. | 3.54 % |
| Airbus S.E. | 3.29 % |
| Analog Devices, Inc. | 3.25 % |
| Visa, Inc., Class A | 3.23 % |
| * Excluding money market fund holdings, if any. |
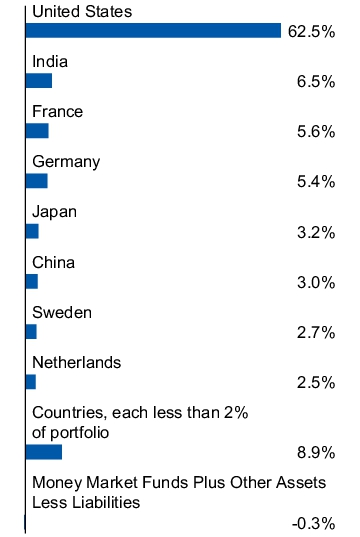
Country allocation
(% of net assets)

Top ten holdings*
(% of net assets)
| Meta Platforms, Inc., Class A | 9.19 % |
| Alphabet, Inc., Class A | 8.47 % |
| SAP SE | 4.57 % |
| NVIDIA Corp. | 4.33 % |
| DLF Ltd. | 4.18 % |
| S&P Global, Inc. | 4.14 % |
| Intuit, Inc. | 3.54 % |
| Airbus S.E. | 3.29 % |
| Analog Devices, Inc. | 3.25 % |
| Visa, Inc., Class A | 3.23 % |
| * Excluding money market fund holdings, if any. |
invesco.com/reports
. You can also request this information by contacting us at
(800) 959-4246.
What Were The Fund Costs For The Last
Six Months
?
(Based on a hypothetical $10,000 investment)
Fund (Class) | Costs of a $10,000 investment | Costs paid as a percentage of a $10,000 investment* |
| Invesco V.I. Global Fund (Series II) | $ 55 | 1.06 % |
* | Annualized. |
What Are Key Statistics About The Fund?
(as of June 30, 2025)
| Fund net assets | $ 1,824,928,243 |
| Total number of portfolio holdings | 65 |
| Portfolio turnover rate | 12 % |
What Comprised The Fund's Holdings?
(as of June 30, 2025)
Top ten holdings*
(% of net assets)
| Meta Platforms, Inc., Class A | 9.19 % |
| Alphabet, Inc., Class A | 8.47 % |
| SAP SE | 4.57 % |
| NVIDIA Corp. | 4.33 % |
| DLF Ltd. | 4.18 % |
| S&P Global, Inc. | 4.14 % |
| Intuit, Inc. | 3.54 % |
| Airbus S.E. | 3.29 % |
| Analog Devices, Inc. | 3.25 % |
| Visa, Inc., Class A | 3.23 % |
| * Excluding money market fund holdings, if any. |
Country allocation
(% of net assets)
Top ten holdings*
(% of net assets)
| Meta Platforms, Inc., Class A | 9.19 % |
| Alphabet, Inc., Class A | 8.47 % |
| SAP SE | 4.57 % |
| NVIDIA Corp. | 4.33 % |
| DLF Ltd. | 4.18 % |
| S&P Global, Inc. | 4.14 % |
| Intuit, Inc. | 3.54 % |
| Airbus S.E. | 3.29 % |
| Analog Devices, Inc. | 3.25 % |
| Visa, Inc., Class A | 3.23 % |
| * Excluding money market fund holdings, if any. |
invesco.com/reports
. You can also request this information by contacting us at
(800) 959-4246.
What Were The Fund Costs For The Last
Six Months
?
(Based on a hypothetical $10,000 investment)
Fund (Class) | Costs of a $10,000 investment | Costs paid as a percentage of a $10,000 investment* |
| Invesco V.I. Global Real Estate Fund (Series I) | $ 52 | 1.02 % |
* | Annualized. |
What Are Key Statistics About The Fund?
(as of June 30, 2025)
| Fund net assets | $ 96,596,888 |
| Total number of portfolio holdings | 87 |
| Portfolio turnover rate | 42 % |
What Comprised The Fund's Holdings?
(as of June 30, 2025)
Top ten holdings*
(% of net assets)
| Welltower, Inc. | 6.38 % |
| Equinix, Inc. | 4.97 % |
| Digital Realty Trust, Inc. | 3.98 % |
| Prologis, Inc. | 3.91 % |
| Equity Residential | 3.16 % |
| Goodman Group | 2.95 % |
| AvalonBay Communities, Inc. | 2.77 % |
| Iron Mountain, Inc. | 2.48 % |
| Mitsui Fudosan Co. Ltd. | 2.36 % |
| Extra Space Storage, Inc. | 2.28 % |
| * Excluding money market fund holdings, if any. |
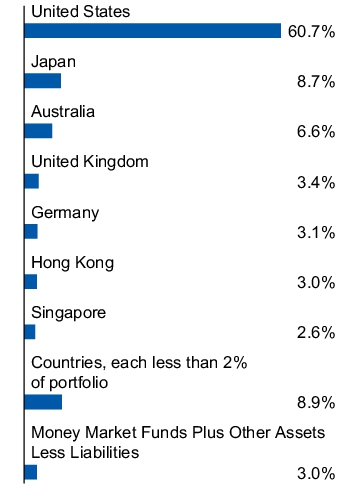
Country allocation
(% of net assets)
Top ten holdings*
(% of net assets)
| Welltower, Inc. | 6.38 % |
| Equinix, Inc. | 4.97 % |
| Digital Realty Trust, Inc. | 3.98 % |
| Prologis, Inc. | 3.91 % |
| Equity Residential | 3.16 % |
| Goodman Group | 2.95 % |
| AvalonBay Communities, Inc. | 2.77 % |
| Iron Mountain, Inc. | 2.48 % |
| Mitsui Fudosan Co. Ltd. | 2.36 % |
| Extra Space Storage, Inc. | 2.28 % |
| * Excluding money market fund holdings, if any. |
invesco.com/reports
. You can also request this information by contacting us at
(800) 959-4246.
What Were The Fund Costs For The Last
Six Months
?
(Based on a hypothetical $10,000 investment)
Fund (Class) | Costs of a $10,000 investment | Costs paid as a percentage of a $10,000 investment* |
| Invesco V.I. Global Real Estate Fund (Series II) | $ 65 | 1.27 % |
* | Annualized. |
What Are Key Statistics About The Fund?
(as of June 30, 2025)
| Fund net assets | $ 96,596,888 |
| Total number of portfolio holdings | 87 |
| Portfolio turnover rate | 42 % |
What Comprised The Fund's Holdings?
(as of June 30, 2025)
Top ten holdings*
(% of net assets)
| Welltower, Inc. | 6.38 % |
| Equinix, Inc. | 4.97 % |
| Digital Realty Trust, Inc. | 3.98 % |
| Prologis, Inc. | 3.91 % |
| Equity Residential | 3.16 % |
| Goodman Group | 2.95 % |
| AvalonBay Communities, Inc. | 2.77 % |
| Iron Mountain, Inc. | 2.48 % |
| Mitsui Fudosan Co. Ltd. | 2.36 % |
| Extra Space Storage, Inc. | 2.28 % |
| * Excluding money market fund holdings, if any. |
Country allocation
(% of net assets)

Top ten holdings*
(% of net assets)
| Welltower, Inc. | 6.38 % |
| Equinix, Inc. | 4.97 % |
| Digital Realty Trust, Inc. | 3.98 % |
| Prologis, Inc. | 3.91 % |
| Equity Residential | 3.16 % |
| Goodman Group | 2.95 % |
| AvalonBay Communities, Inc. | 2.77 % |
| Iron Mountain, Inc. | 2.48 % |
| Mitsui Fudosan Co. Ltd. | 2.36 % |
| Extra Space Storage, Inc. | 2.28 % |
| * Excluding money market fund holdings, if any. |
invesco.com/reports
. You can also request this information by contacting us at
(800) 959-4246.
What Were The Fund Costs For The Last
Six Months
?
(Based on a hypothetical $10,000 investment)
Fund (Class) | Costs of a $10,000 investment | Costs paid as a percentage of a $10,000 investment* |
| Invesco V.I. Global Strategic Income Fund (Series I) | $ 49 | 0.96 % † |
* | Annualized. |
† | Reflects fee waivers and/or expense reimbursements, without which expenses would have been higher. |
What Are Key Statistics About The Fund?
(as of June 30, 2025)
| Fund net assets | $ 676,731,715 |
| Total number of portfolio holdings | 909 |
| Portfolio turnover rate | 267 % |
What Comprised The Fund's Holdings?
(as of June 30, 2025)
Top ten holdings*
(% of net assets)
| Brazil Notas do Tesouro Nacional, Series F, 10.00%, 01/01/2027 | 5.29 % |
| Mexican Bonos, 8.50%, 02/28/2030 | 2.85 % |
| U.S. Treasury Bills, 4.11%, 05/14/2026 | 2.74 % |
| U.S. Treasury Inflation - Indexed Bonds, 2.13%, 02/15/2054 | 2.14 % |
| U.S. Treasury Inflation - Indexed Bonds, 1.50%, 02/15/2053 | 1.92 % |
| Republic of South Africa Government Bond, Series 2032, 8.25%, 03/31/2032 | 1.45 % |
| Mortgage Funding PLC, Series 2008-1, Class B2, 7.56%, 03/13/2046 | 1.27 % |
| Mexican Udibonos, 4.00%, 08/30/2029 | 1.17 % |
| Republic of South Africa Government Bond, Series 2040, 9.00%, 01/31/2040 | 0.97 % |
| Japan Government Bond, 3.10%, 03/20/2065 | 0.97 % |
| * Excluding money market fund holdings, if any. |
Security type allocation
(% of total investments)

Top ten holdings*
(% of net assets)
| Brazil Notas do Tesouro Nacional, Series F, 10.00%, 01/01/2027 | 5.29 % |
| Mexican Bonos, 8.50%, 02/28/2030 | 2.85 % |
| U.S. Treasury Bills, 4.11%, 05/14/2026 | 2.74 % |
| U.S. Treasury Inflation - Indexed Bonds, 2.13%, 02/15/2054 | 2.14 % |
| U.S. Treasury Inflation - Indexed Bonds, 1.50%, 02/15/2053 | 1.92 % |
| Republic of South Africa Government Bond, Series 2032, 8.25%, 03/31/2032 | 1.45 % |
| Mortgage Funding PLC, Series 2008-1, Class B2, 7.56%, 03/13/2046 | 1.27 % |
| Mexican Udibonos, 4.00%, 08/30/2029 | 1.17 % |
| Republic of South Africa Government Bond, Series 2040, 9.00%, 01/31/2040 | 0.97 % |
| Japan Government Bond, 3.10%, 03/20/2065 | 0.97 % |
| * Excluding money market fund holdings, if any. |
invesco.com/reports
. You can also request this information by contacting us at
(800) 959-4246.
What Were The Fund Costs For The Last
Six Months
?
(Based on a hypothetical $10,000 investment)
Fund (Class) | Costs of a $10,000 investment | Costs paid as a percentage of a $10,000 investment* |
| Invesco V.I. Global Strategic Income Fund (Series II) | $ 62 | 1.21 % † |
* | Annualized. |
† | Reflects fee waivers and/or expense reimbursements, without which expenses would have been higher. |
What Are Key Statistics About The Fund?
(as of June 30, 2025)
| Fund net assets | $ 676,731,715 |
| Total number of portfolio holdings | 909 |
| Portfolio turnover rate | 267 % |
What Comprised The Fund's Holdings?
(as of June 30, 2025)
Top ten holdings*
(% of net assets)
| Brazil Notas do Tesouro Nacional, Series F, 10.00%, 01/01/2027 | 5.29 % |
| Mexican Bonos, 8.50%, 02/28/2030 | 2.85 % |
| U.S. Treasury Bills, 4.11%, 05/14/2026 | 2.74 % |
| U.S. Treasury Inflation - Indexed Bonds, 2.13%, 02/15/2054 | 2.14 % |
| U.S. Treasury Inflation - Indexed Bonds, 1.50%, 02/15/2053 | 1.92 % |
| Republic of South Africa Government Bond, Series 2032, 8.25%, 03/31/2032 | 1.45 % |
| Mortgage Funding PLC, Series 2008-1, Class B2, 7.56%, 03/13/2046 | 1.27 % |
| Mexican Udibonos, 4.00%, 08/30/2029 | 1.17 % |
| Republic of South Africa Government Bond, Series 2040, 9.00%, 01/31/2040 | 0.97 % |
| Japan Government Bond, 3.10%, 03/20/2065 | 0.97 % |
| * Excluding money market fund holdings, if any. |
Security type allocation
(% of total investments)
Top ten holdings*
(% of net assets)
| Brazil Notas do Tesouro Nacional, Series F, 10.00%, 01/01/2027 | 5.29 % |
| Mexican Bonos, 8.50%, 02/28/2030 | 2.85 % |
| U.S. Treasury Bills, 4.11%, 05/14/2026 | 2.74 % |
| U.S. Treasury Inflation - Indexed Bonds, 2.13%, 02/15/2054 | 2.14 % |
| U.S. Treasury Inflation - Indexed Bonds, 1.50%, 02/15/2053 | 1.92 % |
| Republic of South Africa Government Bond, Series 2032, 8.25%, 03/31/2032 | 1.45 % |
| Mortgage Funding PLC, Series 2008-1, Class B2, 7.56%, 03/13/2046 | 1.27 % |
| Mexican Udibonos, 4.00%, 08/30/2029 | 1.17 % |
| Republic of South Africa Government Bond, Series 2040, 9.00%, 01/31/2040 | 0.97 % |
| Japan Government Bond, 3.10%, 03/20/2065 | 0.97 % |
| * Excluding money market fund holdings, if any. |
invesco.com/reports
. You can also request this information by contacting us at
(800) 959-4246.
What Were The Fund Costs For The Last
Six Months
?
(Based on a hypothetical $10,000 investment)
Fund (Class) | Costs of a $10,000 investment | Costs paid as a percentage of a $10,000 investment* |
| Invesco V.I. Government Money Market Fund (Series I) | $ 18 | 0.36 % |
* | Annualized. |
What Are Key Statistics About The Fund?
(as of June 30, 2025)
| Fund net assets | $ 926,108,266 |
| Total number of portfolio holdings | 81 |
What Comprised The Fund's Holdings?
(as of June 30, 2025)
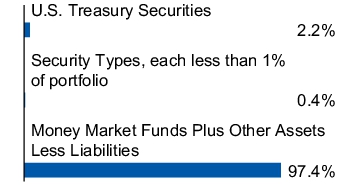
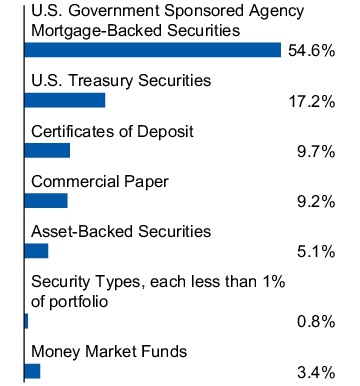
Composition by maturity, in days
(% of total investments)*
| 1-7 | 64.9 % |
| 8-30 | 0.5 % |
| 31-60 | 2.5 % |
| 61-90 | 4.3 % |
| 91-180 | 5.9 % |
| 181+ | 21.9 % |
| * The number of days to maturity of each holding is determined in accordance with the provisions of Rule 2a-7 under the Investment Company Act of 1940. |
invesco.com/reports
. You can also request this information by contacting us at
(800) 959-4246.
What Were The Fund Costs For The Last
Six Months
?
(Based on a hypothetical $10,000 investment)
Fund (Class) | Costs of a $10,000 investment | Costs paid as a percentage of a $10,000 investment* |
| Invesco V.I. Government Money Market Fund (Series II) | $ 31 | 0.61 % |
* | Annualized. |
What Are Key Statistics About The Fund?
(as of June 30, 2025)
| Fund net assets | $ 926,108,266 |
| Total number of portfolio holdings | 81 |
What Comprised The Fund's Holdings?
(as of June 30, 2025)
Composition by maturity, in days
(% of total investments)*
| 1-7 | 64.9 % |
| 8-30 | 0.5 % |
| 31-60 | 2.5 % |
| 61-90 | 4.3 % |
| 91-180 | 5.9 % |
| 181+ | 21.9 % |
| * The number of days to maturity of each holding is determined in accordance with the provisions of Rule 2a-7 under the Investment Company Act of 1940. |
invesco.com/reports
. You can also request this information by contacting us at
(800) 959-4246.
What Were The Fund Costs For The Last
Six Months
?
(Based on a hypothetical $10,000 investment)
Fund (Class) | Costs of a $10,000 investment | Costs paid as a percentage of a $10,000 investment* |
| Invesco V.I. Government Securities Fund (Series I) | $ 35 | 0.70 % |
* | Annualized. |
What Are Key Statistics About The Fund?
(as of June 30, 2025)
| Fund net assets | $ 310,755,194 |
| Total number of portfolio holdings | 410 |
| Portfolio turnover rate | 179 % |
What Comprised The Fund's Holdings?
(as of June 30, 2025)
Top ten holdings*
(% of net assets)
| Government National Mortgage Association, TBA, 5.00%, 07/01/2055 | 4.84 % |
| Uniform Mortgage-Backed Securities, TBA, 5.00%, 07/01/2055 | 4.39 % |
| Government National Mortgage Association, TBA, 5.50%, 07/01/2055 | 4.34 % |
| BNP Paribas S.A., 4.64%, 02/06/2026 | 2.90 % |
| UBS AG, 4.70%, 05/15/2026 | 2.90 % |
| Mizuho Bank Ltd., 4.71%, 02/25/2026 | 2.90 % |
| Uniform Mortgage-Backed Securities, TBA, 6.00%, 07/01/2055 | 2.84 % |
| U.S. Treasury Notes, 1.13%, 02/28/2027 | 2.82 % |
| BofA Securities, Inc., 4.72%, 03/19/2026 | 2.58 % |
| Bank of Montreal, 4.66%, 03/19/2026 | 2.57 % |
| * Excluding money market fund holdings, if any. |
Security type allocation
(% of total investments)

Top ten holdings*
(% of net assets)
| Government National Mortgage Association, TBA, 5.00%, 07/01/2055 | 4.84 % |
| Uniform Mortgage-Backed Securities, TBA, 5.00%, 07/01/2055 | 4.39 % |
| Government National Mortgage Association, TBA, 5.50%, 07/01/2055 | 4.34 % |
| BNP Paribas S.A., 4.64%, 02/06/2026 | 2.90 % |
| UBS AG, 4.70%, 05/15/2026 | 2.90 % |
| Mizuho Bank Ltd., 4.71%, 02/25/2026 | 2.90 % |
| Uniform Mortgage-Backed Securities, TBA, 6.00%, 07/01/2055 | 2.84 % |
| U.S. Treasury Notes, 1.13%, 02/28/2027 | 2.82 % |
| BofA Securities, Inc., 4.72%, 03/19/2026 | 2.58 % |
| Bank of Montreal, 4.66%, 03/19/2026 | 2.57 % |
| * Excluding money market fund holdings, if any. |
invesco.com/reports
. You can also request this information by contacting us at
(800) 959-4246.
What Were The Fund Costs For The Last
Six Months
?
(Based on a hypothetical $10,000 investment)
Fund (Class) | Costs of a $10,000 investment | Costs paid as a percentage of a $10,000 investment* |
| Invesco V.I. Government Securities Fund (Series II) | $ 48 | 0.95 % |
* | Annualized. |
What Are Key Statistics About The Fund?
(as of June 30, 2025)
| Fund net assets | $ 310,755,194 |
| Total number of portfolio holdings | 410 |
| Portfolio turnover rate | 179 % |
What Comprised The Fund's Holdings?
(as of June 30, 2025)
Top ten holdings*
(% of net assets)
| Government National Mortgage Association, TBA, 5.00%, 07/01/2055 | 4.84 % |
| Uniform Mortgage-Backed Securities, TBA, 5.00%, 07/01/2055 | 4.39 % |
| Government National Mortgage Association, TBA, 5.50%, 07/01/2055 | 4.34 % |
| BNP Paribas S.A., 4.64%, 02/06/2026 | 2.90 % |
| UBS AG, 4.70%, 05/15/2026 | 2.90 % |
| Mizuho Bank Ltd., 4.71%, 02/25/2026 | 2.90 % |
| Uniform Mortgage-Backed Securities, TBA, 6.00%, 07/01/2055 | 2.84 % |
| U.S. Treasury Notes, 1.13%, 02/28/2027 | 2.82 % |
| BofA Securities, Inc., 4.72%, 03/19/2026 | 2.58 % |
| Bank of Montreal, 4.66%, 03/19/2026 | 2.57 % |
| * Excluding money market fund holdings, if any. |
Security type allocation
(% of total investments)
Top ten holdings*
(% of net assets)
| Government National Mortgage Association, TBA, 5.00%, 07/01/2055 | 4.84 % |
| Uniform Mortgage-Backed Securities, TBA, 5.00%, 07/01/2055 | 4.39 % |
| Government National Mortgage Association, TBA, 5.50%, 07/01/2055 | 4.34 % |
| BNP Paribas S.A., 4.64%, 02/06/2026 | 2.90 % |
| UBS AG, 4.70%, 05/15/2026 | 2.90 % |
| Mizuho Bank Ltd., 4.71%, 02/25/2026 | 2.90 % |
| Uniform Mortgage-Backed Securities, TBA, 6.00%, 07/01/2055 | 2.84 % |
| U.S. Treasury Notes, 1.13%, 02/28/2027 | 2.82 % |
| BofA Securities, Inc., 4.72%, 03/19/2026 | 2.58 % |
| Bank of Montreal, 4.66%, 03/19/2026 | 2.57 % |
| * Excluding money market fund holdings, if any. |
invesco.com/reports
. You can also request this information by contacting us at
(800) 959-4246.
What Were The Fund Costs For The Last
Six Months
?
(Based on a hypothetical $10,000 investment)
Fund (Class) | Costs of a $10,000 investment | Costs paid as a percentage of a $10,000 investment* |
| Invesco V.I. Growth and Income Fund (Series I) | $ 38 | 0.75 % |
* | Annualized. |
What Are Key Statistics About The Fund?
(as of June 30, 2025)
| Fund net assets | $ 1,287,146,585 |
| Total number of portfolio holdings | 99 |
| Portfolio turnover rate | 22 % |
What Comprised The Fund's Holdings?
(as of June 30, 2025)
Top ten holdings*
(% of net assets)
| Wells Fargo & Co. | 3.45 % |
| Bank of America Corp. | 3.32 % |
| Microsoft Corp. | 2.52 % |
| Amazon.com, Inc. | 2.45 % |
| Philip Morris International, Inc. | 2.14 % |
| Microchip Technology, Inc. | 2.14 % |
| Walt Disney Co. (The) | 1.97 % |
| Johnson & Johnson | 1.94 % |
| Charles Schwab Corp. (The) | 1.93 % |
| Parker-Hannifin Corp. | 1.92 % |
| * Excluding money market fund holdings, if any. |
Sector allocation
(% of net assets)
Top ten holdings*
(% of net assets)
| Wells Fargo & Co. | 3.45 % |
| Bank of America Corp. | 3.32 % |
| Microsoft Corp. | 2.52 % |
| Amazon.com, Inc. | 2.45 % |
| Philip Morris International, Inc. | 2.14 % |
| Microchip Technology, Inc. | 2.14 % |
| Walt Disney Co. (The) | 1.97 % |
| Johnson & Johnson | 1.94 % |
| Charles Schwab Corp. (The) | 1.93 % |
| Parker-Hannifin Corp. | 1.92 % |
| * Excluding money market fund holdings, if any. |
invesco.com/reports
. You can also request this information by contacting us at
(800) 959-4246.
What Were The Fund Costs For The Last
Six Months
?
(Based on a hypothetical $10,000 investment)
Fund (Class) | Costs of a $10,000 investment | Costs paid as a percentage of a $10,000 investment* |
| Invesco V.I. Growth and Income Fund (Series II) | $ 51 | 1.00 % |
* | Annualized. |
What Are Key Statistics About The Fund?
(as of June 30, 2025)
| Fund net assets | $ 1,287,146,585 |
| Total number of portfolio holdings | 99 |
| Portfolio turnover rate | 22 % |
What Comprised The Fund's Holdings?
(as of June 30, 2025)
Top ten holdings*
(% of net assets)
| Wells Fargo & Co. | 3.45 % |
| Bank of America Corp. | 3.32 % |
| Microsoft Corp. | 2.52 % |
| Amazon.com, Inc. | 2.45 % |
| Philip Morris International, Inc. | 2.14 % |
| Microchip Technology, Inc. | 2.14 % |
| Walt Disney Co. (The) | 1.97 % |
| Johnson & Johnson | 1.94 % |
| Charles Schwab Corp. (The) | 1.93 % |
| Parker-Hannifin Corp. | 1.92 % |
| * Excluding money market fund holdings, if any. |
Sector allocation
(% of net assets)

Top ten holdings*
(% of net assets)
| Wells Fargo & Co. | 3.45 % |
| Bank of America Corp. | 3.32 % |
| Microsoft Corp. | 2.52 % |
| Amazon.com, Inc. | 2.45 % |
| Philip Morris International, Inc. | 2.14 % |
| Microchip Technology, Inc. | 2.14 % |
| Walt Disney Co. (The) | 1.97 % |
| Johnson & Johnson | 1.94 % |
| Charles Schwab Corp. (The) | 1.93 % |
| Parker-Hannifin Corp. | 1.92 % |
| * Excluding money market fund holdings, if any. |
invesco.com/reports
. You can also request this information by contacting us at
(800) 959-4246.
What Were The Fund Costs For The Last
Six Months
?
(Based on a hypothetical $10,000 investment)
Fund (Class) | Costs of a $10,000 investment | Costs paid as a percentage of a $10,000 investment* |
| Invesco V.I. Health Care Fund (Series I) | $ 49 | 0.98 % |
* | Annualized. |
What Are Key Statistics About The Fund?
(as of June 30, 2025)
| Fund net assets | $ 158,468,450 |
| Total number of portfolio holdings | 78 |
| Portfolio turnover rate | 26 % |
What Comprised The Fund's Holdings?
(as of June 30, 2025)
Top ten holdings*
(% of net assets)
| Boston Scientific Corp. | 10.13 % |
| Eli Lilly and Co. | 8.78 % |
| Stryker Corp. | 5.07 % |
| Cencora, Inc. | 4.05 % |
| AbbVie, Inc. | 3.93 % |
| Abbott Laboratories | 3.69 % |
| Intuitive Surgical, Inc. | 3.30 % |
| Vertex Pharmaceuticals, Inc. | 3.27 % |
| Encompass Health Corp. | 2.42 % |
| UnitedHealth Group, Inc. | 2.39 % |
| * Excluding money market fund holdings, if any. |
Country allocation
(% of net assets)
Top ten holdings*
(% of net assets)
| Boston Scientific Corp. | 10.13 % |
| Eli Lilly and Co. | 8.78 % |
| Stryker Corp. | 5.07 % |
| Cencora, Inc. | 4.05 % |
| AbbVie, Inc. | 3.93 % |
| Abbott Laboratories | 3.69 % |
| Intuitive Surgical, Inc. | 3.30 % |
| Vertex Pharmaceuticals, Inc. | 3.27 % |
| Encompass Health Corp. | 2.42 % |
| UnitedHealth Group, Inc. | 2.39 % |
| * Excluding money market fund holdings, if any. |
invesco.com/reports
. You can also request this information by contacting us at
(800) 959-4246.
What Were The Fund Costs For The Last
Six Months
?
(Based on a hypothetical $10,000 investment)
Fund (Class) | Costs of a $10,000 investment | Costs paid as a percentage of a $10,000 investment* |
| Invesco V.I. Health Care Fund (Series II) | $ 62 | 1.23 % |
* | Annualized. |
What Are Key Statistics About The Fund?
(as of June 30, 2025)
| Fund net assets | $ 158,468,450 |
| Total number of portfolio holdings | 78 |
| Portfolio turnover rate | 26 % |
What Comprised The Fund's Holdings?
(as of June 30, 2025)
Top ten holdings*
(% of net assets)
| Boston Scientific Corp. | 10.13 % |
| Eli Lilly and Co. | 8.78 % |
| Stryker Corp. | 5.07 % |
| Cencora, Inc. | 4.05 % |
| AbbVie, Inc. | 3.93 % |
| Abbott Laboratories | 3.69 % |
| Intuitive Surgical, Inc. | 3.30 % |
| Vertex Pharmaceuticals, Inc. | 3.27 % |
| Encompass Health Corp. | 2.42 % |
| UnitedHealth Group, Inc. | 2.39 % |
| * Excluding money market fund holdings, if any. |
Country allocation
(% of net assets)

Top ten holdings*
(% of net assets)
| Boston Scientific Corp. | 10.13 % |
| Eli Lilly and Co. | 8.78 % |
| Stryker Corp. | 5.07 % |
| Cencora, Inc. | 4.05 % |
| AbbVie, Inc. | 3.93 % |
| Abbott Laboratories | 3.69 % |
| Intuitive Surgical, Inc. | 3.30 % |
| Vertex Pharmaceuticals, Inc. | 3.27 % |
| Encompass Health Corp. | 2.42 % |
| UnitedHealth Group, Inc. | 2.39 % |
| * Excluding money market fund holdings, if any. |
invesco.com/reports
. You can also request this information by contacting us at
(800) 959-4246.
What Were The Fund Costs For The Last
Six Months
?
(Based on a hypothetical $10,000 investment)
Fund (Class) |
Costs of a $10,000 investment |
Costs paid as a percentage of a $10,000 investment* |
| Invesco V.I. High Yield Fund (Series I) |
$ 43 |
0.86 % |
* |
Annualized. |
What Are Key Statistics About The Fund?
(as of June 30, 2025)
| Fund net assets | $ 150,370,414 |
| Total number of portfolio holdings | 297 |
| Portfolio turnover rate | 110 % |
What Comprised The Fund's Holdings?
(as of June 30, 2025)
Top ten holdings*
(% of net assets)
| Vistra Corp., Series C, 8.88% | 1.11 % |
| Avation Capital S.A., 9.00% PIK Rate, 8.25% Cash Rate, 8.25%, 10/31/2026 | 1.01 % |
| TransDigm, Inc., Term Loan L, 6.80%, 01/19/2032 | 1.00 % |
| New Gold, Inc., 6.88%, 04/01/2032 | 1.00 % |
| Aircastle Ltd., 5.25% | 0.98 % |
| Vodafone Group PLC, 4.13%, 06/04/2081 | 0.97 % |
| EZCORP, Inc., 7.38%, 04/01/2032 | 0.96 % |
| Venture Global LNG, Inc., 9.00% | 0.95 % |
| Iliad Holding S.A.S.U., 8.50%, 04/15/2031 | 0.80 % |
| EchoStar Corp., 6.75% PIK Rate, 2.00% Cash Rate, 6.75%, 11/30/2030 | 0.80 % |
| * Excluding money market fund holdings, if any. |
Credit quality rating breakdown**
(% of net assets)
| BBB | 3.36 |
| BB | 47.52 |
| B | 34.08 |
| CCC and below | 11.62 |
| Cash | 2.58 |
| Not Rated | 0.84 |
| **Source: Standard & Poor's. A credit rating is an assessment provided by a nationally recognized statistical rating organization (NRSRO) of the creditworthiness of an issuer with respect to debt obligations, including specific securities, money market instruments or other debts. Ratings are measured on a scale that generally ranges from AAA (highest) to D (lowest); ratings are subject to change without notice. "Non-Rated" indicates the debtor was not rated, and should not be interpreted as indicating low quality. For more information on Standard & Poor's rating methodology, please visit standardandpoors.com and select "Understanding Ratings" under Rating Resources on the homepage. |
Top ten holdings*
(% of net assets)
| Vistra Corp., Series C, 8.88% | 1.11 % |
| Avation Capital S.A., 9.00% PIK Rate, 8.25% Cash Rate, 8.25%, 10/31/2026 | 1.01 % |
| TransDigm, Inc., Term Loan L, 6.80%, 01/19/2032 | 1.00 % |
| New Gold, Inc., 6.88%, 04/01/2032 | 1.00 % |
| Aircastle Ltd., 5.25% | 0.98 % |
| Vodafone Group PLC, 4.13%, 06/04/2081 | 0.97 % |
| EZCORP, Inc., 7.38%, 04/01/2032 | 0.96 % |
| Venture Global LNG, Inc., 9.00% | 0.95 % |
| Iliad Holding S.A.S.U., 8.50%, 04/15/2031 | 0.80 % |
| EchoStar Corp., 6.75% PIK Rate, 2.00% Cash Rate, 6.75%, 11/30/2030 | 0.80 % |
| * Excluding money market fund holdings, if any. |
invesco.com/reports
. You can also request this information by contacting us at
(800) 959-4246.
What Were The Fund Costs For The Last
Six Months
?
(Based on a hypothetical $10,000 investment)
Fund (Class) |
Costs of a $10,000 investment |
Costs paid as a percentage of a $10,000 investment* |
| Invesco V.I. High Yield Fund (Series II) |
$ 56 |
1.11 % |
* |
Annualized. |
What Are Key Statistics About The Fund?
(as of June 30, 2025)
| Fund net assets | $ 150,370,414 |
| Total number of portfolio holdings | 297 |
| Portfolio turnover rate | 110 % |
What Comprised The Fund's Holdings?
(as of June 30, 2025)
Top ten holdings*
(% of net assets)
| Vistra Corp., Series C, 8.88% | 1.11 % |
| Avation Capital S.A., 9.00% PIK Rate, 8.25% Cash Rate, 8.25%, 10/31/2026 | 1.01 % |
| TransDigm, Inc., Term Loan L, 6.80%, 01/19/2032 | 1.00 % |
| New Gold, Inc., 6.88%, 04/01/2032 | 1.00 % |
| Aircastle Ltd., 5.25% | 0.98 % |
| Vodafone Group PLC, 4.13%, 06/04/2081 | 0.97 % |
| EZCORP, Inc., 7.38%, 04/01/2032 | 0.96 % |
| Venture Global LNG, Inc., 9.00% | 0.95 % |
| Iliad Holding S.A.S.U., 8.50%, 04/15/2031 | 0.80 % |
| EchoStar Corp., 6.75% PIK Rate, 2.00% Cash Rate, 6.75%, 11/30/2030 | 0.80 % |
| * Excluding money market fund holdings, if any. |
Credit quality rating breakdown**
(% of net assets)
| BBB | 3.36 |
| BB | 47.52 |
| B | 34.08 |
| CCC and below | 11.62 |
| Cash | 2.58 |
| Not Rated | 0.84 |
| **Source: Standard & Poor's. A credit rating is an assessment provided by a nationally recognized statistical rating organization (NRSRO) of the creditworthiness of an issuer with respect to debt obligations, including specific securities, money market instruments or other debts. Ratings are measured on a scale that generally ranges from AAA (highest) to D (lowest); ratings are subject to change without notice. "Non-Rated" indicates the debtor was not rated, and should not be interpreted as indicating low quality. For more information on Standard & Poor's rating methodology, please visit standardandpoors.com and select "Understanding Ratings" under Rating Resources on the homepage. |
Top ten holdings*
(% of net assets)
| Vistra Corp., Series C, 8.88% | 1.11 % |
| Avation Capital S.A., 9.00% PIK Rate, 8.25% Cash Rate, 8.25%, 10/31/2026 | 1.01 % |
| TransDigm, Inc., Term Loan L, 6.80%, 01/19/2032 | 1.00 % |
| New Gold, Inc., 6.88%, 04/01/2032 | 1.00 % |
| Aircastle Ltd., 5.25% | 0.98 % |
| Vodafone Group PLC, 4.13%, 06/04/2081 | 0.97 % |
| EZCORP, Inc., 7.38%, 04/01/2032 | 0.96 % |
| Venture Global LNG, Inc., 9.00% | 0.95 % |
| Iliad Holding S.A.S.U., 8.50%, 04/15/2031 | 0.80 % |
| EchoStar Corp., 6.75% PIK Rate, 2.00% Cash Rate, 6.75%, 11/30/2030 | 0.80 % |
| * Excluding money market fund holdings, if any. |
®
(the “Fund”) for the period January 1, 2025 to June 30, 2025.
invesco.com/reports
. You can also request this information by contacting us at
(800) 959-4246.
What Were The Fund Costs For The Last
Six Months
?
(Based on a hypothetical $10,000 investment)
Fund (Class) | Costs of a $10,000 investment | Costs paid as a percentage of a $10,000 investment* |
| Invesco V.I. Main Street Fund ® (Series I) | $ 41 | 0.80 % † |
* | Annualized. |
† | Reflects fee waivers and/or expense reimbursements, without which expenses would have been higher. |
What Are Key Statistics About The Fund?
(as of June 30, 2025)
| Fund net assets | $ 783,536,809 |
| Total number of portfolio holdings | 74 |
| Portfolio turnover rate | 25 % |
What Comprised The Fund's Holdings?
(as of June 30, 2025)
Top ten h
oldi
ngs*(% of net assets)
| Microsoft Corp. | 9.08 % |
| NVIDIA Corp. | 8.13 % |
| Apple, Inc. | 5.42 % |
| Amazon.com, Inc. | 5.14 % |
| Alphabet, Inc., Class A | 3.33 % |
| Meta Platforms, Inc., Class A | 3.31 % |
| Broadcom, Inc. | 2.95 % |
| JPMorgan Chase & Co. | 2.76 % |
| Philip Morris International, Inc. | 2.41 % |
| Mastercard, Inc., Class A | 1.99 % |
| * Excluding money market fund holdings, if any. |
Sector allocation
(% of net assets)

Top ten h
oldi
ngs*(% of net assets)
| Microsoft Corp. | 9.08 % |
| NVIDIA Corp. | 8.13 % |
| Apple, Inc. | 5.42 % |
| Amazon.com, Inc. | 5.14 % |
| Alphabet, Inc., Class A | 3.33 % |
| Meta Platforms, Inc., Class A | 3.31 % |
| Broadcom, Inc. | 2.95 % |
| JPMorgan Chase & Co. | 2.76 % |
| Philip Morris International, Inc. | 2.41 % |
| Mastercard, Inc., Class A | 1.99 % |
| * Excluding money market fund holdings, if any. |
®
(the “Fund”) for the period January 1, 2025 to June 30, 2025.
invesco.com/reports
. You can also request this information by contacting us at
(800) 959-4246.
What Were The Fund Costs For The Last
Six Months
?
(Based on a hypothetical $10,000 investment)
Fund (Class) | Costs of a $10,000 investment | Costs paid as a percentage of a $10,000 investment* |
| Invesco V.I. Main Street Fund ® (Series II) | $ 54 | 1.05 % † |
* | Annualized. |
† | Reflects fee waivers and/or expense reimbursements, without which expenses would have been higher. |
What Are Key Statistics About The Fund?
(as of June 30, 2025)
| Fund net assets | $ 783,536,809 |
| Total number of portfolio holdings | 74 |
| Portfolio turnover rate | 25 % |
What Comprised The Fund's Holdings?
(as of June 30, 2025)
Top ten holdings*
(% of net assets)
| Microsoft Corp. | 9.08 % |
| NVIDIA Corp. | 8.13 % |
| Apple, Inc. | 5.42 % |
| Amazon.com, Inc. | 5.14 % |
| Alphabet, Inc., Class A | 3.33 % |
| Meta Platforms, Inc., Class A | 3.31 % |
| Broadcom, Inc. | 2.95 % |
| JPMorgan Chase & Co. | 2.76 % |
| Philip Morris International, Inc. | 2.41 % |
| Mastercard, Inc., Class A | 1.99 % |
| * Excluding money market fund holdings, if any. |
Sector allocation
(% of net assets)
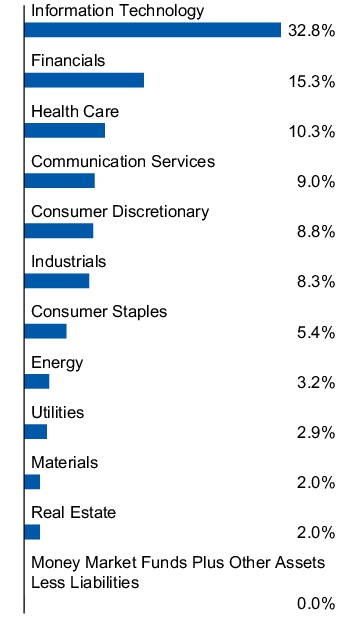
Top ten holdings*
(% of net assets)
| Microsoft Corp. | 9.08 % |
| NVIDIA Corp. | 8.13 % |
| Apple, Inc. | 5.42 % |
| Amazon.com, Inc. | 5.14 % |
| Alphabet, Inc., Class A | 3.33 % |
| Meta Platforms, Inc., Class A | 3.31 % |
| Broadcom, Inc. | 2.95 % |
| JPMorgan Chase & Co. | 2.76 % |
| Philip Morris International, Inc. | 2.41 % |
| Mastercard, Inc., Class A | 1.99 % |
| * Excluding money market fund holdings, if any. |
®
(the “Fund”) for the period January 1, 2025 to June 30, 2025.
invesco.com/reports
. You can also request this information by contacting us at
(800) 959-4246.
What Were The Fund Costs For The Last
Six Months
?
(Based on a hypothetical $10,000 investment)
Fund (Class) | Costs of a $10,000 investment | Costs paid as a percentage of a $10,000 investment* |
| Invesco V.I. Main Street Mid Cap Fund ® (Series I) | $ 48 | 0.94 % |
* | Annualized. |
What Are Key Statistics About The Fund?
(as of June 30, 2025)
| Fund net assets | $ 208,322,863 |
| Total number of portfolio holdings | 95 |
| Portfolio turnover rate | 20 % |
What Comprised The Fund's Holdings?
(as of June 30, 2025)
Top ten holdings*
(% of net assets)
| Royal Caribbean Cruises Ltd. | 2.20 % |
| Howmet Aerospace, Inc. | 1.98 % |
| Raymond James Financial, Inc. | 1.68 % |
| M&T Bank Corp. | 1.67 % |
| Electronic Arts, Inc. | 1.56 % |
| Curtiss-Wright Corp. | 1.54 % |
| Hartford Insurance Group, Inc. (The) | 1.51 % |
| Equitable Holdings, Inc. | 1.49 % |
| Cheniere Energy, Inc. | 1.47 % |
| PPL Corp. | 1.46 % |
| * Excluding money market fund holdings, if any. |
Sector allocation
(% of net assets)

Top ten holdings*
(% of net assets)
| Royal Caribbean Cruises Ltd. | 2.20 % |
| Howmet Aerospace, Inc. | 1.98 % |
| Raymond James Financial, Inc. | 1.68 % |
| M&T Bank Corp. | 1.67 % |
| Electronic Arts, Inc. | 1.56 % |
| Curtiss-Wright Corp. | 1.54 % |
| Hartford Insurance Group, Inc. (The) | 1.51 % |
| Equitable Holdings, Inc. | 1.49 % |
| Cheniere Energy, Inc. | 1.47 % |
| PPL Corp. | 1.46 % |
| * Excluding money market fund holdings, if any. |
®
(the “Fund”) for the period January 1, 2025 to June 30, 2025.
invesco.com/reports
. You can also request this information by contacting us at
(800) 959-4246.
What Were The Fund Costs For The Last
Six Months
?
(Based on a hypothetical $10,000 investment)
Fund (Class) | Costs of a $10,000 investment | Costs paid as a percentage of a $10,000 investment* |
| Invesco V.I. Main Street Mid Cap Fund ® (Series II) | $ 60 | 1.19 % |
* | Annualized. |
What Are Key Statistics About The Fund?
(as of June 30, 2025)
| Fund net assets | $ 208,322,863 |
| Total number of portfolio holdings | 95 |
| Portfolio turnover rate | 20 % |
What Comprised The Fund's Holdings?
(as of June 30, 2025)
Top ten holdings*
(% of net assets)
| Royal Caribbean Cruises Ltd. | 2.20 % |
| Howmet Aerospace, Inc. | 1.98 % |
| Raymond James Financial, Inc. | 1.68 % |
| M&T Bank Corp. | 1.67 % |
| Electronic Arts, Inc. | 1.56 % |
| Curtiss-Wright Corp. | 1.54 % |
| Hartford Insurance Group, Inc. (The) | 1.51 % |
| Equitable Holdings, Inc. | 1.49 % |
| Cheniere Energy, Inc. | 1.47 % |
| PPL Corp. | 1.46 % |
| * Excluding money market fun d ho ldings, if any. |
Sector allocation
(% of net assets)
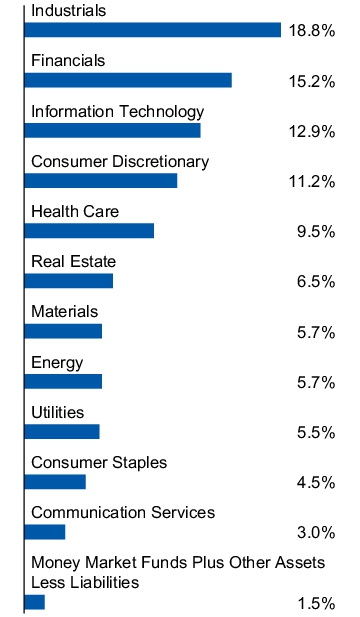
Top ten holdings*
(% of net assets)
| Royal Caribbean Cruises Ltd. | 2.20 % |
| Howmet Aerospace, Inc. | 1.98 % |
| Raymond James Financial, Inc. | 1.68 % |
| M&T Bank Corp. | 1.67 % |
| Electronic Arts, Inc. | 1.56 % |
| Curtiss-Wright Corp. | 1.54 % |
| Hartford Insurance Group, Inc. (The) | 1.51 % |
| Equitable Holdings, Inc. | 1.49 % |
| Cheniere Energy, Inc. | 1.47 % |
| PPL Corp. | 1.46 % |
| * Excluding money market fun d ho ldings, if any. |
®
(the “Fund”) for the period January 1, 2025 to June 30, 2025.
invesco.com/reports
. You can also request this information by contacting us at
(800) 959-4246.
What Were The Fund Costs For The Last
Six Months
?
(Based on a hypothetical $10,000 investment)
Fund (Class) | Costs of a $10,000 investment | Costs paid as a percentage of a $10,000 investment* |
| Invesco V.I. Main Street Small Cap Fund ® (Series I) | $ 42 | 0.85 % |
* | Annualized. |
What Are Key Statistics About The Fund?
(as of June 30, 2025)
| Fund net assets | $ 1,078,961,588 |
| Total number of portfolio holdings | 100 |
| Portfolio turnover rate | 22 % |
What Comprised
The
Fund's
Holdings?(as of June 30, 2025)
Top ten holdings*
(% of net assets)
| AutoNation, Inc. | 2.21 % |
| Itron, Inc. | 2.06 % |
| Wintrust Financial Corp. | 1.94 % |
| Casella Waste Systems, Inc., Class A | 1.78 % |
| Zurn Elkay Water Solutions Corp. | 1.69 % |
| Belden, Inc. | 1.65 % |
| Enpro, Inc. | 1.58 % |
| ESAB Corp. | 1.58 % |
| PennyMac Financial Services, Inc. | 1.57 % |
| American Healthcare REIT, Inc. | 1.53 % |
| * Excluding money market fund holdings, if any. |
Sector allocation
(% of net assets)

Top ten holdings*
(% of net assets)
| AutoNation, Inc. | 2.21 % |
| Itron, Inc. | 2.06 % |
| Wintrust Financial Corp. | 1.94 % |
| Casella Waste Systems, Inc., Class A | 1.78 % |
| Zurn Elkay Water Solutions Corp. | 1.69 % |
| Belden, Inc. | 1.65 % |
| Enpro, Inc. | 1.58 % |
| ESAB Corp. | 1.58 % |
| PennyMac Financial Services, Inc. | 1.57 % |
| American Healthcare REIT, Inc. | 1.53 % |
| * Excluding money market fund holdings, if any. |
®
(the “Fund”) for the period January 1, 2025 to June 30, 2025.
invesco.com/reports
. You can also request this information by contacting us at
(800) 959-4246.
What Were The Fund Costs For The Last
Six Months
?
(Based on a hypothetical $10,000 investment)
Fund (Class) | Costs of a $10,000 investment | Costs paid as a percentage of a $10,000 investment* |
| Invesco V.I. Main Street Small Cap Fund ® (Series II) | $ 55 | 1.10 % |
* | Annualized. |
What Are Key Statistics About The Fund?
(as of June 30, 2025)
| Fund net assets | $ 1,078,961,588 |
| Total number of portfolio holdings | 100 |
| Portfolio turnover rate | 22 % |
What Comprised The Fund's Holdings?
(as of June 30, 2025)
Top ten holdings*
(% of net assets)
| AutoNation, Inc. | 2.21 % |
| Itron, Inc. | 2.06 % |
| Wintrust Financial Corp. | 1.94 % |
| Casella Waste Systems, Inc., Class A | 1.78 % |
| Zurn Elkay Water Solutions Corp. | 1.69 % |
| Belden, Inc. | 1.65 % |
| Enpro, Inc. | 1.58 % |
| ESAB Corp. | 1.58 % |
| PennyMac Financial Services, Inc. | 1.57 % |
| American Healthcare REIT, Inc. | 1.53 % |
| * Excluding money market fund holdings, if any. |
Sector allocation
(% of net assets)
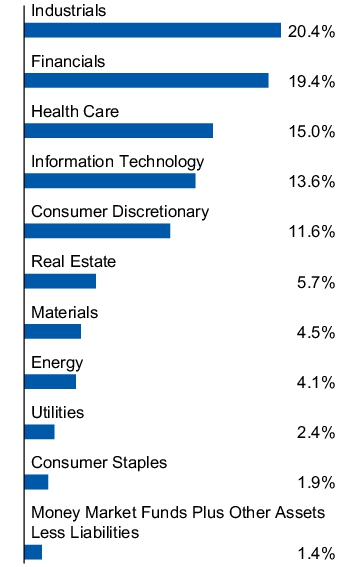
Top ten holdings*
(% of net assets)
| AutoNation, Inc. | 2.21 % |
| Itron, Inc. | 2.06 % |
| Wintrust Financial Corp. | 1.94 % |
| Casella Waste Systems, Inc., Class A | 1.78 % |
| Zurn Elkay Water Solutions Corp. | 1.69 % |
| Belden, Inc. | 1.65 % |
| Enpro, Inc. | 1.58 % |
| ESAB Corp. | 1.58 % |
| PennyMac Financial Services, Inc. | 1.57 % |
| American Healthcare REIT, Inc. | 1.53 % |
| * Excluding money market fund holdings, if any. |
®
V.I. S&P 500 Buffer Fund - December (the “Fund”) for the period January 1, 2025 to June 30, 2025.
invesco.com/reports
. You can also request this information by contacting us at
(800) 959-4246.
What Were The Fund Costs For The Last
Six Months
?
(Based on a hypothetical $10,000 investment)
Fund (Class) | Costs of a $10,000 investment | Costs paid as a percentage of a $10,000 investment* |
| Invesco ® V.I. S&P 500 Buffer Fund - December(Series I) | $ 35 | 0.69 % † |
* | Annualized. |
† | Reflects fee waivers and/or expense reimbursements, without which expenses would have been higher. |
What Are Key Statistics About The Fund?
(as of June 30, 2025)
| Fund net assets | $ 56,167,196 |
| Total number of portfolio holdings | 6 |
| Portfolio turnover rate | 0 % |
What Comprised The Fund's Holdings?
(as of June 30, 2025)
Security type allocation
(% of total investments)
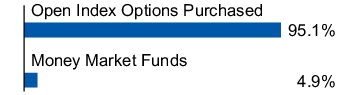
®
V.I. S&P 500 Buffer Fund - December (the “Fund”) for the period January 1, 2025 to June 30, 2025.
invesco.com/reports
. You can also request this information by contacting us at
(800) 959-4246.
What Were The Fund Costs For The Last
Six Months
?
(Based on a hypothetical $10,000 investment)
Fund (Class) | Costs of a $10,000 investment | Costs paid as a percentage of a $10,000 investment* |
| Invesco ® V.I. S&P 500 Buffer Fund - December(Series II) | $ 48 | 0.94 % † |
* | Annualized. |
† | Reflects fee waivers and/or expense reimbursements, without which expenses would have been higher. |
What Are Key Statistics About The Fund?
(as of June 30, 2025)
| Fund net assets | $ 56,167,196 |
| Total number of portfolio holdings | 6 |
| Portfolio turnover rate | 0 % |
What
Comprised
The Fund's Holdings?(as of June 30, 2025)
Security type allocation
(% of total investments)

®
V.I. S&P 500 Buffer Fund – June (the “Fund”) for the period January 1, 2025 to June 30, 2025.
invesco.com/reports
. You can also request this information by contacting us at
(800) 959-4246.
What Were The Fund Costs For The Last
Six Months
?
(Based on a hypothetical $10,000 investment)
Fund (Class) | Costs of a $10,000 investment | Costs paid as a percentage of a $10,000 investment* |
| Invesco ® V.I. S&P 500 Buffer Fund – June(Series I) | $ 36 | 0.70 % † |
* | Annualized. |
† | Reflects fee waivers and/or expense reimbursements, without which expenses would have been higher. |
What Are Key Statistics About The Fund?
(as of June 30, 2025)
| Fund net assets | $ 46,539,201 |
| Total number of portfolio holdings | 6 |
| Portfolio turnover rate | 0 % |
What Comprised The Fund's Holdings?
(as of June 30, 2025)
Security type allocation
(% of total investments)

®
V.I. S&P 500 Buffer Fund – June (the “Fund”) for the period January 1, 2025 to June 30, 2025.
invesco.com/reports
. You can also request this information by contacting us at
(800) 959-4246.
What Were The Fund Costs For The Last
Six Months
?
(Based on a hypothetical $10,000 investment)
Fund (Class) | Costs of a $10,000 investment | Costs paid as a percentage of a $10,000 investment* |
| Invesco ® V.I. S&P 500 Buffer Fund – June(Series II) | $ 49 | 0.95 % † |
* | Annualized. |
† | Reflects fee waivers and/or expense reimbursements, without which expenses would have been higher. |
What Are Key Statistics About The Fund?
(as of June 30, 2025)
| Fund net assets | $ 46,539,201 |
| Total number of portfolio holdings | 6 |
| Portfolio turnover rate | 0 % |
What Comprised The Fund's Holdings?
(as of June 30, 2025)
Security type allocation
(% of total investments)
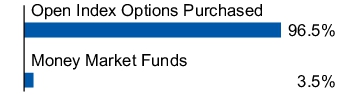
®
V.I. S&P 500 Buffer Fund - March (the “Fund”) for the period January 1, 2025 to June 30, 2025.
invesco.com/reports
. You can also request this information by contacting us at
(800) 959-4246.
What Were The Fund Costs For The Last
Six Months
?
(Based on a hypothetical $10,000 investment)
Fund (Class) | Costs of a $10,000 investment | Costs paid as a percentage of a $10,000 investment* |
| Invesco ® V.I. S&P 500 Buffer Fund - March(Series I) | $ 35 | 0.70 % † |
* | Annualized. |
† | Reflects fee waivers and/or expense reimbursements, without which expenses would have been higher. |
What Are Key
Statistics
About The Fund?(as of June 30, 2025)
| Fund net assets | $ 49,860,943 |
| Total number of portfolio holdings | 6 |
| Portfolio turnover rate | 0 % |
What Comprised The Fund's Holdings?
(as of June 30, 2025)
Security type allocation
(% of total investments)

®
V.I. S&P 500 Buffer Fund - March (the “Fund”) for the period January 1, 2025 to June 30, 2025.
invesco.com/reports
. You can also request this information by contacting us at
(800) 959-4246.
What Were The Fund Costs For The Last
Six Months
?
(Based on a hypothetical $10,000 investment)
Fund (Class) | Costs of a $10,000 investment | Costs paid as a percentage of a $10,000 investment* |
| Invesco ® V.I. S&P 500 Buffer Fund - March(Series II) | $ 48 | 0.95 % † |
* | Annualized. |
† | Reflects fee waivers and/or expense reimbursements, without which expenses would have been higher. |
What Are Key Statistics About The Fund?
(as of June 30, 2025)
| Fund net assets | $ 49,860,943 |
| Total number of portfolio holdings | 6 |
| Portfolio turnover rate | 0 % |
What Comprised The Fund's Holdings?
(as of June 30, 2025)
Security type allocation
(% of total investments)

®
V.I. S&P 500 Buffer Fund - September (the “Fund”) for the period January 1, 2025 to June 30, 2025.
invesco.com/reports
. You can also request this information by contacting us at
(800) 959-4246.
What Were The Fund Costs For The Last
Six Months
?
(Based on a hypothetical $10,000 investment)
Fund (Class) | Costs of a $10,000 investment | Costs paid as a percentage of a $10,000 investment* |
| Invesco ® V.I. S&P 500 Buffer Fund - September(Series I) | $ 36 | 0.70 % † |
* | Annualized. |
† | Reflects fee waivers and/or expense reimbursements, without which expenses would have been higher. |
What Are Key Statistics About The Fund?
(as of June 30, 2025)
| Fund net assets | $ 52,519,136 |
| Total number of portfolio holdings | 6 |
| Portfolio turnover rate | 0 % |
What Comprised The Fund's Holdings?
(as of June 30, 2025)
Security type allocation
(% of total investments)
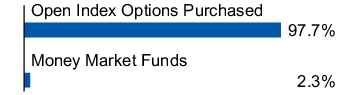
®
V.I. S&P 500 Buffer Fund - September (the “Fund”) for the period January 1, 2025 to June 30, 2025.
invesco.com/reports
. You can also request this information by contacting us at
(800) 959-4246.
What Were The Fund Costs For The Last
Six Months
?
(Based on a hypothetical $10,000 investment)
Fund (Class) | Costs of a $10,000 investment | Costs paid as a percentage of a $10,000 investment* |
| Invesco ® V.I. S&P 500 Buffer Fund - September(Series II) | $ 48 | 0.95 % † |
* | Annualized. |
† | Reflects fee waivers and/or expense reimbursements, without which expenses would have been higher. |
What Are Key Statistics About The Fund?
(as of June 30, 2025)
| Fund net assets | $ 52,519,136 |
| Total number of portfolio holdings | 6 |
| Portfolio turnover rate | 0 % |
What Comprised The Fund's Holdings?
(as of June 30, 2025)
Security type allocation
(% of total investments)

invesco.com/reports
. You can also request this information by contacting us at
(800) 959-4246.
What Were The Fund Costs For The Last
Six Months
?
(Based on a hypothetical $10,000 investment)
Fund (Class) | Costs of a $10,000 investment | Costs paid as a percentage of a $10,000 investment* |
| Invesco V.I. Small Cap Equity Fund (Series I) | $ 48 | 0.95 % |
* | Annualized. |
What Are Key Statistics About The Fund?
(as of June 30, 2025)
| Fund net assets | $ 232,155,958 |
| Total number of portfolio holdings | 89 |
| Portfolio turnover rate | 24 % |
What
Comprised
The
Fund's
Holdings?(as of June 30, 2025)
Top ten holdings*
(% of net assets)
| Piper Sandler Cos. | 1.91 % |
| ITT, Inc. | 1.85 % |
| Encompass Health Corp. | 1.73 % |
| Pinnacle Financial Partners, Inc. | 1.71 % |
| AeroVironment, Inc. | 1.67 % |
| Bancorp, Inc. (The) | 1.66 % |
| REV Group, Inc. | 1.63 % |
| Applied Industrial Technologies, Inc. | 1.60 % |
| Skyward Specialty Insurance Group, Inc. | 1.59 % |
| Flex Ltd. | 1.59 % |
| * Excluding money market fund holdings, if any. |
Sector allocation
(% of net assets)
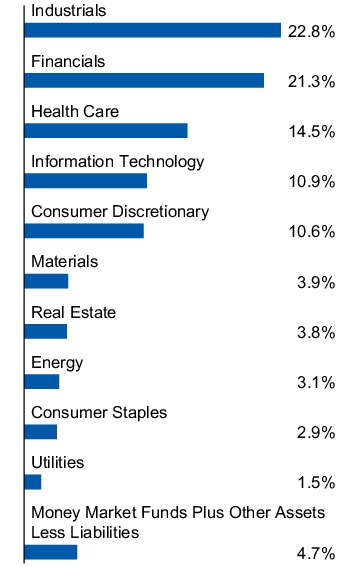
Top ten holdings*
(% of net assets)
| Piper Sandler Cos. | 1.91 % |
| ITT, Inc. | 1.85 % |
| Encompass Health Corp. | 1.73 % |
| Pinnacle Financial Partners, Inc. | 1.71 % |
| AeroVironment, Inc. | 1.67 % |
| Bancorp, Inc. (The) | 1.66 % |
| REV Group, Inc. | 1.63 % |
| Applied Industrial Technologies, Inc. | 1.60 % |
| Skyward Specialty Insurance Group, Inc. | 1.59 % |
| Flex Ltd. | 1.59 % |
| * Excluding money market fund holdings, if any. |
invesco.com/reports
. You can also request this information by contacting us at
(800) 959-4246.
What Were The Fund Costs For The Last
Six Months
?
(Based on a hypothetical $10,000 investment)
Fund (Class) | Costs of a $10,000 investment | Costs paid as a percentage of a $10,000 investment* |
| Invesco V.I. Small Cap Equity Fund (Series II) | $ 60 | 1.20 % |
* | Annualized. |
What Are Key Statistics About The Fund?
(as of June 30, 2025)
| Fund net assets | $ 232,155,958 |
| Total number of portfolio holdings | 89 |
| Portfolio turnover rate | 24 % |
What
Comprised
The
Fund's
Holdings?(as of June 30, 2025)
Top ten holdings*
(% of net assets)
| Piper Sandler Cos. | 1.91 % |
| ITT, Inc. | 1.85 % |
| Encompass Health Corp. | 1.73 % |
| Pinnacle Financial Partners, Inc. | 1.71 % |
| AeroVironment, Inc. | 1.67 % |
| Bancorp, Inc. (The) | 1.66 % |
| REV Group, Inc. | 1.63 % |
| Applied Industrial Technologies, Inc. | 1.60 % |
| Skyward Specialty Insurance Group, Inc. | 1.59 % |
| Flex Ltd. | 1.59 % |
| * Excluding money market fund holdings, if any. |
Sector allocation
(% of net assets)

Top ten holdings*
(% of net assets)
| Piper Sandler Cos. | 1.91 % |
| ITT, Inc. | 1.85 % |
| Encompass Health Corp. | 1.73 % |
| Pinnacle Financial Partners, Inc. | 1.71 % |
| AeroVironment, Inc. | 1.67 % |
| Bancorp, Inc. (The) | 1.66 % |
| REV Group, Inc. | 1.63 % |
| Applied Industrial Technologies, Inc. | 1.60 % |
| Skyward Specialty Insurance Group, Inc. | 1.59 % |
| Flex Ltd. | 1.59 % |
| * Excluding money market fund holdings, if any. |
invesco.com/reports
. You can also request this information by contacting us at
(800) 959-4246.
What Were The Fund Costs For The Last
Six Months
?
(Based on a hypothetical $10,000 investment)
Fund (Class) | Costs of a $10,000 investment | Costs paid as a percentage of a $10,000 investment* |
| Invesco V.I. Technology Fund (Series I) | $ 49 | 0.96 % |
* | Annualized. |
What Are Key Statistics About The Fund?
(as of June 30, 2025)
| Fund net assets | $ 221,337,729 |
| Total number of portfolio holdings | 62 |
| Portfolio turnover rate | 90 % |
What
Comprised
The Fund's
Holdings?(as of June 30, 2025)
Top ten holdings*
(% of net assets)
| NVIDIA Corp. | 8.52 % |
| Microsoft Corp. | 5.28 % |
| Broadcom, Inc. | 4.75 % |
| Meta Platforms, Inc., Class A | 4.68 % |
| KLA Corp. | 2.59 % |
| Lam Research Corp. | 2.57 % |
| Oracle Corp. | 2.50 % |
| Taiwan Semiconductor Manufacturing Co. Ltd., ADR | 2.48 % |
| Netflix, Inc. | 2.48 % |
| Cloudflare, Inc., Class A | 2.34 % |
| * Excluding money market fund holdings, if any. |
Sector allocation
(% of net assets)

Top ten holdings*
(% of net assets)
| NVIDIA Corp. | 8.52 % |
| Microsoft Corp. | 5.28 % |
| Broadcom, Inc. | 4.75 % |
| Meta Platforms, Inc., Class A | 4.68 % |
| KLA Corp. | 2.59 % |
| Lam Research Corp. | 2.57 % |
| Oracle Corp. | 2.50 % |
| Taiwan Semiconductor Manufacturing Co. Ltd., ADR | 2.48 % |
| Netflix, Inc. | 2.48 % |
| Cloudflare, Inc., Class A | 2.34 % |
| * Excluding money market fund holdings, if any. |
invesco.com/reports
. You can also request this information by contacting us at
(800) 959-4246.
What Were The Fund Costs For The Last
Six Months
?
(Based on a hypothetical $10,000 investment)
Fund (Class) | Costs of a $10,000 investment | Costs paid as a percentage of a $10,000 investment* |
| Invesco V.I. Technology Fund (Series II) | $ 62 | 1.21 % |
* | Annualized. |
What Are Key Statistics About The Fund?
(as of June 30, 2025)
| Fund net assets | $ 221,337,729 |
| Total number of portfolio holdings | 62 |
| Portfolio turnover rate | 90 % |
What Comprised The
Fund's
Holdings?(as of June 30, 2025)
Top ten holdings*
(% of net assets)
| NVIDIA Corp. | 8.52 % |
| Microsoft Corp. | 5.28 % |
| Broadcom, Inc. | 4.75 % |
| Meta Platforms, Inc., Class A | 4.68 % |
| KLA Corp. | 2.59 % |
| Lam Research Corp. | 2.57 % |
| Oracle Corp. | 2.50 % |
| Taiwan Semiconductor Manufacturing Co. Ltd., ADR | 2.48 % |
| Netflix, Inc. | 2.48 % |
| Cloudflare, Inc., Class A | 2.34 % |
| * Excluding money market fund holdings, if any. |
Sector allocation
(% of net assets)
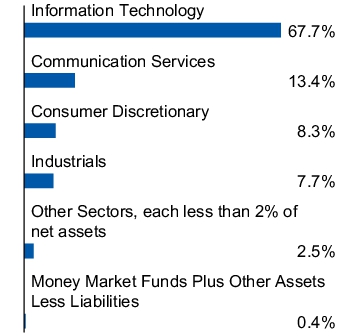
Top ten holdings*
(% of net assets)
| NVIDIA Corp. | 8.52 % |
| Microsoft Corp. | 5.28 % |
| Broadcom, Inc. | 4.75 % |
| Meta Platforms, Inc., Class A | 4.68 % |
| KLA Corp. | 2.59 % |
| Lam Research Corp. | 2.57 % |
| Oracle Corp. | 2.50 % |
| Taiwan Semiconductor Manufacturing Co. Ltd., ADR | 2.48 % |
| Netflix, Inc. | 2.48 % |
| Cloudflare, Inc., Class A | 2.34 % |
| * Excluding money market fund holdings, if any. |
invesco.com/reports
. You can also request this information by contacting us at
(800) 959-4246.
What Were The Fund Costs For The Last
Six Months
?
(Based on a hypothetical $10,000 investment)
Fund (Class) | Costs of a $10,000 investment | Costs paid as a percentage of a $10,000 investment* |
| Invesco V.I. U.S. Government Money Portfolio (Series I) | $ 32 | 0.63 % |
* | Annualized. |
What Are Key
Statistics
About The Fund?(as of June 30, 2025)
| Fund net assets | $ 385,603,700 |
| Total number of portfolio holdings | 69 |
What Comprised The Fund's Holdings?
(as of June 30, 2025)
Composition by maturity, in days
(% of total investments)*
| 1-7 | 68.5 % |
| 8-30 | 1.0 % |
| 31-60 | 1.6 % |
| 61-90 | 0.2 % |
| 91-180 | 6.4 % |
| 181+ | 22.3 % |
| * The number of days to maturity of each holding is determined in accordance with the provisions of Rule 2a-7 under the Investment Company Act of 1940. |
invesco.com/reports
. You can also request this information by contacting us at
(800) 959-4246.
What Were The Fund Costs For The Last
Six Months
?
(Based on a hypothetical $10,000 investment)
Fund (Class) | Costs of a $10,000 investment | Costs paid as a percentage of a $10,000 investment* |
| Invesco V.I. U.S. Government Money Portfolio (Series II) | $ 44 | 0.88 % |
* | Annualized. |
What Are Key Statistics About The Fund?
(as of June 30, 2025)
| Fund net assets | $ 385,603,700 |
| Total number of portfolio holdings | 69 |
What Comprised The Fund's Holdings?
(as of June 30, 2025)
Composition by maturity, in days
(% of total investments)*
| 1-7 | 68.5 % |
| 8-30 | 1.0 % |
| 31-60 | 1.6 % |
| 61-90 | 0.2 % |
| 91-180 | 6.4 % |
| 181+ | 22.3 % |
| * The number of days to maturity of each holding is determined in accordance with the provisions of Rule 2a-7 under the Investment Company Act of 1940. |
| [1] | Annualized. |
| [2] | Reflects fee waivers and/or expense reimbursements, without which expenses would have been higher. |