Shareholder Report
|
6 Months Ended |
|
Jun. 30, 2025
USD ($)
Holding
|
|---|
| Shareholder Report [Line Items] |
|
|
| Document Type |
N-CSRS
|
|
| Amendment Flag |
false
|
|
| Registrant Name |
AB VARIABLE PRODUCTS SERIES FUND, INC.
|
|
| Entity Central Index Key |
0000825316
|
|
| Entity Investment Company Type |
N-1A
|
|
| Document Period End Date |
Jun. 30, 2025
|
|
| C000028838 |
|
|
| Shareholder Report [Line Items] |
|
|
| Fund Name |
AB VPS Discovery Value Portfolio
|
|
| Class Name |
Class A
|
|
| No Trading Symbol [Flag] |
true
|
|
| Annual or Semi-Annual Statement [Text Block] |
This semi-annual shareholder report contains important information about the AB VPS Discovery Value Portfolio (the “Portfolio”) for the period of January 1, 2025 to June 30, 2025.
|
|
| Shareholder Report Annual or Semi-Annual |
Semi-Annual Shareholder Report
|
|
| Additional Information [Text Block] |
You can find additional information about the Portfolio at https://www.abfunds.com/link/AB/64VQ-A-S. You can also request this information by contacting us at (800) 227 4618.
|
|
| Additional Information Phone Number |
(800) 227 4618
|
|
| Additional Information Website |
https://www.abfunds.com/link/AB/64VQ-A-S
|
|
| Expenses [Text Block] |
What were the Portfolio costs for the last six months?(Based on a hypothetical $10,000 investment)
Class Name |
Cost of a $10,000 investment |
Costs paid as a percentage of a $10,000 investment |
Class A |
$40 |
0.81%Footnote Reference* |
| Footnote |
Description |
Footnote* |
Annualized | |
|
| Expenses Paid, Amount |
$ 40
|
|
| Expense Ratio, Percent |
0.81%
|
[1] |
| AssetsNet |
$ 671,477,323
|
|
| Holdings Count | Holding |
93
|
|
| Advisory Fees Paid, Amount |
$ 2,458,367
|
|
| InvestmentCompanyPortfolioTurnover |
36.00%
|
|
| Additional Fund Statistics [Text Block] |
Net Assets |
$671,477,323 |
# of Portfolio Holdings |
93 |
Portfolio Turnover Rate |
36% |
Total Advisory Fees Paid (Net) |
$2,458,367 | |
|
| Holdings [Text Block] |
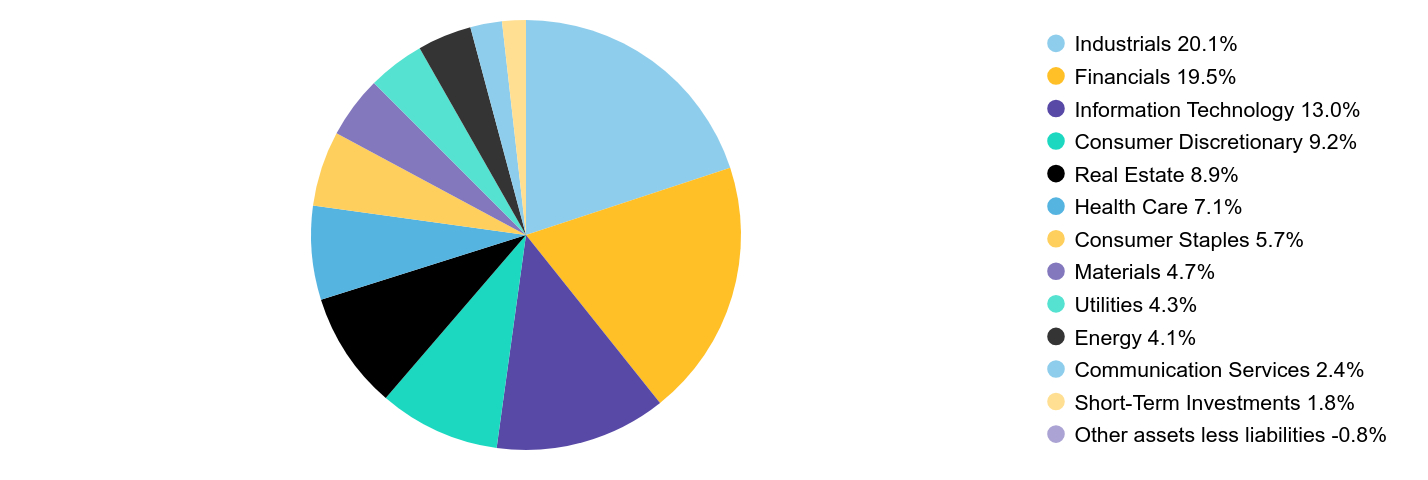
Sector Breakdown (% of Net Assets)
Value |
Value |
Industrials |
20.1% |
Financials |
19.5% |
Information Technology |
13.0% |
Consumer Discretionary |
9.2% |
Real Estate |
8.9% |
Health Care |
7.1% |
Consumer Staples |
5.7% |
Materials |
4.7% |
Utilities |
4.3% |
Energy |
4.1% |
Communication Services |
2.4% |
Short-Term Investments |
1.8% |
Other assets less liabilities |
-0.8% | |
|
| Largest Holdings [Text Block] |
Company |
U.S. $ Value |
% of Net Assets |
BJ's Wholesale Club Holdings, Inc. |
$13,176,826 |
2.0% |
Encompass Health Corp. |
$12,076,112 |
1.8% |
TXNM Energy, Inc. |
$11,714,954 |
1.7% |
Jones Lang LaSalle, Inc. |
$11,194,979 |
1.7% |
Hanover Insurance Group, Inc. (The) |
$10,499,665 |
1.6% |
Nexstar Media Group, Inc. |
$10,477,830 |
1.6% |
IDACORP, Inc. |
$10,347,899 |
1.5% |
Tenet Healthcare Corp. |
$10,278,224 |
1.5% |
Pentair PLC |
$10,087,885 |
1.5% |
RPM International, Inc. |
$9,567,064 |
1.4% |
Total |
$109,421,438 |
16.3% | |
|
| Material Fund Change [Text Block] |
|
|
| C000028839 |
|
|
| Shareholder Report [Line Items] |
|
|
| Fund Name |
AB VPS Discovery Value Portfolio
|
|
| Class Name |
Class B
|
|
| No Trading Symbol [Flag] |
true
|
|
| Annual or Semi-Annual Statement [Text Block] |
This semi-annual shareholder report contains important information about the AB VPS Discovery Value Portfolio (the “Portfolio”) for the period of January 1, 2025 to June 30, 2025.
|
|
| Shareholder Report Annual or Semi-Annual |
Semi-Annual Shareholder Report
|
|
| Additional Information [Text Block] |
You can find additional information about the Portfolio at https://www.abfunds.com/link/AB/64VQ-B-S. You can also request this information by contacting us at (800) 227 4618.
|
|
| Additional Information Phone Number |
(800) 227 4618
|
|
| Additional Information Website |
https://www.abfunds.com/link/AB/64VQ-B-S
|
|
| Expenses [Text Block] |
What were the Portfolio costs for the last six months?(Based on a hypothetical $10,000 investment)
Class Name |
Cost of a $10,000 investment |
Costs paid as a percentage of a $10,000 investment |
Class B |
$52 |
1.06%Footnote Reference* |
| Footnote |
Description |
Footnote* |
Annualized | |
|
| Expenses Paid, Amount |
$ 52
|
|
| Expense Ratio, Percent |
1.06%
|
[2] |
| AssetsNet |
$ 671,477,323
|
|
| Holdings Count | Holding |
93
|
|
| Advisory Fees Paid, Amount |
$ 2,458,367
|
|
| InvestmentCompanyPortfolioTurnover |
36.00%
|
|
| Additional Fund Statistics [Text Block] |
Net Assets |
$671,477,323 |
# of Portfolio Holdings |
93 |
Portfolio Turnover Rate |
36% |
Total Advisory Fees Paid (Net) |
$2,458,367 | |
|
| Holdings [Text Block] |
Sector Breakdown (% of Net Assets)
Value |
Value |
Industrials |
20.1% |
Financials |
19.5% |
Information Technology |
13.0% |
Consumer Discretionary |
9.2% |
Real Estate |
8.9% |
Health Care |
7.1% |
Consumer Staples |
5.7% |
Materials |
4.7% |
Utilities |
4.3% |
Energy |
4.1% |
Communication Services |
2.4% |
Short-Term Investments |
1.8% |
Other assets less liabilities |
-0.8% | |
|
| Largest Holdings [Text Block] |
Company |
U.S. $ Value |
% of Net Assets |
BJ's Wholesale Club Holdings, Inc. |
$13,176,826 |
2.0% |
Encompass Health Corp. |
$12,076,112 |
1.8% |
TXNM Energy, Inc. |
$11,714,954 |
1.7% |
Jones Lang LaSalle, Inc. |
$11,194,979 |
1.7% |
Hanover Insurance Group, Inc. (The) |
$10,499,665 |
1.6% |
Nexstar Media Group, Inc. |
$10,477,830 |
1.6% |
IDACORP, Inc. |
$10,347,899 |
1.5% |
Tenet Healthcare Corp. |
$10,278,224 |
1.5% |
Pentair PLC |
$10,087,885 |
1.5% |
RPM International, Inc. |
$9,567,064 |
1.4% |
Total |
$109,421,438 |
16.3% | |
|
| Material Fund Change [Text Block] |
|
|
| C000098721 |
|
|
| Shareholder Report [Line Items] |
|
|
| Fund Name |
AB VPS Dynamic Asset Allocation Portfolio
|
|
| Class Name |
Class A
|
|
| No Trading Symbol [Flag] |
true
|
|
| Annual or Semi-Annual Statement [Text Block] |
This semi-annual shareholder report contains important information about the AB VPS Dynamic Asset Allocation Portfolio (the “Portfolio”) for the period of January 1, 2025 to June 30, 2025.
|
|
| Shareholder Report Annual or Semi-Annual |
Semi-Annual Shareholder Report
|
|
| Additional Information [Text Block] |
You can find additional information about the Portfolio at https://www.abfunds.com/link/AB/64VD-A-S. You can also request this information by contacting us at (800) 227 4618.
|
|
| Additional Information Phone Number |
(800) 227 4618
|
|
| Additional Information Website |
https://www.abfunds.com/link/AB/64VD-A-S
|
|
| Expenses [Text Block] |
What were the Portfolio costs for the last six months?(Based on a hypothetical $10,000 investment)
Class Name |
Cost of a $10,000 investment |
Costs paid as a percentage of a $10,000 investment |
Class A |
$43 |
0.85%Footnote Reference* |
| Footnote |
Description |
Footnote* |
Annualized | |
|
| Expenses Paid, Amount |
$ 43
|
|
| Expense Ratio, Percent |
0.85%
|
[3] |
| AssetsNet |
$ 249,492,569
|
|
| Holdings Count | Holding |
1,424
|
|
| Advisory Fees Paid, Amount |
$ 792,234
|
|
| InvestmentCompanyPortfolioTurnover |
4.00%
|
|
| Additional Fund Statistics [Text Block] |
Net Assets |
$249,492,569 |
# of Portfolio Holdings |
1,424 |
Portfolio Turnover Rate |
4% |
Total Advisory Fees Paid (Net) |
$792,234 | |
|
| Holdings [Text Block] |
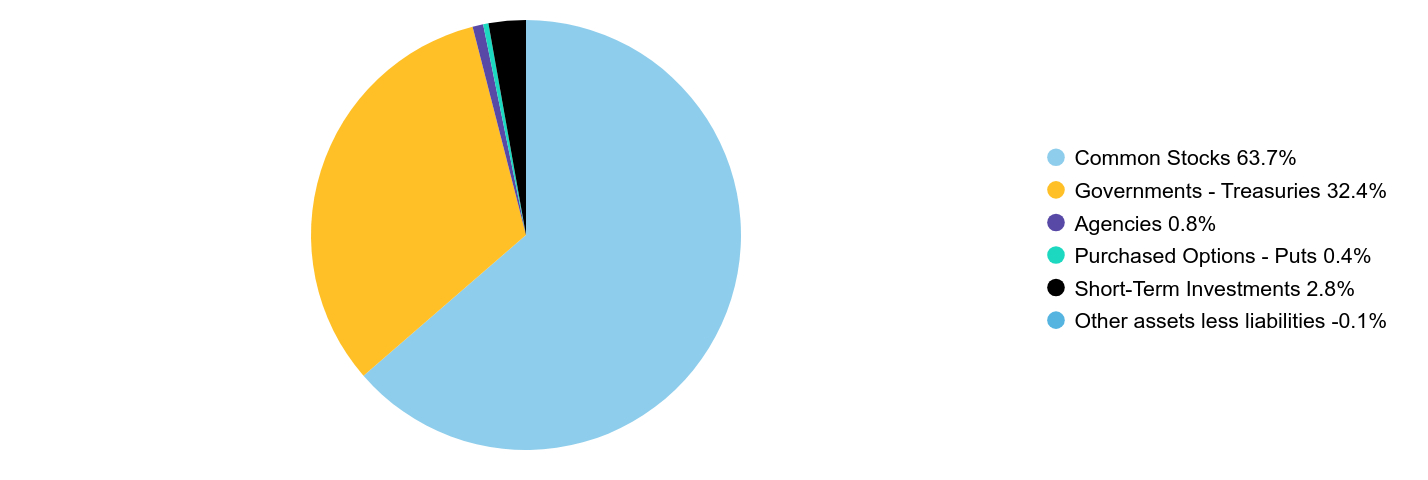
Security Type Breakdown (% Net Assets)
Value |
Value |
Common Stocks |
63.7% |
Governments - Treasuries |
32.4% |
Agencies |
0.8% |
Purchased Options - Puts |
0.4% |
Short-Term Investments |
2.8% |
Other assets less liabilities |
-0.1% | |
|
| Largest Holdings [Text Block] |
Company |
U.S. $ Value |
% of Net Assets |
NVIDIA Corp. |
$8,119,580 |
3.2% |
Microsoft Corp. |
$7,398,974 |
3.0% |
Apple, Inc. |
$6,491,784 |
2.6% |
U.S. Treasury Notes, 2.00%, due 11/15/26 |
$4,687,995 |
1.9% |
Amazon.com, Inc. |
$4,413,688 |
1.8% |
U.S. Treasury Notes, 2.38%, due 05/15/27 |
$4,258,434 |
1.7% |
U.S. Treasury Notes, 2.25%, due 11/15/27 |
$3,469,394 |
1.4% |
Meta Platforms, Inc. - Class A |
$3,405,547 |
1.4% |
U.S. Treasury Notes, 1.63%, due 05/15/31 |
$2,716,094 |
1.1% |
Broadcom, Inc. |
$2,593,591 |
1.0% |
Total |
$47,555,081 |
19.1% | |
|
| Material Fund Change [Text Block] |
|
|
| C000098722 |
|
|
| Shareholder Report [Line Items] |
|
|
| Fund Name |
AB VPS Dynamic Asset Allocation Portfolio
|
|
| Class Name |
Class B
|
|
| No Trading Symbol [Flag] |
true
|
|
| Annual or Semi-Annual Statement [Text Block] |
This semi-annual shareholder report contains important information about the AB VPS Dynamic Asset Allocation Portfolio (the “Portfolio”) for the period of January 1, 2025 to June 30, 2025.
|
|
| Shareholder Report Annual or Semi-Annual |
Semi-Annual Shareholder Report
|
|
| Additional Information [Text Block] |
You can find additional information about the Portfolio at https://www.abfunds.com/link/AB/64VD-B-S. You can also request this information by contacting us at (800) 227 4618.
|
|
| Additional Information Phone Number |
(800) 227 4618
|
|
| Additional Information Website |
https://www.abfunds.com/link/AB/64VD-B-S
|
|
| Expenses [Text Block] |
What were the Portfolio costs for the last six months?(Based on a hypothetical $10,000 investment)
Class Name |
Cost of a $10,000 investment |
Costs paid as a percentage of a $10,000 investment |
Class B |
$56 |
1.10%Footnote Reference* |
| Footnote |
Description |
Footnote* |
Annualized | |
|
| Expenses Paid, Amount |
$ 56
|
|
| Expense Ratio, Percent |
1.10%
|
[4] |
| AssetsNet |
$ 249,492,569
|
|
| Holdings Count | Holding |
1,424
|
|
| Advisory Fees Paid, Amount |
$ 792,234
|
|
| InvestmentCompanyPortfolioTurnover |
4.00%
|
|
| Additional Fund Statistics [Text Block] |
Net Assets |
$249,492,569 |
# of Portfolio Holdings |
1,424 |
Portfolio Turnover Rate |
4% |
Total Advisory Fees Paid (Net) |
$792,234 | |
|
| Holdings [Text Block] |
Security Type Breakdown (% Net Assets)
Value |
Value |
Common Stocks |
63.7% |
Governments - Treasuries |
32.4% |
Agencies |
0.8% |
Purchased Options - Puts |
0.4% |
Short-Term Investments |
2.8% |
Other assets less liabilities |
-0.1% | |
|
| Largest Holdings [Text Block] |
Company |
U.S. $ Value |
% of Net Assets |
NVIDIA Corp. |
$8,119,580 |
3.2% |
Microsoft Corp. |
$7,398,974 |
3.0% |
Apple, Inc. |
$6,491,784 |
2.6% |
U.S. Treasury Notes, 2.00%, due 11/15/26 |
$4,687,995 |
1.9% |
Amazon.com, Inc. |
$4,413,688 |
1.8% |
U.S. Treasury Notes, 2.38%, due 05/15/27 |
$4,258,434 |
1.7% |
U.S. Treasury Notes, 2.25%, due 11/15/27 |
$3,469,394 |
1.4% |
Meta Platforms, Inc. - Class A |
$3,405,547 |
1.4% |
U.S. Treasury Notes, 1.63%, due 05/15/31 |
$2,716,094 |
1.1% |
Broadcom, Inc. |
$2,593,591 |
1.0% |
Total |
$47,555,081 |
19.1% | |
|
| Material Fund Change [Text Block] |
|
|
| C000154814 |
|
|
| Shareholder Report [Line Items] |
|
|
| Fund Name |
AB VPS Global Risk Allocation - Moderate Portfolio
|
|
| Class Name |
Class B
|
|
| No Trading Symbol [Flag] |
true
|
|
| Annual or Semi-Annual Statement [Text Block] |
This semi-annual shareholder report contains important information about the AB VPS Global Risk Allocation - Moderate Portfolio (the “Portfolio”) for the period of January 1, 2025 to June 30, 2025.
|
|
| Shareholder Report Annual or Semi-Annual |
Semi-Annual Shareholder Report
|
|
| Additional Information [Text Block] |
You can find additional information about the Portfolio at https://www.abfunds.com/link/AB/64V2-B-S. You can also request this information by contacting us at (800) 227 4618.
|
|
| Additional Information Phone Number |
(800) 227 4618
|
|
| Additional Information Website |
https://www.abfunds.com/link/AB/64V2-B-S
|
|
| Expenses [Text Block] |
What were the Portfolio costs for the last six months?(Based on a hypothetical $10,000 investment)
Class Name |
Cost of a $10,000 investment |
Costs paid as a percentage of a $10,000 investment |
Class B |
$38 |
0.75%Footnote Reference* |
| Footnote |
Description |
Footnote* |
Annualized | |
|
| Expenses Paid, Amount |
$ 38
|
|
| Expense Ratio, Percent |
0.75%
|
[5] |
| AssetsNet |
$ 679,275,317
|
|
| Holdings Count | Holding |
1,207
|
|
| Advisory Fees Paid, Amount |
$ 1,415,945
|
|
| InvestmentCompanyPortfolioTurnover |
1.00%
|
|
| Additional Fund Statistics [Text Block] |
Net Assets |
$679,275,317 |
# of Portfolio Holdings |
1,207 |
Portfolio Turnover Rate |
1% |
Total Advisory Fees Paid (Net) |
$1,415,945 | |
|
| Holdings [Text Block] |
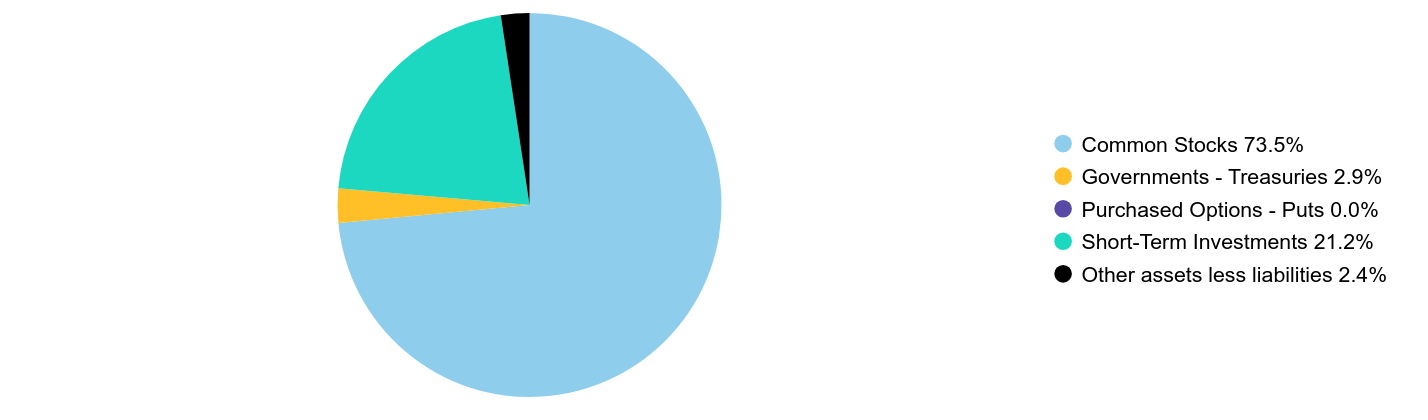
Security Type Breakdown (% Net Assets)
Value |
Value |
Common Stocks |
73.5% |
Governments - Treasuries |
2.9% |
Purchased Options - Puts |
0.0% |
Short-Term Investments |
21.2% |
Other assets less liabilities |
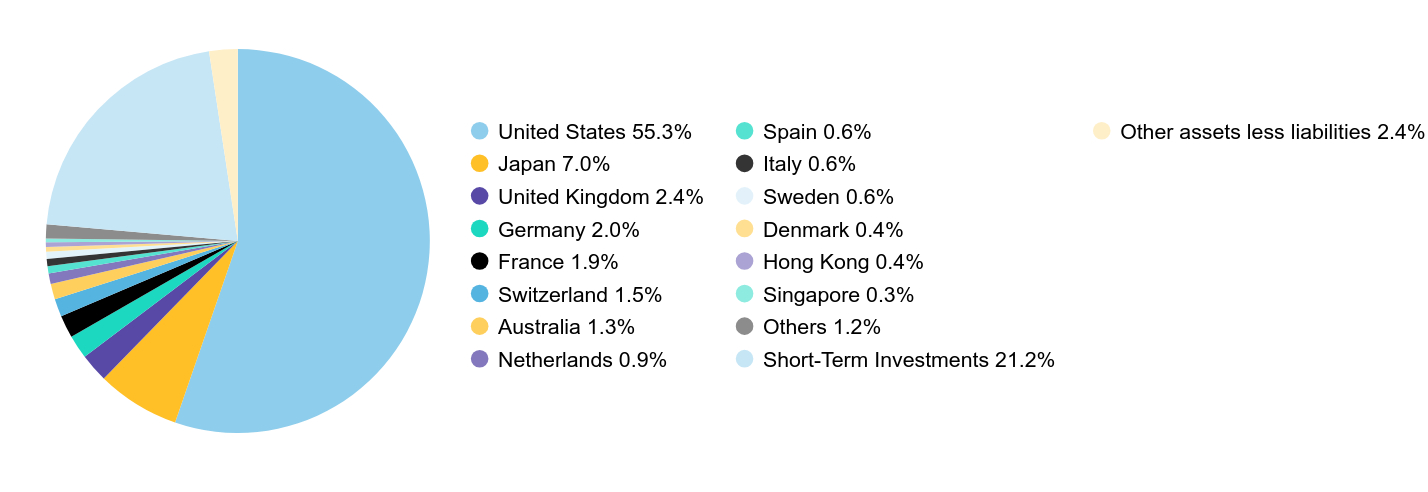
2.4% | Country Breakdown (% of Net Assets)
Value |
Value |
United States |
55.3% |
Japan |
7.0% |
United Kingdom |
2.4% |
Germany |
2.0% |
France |
1.9% |
Switzerland |
1.5% |
Australia |
1.3% |
Netherlands |
0.9% |
Spain |
0.6% |
Italy |
0.6% |
Sweden |
0.6% |
Denmark |
0.4% |
Hong Kong |
0.4% |
Singapore |
0.3% |
Others |
1.2% |
Short-Term Investments |
21.2% |
Other assets less liabilities |
2.4% | |
|
| C000028862 |
|
|
| Shareholder Report [Line Items] |
|
|
| Fund Name |
AB VPS Relative Value Portfolio
|
|
| Class Name |
Class A
|
|
| No Trading Symbol [Flag] |
true
|
|
| Annual or Semi-Annual Statement [Text Block] |
This semi-annual shareholder report contains important information about the AB VPS Relative Value Portfolio (the “Portfolio”) for the period of January 1, 2025 to June 30, 2025.
|
|
| Shareholder Report Annual or Semi-Annual |
Semi-Annual Shareholder Report
|
|
| Additional Information [Text Block] |
You can find additional information about the Portfolio at https://www.abfunds.com/link/AB/64VH-A-S. You can also request this information by contacting us at (800) 227 4618.
|
|
| Material Fund Change Notice [Text Block] |
This report describes changes to the Portfolio that occurred during the reporting period.
|
|
| Additional Information Phone Number |
(800) 227 4618
|
|
| Additional Information Website |
https://www.abfunds.com/link/AB/64VH-A-S
|
|
| Expenses [Text Block] |
What were the Portfolio costs for the last six months?(Based on a hypothetical $10,000 investment)
Class Name |
Cost of a $10,000 investment |
Costs paid as a percentage of a $10,000 investment |
Class A |
$30 |
0.59%Footnote Reference* |
| Footnote |
Description |
Footnote* |
Annualized | |
|
| Expenses Paid, Amount |
$ 30
|
|
| Expense Ratio, Percent |
0.59%
|
[6] |
| Material Change Date |
Jan. 01, 2025
|
|
| AssetsNet |
$ 1,069,820,546
|
|
| Holdings Count | Holding |
74
|
|
| Advisory Fees Paid, Amount |
$ 2,555,941
|
|
| InvestmentCompanyPortfolioTurnover |
34.00%
|
|
| Additional Fund Statistics [Text Block] |
Net Assets |
$1,069,820,546 |
# of Portfolio Holdings |
74 |
Portfolio Turnover Rate |
34% |
Total Advisory Fees Paid (Net) |
$2,555,941 | |
|
| Holdings [Text Block] |
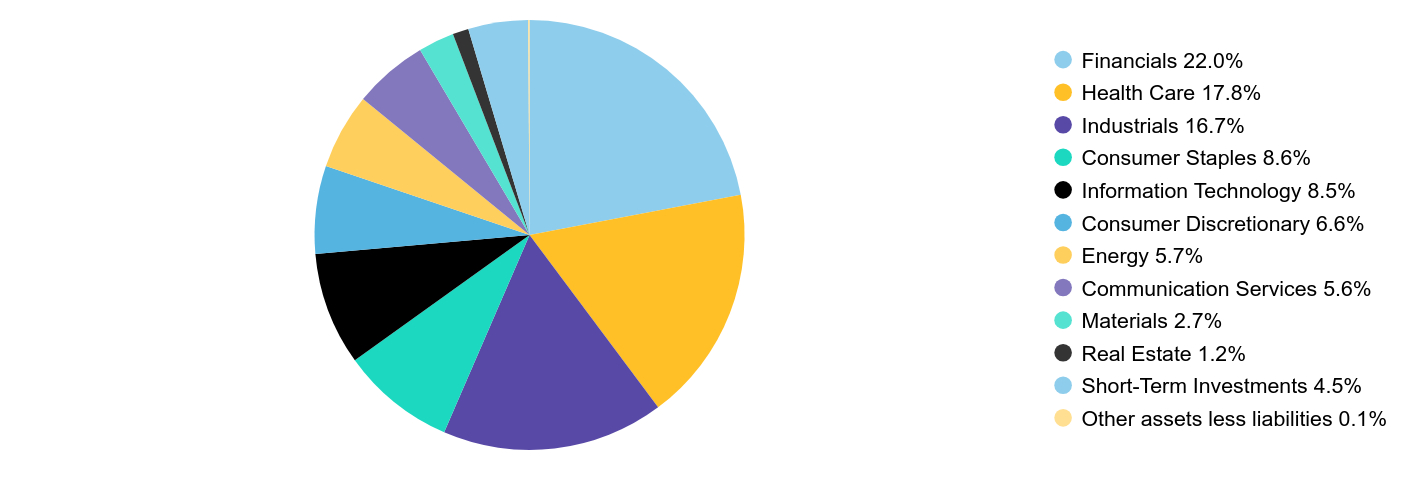
Sector Breakdown (% of Net Assets)
Value |
Value |
Financials |
22.0% |
Health Care |
17.8% |
Industrials |
16.7% |
Consumer Staples |
8.6% |
Information Technology |
8.5% |
Consumer Discretionary |
6.6% |
Energy |
5.7% |
Communication Services |
5.6% |
Materials |
2.7% |
Real Estate |
1.2% |
Short-Term Investments |
4.5% |
Other assets less liabilities |
0.1% | |
|
| Largest Holdings [Text Block] |
Company |
U.S. $ Value |
% of Net Assets |
JPMorgan Chase & Co. |
$44,230,119 |
4.1% |
Berkshire Hathaway, Inc. - Class B |
$40,906,206 |
3.8% |
Philip Morris International, Inc. |
$39,224,245 |
3.7% |
Johnson & Johnson |
$38,061,634 |
3.5% |
Walmart, Inc. |
$33,310,713 |
3.1% |
RTX Corp. |
$32,002,619 |
3.0% |
EOG Resources, Inc. |
$26,644,683 |
2.5% |
Texas Instruments, Inc. |
$26,475,910 |
2.5% |
S&P Global, Inc. |
$24,841,159 |
2.3% |
Elevance Health, Inc. |
$23,038,101 |
2.2% |
Total |
$328,735,389 |
30.7% | |
|
| Material Fund Change [Text Block] |
Material Portfolio Changes This is a summary of certain changes to the Portfolio since January 1, 2025. For more complete information, you may review the Portfolio's next prospectus, which we expect to be available on or about May 1, 2026 at www.abfunds.com/go/prospectus, or upon request at (800) 243-5994. During the reporting period, the Portfolio added the following risk to its Principal Risks as set forth in its prospectus. Sector Risk: The Portfolio may have more risk than a more diversified portfolio because it may invest to a significant extent in one or more particular market sectors, such as the financials sector. To the extent it does so, market or economic factors affecting the relevant sector(s) could have a major effect on the value of the Portfolio's investments. |
|
| Material Fund Change Risks Change [Text Block] |
During the reporting period, the Portfolio added the following risk to its Principal Risks as set forth in its prospectus. Sector Risk: The Portfolio may have more risk than a more diversified portfolio because it may invest to a significant extent in one or more particular market sectors, such as the financials sector. To the extent it does so, market or economic factors affecting the relevant sector(s) could have a major effect on the value of the Portfolio's investments.
|
|
| Summary of Change Legend [Text Block] |
This is a summary of certain changes to the Portfolio since January 1, 2025. For more complete information, you may review the Portfolio's next prospectus, which we expect to be available on or about May 1, 2026 at www.abfunds.com/go/prospectus, or upon request at (800) 243-5994.
|
|
| C000028863 |
|
|
| Shareholder Report [Line Items] |
|
|
| Fund Name |
AB VPS Relative Value Portfolio
|
|
| Class Name |
Class B
|
|
| No Trading Symbol [Flag] |
true
|
|
| Annual or Semi-Annual Statement [Text Block] |
This semi-annual shareholder report contains important information about the AB VPS Relative Value Portfolio (the “Portfolio”) for the period of January 1, 2025 to June 30, 2025.
|
|
| Shareholder Report Annual or Semi-Annual |
Semi-Annual Shareholder Report
|
|
| Additional Information [Text Block] |
You can find additional information about the Portfolio at https://www.abfunds.com/link/AB/64VH-B-S. You can also request this information by contacting us at (800) 227 4618.
|
|
| Material Fund Change Notice [Text Block] |
This report describes changes to the Portfolio that occurred during the reporting period.
|
|
| Additional Information Phone Number |
(800) 227 4618
|
|
| Additional Information Website |
https://www.abfunds.com/link/AB/64VH-B-S
|
|
| Expenses [Text Block] |
What were the Portfolio costs for the last six months?(Based on a hypothetical $10,000 investment)
Class Name |
Cost of a $10,000 investment |
Costs paid as a percentage of a $10,000 investment |
Class B |
$43 |
0.84%Footnote Reference* |
| Footnote |
Description |
Footnote* |
Annualized | |
|
| Expenses Paid, Amount |
$ 43
|
|
| Expense Ratio, Percent |
0.84%
|
[7] |
| Material Change Date |
Jan. 01, 2025
|
|
| AssetsNet |
$ 1,069,820,546
|
|
| Holdings Count | Holding |
74
|
|
| Advisory Fees Paid, Amount |
$ 2,555,941
|
|
| InvestmentCompanyPortfolioTurnover |
34.00%
|
|
| Additional Fund Statistics [Text Block] |
Net Assets |
$1,069,820,546 |
# of Portfolio Holdings |
74 |
Portfolio Turnover Rate |
34% |
Total Advisory Fees Paid (Net) |
$2,555,941 | |
|
| Holdings [Text Block] |
Sector Breakdown (% of Net Assets)
Value |
Value |
Financials |
22.0% |
Health Care |
17.8% |
Industrials |
16.7% |
Consumer Staples |
8.6% |
Information Technology |
8.5% |
Consumer Discretionary |
6.6% |
Energy |
5.7% |
Communication Services |
5.6% |
Materials |
2.7% |
Real Estate |
1.2% |
Short-Term Investments |
4.5% |
Other assets less liabilities |
0.1% | |
|
| Largest Holdings [Text Block] |
Company |
U.S. $ Value |
% of Net Assets |
JPMorgan Chase & Co. |
$44,230,119 |
4.1% |
Berkshire Hathaway, Inc. - Class B |
$40,906,206 |
3.8% |
Philip Morris International, Inc. |
$39,224,245 |
3.7% |
Johnson & Johnson |
$38,061,634 |
3.5% |
Walmart, Inc. |
$33,310,713 |
3.1% |
RTX Corp. |
$32,002,619 |
3.0% |
EOG Resources, Inc. |
$26,644,683 |
2.5% |
Texas Instruments, Inc. |
$26,475,910 |
2.5% |
S&P Global, Inc. |
$24,841,159 |
2.3% |
Elevance Health, Inc. |
$23,038,101 |
2.2% |
Total |
$328,735,389 |
30.7% | |
|
| Material Fund Change [Text Block] |
Material Portfolio Changes This is a summary of certain changes to the Portfolio since January 1, 2025. For more complete information, you may review the Portfolio's next prospectus, which we expect to be available on or about May 1, 2026 at www.abfunds.com/go/prospectus, or upon request at (800) 243-5994. During the reporting period, the Portfolio added the following risk to its Principal Risks as set forth in its prospectus. Sector Risk: The Portfolio may have more risk than a more diversified portfolio because it may invest to a significant extent in one or more particular market sectors, such as the financials sector. To the extent it does so, market or economic factors affecting the relevant sector(s) could have a major effect on the value of the Portfolio's investments. |
|
| Material Fund Change Risks Change [Text Block] |
During the reporting period, the Portfolio added the following risk to its Principal Risks as set forth in its prospectus. Sector Risk: The Portfolio may have more risk than a more diversified portfolio because it may invest to a significant extent in one or more particular market sectors, such as the financials sector. To the extent it does so, market or economic factors affecting the relevant sector(s) could have a major effect on the value of the Portfolio's investments.
|
|
| Summary of Change Legend [Text Block] |
This is a summary of certain changes to the Portfolio since January 1, 2025. For more complete information, you may review the Portfolio's next prospectus, which we expect to be available on or about May 1, 2026 at www.abfunds.com/go/prospectus, or upon request at (800) 243-5994.
|
|
| C000028852 |
|
|
| Shareholder Report [Line Items] |
|
|
| Fund Name |
AB VPS Balanced Hedged Allocation Portfolio
|
|
| Class Name |
Class A
|
|
| No Trading Symbol [Flag] |
true
|
|
| Annual or Semi-Annual Statement [Text Block] |
This semi-annual shareholder report contains important information about the AB VPS Balanced Hedged Allocation Portfolio (the “Portfolio”) for the period of January 1, 2025 to June 30, 2025.
|
|
| Shareholder Report Annual or Semi-Annual |
Semi-Annual Shareholder Report
|
|
| Additional Information [Text Block] |
You can find additional information about the Portfolio at https://www.abfunds.com/link/AB/64VW-A-S. You can also request this information by contacting us at (800) 227 4618.
|
|
| Additional Information Phone Number |
(800) 227 4618
|
|
| Additional Information Website |
https://www.abfunds.com/link/AB/64VW-A-S
|
|
| Expenses [Text Block] |
What were the Portfolio costs for the last six months?(Based on a hypothetical $10,000 investment)
Class Name |
Cost of a $10,000 investment |
Costs paid as a percentage of a $10,000 investment |
Class A |
$35 |
0.68%Footnote Reference* |
| Footnote |
Description |
Footnote* |
Annualized | |
|
| Expenses Paid, Amount |
$ 35
|
|
| Expense Ratio, Percent |
0.68%
|
[8] |
| AssetsNet |
$ 154,668,293
|
|
| Holdings Count | Holding |
22
|
|
| Advisory Fees Paid, Amount |
$ 333,002
|
|
| InvestmentCompanyPortfolioTurnover |
2.00%
|
|
| Additional Fund Statistics [Text Block] |
Net Assets |
$154,668,293 |
# of Portfolio Holdings |
22 |
Portfolio Turnover Rate |
2% |
Total Advisory Fees Paid (Net) |
$333,002 | |
|
| Holdings [Text Block] |
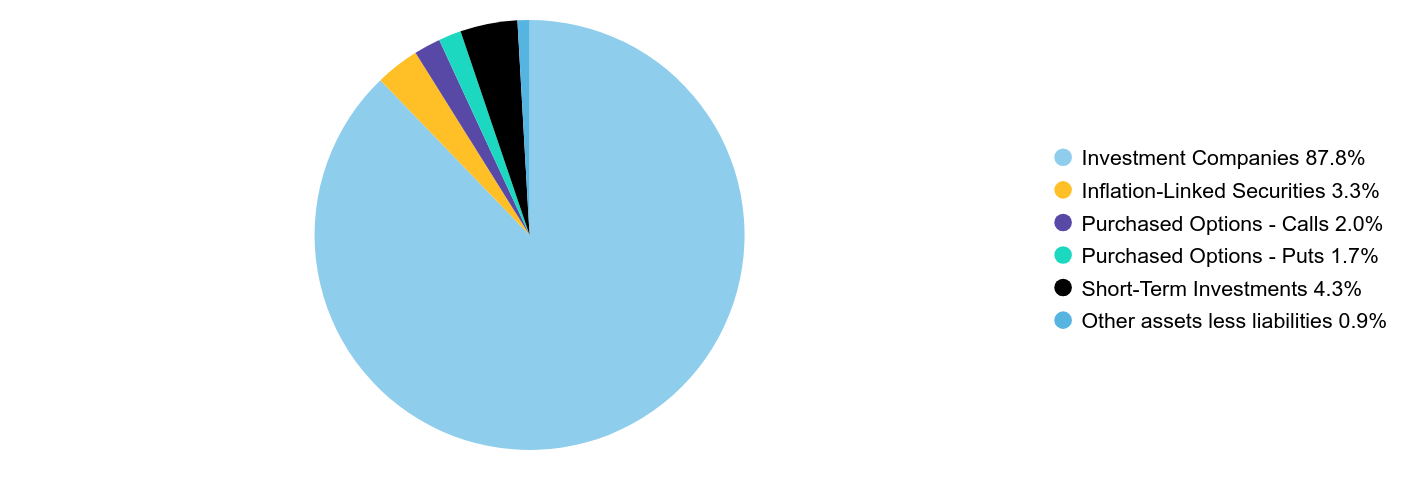
Portfolio Breakdown (% of Net Assets)
|
|
Investment Companies |
87.8% |
Inflation-Linked Securities |
3.3% |
Purchased Options - Calls |
2.0% |
Purchased Options - Puts |
1.7% |
Short-Term Investments |
4.3% |
Other assets less liabilities |
0.9% | |
|
| Largest Holdings [Text Block] |
Company |
U.S. $ Value |
% of Net Assets |
iShares Core S&P 500 ETF |
$51,752,015 |
33.5% |
iShares Core U.S. Aggregate Bond ETF |
$22,855,680 |
14.8% |
Vanguard Total Bond Market ETF |
$22,795,848 |
14.8% |
iShares Core MSCI EAFE ETF |
$22,431,076 |
14.5% |
iShares Core MSCI Emerging Markets ETF |
$9,142,569 |
5.9% |
U.S. Treasury Inflation Index, 0.13%, due 01/15/32 |
$5,113,384 |
3.3% |
Vanguard Mid-Cap ETF |
$3,455,900 |
2.2% |
Vanguard Real Estate ETF |
$2,885,544 |
1.9% |
Purchased Options - Calls, S&P 500 Index, USD 6100.00, due 12/18/26 |
$1,303,200 |
0.8% |
Purchased Options - Calls, S&P 500 Index, USD 6000.00, due 12/18/26 |
$1,107,960 |
0.7% |
Total |
$142,843,176 |
92.4% | |
|
| Material Fund Change [Text Block] |
|
|
| C000028853 |
|
|
| Shareholder Report [Line Items] |
|
|
| Fund Name |
AB VPS Balanced Hedged Allocation Portfolio
|
|
| Class Name |
Class B
|
|
| No Trading Symbol [Flag] |
true
|
|
| Annual or Semi-Annual Statement [Text Block] |
This semi-annual shareholder report contains important information about the AB VPS Balanced Hedged Allocation Portfolio (the “Portfolio”) for the period of January 1, 2025 to June 30, 2025.
|
|
| Shareholder Report Annual or Semi-Annual |
Semi-Annual Shareholder Report
|
|
| Additional Information [Text Block] |
You can find additional information about the Portfolio at https://www.abfunds.com/link/AB/64VW-B-S. You can also request this information by contacting us at (800) 227 4618.
|
|
| Additional Information Phone Number |
(800) 227 4618
|
|
| Additional Information Website |
https://www.abfunds.com/link/AB/64VW-B-S
|
|
| Expenses [Text Block] |
What were the Portfolio costs for the last six months?(Based on a hypothetical $10,000 investment)
Class Name |
Cost of a $10,000 investment |
Costs paid as a percentage of a $10,000 investment |
Class B |
$48 |
0.93%Footnote Reference* |
| Footnote |
Description |
Footnote* |
Annualized | |
|
| Expenses Paid, Amount |
$ 48
|
|
| Expense Ratio, Percent |
0.93%
|
[9] |
| AssetsNet |
$ 154,668,293
|
|
| Holdings Count | Holding |
22
|
|
| Advisory Fees Paid, Amount |
$ 333,002
|
|
| InvestmentCompanyPortfolioTurnover |
2.00%
|
|
| Additional Fund Statistics [Text Block] |
Net Assets |
$154,668,293 |
# of Portfolio Holdings |
22 |
Portfolio Turnover Rate |
2% |
Total Advisory Fees Paid (Net) |
$333,002 | |
|
| Holdings [Text Block] |
Portfolio Breakdown (% of Net Assets)
|
|
Investment Companies |
87.8% |
Inflation-Linked Securities |
3.3% |
Purchased Options - Calls |
2.0% |
Purchased Options - Puts |
1.7% |
Short-Term Investments |
4.3% |
Other assets less liabilities |
0.9% | |
|
| Largest Holdings [Text Block] |
Company |
U.S. $ Value |
% of Net Assets |
iShares Core S&P 500 ETF |
$51,752,015 |
33.5% |
iShares Core U.S. Aggregate Bond ETF |
$22,855,680 |
14.8% |
Vanguard Total Bond Market ETF |
$22,795,848 |
14.8% |
iShares Core MSCI EAFE ETF |
$22,431,076 |
14.5% |
iShares Core MSCI Emerging Markets ETF |
$9,142,569 |
5.9% |
U.S. Treasury Inflation Index, 0.13%, due 01/15/32 |
$5,113,384 |
3.3% |
Vanguard Mid-Cap ETF |
$3,455,900 |
2.2% |
Vanguard Real Estate ETF |
$2,885,544 |
1.9% |
Purchased Options - Calls, S&P 500 Index, USD 6100.00, due 12/18/26 |
$1,303,200 |
0.8% |
Purchased Options - Calls, S&P 500 Index, USD 6000.00, due 12/18/26 |
$1,107,960 |
0.7% |
Total |
$142,843,176 |
92.4% | |
|
| Material Fund Change [Text Block] |
|
|
| C000028828 |
|
|
| Shareholder Report [Line Items] |
|
|
| Fund Name |
AB VPS International Value Portfolio
|
|
| Class Name |
Class A
|
|
| No Trading Symbol [Flag] |
true
|
|
| Annual or Semi-Annual Statement [Text Block] |
This semi-annual shareholder report contains important information about the AB VPS International Value Portfolio (the “Portfolio”) for the period of January 1, 2025 to June 30, 2025.
|
|
| Shareholder Report Annual or Semi-Annual |
Semi-Annual Shareholder Report
|
|
| Additional Information [Text Block] |
You can find additional information about the Portfolio at https://www.abfunds.com/link/AB/64VF-A-S. You can also request this information by contacting us at (800) 227 4618.
|
|
| Additional Information Phone Number |
(800) 227 4618
|
|
| Additional Information Website |
https://www.abfunds.com/link/AB/64VF-A-S
|
|
| Expenses [Text Block] |
What were the Portfolio costs for the last six months?(Based on a hypothetical $10,000 investment)
Class Name |
Cost of a $10,000 investment |
Costs paid as a percentage of a $10,000 investment |
Class A |
$51 |
0.91%Footnote Reference* |
| Footnote |
Description |
Footnote* |
Annualized | |
|
| Expenses Paid, Amount |
$ 51
|
|
| Expense Ratio, Percent |
0.91%
|
[10] |
| AssetsNet |
$ 306,815,261
|
|
| Holdings Count | Holding |
62
|
|
| Advisory Fees Paid, Amount |
$ 1,002,063
|
|
| InvestmentCompanyPortfolioTurnover |
28.00%
|
|
| Additional Fund Statistics [Text Block] |
Net Assets |
$306,815,261 |
# of Portfolio Holdings |
62 |
Portfolio Turnover Rate |
28% |
Total Advisory Fees Paid (Net) |
$1,002,063 | |
|
| Holdings [Text Block] |
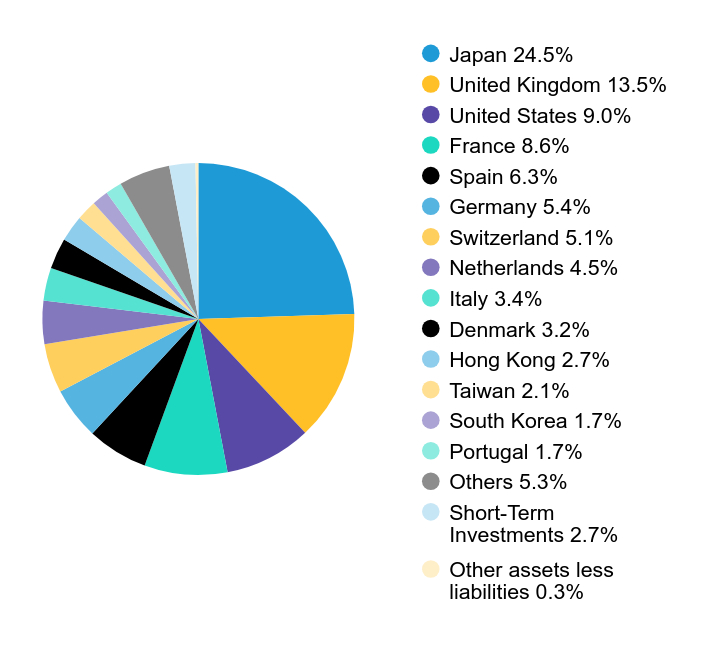
Country Breakdown (% of Net Assets)
Value |
Value |
Japan |
24.5% |
United Kingdom |
13.5% |
United States |
9.0% |
France |
8.6% |
Spain |
6.3% |
Germany |
5.4% |
Switzerland |
5.1% |
Netherlands |
4.5% |
Italy |
3.4% |
Denmark |
3.2% |
Hong Kong |
2.7% |
Taiwan |
2.1% |
South Korea |
1.7% |
Portugal |
1.7% |
Others |
5.3% |
Short-Term Investments |
2.7% |
Other assets less liabilities |
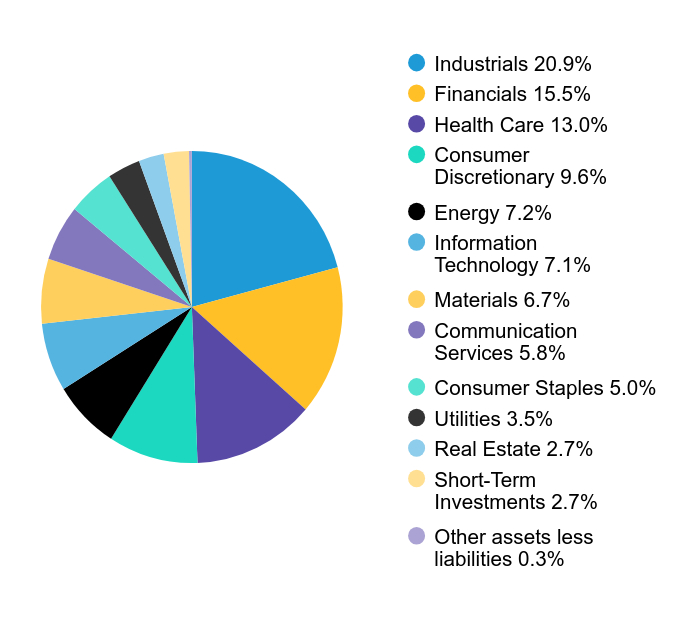
0.3% | Sector Breakdown (% of Net Assets)
Value |
Value |
Industrials |
20.9% |
Financials |
15.5% |
Health Care |
13.0% |
Consumer Discretionary |
9.6% |
Energy |
7.2% |
Information Technology |
7.1% |
Materials |
6.7% |
Communication Services |
5.8% |
Consumer Staples |
5.0% |
Utilities |
3.5% |
Real Estate |
2.7% |
Short-Term Investments |
2.7% |
Other assets less liabilities |
0.3% | |
|
| Largest Holdings [Text Block] |
Company |
U.S. $ Value |
% of Net Assets |
Shell PLC |
$10,782,287 |
3.5% |
Roche Holding AG |
$9,820,335 |
3.2% |
Airbus SE |
$7,215,540 |
2.4% |
AXA SA |
$6,911,877 |
2.3% |
Tokyo Electron Ltd. |
$6,894,337 |
2.2% |
Taiwan Semiconductor Manufacturing Co., Ltd. |
$6,509,344 |
2.1% |
Melrose Industries PLC |
$6,258,504 |
2.0% |
Industria de Diseno Textil SA |
$6,212,383 |
2.0% |
Resona Holdings, Inc. |
$6,039,299 |
2.0% |
Haleon PLC |
$5,894,087 |
1.9% |
Total |
$72,537,993 |
23.6% | |
|
| C000028829 |
|
|
| Shareholder Report [Line Items] |
|
|
| Fund Name |
AB VPS International Value Portfolio
|
|
| Class Name |
Class B
|
|
| No Trading Symbol [Flag] |
true
|
|
| Annual or Semi-Annual Statement [Text Block] |
This semi-annual shareholder report contains important information about the AB VPS International Value Portfolio (the “Portfolio”) for the period of January 1, 2025 to June 30, 2025.
|
|
| Shareholder Report Annual or Semi-Annual |
Semi-Annual Shareholder Report
|
|
| Additional Information [Text Block] |
You can find additional information about the Portfolio at https://www.abfunds.com/link/AB/64VF-B-S. You can also request this information by contacting us at (800) 227 4618.
|
|
| Additional Information Phone Number |
(800) 227 4618
|
|
| Additional Information Website |
https://www.abfunds.com/link/AB/64VF-B-S
|
|
| Expenses [Text Block] |
What were the Portfolio costs for the last six months?(Based on a hypothetical $10,000 investment)
Class Name |
Cost of a $10,000 investment |
Costs paid as a percentage of a $10,000 investment |
Class B |
$65 |
1.16%Footnote Reference* |
| Footnote |
Description |
Footnote* |
Annualized | |
|
| Expenses Paid, Amount |
$ 65
|
|
| Expense Ratio, Percent |
1.16%
|
[11] |
| AssetsNet |
$ 306,815,261
|
|
| Holdings Count | Holding |
62
|
|
| Advisory Fees Paid, Amount |
$ 1,002,063
|
|
| InvestmentCompanyPortfolioTurnover |
28.00%
|
|
| Additional Fund Statistics [Text Block] |
Net Assets |
$306,815,261 |
# of Portfolio Holdings |
62 |
Portfolio Turnover Rate |
28% |
Total Advisory Fees Paid (Net) |
$1,002,063 | |
|
| Holdings [Text Block] |
Country Breakdown (% of Net Assets)
Value |
Value |
Japan |
24.5% |
United Kingdom |
13.5% |
United States |
9.0% |
France |
8.6% |
Spain |
6.3% |
Germany |
5.4% |
Switzerland |
5.1% |
Netherlands |
4.5% |
Italy |
3.4% |
Denmark |
3.2% |
Hong Kong |
2.7% |
Taiwan |
2.1% |
South Korea |
1.7% |
Portugal |
1.7% |
Others |
5.3% |
Short-Term Investments |
2.7% |
Other assets less liabilities |
0.3% | Sector Breakdown (% of Net Assets)
Value |
Value |
Industrials |
20.9% |
Financials |
15.5% |
Health Care |
13.0% |
Consumer Discretionary |
9.6% |
Energy |
7.2% |
Information Technology |
7.1% |
Materials |
6.7% |
Communication Services |
5.8% |
Consumer Staples |
5.0% |
Utilities |
3.5% |
Real Estate |
2.7% |
Short-Term Investments |
2.7% |
Other assets less liabilities |
0.3% | |
|
| Largest Holdings [Text Block] |
Company |
U.S. $ Value |
% of Net Assets |
Shell PLC |
$10,782,287 |
3.5% |
Roche Holding AG |
$9,820,335 |
3.2% |
Airbus SE |
$7,215,540 |
2.4% |
AXA SA |
$6,911,877 |
2.3% |
Tokyo Electron Ltd. |
$6,894,337 |
2.2% |
Taiwan Semiconductor Manufacturing Co., Ltd. |
$6,509,344 |
2.1% |
Melrose Industries PLC |
$6,258,504 |
2.0% |
Industria de Diseno Textil SA |
$6,212,383 |
2.0% |
Resona Holdings, Inc. |
$6,039,299 |
2.0% |
Haleon PLC |
$5,894,087 |
1.9% |
Total |
$72,537,993 |
23.6% | |
|
| C000028830 |
|
|
| Shareholder Report [Line Items] |
|
|
| Fund Name |
AB VPS Large Cap Growth Portfolio
|
|
| Class Name |
Class A
|
|
| No Trading Symbol [Flag] |
true
|
|
| Annual or Semi-Annual Statement [Text Block] |
This semi-annual shareholder report contains important information about the AB VPS Large Cap Growth Portfolio (the “Portfolio”) for the period of January 1, 2025 to June 30, 2025.
|
|
| Shareholder Report Annual or Semi-Annual |
Semi-Annual Shareholder Report
|
|
| Additional Information [Text Block] |
You can find additional information about the Portfolio at https://www.abfunds.com/link/AB/64VL-A-S. You can also request this information by contacting us at (800) 227 4618.
|
|
| Additional Information Phone Number |
(800) 227 4618
|
|
| Additional Information Website |
https://www.abfunds.com/link/AB/64VL-A-S
|
|
| Expenses [Text Block] |
What were the Portfolio costs for the last six months?(Based on a hypothetical $10,000 investment)
Class Name |
Cost of a $10,000 investment |
Costs paid as a percentage of a $10,000 investment |
Class A |
$33 |
0.65%Footnote Reference* |
| Footnote |
Description |
Footnote* |
Annualized | |
|
| Expenses Paid, Amount |
$ 33
|
|
| Expense Ratio, Percent |
0.65%
|
[12] |
| AssetsNet |
$ 978,885,448
|
|
| Holdings Count | Holding |
55
|
|
| Advisory Fees Paid, Amount |
$ 2,741,199
|
|
| InvestmentCompanyPortfolioTurnover |
10.00%
|
|
| Additional Fund Statistics [Text Block] |
Net Assets |
$978,885,448 |
# of Portfolio Holdings |
55 |
Portfolio Turnover Rate |
10% |
Total Advisory Fees Paid (Net) |
$2,741,199 | |
|
| Holdings [Text Block] |
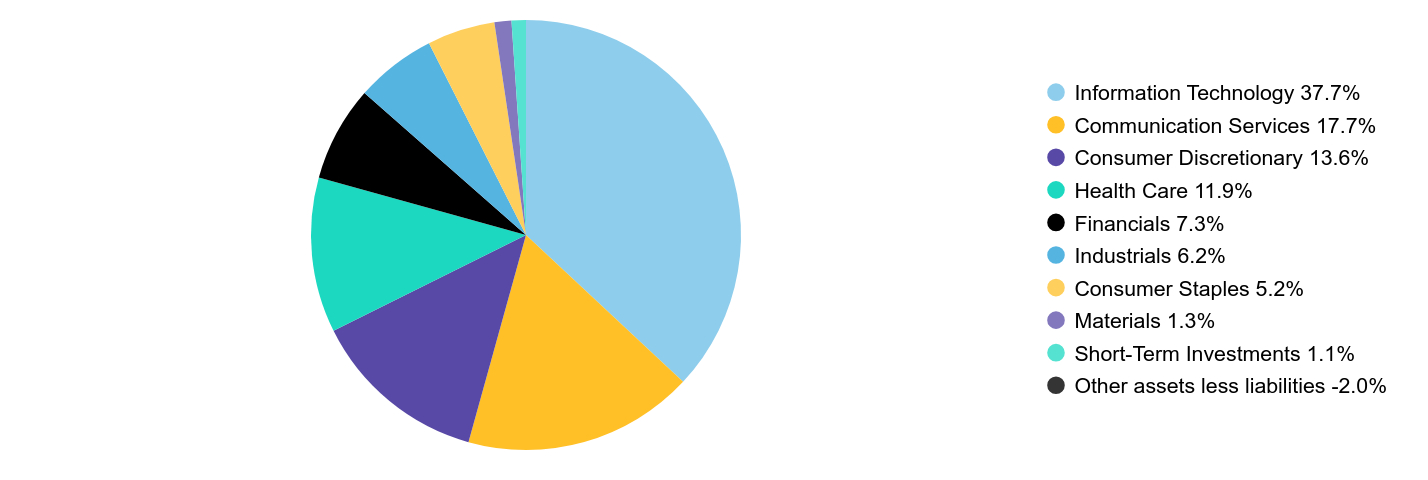
Sector Breakdown (% of Net Assets)
Value |
Value |
Information Technology |
37.7% |
Communication Services |
17.7% |
Consumer Discretionary |
13.6% |
Health Care |
11.9% |
Financials |
7.3% |
Industrials |
6.2% |
Consumer Staples |
5.2% |
Materials |
1.3% |
Short-Term Investments |
1.1% |
Other assets less liabilities |
-2.0% | |
|
| Largest Holdings [Text Block] |
Company |
U.S. $ Value |
% of Net Assets |
NVIDIA Corp. |
$103,919,344 |
10.6% |
Microsoft Corp. |
$86,990,045 |
8.9% |
Meta Platforms, Inc. - Class A |
$64,489,137 |
6.6% |
Amazon.com, Inc. |
$62,470,206 |
6.4% |
Netflix, Inc. |
$55,523,008 |
5.7% |
Broadcom, Inc. |
$50,205,513 |
5.1% |
Alphabet, Inc. - Class C |
$49,490,746 |
5.0% |
Visa, Inc. - Class A |
$45,736,121 |
4.7% |
Eli Lilly & Co. |
$26,196,106 |
2.7% |
Costco Wholesale Corp. |
$25,426,609 |
2.6% |
Total |
$570,446,835 |
58.3% | |
|
| Material Fund Change [Text Block] |
|
|
| C000028831 |
|
|
| Shareholder Report [Line Items] |
|
|
| Fund Name |
AB VPS Large Cap Growth Portfolio
|
|
| Class Name |
Class B
|
|
| No Trading Symbol [Flag] |
true
|
|
| Annual or Semi-Annual Statement [Text Block] |
This semi-annual shareholder report contains important information about the AB VPS Large Cap Growth Portfolio (the “Portfolio”) for the period of January 1, 2025 to June 30, 2025.
|
|
| Shareholder Report Annual or Semi-Annual |
Semi-Annual Shareholder Report
|
|
| Additional Information [Text Block] |
You can find additional information about the Portfolio at https://www.abfunds.com/link/AB/64VL-B-S. You can also request this information by contacting us at (800) 227 4618.
|
|
| Additional Information Phone Number |
(800) 227 4618
|
|
| Additional Information Website |
https://www.abfunds.com/link/AB/64VL-B-S
|
|
| Expenses [Text Block] |
What were the Portfolio costs for the last six months?(Based on a hypothetical $10,000 investment)
Class Name |
Cost of a $10,000 investment |
Costs paid as a percentage of a $10,000 investment |
Class B |
$46 |
0.90%Footnote Reference* |
| Footnote |
Description |
Footnote* |
Annualized | |
|
| Expenses Paid, Amount |
$ 46
|
|
| Expense Ratio, Percent |
0.90%
|
[13] |
| AssetsNet |
$ 978,885,448
|
|
| Holdings Count | Holding |
55
|
|
| Advisory Fees Paid, Amount |
$ 2,741,199
|
|
| InvestmentCompanyPortfolioTurnover |
10.00%
|
|
| Additional Fund Statistics [Text Block] |
Net Assets |
$978,885,448 |
# of Portfolio Holdings |
55 |
Portfolio Turnover Rate |
10% |
Total Advisory Fees Paid (Net) |
$2,741,199 | |
|
| Holdings [Text Block] |
Sector Breakdown (% of Net Assets)
Value |
Value |
Information Technology |
37.7% |
Communication Services |
17.7% |
Consumer Discretionary |
13.6% |
Health Care |
11.9% |
Financials |
7.3% |
Industrials |
6.2% |
Consumer Staples |
5.2% |
Materials |
1.3% |
Short-Term Investments |
1.1% |
Other assets less liabilities |
-2.0% | |
|
| Largest Holdings [Text Block] |
Company |
U.S. $ Value |
% of Net Assets |
NVIDIA Corp. |
$103,919,344 |
10.6% |
Microsoft Corp. |
$86,990,045 |
8.9% |
Meta Platforms, Inc. - Class A |
$64,489,137 |
6.6% |
Amazon.com, Inc. |
$62,470,206 |
6.4% |
Netflix, Inc. |
$55,523,008 |
5.7% |
Broadcom, Inc. |
$50,205,513 |
5.1% |
Alphabet, Inc. - Class C |
$49,490,746 |
5.0% |
Visa, Inc. - Class A |
$45,736,121 |
4.7% |
Eli Lilly & Co. |
$26,196,106 |
2.7% |
Costco Wholesale Corp. |
$25,426,609 |
2.6% |
Total |
$570,446,835 |
58.3% | |
|
| Material Fund Change [Text Block] |
|
|
| C000028836 |
|
|
| Shareholder Report [Line Items] |
|
|
| Fund Name |
AB VPS Small Cap Growth Portfolio
|
|
| Class Name |
Class A
|
|
| No Trading Symbol [Flag] |
true
|
|
| Annual or Semi-Annual Statement [Text Block] |
This semi-annual shareholder report contains important information about the AB VPS Small Cap Growth Portfolio (the “Portfolio”) for the period of January 1, 2025 to June 30, 2025.
|
|
| Shareholder Report Annual or Semi-Annual |
Semi-Annual Shareholder Report
|
|
| Additional Information [Text Block] |
You can find additional information about the Portfolio at https://www.abfunds.com/link/AB/64VS-A-S. You can also request this information by contacting us at (800) 227 4618.
|
|
| Additional Information Phone Number |
(800) 227 4618
|
|
| Additional Information Website |
https://www.abfunds.com/link/AB/64VS-A-S
|
|
| Expenses [Text Block] |
What were the Portfolio costs for the last six months?(Based on a hypothetical $10,000 investment)
Class Name |
Cost of a $10,000 investment |
Costs paid as a percentage of a $10,000 investment |
Class A |
$44 |
0.90%Footnote Reference* |
| Footnote |
Description |
Footnote* |
Annualized | |
|
| Expenses Paid, Amount |
$ 44
|
|
| Expense Ratio, Percent |
0.90%
|
[14] |
| AssetsNet |
$ 63,954,957
|
|
| Holdings Count | Holding |
104
|
|
| Advisory Fees Paid, Amount |
$ 119,455
|
|
| InvestmentCompanyPortfolioTurnover |
47.00%
|
|
| Additional Fund Statistics [Text Block] |
Net Assets |
$63,954,957 |
# of Portfolio Holdings |
104 |
Portfolio Turnover Rate |
47% |
Total Advisory Fees Paid (Net) |
$119,455 | |
|
| Holdings [Text Block] |
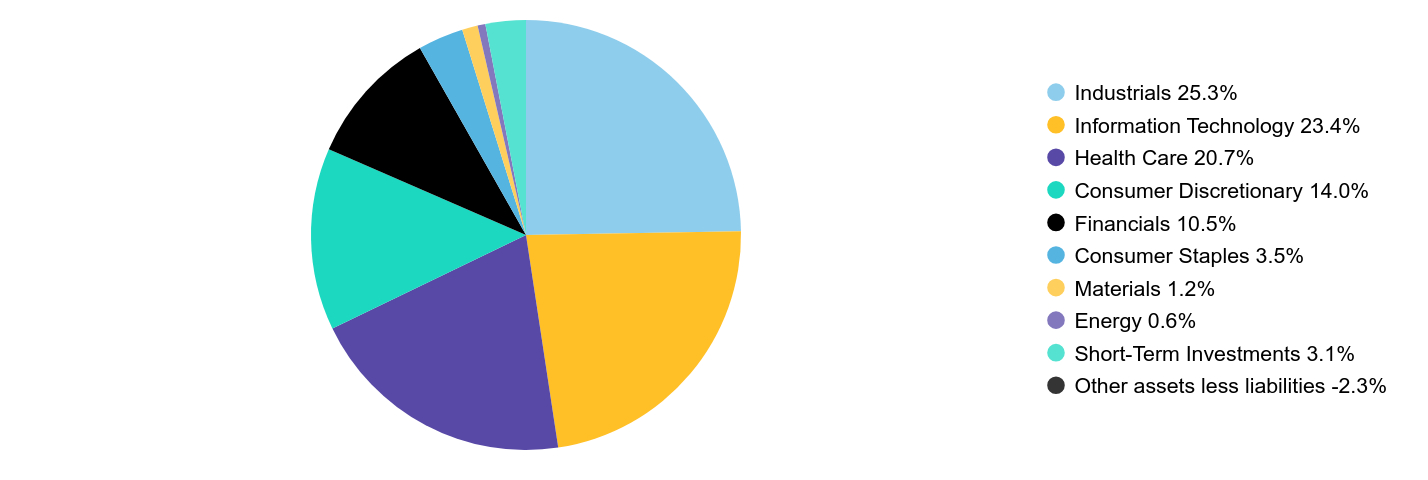
Sector Breakdown (% of Net Assets)
Value |
Value |
Industrials |
25.3% |
Information Technology |
23.4% |
Health Care |
20.7% |
Consumer Discretionary |
14.0% |
Financials |
10.5% |
Consumer Staples |
3.5% |
Materials |
1.2% |
Energy |
0.6% |
Short-Term Investments |
3.1% |
Other assets less liabilities |
-2.3% | |
|
| Largest Holdings [Text Block] |
Company |
U.S. $ Value |
% of Net Assets |
Credo Technology Group Holding Ltd. |
$1,543,475 |
2.4% |
AeroVironment, Inc. |
$1,282,560 |
2.0% |
SPX Technologies, Inc. |
$1,054,539 |
1.7% |
Construction Partners, Inc. - Class A |
$1,039,099 |
1.6% |
Alkami Technology, Inc. |
$1,023,313 |
1.6% |
Casella Waste Systems, Inc. - Class A |
$1,002,768 |
1.6% |
Primoris Services Corp. |
$995,294 |
1.6% |
SiTime Corp. |
$990,396 |
1.5% |
Ollie's Bargain Outlet Holdings, Inc. |
$990,195 |
1.5% |
Celsius Holdings, Inc. |
$961,572 |
1.5% |
Total |
$10,883,211 |
17.0% | |
|
| Material Fund Change [Text Block] |
|
|
| C000028837 |
|
|
| Shareholder Report [Line Items] |
|
|
| Fund Name |
AB VPS Small Cap Growth Portfolio
|
|
| Class Name |
Class B
|
|
| No Trading Symbol [Flag] |
true
|
|
| Annual or Semi-Annual Statement [Text Block] |
This semi-annual shareholder report contains important information about the AB VPS Small Cap Growth Portfolio (the “Portfolio”) for the period of January 1, 2025 to June 30, 2025.
|
|
| Shareholder Report Annual or Semi-Annual |
Semi-Annual Shareholder Report
|
|
| Additional Information [Text Block] |
You can find additional information about the Portfolio at https://www.abfunds.com/link/AB/64VS-B-S. You can also request this information by contacting us at (800) 227 4618.
|
|
| Additional Information Phone Number |
(800) 227 4618
|
|
| Additional Information Website |
https://www.abfunds.com/link/AB/64VS-B-S
|
|
| Expenses [Text Block] |
What were the Portfolio costs for the last six months?(Based on a hypothetical $10,000 investment)
Class Name |
Cost of a $10,000 investment |
Costs paid as a percentage of a $10,000 investment |
Class B |
$56 |
1.15%Footnote Reference* |
| Footnote |
Description |
Footnote* |
Annualized | |
|
| Expenses Paid, Amount |
$ 56
|
|
| Expense Ratio, Percent |
1.15%
|
[15] |
| AssetsNet |
$ 63,954,957
|
|
| Holdings Count | Holding |
104
|
|
| Advisory Fees Paid, Amount |
$ 119,455
|
|
| InvestmentCompanyPortfolioTurnover |
47.00%
|
|
| Additional Fund Statistics [Text Block] |
Net Assets |
$63,954,957 |
# of Portfolio Holdings |
104 |
Portfolio Turnover Rate |
47% |
Total Advisory Fees Paid (Net) |
$119,455 | |
|
| Holdings [Text Block] |
Sector Breakdown (% of Net Assets)
Value |
Value |
Industrials |
25.3% |
Information Technology |
23.4% |
Health Care |
20.7% |
Consumer Discretionary |
14.0% |
Financials |
10.5% |
Consumer Staples |
3.5% |
Materials |
1.2% |
Energy |
0.6% |
Short-Term Investments |
3.1% |
Other assets less liabilities |
-2.3% | |
|
| Largest Holdings [Text Block] |
Company |
U.S. $ Value |
% of Net Assets |
Credo Technology Group Holding Ltd. |
$1,543,475 |
2.4% |
AeroVironment, Inc. |
$1,282,560 |
2.0% |
SPX Technologies, Inc. |
$1,054,539 |
1.7% |
Construction Partners, Inc. - Class A |
$1,039,099 |
1.6% |
Alkami Technology, Inc. |
$1,023,313 |
1.6% |
Casella Waste Systems, Inc. - Class A |
$1,002,768 |
1.6% |
Primoris Services Corp. |
$995,294 |
1.6% |
SiTime Corp. |
$990,396 |
1.5% |
Ollie's Bargain Outlet Holdings, Inc. |
$990,195 |
1.5% |
Celsius Holdings, Inc. |
$961,572 |
1.5% |
Total |
$10,883,211 |
17.0% | |
|
| Material Fund Change [Text Block] |
|
|
| C000028860 |
|
|
| Shareholder Report [Line Items] |
|
|
| Fund Name |
AB VPS Sustainable Global Thematic Portfolio
|
|
| Class Name |
Class A
|
|
| No Trading Symbol [Flag] |
true
|
|
| Annual or Semi-Annual Statement [Text Block] |
This semi-annual shareholder report contains important information about the AB VPS Sustainable Global Thematic Portfolio (the “Portfolio”) for the period of January 1, 2025 to June 30, 2025.
|
|
| Shareholder Report Annual or Semi-Annual |
Semi-Annual Shareholder Report
|
|
| Additional Information [Text Block] |
You can find additional information about the Portfolio at https://www.abfunds.com/link/AB/64VA-A-S. You can also request this information by contacting us at (800) 227 4618.
|
|
| Additional Information Phone Number |
(800) 227 4618
|
|
| Additional Information Website |
https://www.abfunds.com/link/AB/64VA-A-S
|
|
| Expenses [Text Block] |
What were the Portfolio costs for the last six months?(Based on a hypothetical $10,000 investment)
Class Name |
Cost of a $10,000 investment |
Costs paid as a percentage of a $10,000 investment |
Class A |
$48 |
0.93%Footnote Reference* |
| Footnote |
Description |
Footnote* |
Annualized | |
|
| Expenses Paid, Amount |
$ 48
|
|
| Expense Ratio, Percent |
0.93%
|
[16] |
| AssetsNet |
$ 162,412,703
|
|
| Holdings Count | Holding |
56
|
|
| Advisory Fees Paid, Amount |
$ 535,350
|
|
| InvestmentCompanyPortfolioTurnover |
36.00%
|
|
| Additional Fund Statistics [Text Block] |
Net Assets |
$162,412,703 |
# of Portfolio Holdings |
56 |
Portfolio Turnover Rate |
36% |
Total Advisory Fees Paid (Net) |
$535,350 | |
|
| Holdings [Text Block] |
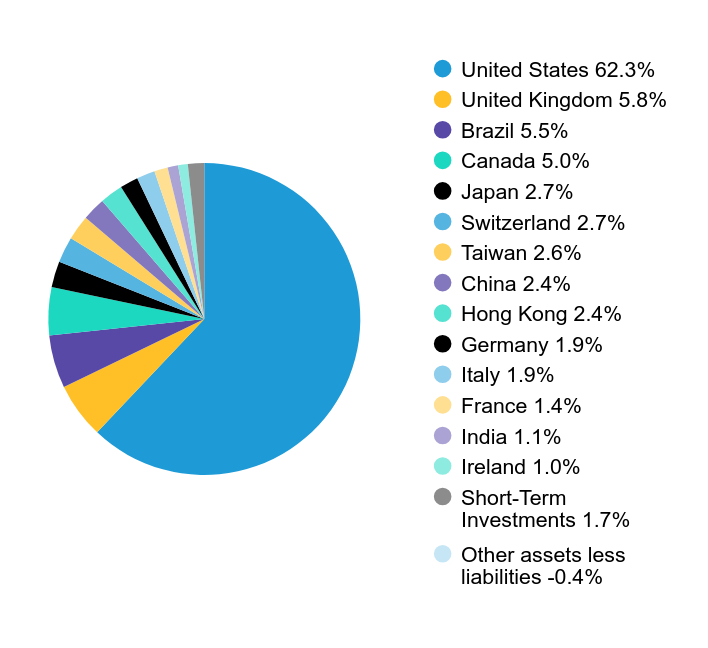
Country Breakdown (% of Net Assets)
Value |
Value |
United States |
62.3% |
United Kingdom |
5.8% |
Brazil |
5.5% |
Canada |
5.0% |
Japan |
2.7% |
Switzerland |
2.7% |
Taiwan |
2.6% |
China |
2.4% |
Hong Kong |
2.4% |
Germany |
1.9% |
Italy |
1.9% |
France |
1.4% |
India |
1.1% |
Ireland |
1.0% |
Short-Term Investments |
1.7% |
Other assets less liabilities |
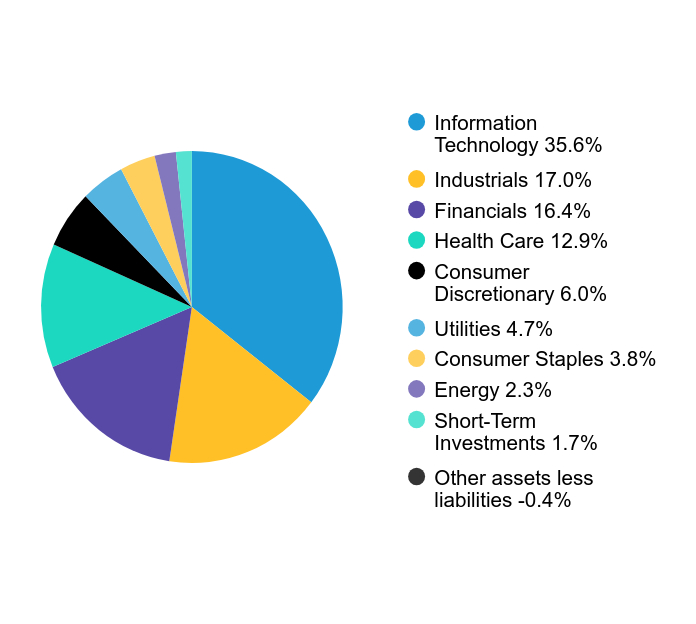
-0.4% | Sector Breakdown (% of Net Assets)
Value |
Value |
Information Technology |
35.6% |
Industrials |
17.0% |
Financials |
16.4% |
Health Care |
12.9% |
Consumer Discretionary |
6.0% |
Utilities |
4.7% |
Consumer Staples |
3.8% |
Energy |
2.3% |
Short-Term Investments |
1.7% |
Other assets less liabilities |
-0.4% | |
|
| Largest Holdings [Text Block] |
Company |
U.S. $ Value |
% of Net Assets |
Microsoft Corp. |
$6,825,460 |
4.2% |
Flex Ltd. |
$5,692,777 |
3.5% |
NVIDIA Corp. |
$5,587,632 |
3.4% |
Visa, Inc. - Class A |
$4,187,105 |
2.6% |
Taiwan Semiconductor Manufacturing Co., Ltd. |
$4,168,906 |
2.6% |
London Stock Exchange Group PLC |
$4,142,011 |
2.5% |
Cia de Saneamento Basico do Estado de Sao Paulo SABESP |
$4,085,713 |
2.5% |
Rockwell Automation, Inc. |
$3,996,337 |
2.5% |
AIA Group Ltd. |
$3,819,038 |
2.4% |
Cameco Corp. |
$3,810,226 |
2.3% |
Total |
$46,315,205 |
28.5% | |
|
| C000028861 |
|
|
| Shareholder Report [Line Items] |
|
|
| Fund Name |
AB VPS Sustainable Global Thematic Portfolio
|
|
| Class Name |
Class B
|
|
| No Trading Symbol [Flag] |
true
|
|
| Annual or Semi-Annual Statement [Text Block] |
This semi-annual shareholder report contains important information about the AB VPS Sustainable Global Thematic Portfolio (the “Portfolio”) for the period of January 1, 2025 to June 30, 2025.
|
|
| Shareholder Report Annual or Semi-Annual |
Semi-Annual Shareholder Report
|
|
| Additional Information [Text Block] |
You can find additional information about the Portfolio at https://www.abfunds.com/link/AB/64VA-B-S. You can also request this information by contacting us at (800) 227 4618.
|
|
| Additional Information Phone Number |
(800) 227 4618
|
|
| Additional Information Website |
https://www.abfunds.com/link/AB/64VA-B-S
|
|
| Expenses [Text Block] |
What were the Portfolio costs for the last six months?(Based on a hypothetical $10,000 investment)
Class Name |
Cost of a $10,000 investment |
Costs paid as a percentage of a $10,000 investment |
Class B |
$60 |
1.18%Footnote Reference* |
| Footnote |
Description |
Footnote* |
Annualized | |
|
| Expenses Paid, Amount |
$ 60
|
|
| Expense Ratio, Percent |
1.18%
|
[17] |
| AssetsNet |
$ 162,412,703
|
|
| Holdings Count | Holding |
56
|
|
| Advisory Fees Paid, Amount |
$ 535,350
|
|
| InvestmentCompanyPortfolioTurnover |
36.00%
|
|
| Additional Fund Statistics [Text Block] |
Net Assets |
$162,412,703 |
# of Portfolio Holdings |
56 |
Portfolio Turnover Rate |
36% |
Total Advisory Fees Paid (Net) |
$535,350 | |
|
| Holdings [Text Block] |
Country Breakdown (% of Net Assets)
Value |
Value |
United States |
62.3% |
United Kingdom |
5.8% |
Brazil |
5.5% |
Canada |
5.0% |
Japan |
2.7% |
Switzerland |
2.7% |
Taiwan |
2.6% |
China |
2.4% |
Hong Kong |
2.4% |
Germany |
1.9% |
Italy |
1.9% |
France |
1.4% |
India |
1.1% |
Ireland |
1.0% |
Short-Term Investments |
1.7% |
Other assets less liabilities |
-0.4% | Sector Breakdown (% of Net Assets)
Value |
Value |
Information Technology |
35.6% |
Industrials |
17.0% |
Financials |
16.4% |
Health Care |
12.9% |
Consumer Discretionary |
6.0% |
Utilities |
4.7% |
Consumer Staples |
3.8% |
Energy |
2.3% |
Short-Term Investments |
1.7% |
Other assets less liabilities |
-0.4% | |
|
| Largest Holdings [Text Block] |
Company |
U.S. $ Value |
% of Net Assets |
Microsoft Corp. |
$6,825,460 |
4.2% |
Flex Ltd. |
$5,692,777 |
3.5% |
NVIDIA Corp. |
$5,587,632 |
3.4% |
Visa, Inc. - Class A |
$4,187,105 |
2.6% |
Taiwan Semiconductor Manufacturing Co., Ltd. |
$4,168,906 |
2.6% |
London Stock Exchange Group PLC |
$4,142,011 |
2.5% |
Cia de Saneamento Basico do Estado de Sao Paulo SABESP |
$4,085,713 |
2.5% |
Rockwell Automation, Inc. |
$3,996,337 |
2.5% |
AIA Group Ltd. |
$3,819,038 |
2.4% |
Cameco Corp. |
$3,810,226 |
2.3% |
Total |
$46,315,205 |
28.5% | |
|
|
|