
 |
| |
Earnings Release 2Q / 2025
|
Analysis of 2Q25 Consolidated Results
|
 |
Operating and Financial Highlights | 03 |
| |
||
|
Senior Management Quotes
|
04 |
|
|
||
|
Second Quarter 2025 Earnings Conference Call
|
05 |
|
|
||
|
Summary of Financial Performance and Outlook
|
06 |
|
Financial Overview | 11 |
|
Credicorp’s Strategy Update | 12 |
|
Analysis of 2Q25 Consolidated Results |
|
01
|
Loan Portfolio
|
16
|
|
|
02
|
Deposits
|
19
|
|
|
03
|
Interest Earning Assets and Funding
|
22
|
|
|
04
|
Net Interest Income (NII)
|
24
|
|
|
05
|
Portfolio Quality and Provisions
|
27 | |
|
06
|
Other Income
|
32
|
|
|
07
|
Insurance Underwriting Results and the Medical Services
|
36
|
|
|
08
|
Operating Expenses
|
38 | |
|
09
|
Operating Efficiency
|
40 | |
|
10
|
Regulatory Capital
|
41 | |
|
11
|
Economic Outlook
|
43 | |
|
12
|
Appendix
|
47 |
 |
|
| |
Earnings Release 2Q / 2025
|
Analysis of 2Q25 Consolidated Results
|
| |
|||
| • |
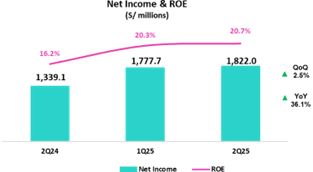
Net Income attributable to Credicorp increased 36.1% YoY and 2.5% QoQ to S/1,822.0 million, translating into an ROE of 20.7%.
These results include a positive 120 bps impact related to a relevant gain in BCP’s investment portfolio.
|
| • |
In 2Q25 Credicorp revalued Bolivia’s balance sheet using a market-reflective FX rate, resulting in an accounting contraction of 2.8% in Credicorp Total Assets with no impact on cash flow. The loan and
deposit figures cited below exclude this adjustment.
|
| • |
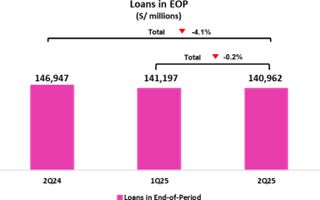
Total Loans measured in quarter-end balances declined 0.3% YoY, but up 2.6% FX Neutral mainly led by BCP through Retail Banking, where stand-out performers were
Mortgage and Consumer (Yape), and by Mibanco. QoQ, total Loans rose 1.2%, with 2.5% FX Neutral growth driven by the same segments, along with Wholesale Banking at BCP.
|
| • |
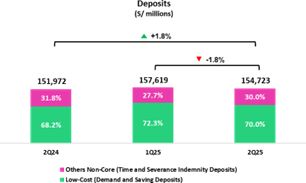
Total Deposits increased 6.2% (+10.2% FX Neutral) YoY reflecting growth in Low-cost deposits, amid higher system liquidity, and contracted 0.5% (+1.0% FX Neutral)
QoQ. Low-cost deposits accounted for 71.8% of total deposits and 57.2% of the total funding base.
|
| • |
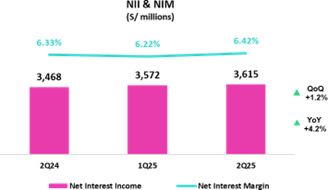
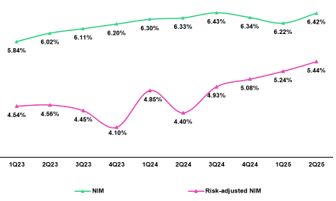
Net Interest Income (NII) increased 4.2% YoY mainly supported by lower Interest and Similar Expenses. QoQ, NII increased 1.2%. Net
Interest Margin (NIM) stood at 6.42%, increasing 9 bps YoY and 20 bps QoQ.
|
| • |
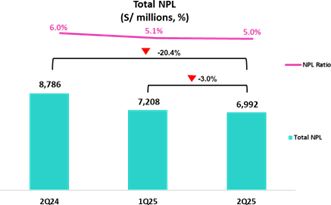
NPL Ratio contracted across segments, improving 102 bps YoY to 5.0%, driven by debt repayments at BCP Stand-alone and a drop in overdue loans at BCP and Mibanco.
QoQ, the NPL Ratio improved 14 bps.
|
| • |
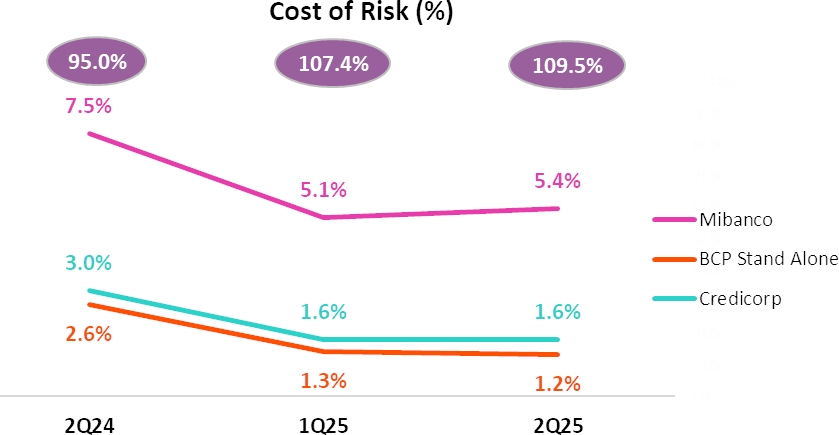
Provisions declined by 47.4% YoY, driven by BCP and Mibanco, supported by strengthened risk management, improved payment behavior, benefiting from an economic
recovery, and a higher share of lower-risk vintages within the portfolio. QoQ, provisions dropped 1.2%. As a result, Cost of Risk hit a low of 1.6% and Risk-Adjusted
NIM reached a record-high of 5.44%.
|
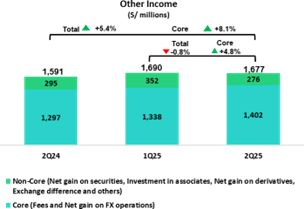
| • |
Core Income increased 5.3% YoY, reflecting a stronger NII and ongoing diversification in revenue streams, which drove growth of 8.2% in Fee income and 7.9% in Net
Gain on FX Transactions.
|
| • |
Other Non-Core Income reported a relevant gain of S/106 million, which was associated with a sovereign bond exchange at BCP.
|
| • |
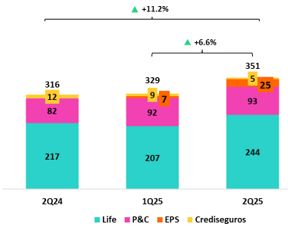
Insurance Underwriting Results increased 11.2% YoY, driven primarily by lower insurance service expenses in the Life business and secondarily, by higher insurance
service income in P & C; and was up 6.6% QoQ.
|
| • |
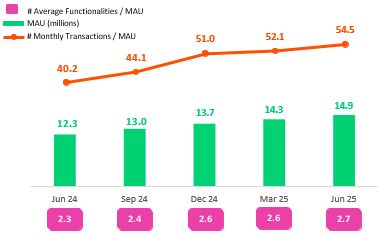
Yape reached 14.9 million Monthly Active Users (MAU), with an operating leverage continuing to expand and accounting for 5.5% of Credicorp’s total risk-adjusted
revenue.
|
| • |
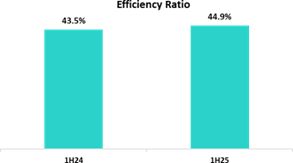
Efficiency Ratio for 1H25 reached 44.9%, aligned with our full-year guidance. Operating expenses during this period increased 11.4% YoY, driven mainly by the core
business at BCP Stand-alone and investments in our innovation portfolio initiatives.
|
| • |
IFRS CET 1 Ratio stood at 12.56% for BCP Stand-alone and at 16.73% for Mibanco.
|
| • |
After quarter-end, on August 13, 2025, Credicorp announced the cancellation of approximately 1.6 billion soles in Tax resolutions issued by Sunat on June 27, 2025.
The company will record this cash outflow as an asset. As the contingency remains classified as remote, no provision is required in accordance with International Accounting Standards.
|
 |
|
| |
Earnings Release 2Q / 2025
|
Analysis of 2Q25 Consolidated Results
|
| |
|||
 |
 |
 |
|
| |
Earnings Release 2Q / 2025
|
Analysis of 2Q25 Consolidated Results
|
|
Second Quarter 2025 Earnings Conference Call
|
|||
 |
|
| |
Earnings Release 2Q / 2025
|
Analysis of 2Q25 Consolidated Results
|
 |
|
| |
Earnings Release 2Q / 2025
|
Analysis of 2Q25 Consolidated Results
|
|
|
 |
|
| |
Earnings Release 2Q / 2025
|
Analysis of 2Q25 Consolidated Results
|
 |
|
|
|
| |
Earnings Release 2Q / 2025
|
Analysis of 2Q25 Consolidated Results
|
| (1) |
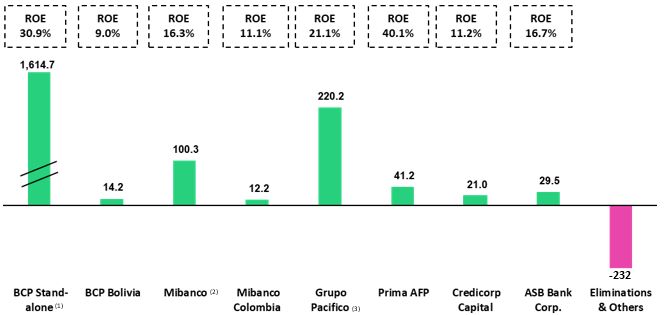
In BCP Stand-alone, the figure is lower than the net profit since the contribution eliminates investment gains in other subsidiaries of Credicorp (Mibanco). ROE excludes the impact of 200 bps related
to the relevant gain associated with the sovereign bond exchange.
|
| (2) |
In Mibanco, the figure is less than the net profit because Credicorp owns (directly and indirectly) 99.921% of Mibanco.
|
| (3) |
The contribution for Grupo Pacifico presented here is greater than the profit of Pacifico Seguros since 100% of Crediseguros is being included (including 48% under Grupo Crédito).
|
 |
|
| |
Earnings Release 2Q / 2025
|
Analysis of 2Q25 Consolidated Results
|
|
Universal Banking
|
|
|
|
BCP posted a noteworthy profitability this quarter, supported by a low level of the cost of risk and a resilient NIM, on the back of economic recovery and
a decrease in the cost of funding, respectively. Core income remained solid, underpinned by a growing and diversified revenue base. Other Non-Core Income benefited from gains related to a sovereign bond exchange. Operating
efficiency remained strong, with expenses well contained.
|
|
|
|
Insurance and Pensions
|
|
Net income at Grupo Pacífico reflect solid underlying business performance, particularly in the Life and General Insurance segments, which continue to
deliver strong underwriting results. The consolidation of Empresas Banmédica’s operations has further strengthened Medical Services. These positive dynamics were partially offset by the impact of a credit downgrade on a
couple of assets in the investment portfolio.
|
|
Microfinance
|
|
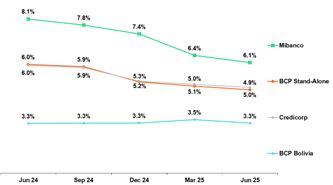
Profitability at Mibanco rose YoY, driven mainly by a rebound in disbursements; strengthened risk management; and effective interest-rate strategies. NIM
remained strong, fueled by active management of loan pricing and a reduction in the funding cost.
Results at Mibanco Colombia continued to improve on the back of turnaround measures taken last year and a more supportive environment for the microfinance
sector. Growth remained stable and the risk levels, controlled.
|
|
|
|
Investment Management and
Advisory
|
|
Operating profitability in the Investment Management and Advisory line of business remained resilient in 2Q25. Core income- generating businesses delivered
robust results this quarter, reflecting broad-based business strength that helped partially offset the absence of last year’s one-off income from our now-discontinued Corporate Finance Business. Our Asset Management and
Wealth Management businesses reported significant growth in AUMs.
|
|
|
|
Outlook
|
|
We revised our 2025 ROE guidance to around 19.0%. We anticipate that this result will be
driven by: (i) acceleration of our loan portfolio growth, particularly in the retail segment, (ii) the resilience of
our NIM, and (iii) a lower than initially expected cost of risk.
We have also raised our long-term ROE target to 19.5%, driven by stronger retail loan growth dynamics, an improvement in risk-adjusted NIM and enhanced expectations for
diversified sources of income.
|
 |
|
| |
Earnings Release 2Q / 2025
|
Analysis of 2Q25 Consolidated Results
|
|
Financial Overview
|
|
Credicorp Ltd.
|
|
Quarter |
% change
|
Up to
|
% change
|
|||
|
S/ 000
|
2Q24
|
1Q25
|
2Q25
|
QoQ
|
YoY
|
Jun 24
|
Jun 25
|
Jun 25 / Jun 24
|
|
Net interest, similar income and expenses
|
3,468,464
|
3,572,012
|
3,615,371
|
1.2%
|
4.2%
|
6,894,587
|
7,187,383
|
4.2%
|
|
Provision for credit losses on loan portfolio, net of recoveries
|
(1,093,371)
|
(581,893)
|
(575,159)
|
-1.2%
|
-47.4%
|
(1,908,070)
|
(1,157,052)
|
-39.4%
|
|
Net interest, similar income and expenses, after provision for credit losses on loan portfolio
|
2,375,093
|
2,990,119
|
3,040,212
|
1.7%
|
28.0%
|
4,986,517
|
6,030,331
|
20.9%
|
|
Other income
|
1,591,330
|
1,690,216
|
1,677,373
|
-0.8%
|
5.4%
|
2,983,889
|
3,367,589
|
12.9%
|
|
Insurance underwriting result
|
315,500
|
329,134
|
350,873
|
6.6%
|
11.2%
|
594,562
|
680,007
|
14.4%
|
|
Medical services result
|
-
|
42,689
|
123,319
|
188.9%
|
n.a.
|
-
|
166,008
|
n.a.
|
|
Total expenses
|
(2,395,205)
|
(2,532,874)
|
(2,630,310)
|
3.8%
|
9.8%
|
(4,607,687)
|
(5,163,184)
|
12.1%
|
|
Profit before income tax
|
1,886,718
|
2,519,284
|
2,561,467
|
1.7%
|
35.8%
|
3,957,281
|
5,080,751
|
28.4%
|
|
Income tax
|
(519,344)
|
(704,469)
|
(696,969)
|
-1.1%
|
34.2%
|
(1,047,810)
|
(1,401,438)
|
33.7%
|
|
Net profit
|
1,367,374
|
1,814,815
|
1,864,498
|
2.7%
|
36.4%
|
2,909,471
|
3,679,313
|
26.5%
|
|
Non-controlling interest
|
28,278
|
37,118
|
42,483
|
14.5%
|
50.2%
|
58,718
|
79,601
|
35.6%
|
|
Net profit attributable to Credicorp
|
1,339,096
|
1,777,697
|
1,822,015
|
2.5%
|
36.1%
|
2,850,753
|
3,599,712
|
26.3%
|
|
Dividends paid to third parties
|
2,791,652
|
-
|
3,181,440
|
n.a.
|
14.0%
|
2,791,652
|
3,181,440
|
14.0%
|
|
Net income / share (S/)
|
16.8
|
22.3
|
22.8
|
2.5%
|
36.1%
|
36
|
45
|
26.3%
|
|
Dividends per Share (S/)
|
-
|
-
|
40
|
n.a.
|
n.a.
|
35
|
40
|
14.0%
|
|
Loans
|
146,946,546
|
141,196,646
|
140,961,978
|
-0.2%
|
-4.1%
|
146,946,546
|
140,961,978
|
-4.1%
|
|
Deposits and obligations
|
151,971,984
|
157,619,082
|
154,723,334
|
-1.8%
|
1.8%
|
151,971,984
|
154,723,334
|
1.8%
|
|
Net equity
|
32,413,767
|
35,843,202
|
34,459,012
|
-3.9%
|
6.3%
|
32,413,767
|
34,459,012
|
6.3%
|
|
Profitability
|
||||||||
|
Net interest margin(1)
|
6.3%
|
6.2%
|
6.4%
|
20 bps
|
9 bps
|
6.3%
|
6.3%
|
1 bps
|
|
Risk-adjusted Net interest margin
|
4.4%
|
5.2%
|
5.4%
|
20 bps
|
104 bps
|
4.6%
|
5.3%
|
72 bps
|
|
Funding cost(2)
|
2.9%
|
2.4%
|
2.4%
|
2 bps
|
-42 bps
|
0.03
|
2.4%
|
-50 bps
|
|
ROAE
|
16.2%
|
20.3%
|
20.7%
|
40 bps
|
450 bps
|
17.6%
|
20.9%
|
330 bps
|
|
ROAA
|
2.2%
|
2.8%
|
2.9%
|
10 bps
|
70 bps
|
2.3%
|
2.9%
|
51 bps
|
|
Loan portfolio quality
|
||||||||
|
Internal overdue ratio(3)
|
4.2%
|
3.7%
|
3.6%
|
-11 bps
|
-66 bps
|
4.2%
|
3.6%
|
-66 bps
|
|
Internal overdue ratio over 90 days
|
3.2%
|
3.0%
|
3.0%
|
-4 pbs
|
-28 pbs
|
3.2%
|
3.0%
|
-28 pbs
|
|
NPL ratio(4)
|
6.0%
|
5.1%
|
5.0%
|
-14 bps
|
-102 bps
|
6.0%
|
5.0%
|
-102 bps
|
|
Cost of risk(5)
|
3.0%
|
1.6%
|
1.6%
|
1 bps
|
-141 bps
|
2.6%
|
1.6%
|
-100 bps
|
|
Coverage ratio of IOLs
|
134.0%
|
148.7%
|
151.8%
|
310 bps
|
1780 bps
|
134.0%
|
151.8%
|
1780 bps
|
|
Coverage ratio of NPLs
|
95.0%
|
107.4%
|
109.5%
|
210 bps
|
1450 bps
|
95.0%
|
109.5%
|
1450 bps
|
|
Operating efficiency
|
||||||||
|
Operating income(6)
|
5,143,084
|
5,340,199
|
5,529,301
|
3.5%
|
7.5%
|
10,076,862
|
10,869,500
|
7.9%
|
|
Operating expenses(7)
|
2,270,785
|
2,442,089
|
2,441,547
|
0.0%
|
7.5%
|
4,383,595
|
4,883,636
|
11.4%
|
|
Efficiency ratio(8)
|
44.2%
|
45.7%
|
44.2%
|
-150 bps
|
0 bps
|
43.5%
|
44.9%
|
143 bps
|
|
Operating expenses / Total average assets
|
3.7%
|
3.8%
|
3.9%
|
9 bps
|
19 bps
|
3.6%
|
3.9%
|
27 bps
|
|
Capital adequacy - BCP Stand-alone
|
||||||||
|
Global Capital Ratio(9)
|
16.2%
|
16.9%
|
17.3%
|
47 bps
|
109 bps
|
16.2%
|
17.3%
|
109 bps
|
|
Ratio Tier 1(10)
|
11.9%
|
11.3%
|
12.2%
|
91 bps
|
34 bps
|
11.9%
|
12.2%
|
34 bps
|
|
Ratio common equity tier 1(11) (13)
|
11.9%
|
11.3%
|
12.2%
|
91 bps
|
34 bps
|
11.9%
|
12.2%
|
34 bps
|
|
Capital adequacy - Mibanco
|
||||||||
|
Global Capital Ratio(9)
|
18.9%
|
18.5%
|
19.6%
|
108 bps
|
66 bps
|
18.9%
|
19.6%
|
66 bps
|
|
Ratio Tier 1(10)
|
16.6%
|
15.5%
|
16.5%
|
100 bps
|
-15 bps
|
16.6%
|
16.5%
|
-14 bps
|
|
Ratio common equity tier 1(11) (13)
|
16.7%
|
15.9%
|
16.7%
|
84 bps
|
0 bps
|
16.7%
|
16.7%
|
0 bps
|
|
Employees(14)
|
38,641
|
46,621
|
46,423
|
-0.4%
|
20.1%
|
38,641
|
46,423
|
20.1%
|
|
Share Information
|
||||||||
|
Issued Shares
|
94,382
|
94,382
|
94,382
|
0.0%
|
0.0%
|
94,382
|
94,382
|
0.0%
|
|
Treasury Shares(12)
|
14,949
|
15,016
|
15,016
|
0.0%
|
0.4%
|
14,949
|
15,016
|
0.4%
|
|
Outstanding Shares
|
79,433
|
79,366
|
79,366
|
0.0%
|
-0.1%
|
79,433
|
79,366
|
-0.1%
|
| (1) |
Net Interest Margin = Net Interest Income (Excluding Net Insurance Financial Expenses)/ Average Interest Earning Assets
|
| (2) |
Funding Cost = Interest Expense (Does not include Net Insurance Financial Expenses) / Average Funding
|
| (3) |
Internal Overdue Loans: include overdue loans and loans under legal collection, according to our internal policy for overdue loans. Internal Overdue Ratio: Internal overdue loans/ Total loans
|
| (4) |
Non-performing loans (NPL): Internal overdue loans + Refinanced loans. NPL ratio: NPL / Total loans.
|
| (5) |
Cost of risk = Annualized provision for loan losses, net of recoveries/ Total loans.
|
| (6) |
Operating Income = Net interest, similar income and expenses + Fee Income+ Net gain on foreign exchange transactions + Net Gain From associates + Net gain on derivatives held for trading + Result on exchange differences +
Insurance Underwriting Result + Results for Medical Services
|
| (7) |
Operating Expenses = Salaries and employee benefits + Administrative expenses + Depreciation and amortization + Association in participation + Acquisition cost.
|
| (8) |
Efficiency Ratio = (Salaries and employee benefits + Administrative expenses + Depreciation and amortization + Association in participation) / (Net interest, similar income and expenses + Fee Income+ Net gain on foreign
exchange transactions + Net Gain From associates + Net gain on derivatives held for trading + Result on exchange differences + Insurance Underwriting Result)
|
| (9) |
Regulatory Capital/ Risk-weighted assets (legal minimum = 10% since July 2011).
|
| (10) |
Tier 1 = Capital + Legal and other capital reserves + Accumulated earnings with capitalization agreement + (0.5 x Unrealized profit and net income in subsidiaries) - Goodwill - (0.5 x Investment in subsidiaries) + Perpetual
subordinated debt (the maximum amount that can be included is 17.65% of Capital + Reserves + Accumulated earnings with capitalization agreement + Unrealized profit and net income in subsidiaries - Goodwill).
|
| (11) |
Common Equity TierI = Capital + Reserves – 100% of applicable deductions (investment in subsidiaries, goodwill, intangibles, and net deferred taxes that rely on future profitability) + retained earnings + unrealized gains.
|
| (12) |
Consider shares held by Atlantic Security Holding Corporation (ASHC) and stock awards.
|
| (13) |
Common Equity Tier I calculated based on IFRS Accounting.
|
| (14) |
Internal management figures. Since 1Q25, it has included corporate health and medical services employees.
|
 |
|
| |
Earnings Release 2Q / 2025
|
Analysis of 2Q25 Consolidated Results
|
|
Main Strategic Milestones at Credicorp
|
|
Core Businesses Transformation (1)
|
Quarter
|
Up to
|
|||
|
2Q24
|
1Q25
|
2Q25
|
Jun 24
|
Jun 25
|
|
|
Credicorp
|
|||||
|
Innovation Portfolio Risk-Adjusted Revenue Share (2)
|
3.4%
|
5.4%
|
6.2%
|
3.3%
|
5.8%
|
|
BCP Stand-alone
|
|||||
|
Digital clients (3)
|
72%
|
78%
|
79%
|
70%
|
78%
|
|
Digital monetary transactions (4)
|
85%
|
89%
|
90%
|
84%
|
89%
|
|
Cashless transactions (5)
|
61%
|
66%
|
66%
|
58%
|
65%
|
|
Mibanco
|
|||||
|
Disbursements through leads (6)
|
68%
|
70%
|
65%
|
69%
|
68%
|
|
Disbursements through alternative channels (7)
|
23%
|
26%
|
23%
|
23%
|
25%
|
|
Relationship managers productivity (8)
|
21.9
|
28.2
|
25.9
|
23.8
|
25.6
|
|
Pacifico
|
|||||
|
Digital Policies (thousands) (9)
|
582.0
|
722.3
|
579.0
|
1111.5
|
1301.3
|
| (1) |
Management figures. Figures for June 2024, March 2025, and June 2025.
|
| (2) |
As a percentage of Credicorpʼs total Risk-Adjusted Revenue.
|
| (3) |
Retail clients that made 70%, or more, of their transactions through digital channels in the last 6 months (including Yape).
|
| (4) |
Monetary Transactions conducted through Mobile Banking, Internet Banking, Yape and Telecredito/Total Monetary Transactions in Retail Banking.
|
| (5) |
Amount transacted through Mobile Banking, Internet Banking, Yape y POS/Total amount transacted through Retail Banking.
|
| (6) |
Disbursements generated through leads/Total disbursements.
|
| (7) |
Disbursements conducted through alternative channels/Total disbursements. Figures differ from previously reported due to a methodological change.
|
| (8) |
Number of loans disbursed/Total relationship managers.
|
| (9) |
Number of insurance policies issued through digital channels.
|
 |
|
| |
Earnings Release 2Q / 2025
|
Analysis of 2Q25 Consolidated Results
|
|
Credicorp’s Strategy Update
|
|
Management KPI's (1)
|
Quarter
|
|
Change %
|
Up to
|
Change %
|
|||
|
2Q24
|
1Q25
|
2Q25
|
QoQ
|
YoY
|
Jun 24
|
Jun 25
|
Jun 25 / Jun 24
|
|
|
Users
|
||||||||
|
Users (millions)
|
15.9
|
18.0
|
18.6
|
3.5%
|
17.3%
|
15.9
|
18.6
|
17.3%
|
|
Monthly Active Users (MAU) (millions) (2)
|
12.3
|
14.3
|
14.9
|
4.2%
|
21.9%
|
12.3
|
14.9
|
21.9%
|
|
Revenue Generating MAU (millions)
|
9.5
|
12.0
|
12.6
|
4.9%
|
32.5%
|
9.5
|
12.6
|
32.5%
|
|
Engagement
|
||||||||
|
# Transactions (millions)
|
1,400.6
|
2,025.4
|
2,384.9
|
17.8%
|
70.3%
|
2,528.3
|
4,410.3
|
74.4%
|
|
# Transactions / MAU
|
40.2
|
52.1
|
54.5
|
4.6%
|
35.6%
|
40.2
|
54.5
|
35.6%
|
|
# Average Functionalities / MAU
|
2.3
|
2.6
|
2.7
|
1.5%
|
14.2%
|
2.3
|
2.7
|
14.2%
|
|
Experience
|
||||||||
|
NPS (3)
|
76
|
77
|
77
|
0.0%
|
60.0%
|
77
|
77
|
-40.0%
|
|
Unit Economics
|
||||||||
|
Monthly Indicators (4)
|
||||||||
|
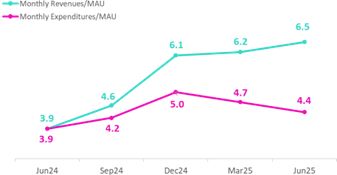
Revenues / MAU (S/)
|
3.9
|
6.2
|
6.5
|
3.8%
|
64.3%
|
3.9
|
6.5
|
64.3%
|
|
Expenses / MAU (S/)
|
-3.9
|
-4.7
|
-4.4
|
-6.9%
|
11.5%
|
-3.9
|
-4.4
|
11.5%
|
|
Quarterly Indicators (5)
|
||||||||
|
Revenues / MAU (S/)
|
3.8
|
5.5
|
6.4
|
15.4%
|
69.4%
|
3.5
|
6.0
|
69.2%
|
|
Expenses / MAU (S/)
|
-3.9
|
-4.2
|
-4.5
|
5.3%
|
15.1%
|
-3.8
|
-4.3
|
12.8%
|
|
Drivers Monetization
|
||||||||
|
Total TPV (S/, billions) (6)
|
62.1
|
91.6
|
103.4
|
12.9%
|
66.3%
|
103.5
|
174.2
|
68.3%
|
|
Total Revenue Generating TPV (S/, billions) (7)
|
4.9
|
8.7
|
10.1
|
16.6%
|
107.6%
|
8.7
|
18.8
|
117.9%
|
|
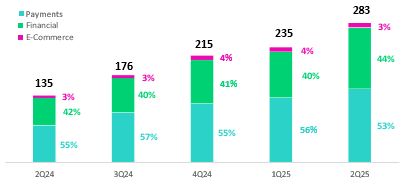
Payments
|
||||||||
|
# Bill Payments transactions (millions)
|
28.6
|
45.0
|
50.1
|
11.4%
|
75.0%
|
52.1
|
95.2
|
82.7%
|
|
Financials
|
||||||||
|
# Loans Disbursements (thousands)
|
751.9
|
3,100.4
|
3,855.1
|
24.3%
|
412.7%
|
1,264.3
|
6,955.6
|
450.1%
|
|
E-Commerce
|
||||||||
|
GMV (S/, millions) (8)
|
75.0
|
124.6
|
129.1
|
3.6%
|
72.1%
|
134.1
|
253.7
|
89.2%
|
| (1) |
Management Figures.
|
| (2) |
Yape users that have made at least one outgoing transaction in the measurement month.
|
| (3) |
Net Promoter Score.
|
| (4) |
Monthly indicators consider the results of the last month of the quarter for the numerator and denominator.
|
| (5) |
Quarterly indicators are calculated using the sum of the three months in the period for numerator accounts, and the average of the denominator—based on last month’s data from both the current and previous quarters."
|
| (6) |
Total Payment Volume.
|
| (7) |
Revenue Generating Total Payment Volume (TPV).
|
| (8) |
Gross Merchant Volume, includes the following functionalities: Yape Promos, Yape Store, Ticketing, Gaming, Delivery, Buses, Insurance, Gas, Brand Solutions and Insurance.
|
|
Financial Results (1)
|
Quarter
|
Change %
|
Up to
|
Change %
|
||||
|
S/ millions
|
2Q24
|
1Q25
|
2Q25
|
QoQ
|
YoY
|
Jun 24
|
Jun 25
|
Jun 25 / Jun 24
|
|
Net Interest Income after Provisions (2)
|
56.2
|
93.0
|
123.9
|
33.2%
|
120.4%
|
106.9
|
216.9
|
103.0%
|
|
Other Income (3)
|
80.0
|
141.6
|
158.5
|
11.9%
|
98.2%
|
139.7
|
300.1
|
114.8%
|
|
Total Income
|
136.2
|
234.6
|
282.4
|
20.4%
|
107.4%
|
246.6
|
517.0
|
109.7%
|
|
Total Operating Expenses
|
-139.5
|
-179.1
|
-196.6
|
9.7%
|
40.9%
|
-268.4
|
-375.7
|
40.0%
|
|
(1)
|
Management figures. Beginning in 1Q25, reclassifications between Operating Expenses and Fee Income have been incorporated, along with new accounting allocations
—primarily related to interest expenses associated with the Deposit Insurance Fund. Figures for prior periods have been restated for comparability and may differ from those previously reported.
|
|
(2)
|
Includes interest income, interest expense and net provisions.
|
|
(3)
|
Includes Other income recorded in BCP and in Yape Market
|
 |
|
| |
Earnings Release 2Q / 2025
|
Analysis of 2Q25 Consolidated Results
|
|
Credicorp’s Strategy Update
|
|
Monetization Drivers
Yape continues to strengthen its monetization strategy, with sustained growth in operational leverage per user. As of 2Q25, the gap between revenue (S/6.5) and expense (S/4.4) per
MAU continues to widen steadily.
|
|
The pace of growth in the Financial business rose across business lines, driven by the balance increase of the loan portfolio. The
number of disbursements continues to rise, which reflects an uptick in the effectiveness of leads. The portfolio composition remained stable, with single installment and multi-installment loans each representing 50% of the
loans’s balance. In June, a new credit line targeting SMEs was launched, offering higher amounts and longer terms. Its impact is expected to materialize over the coming quarters. At the end of 2Q25, Yape reached the 3-million
user mark for clients with at least one loan disbursement, as we move closer to our goal of 5 million for 2026. Almost 30% of Yape’s borrowers accessed their first formal financial system loan through the app, reaffirming its
role as an agent of financial inclusion. Finally, growth in net interest income was bolstered by an uptick in the Floating generated by Yape, which rose on the back of growth in the entry volume.
In the E-Commerce business, the GMV totaled S/129.1 million. This performance was driven by Yape Proms, which maintains solid transactions levels and
is registering improvement in the conversion of visits to sales.
|
 |
|
| |
Earnings Release 2Q / 2025
|
Analysis of 2Q25 Consolidated Results
|
|
Credicorp’s Strategy Update
|
|
o
|
BCP and Yape financially included 100 thousand people in 2Q25, and cumulative growth stands at 6.1 million since 2020. More than 1.9 million clients disbursed loans through Yape
and 190 thousand were financially included through this channel during the quarter.
|
|
o
|
BCP achieved a change in behavior among more than 159 thousand clients this quarter through financial education initiatives, focused on promoting healthy personal financial
practices and preventing over-indebtedness, late payments, overdrawing credit cards, among others.
|
|
o
|
Yape rolled out an in-app version of its financial education material to give users access to its modules. By the end of 2Q25, clients had completed +122 thousand modules.
|
|
o
|
Pacifico reported that as of 2Q25, 2.9 million clients had received inclusive insurance protection1 through channels at BCP, Mibanco and Yape. Pacifico provided
insurance coverage to 391 thousand people by the end of the quarter, highlighting the launch of its new product Salud Yape.
|
|
o
|
Mibanco Peru signed a financing contract for up to US$100 million with IDB Invest and JICA to drive access to credit for micro, small and medium enterprises (MSMEs) in Peru, including those led by
women.
|
|
o
|
The Crediagua product at Mibanco Peru, which provides financing for household drinking water and sewage connections, disbursed 190 million soles to serve more than 12 thousand people in 2Q25.
|
|
o
|
As of May 31, BCP disbursed USD 1,150 million in sustainable financing, including working capital loans for the agricultural sector.
|
|
o
|
BCP, in the framework of the program “Contigo Emprendedor,” served more than 122 thousand MSMEs clients through its Whatsapp accompaniment programs, promoting improvements in
financial management.
|
|
o
|
Pacifico continued to drive training in risk prevention to strengthen resilience through its “ABC de Pacifico”, “Comunidad Segura” and “Protege365” programs, which have educated
more than 74 thousand people thus far this year, including clients, non-clients and employees at companies.
|
|
o
|
We published and presented a study on emissions factors for economic activities in Peru, which we developed with Universidad del Pacifico. This pioneering tool in the region
enables financial institutions to estimate their financed emissions, supporting more informed and responsible climate management of their portfolios.
|
|
o
|
For the second consecutive year, we worked alongside Peru Sostenible2 and Valora Consultores to promote the CFO Program to strengthen sustainability leadership in
finance areas. More than 38 leading companies actively participate in this initiative, which attests to our commitment to addressing the country’s development goals and promoting responsible and sustainability-based business
management practices.
|
|
Indicator
|
Company
|
Unit
|
2024
|
1Q24
|
1Q25
|
|
|
Inclusion
|
||||||
|
People included financially through BCP and Yape – cumulative since 20203
|
BCP Peru and Yape
|
Million
|
5.7
|
4.2
|
6.1
|
|
|
Clients included in inclusive insurance services
|
Pacifico
|
Million
|
2.7
|
N.D.
|
2.9
|
|
|
Finance for the Future
|
||||||
|
Total loan balance for micro and small businesses
|
Mibanco Peru
|
S/ Million
|
11,356
|
11,303
|
11,894
|
|
|
Disbursements of sustainable financings - YTD
|
BCP Peru
|
$ Million
|
+1500
|
796
|
1,150 4
|
|
1
|
Simple and affordable optional insurance products with single or monthly payments of S/40 or less.
|
| 2 |
Perú Sostenible: A network of companies that promotes sustainable development in Peru.
|
|
3
|
Stock of financially included clients through BCP since 2020: (i) New clients with savings accounts or affiliated to Yape. (ii) New clients without debt in
the financial system or BCP products in the last twelve months. (iii) Clients with 3 monthly average transactions in the last three months.
|
|
4
|
Up to May.
|
 |
|
| |
Earnings Release 2Q / 2025
|
Analysis of 2Q25 Consolidated Results
|
| 01 |
Loan Portfolio
|
|
This quarter, total loans in quarter-end balances fell 0.2% QoQ. This contraction was driven by a non-cash accounting adjustment at the Credicorp level to incorporate a revaluation of
BCP Bolivia’s asset balance. If we exclude the impact of this adjustment, loans rose 1.2% QoQ (+2.5% FX neutral). The main dynamics that drove this evolution were (i) an increase in the demand for short-term financing in
Middle Market banking, (ii) growth in disbursements in Mortgage and (iii) a decline in write-offs at Mibanco.
YoY, total loans in quarter-end balances dropped 4.1% (-0.3% excluding the aforementioned accounting effect and +2.6% FX Neutral). This FX Neutral
result was driven mainly by (i) growth in disbursements in Mortgage, (ii) an uptick in disbursements mainly through Yape in Consumer and (iii) an upswing in disbursements in the first half of the year at Mibanco.
|
| 1.1. |
Loans
|
|
Total Loans
(S/ Millions)
|
Jun 24
|
As of
Mar 25
|
Jun 25
|
Volume change
QoQ YoY
|
% change
QoQ YoY
|
% Part. in total
Jun 24 Mar 25
|
loans
Jun 25
|
|||
|
BCP Stand-alone
|
121,056
|
119,379
|
120,999
|
1,620
|
-57
|
1.4%
|
0.0%
|
82.4%
|
84.5%
|
85.8%
|
|
Mibanco
|
12,706
|
12,525
|
12,785
|
260
|
80
|
2.1%
|
0.6%
|
8.6%
|
8.9%
|
9.1%
|
|
Mibanco Colombia
|
1,757
|
1,904
|
1,976
|
72
|
219
|
3.8%
|
12.5%
|
1.2%
|
1.3%
|
1.4%
|
|
Bolivia
|
10,229
|
6,294
|
4,189
|
-2,105
|
-6,040
|
-33.4%
|
-59.0%
|
7.0%
|
4.5%
|
3.0%
|
|
ASB Bank Corp.
|
1,953
|
1,777
|
1,559
|
-218
|
-394
|
-12.3%
|
-20.2%
|
1.3%
|
1.3%
|
1.1%
|
|
Others (1)
|
-754
|
-682
|
-546
|
135
|
207
|
-19.9%
|
-27.5%
|
-0.5%
|
-0.5%
|
-0.4%
|
|
Total Loans BAP
|
146,947
|
141,197
|
140,962
|
-235
|
-5,985
|
-0.2%
|
-4.1%
|
100.0%
|
100.0%
|
100.0%
|
 |
|
| |
Earnings Release 2Q / 2025
|
Analysis of 2Q25 Consolidated Results
|
|
01. Loan Portfolio
|
|
Total Loans
(S/ Millions)
|
As of
|
Volume change
|
% change
|
% Part. in total
|
loans | |||||
|
Jun 24
|
Mar 25
|
Jun 25
|
QoQ
|
YoY
|
QoQ
|
YoY
|
Jun 24
|
Mar 25
|
Jun 25
|
|
|
BCP Stand-alone
|
121,056
|
119,379
|
120,999
|
1,620
|
-57
|
1.4%
|
0.0%
|
82.4%
|
84.5%
|
85.8%
|
|
Wholesale Banking
|
54,320
|
52,602
|
53,025
|
423
|
-1,294
|
0.8%
|
-2.4%
|
37.0%
|
37.3%
|
37.6%
|
|
Corporate
|
32,010
|
31,369
|
30,496
|
-873
|
-1,514
|
-2.8%
|
-4.7%
|
21.8%
|
22.2%
|
21.6%
|
|
Middle - Market
|
22,310
|
21,234
|
22,529
|
1,296
|
220
|
6.1%
|
1.0%
|
15.2%
|
15.0%
|
16.0%
|
|
Retail Banking
|
64,827
|
64,875
|
66,176
|
1,301
|
1,349
|
2.0%
|
2.1%
|
44.1%
|
45.9%
|
46.9%
|
|
SME - Business
|
7,936
|
7,711
|
7,692
|
-20
|
-245
|
-0.3%
|
-3.1%
|
5.4%
|
5.5%
|
5.5%
|
|
SME - Pyme
|
16,369
|
15,922
|
16,091
|
169
|
-278
|
1.1%
|
-1.7%
|
11.1%
|
11.3%
|
11.4%
|
|
Mortgage
|
21,554
|
22,115
|
22,824
|
710
|
1,270
|
3.2%
|
5.9%
|
14.7%
|
15.7%
|
16.2%
|
|
Consumer
|
12,900
|
13,173
|
13,446
|
273
|
545
|
2.1%
|
4.2%
|
8.8%
|
9.3%
|
9.5%
|
|
Credit Card
|
6,068
|
5,955
|
6,124
|
169
|
57
|
2.8%
|
0.9%
|
4.1%
|
4.2%
|
4.3%
|
|
Others (1)
|
1,909
|
1,901
|
1,797
|
-103
|
-112
|
-5.4%
|
-5.8%
|
1.3%
|
1.3%
|
1.3%
|
|
Total Loans BAP
|
146,947
|
141,197
|
140,962
|
-235
|
-5,985
|
-0.2%
|
-4.1%
|
100.0%
|
100.0%
|
100.0%
|
|
|
|
Mortgage, where loan demand was boosted by improvements in the economic environment and lower interest
rates.
|
|
|
Consumer, due to an upswing in disbursements, mainly through BCP and Yape.
|
|
|
Middle Market Banking, which registered an uptick in demand for working capital loans after the first
fishing campaign began in April.
|
|
|
Corporate Banking, due to growth in amortizations of short-term loans.
|

|
|
Mortgage, due to the same dynamics in play QoQ.
|
|
|
Consumer, spurredmainly by growth
in disbursements through Yape.
|
|
|
Middle Market Banking (+5.8%), due to an uptick in demand for short-term financing.
|
|
|
 |
|
| |
Earnings Release 2Q / 2025
|
Analysis of 2Q25 Consolidated Results
|
|
01. Loan Portfolio
|
|
Total Loans
(S/ Millions) |
Local Currency (LC) - S/ millions
|
% change
|
Foreign Currency (FC) - S/ millions
|
% change
|
% part. by currency
|
|||||||
|
Total
|
Total |
Jun 25
|
||||||||||
|
Jun 24
|
Mar 25
|
Jun 25
|
QoQ
|
YoY
|
Jun 24
|
Mar 25
|
Jun 25
|
QoQ
|
YoY
|
MN
|
ME
|
|
|
BCP Stand-alone
|
80,749
|
79,702
|
81,217
|
1.9%
|
0.6%
|
40,307
|
39,677
|
39,782
|
0.3%
|
-1.3%
|
67.1%
|
32.9%
|
|
Wholesale Banking
|
23,538
|
22,209
|
22,475
|
1.2%
|
-4.5%
|
30,781
|
30,407
|
30,551
|
0.5%
|
-0.7%
|
42.4%
|
57.6%
|
|
Corporate
|
14,475
|
13,049
|
13,194
|
1.1%
|
-8.8%
|
17,535
|
18,334
|
17,302
|
-5.6%
|
-1.3%
|
43.3%
|
56.7%
|
|
Middle - Market
|
9,064
|
9,160
|
9,281
|
1.3%
|
2.4%
|
13,246
|
12,073
|
13,249
|
9.7%
|
0.0%
|
41.2%
|
58.8%
|
|
Retail Banking
|
56,733
|
56,911
|
58,176
|
2.2%
|
2.5%
|
8,115
|
7,911
|
7,953
|
0.5%
|
-2.0%
|
87.9%
|
12.1%
|
|
SME - Business
|
4,683
|
4,525
|
4,471
|
-1.2%
|
-4.5%
|
3,205
|
3,074
|
3,122
|
1.6%
|
-2.6%
|
58.1%
|
41.9%
|
|
SME - Pyme
|
16,225
|
15,791
|
15,949
|
1.0%
|
-1.7%
|
144
|
131
|
142
|
8.3%
|
-1.6%
|
99.1%
|
0.9%
|
|
Mortgage
|
19,574
|
20,325
|
21,130
|
4.0%
|
7.9%
|
1,981
|
1,789
|
1,694
|
-5.3%
|
-14.5%
|
92.6%
|
7.4%
|
|
Consumer
|
11,209
|
11,329
|
11,517
|
1.7%
|
2.8%
|
1,760
|
1,902
|
1,979
|
4.1%
|
12.5%
|
85.7%
|
14.3%
|
|
Credit Card
|
5,043
|
4,941
|
5,109
|
3.4%
|
1.3%
|
1,025
|
1,014
|
1,015
|
0.1%
|
-0.9%
|
83.4%
|
16.6%
|
|
Others (1)
|
478
|
582
|
567
|
-2.7%
|
18.6%
|
1,411
|
1,359
|
1,278
|
-5.9%
|
-9.4%
|
31.5%
|
68.5%
|
|
Mibanco
|
12,691
|
12,515
|
12,776
|
2.1%
|
0.7%
|
14
|
10
|
9
|
-11.3%
|
-35.0%
|
99.9%
|
0.1%
|
|
Mibanco Colombia
|
-
|
-
|
-
|
-
|
-
|
1,757
|
1,904
|
1,976
|
3.8%
|
12.5%
|
-
|
100%
|
|
Bolivia
|
-
|
-
|
-
|
-
|
-
|
10,229
|
6,294
|
4,189
|
-33.4%
|
-59.0%
|
-
|
100%
|
|
ASB Bank Corp.
|
-
|
-
|
-
|
-
|
-
|
1,953
|
1,777
|
1,559
|
-12.3%
|
-20.2%
|
-
|
100%
|
|
Others (2)
|
-756
|
-573
|
-883
|
54.2%
|
16.8%
|
2
|
-109
|
336
|
-408.1%
|
n.a.
|
-
|
-
|
|
Total Loans BAP
|
92,685
|
91,644
|
93,110
|
1.6%
|
0.5%
|
54,261
|
49,553
|
47,852
|
-3.4%
|
-11.8%
|
66.1%
|
33.9%
|
|
For consolidation purposes. Loans generated in Foreign Currency (FC) are converted into Local Currency (LC).
|
|
| (1) |
Includes other assets and accruals.
|
|
(2)
|
Includes eliminations for intercompany transactions |
 |
|
| |
Earnings Release 2Q / 2025
|
Analysis of 2Q25 Consolidated Results
|
| 02 |
Deposits
|
|
This quarter, total Deposits fell 1.8% QoQ. This contraction was driven by a
non-cash accounting adjustment to reflect a revaluation of BCP Bolivia’s balance sheet. If we exclude the impact of this adjustment total deposits fell slightly QoQ (+ 1% FX neutral), driven primarily
by a 7.7% drop in the balance for Demand Deposits due a seasonal effect related to income tax payments. This decline was partially offset by an 8.4% increase in the balance for Time Deposits, which
was spurred by an uptick in onboarding of wholesale clients. YoY, deposits rose 6.2% (+10.2% FX neutral), driven by Savings, which rose on the back of growth in transactional offerings that stimulate
deposit captures in a high-liquidity environment, and by Time Deposits, which increased via the same dynamics seen QoQ.
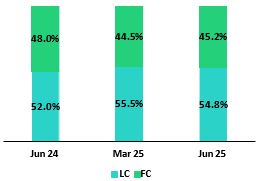
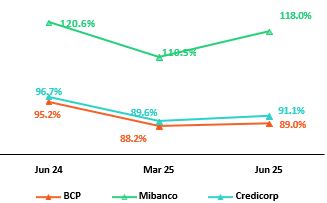
At the end of 2Q25, 69.2% of total deposits were low-cost (Demand + Savings).
Credicorp continues to lead the low-cost deposit market with a 40.3% share at the end of June.
|
|
Deposits
|
As of
|
% change
|
Currency
|
||||
|
S/000
|
Jun 24
|
Mar 25
|
Jun 25
|
QoQ
|
YoY
|
LC
|
FC
|
|
Demand deposits
|
50,657,031
|
53,992,480
|
49,237,039
|
-8.8%
|
-2.8%
|
47.2%
|
52.8%
|
|
Saving deposits
|
53,015,745
|
59,969,559
|
59,086,275
|
-1.5%
|
11.5%
|
61.3%
|
38.7%
|
|
Time deposits
|
43,504,883
|
39,779,546
|
42,361,180
|
6.5%
|
-2.6%
|
53.3%
|
46.7%
|
|
Severance indemnity deposits
|
3,358,408
|
2,921,196
|
3,268,583
|
11.9%
|
-2.7%
|
77.0%
|
23.0%
|
|
Interest payable
|
1,435,917
|
956,301
|
770,257
|
-19.5%
|
-46.4%
|
36.2%
|
63.8%
|
|
Low-cost deposits (1)
|
103,672,776
|
113,962,039
|
108,323,314
|
-4.9%
|
4.5%
|
54.9%
|
45.1%
|
|
Total Deposits
|
151,971,984
|
157,619,082
|
154,723,334
|
-1.8%
|
1.8%
|
54.8%
|
45.2%
|
|
|
A 7.7% reduction (-6.0% FX neutral) in the Demand Deposit balance; this evolution was mainly driven by a drop
in wholesale deposit volumes in LC, which reflects a seasonal impact associated with income tax payments, and secondarily, by a base effect given a temporary large deposit related to a Wholesale
client by last-quarter-end.
|
|
|
A 8.4% growth in (+10.2% FX neutral) in the balance for Time Deposits, which rose on the back of strategic
growth in deposit captures from wholesale clients at BCP Stand-alone.
|
|
|
A 14.1% increase (+17.7% FX neutral) in the balance for Savings Accounts, which was fueled mainly by BCP Stand-alone via Individuals. Growth was driven primarily by an uptick in LC deposits, which have been positively impacted by a differentiated transactional
offering that allows us to capture deposits in a high-liquidity environment, and secondarily by growth in the FC deposit balance, which was impacted by a drop in the exchange rate, which led clients
to dollarize their funds.
|
|
|
Growth of 3.8% (+7.9% FX neutral) in the balance for Time Deposits, which was fueled by an increase in volume at
BCP Stand-alone. This growth was primarily spurred by Wholesale Banking via the same dynamics seen QoQ.
|
 |
|
| |
Earnings Release 2Q / 2025
|
Analysis of 2Q25 Consolidated Results
|
|
02. Deposits
|
|
|
An increase of 1.2% (+5.5% neutral exchange rate) in the balance for Demand Deposits, which was mainly
driven by an uptick in the FC balance at BCP Stand-alone via wholesale deposits. This effect was partially offset by a decrease in the LC balance, which was
driven by the same dynamics in play QoQ.
|
|
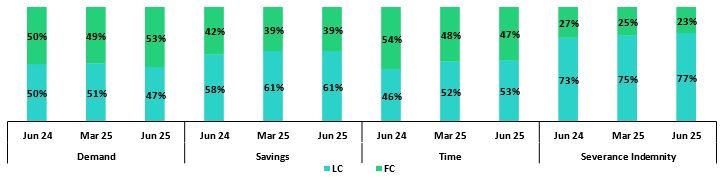
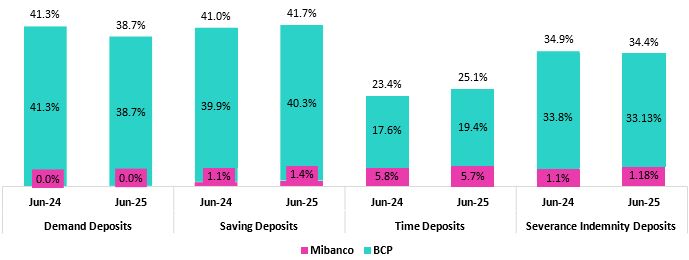
Deposits by Currency and Type
(measured at quarter-end balance)
 |
|
|
 |
|
| |
Earnings Release 2Q / 2025
|
Analysis of 2Q25 Consolidated Results
|
|
02. Deposits
|
 |
|
| |
Earnings Release 2Q / 2025
|
Analysis of 2Q25 Consolidated Results
|
| 03 |
Interest-earning Assets (IEA) and Funding
|
|
Excluding the impact on Credicorp’s balance sheet resulting from an accounting adjustment at BCP Bolivia, intended to reflect the currency
devaluation, the evolution of IEA and Funding presented the following dynamics:
QoQ, IEA dropped 1.1% following a contraction in the investment balance, which was driven mainly by a reduction in the portfolio of BCRP
certificates of deposits. Cash and due from banks also declined, following payment of an expired bond at BCP. Funding, in turn, dropped 0.8%, primarily on the back of a reduction in the balance for
Bonds and, secondarily, due to a drop in BCRP instruments after less liquidity was taken via this mechanism.
YoY, IEA grew 4.1%, fueled by growth in the balance of Cash and due from banks, which peaked in 4Q24 due to high liquidity last year. Finally, funding increased
3.2%, fueled by growth in Deposits, which was led by low-cost deposits. Growth in the latter was spurred by economic recovery and a consequent increase in transactional activity.
|
| 3.1. |
IEA
|
|
Interest earning assets
|
As of
|
% change
|
|||
|
S/000
|
Jun 24
|
Mar 25
|
Jun 25
|
QoQ
|
YoY
|
|
Cash and due from banks
|
27,157,901
|
37,521,839
|
34,206,000
|
-8.8%
|
26.0%
|
|
Total investments
|
52,426,146
|
55,604,610
|
51,603,447
|
-7.2%
|
-1.6%
|
|
Cash collateral, reverse repurchase agreements and securities borrowing
|
1,777,491
|
1,835,893
|
4,593,501
|
150.2%
|
158.4%
|
|
Loans
|
146,946,546
|
141,196,646
|
140,961,978
|
-0.2%
|
-4.1%
|
|
Total interest earning assets
|
228,308,084
|
236,158,988
|
231,364,926
|
-2.0%
|
1.3%
|
 |
|
| |
Earnings Release 2Q / 2025
|
Analysis of 2Q25 Consolidated Results
|
|
03. Interest-earning Assets (IEA) and Funding
|
| 3.2. |
Funding
|
|
Funding
|
As of
|
% change
|
|||
|
S/ 000
|
Jun 24
|
Mar 25
|
Jun 25
|
QoQ
|
YoY
|
|
Deposits and obligations
|
151,971,984
|
157,619,082
|
154,723,334
|
-1.8%
|
1.8%
|
|
Due to banks and correspondents
|
12,620,346
|
10,899,579
|
11,152,813
|
2.3%
|
-11.6%
|
|
BCRP instruments
|
5,542,892
|
7,064,476
|
5,096,459
|
-27.9%
|
-8.1%
|
|
Repurchase agreements with clients and third parties
|
2,146,797
|
3,094,138
|
6,168,934
|
99.4%
|
187.4%
|
|
Bonds and notes issued
|
17,953,508
|
14,391,733
|
12,112,403
|
-15.8%
|
-32.5%
|
|
Total funding
|
190,235,527
|
193,069,008
|
189,253,943
|
-2.0%
|
-0.5%
|
 |
|
| |
Earnings Release 2Q / 2025
|
Analysis of 2Q25 Consolidated Results
|
| 04 |
Net Interest income (NII)
|
|
In 2Q25, Net Interest Income (NII) rose 1.2% QoQ mainly due to a drop
in interest on deposits, amid a downward trend in market interest rates.
YoY, NII ticked up 4.2%, driven mainly by a reduction in Interest and similar
expenses. This decrease was fueled by a drop in expenses for deposits, which were impacted primarily by declining interest rates and secondarily by an uptick in low-cost deposits’ share of the
funding structure.
NIM rose 20 bps QoQ to stand at 6.42%, driven mainly by a shift in the IEA mix
toward higher-yielding assets. It is important to note that risk-adjusted NIM continued to trend upward and hit a new high1 of 5.44%.
|
|
Net interest income
|
Quarter |
% change
|
Up to
|
% Change
|
||||
|
S/000
|
2Q24
|
1Q25
|
2Q25
|
QoQ
|
YoY
|
Jun 24
|
Jun 25
|
Jun 25 / Jun 24
|
|
Interest and Similar Income
|
4,935,238
|
4,894,790
|
4,922,292
|
0.6%
|
-0.3%
|
9,861,164
|
9,817,082
|
-0.4%
|
|
Interest and Similar Expenses
|
(1,466,774)
|
(1,322,778)
|
(1,306,921)
|
-1.2%
|
-10.9%
|
(2,966,577)
|
(2,629,699)
|
-11.4%
|
|
Interest Expense (excluding Net Insurance Financial Expenses)
|
(1,342,088)
|
(1,187,156)
|
(1,167,866)
|
-1.6%
|
-13.0%
|
(2,719,887)
|
(2,355,023)
|
-13.4%
|
|
Net Insurance Financial Expenses
|
(124,686)
|
(135,622)
|
(139,055)
|
2.5%
|
11.5%
|
(246,690)
|
(274,676)
|
11.3%
|
|
Net Interest, similar income and expenses
|
3,468,464
|
3,572,012
|
3,615,371
|
1.2%
|
4.2%
|
6,894,587
|
7,187,383
|
4.2%
|
|
Balances
|
||||||||
|
Average Interest Earning Assets (IEA)
|
227,161,179
|
238,435,117
|
233,761,957
|
-2.0%
|
2.9%
|
226,444,444
|
236,038,086
|
4.2%
|
|
Average Funding
|
187,904,862
|
195,997,306
|
191,161,476
|
-2.5%
|
1.7%
|
187,491,207
|
194,089,774
|
3.5%
|
|
Yields
|
||||||||
|
Yield on IEAs
|
8.69%
|
8.21%
|
8.42%
|
21 bps
|
-27 bps
|
8.71%
|
8.32%
|
-39 bps
|
|
Cost of Funds(1)
|
2.86%
|
2.42%
|
2.44%
|
2 bps
|
-42 bps
|
2.90%
|
2.43%
|
-47 bps
|
|
Net Interest Margin (NIM)(1)
|
6.33%
|
6.22%
|
6.42%
|
20 bps
|
9 bps
|
6.31%
|
6.32%
|
1 bps
|
|
Risk-Adjusted Net Interest Margin(1)
|
4.40%
|
5.24%
|
5.44%
|
20 bps
|
104 bps
|
4.62%
|
5.34%
|
72 bps
|
|
Peru's Reference Rate
|
5.75%
|
4.75%
|
4.50%
|
-25 bps
|
-125 bps
|
5.75%
|
4.50%
|
-125 bps
|
|
FED funds rate
|
5.50%
|
4.50%
|
4.50%
|
0 bps
|
-100 bps
|
5.50%
|
4.50%
|
-100 bps
|
|
1
|
Since the implementation of IFRS 9 in 2018.
|
 |
|
| |
Earnings Release 2Q / 2025
|
Analysis of 2Q25 Consolidated Results
|
|
04. Net Interest income (NII)
|
|
Interest Income / IEA
|
2Q24 |
|
1Q25
|
|
2Q25 |
|
Jun 24
|
|
Jun 25
|
|||||||
|
S/ millions
|
Average
|
|
|
Average
|
|
|
Average
|
|
|
Average
|
Average
|
|||||
|
Balance
|
Income | Yields |
Balance
|
Income | Yields |
Balance
|
Income | Yields |
Balance
|
Income
|
Yields
|
Balance
|
Income
|
Yields
|
||
|
Total (LC + FC)
|
||||||||||||||||
|
Cash and equivalents
|
29,146
|
320
|
4.4%
|
38,821
|
345
|
3.6%
|
35,864
|
342
|
3.8%
|
26,568
|
654
|
4.9%
|
37,162
|
687
|
3.7%
|
|
|
Other IEA
|
1,652
|
26
|
6.3%
|
1,434
|
19
|
5.3%
|
3,215
|
69
|
8.6%
|
1,594
|
54
|
6.8%
|
2,813
|
89
|
6.3%
|
|
|
Investments
|
52,491
|
668
|
5.1%
|
54,716
|
683
|
5.0%
|
53,604
|
670
|
5.0%
|
52,320
|
1,362
|
5.2%
|
52,715
|
1,353
|
5.1%
|
|
|
Loans
|
143,873
|
3,922
|
10.9%
|
143,465
|
3,848
|
10.7%
|
141,079
|
3,841
|
10.9%
|
145,961
|
7,790
|
10.7%
|
143,348
|
7,688
|
10.7%
|
|
|
Total IEA
|
227,162
|
4,936
|
8.7%
|
238,436
|
4,895
|
8.2%
|
233,762
|
4,922
|
8.4%
|
226,443
|
9,860
|
8.7%
|
236,038
|
9,817
|
8.3%
|
|
|
IEA (LC)
|
57.4%
|
69.4%
|
10.5%
|
55.6%
|
70.5%
|
10.4%
|
56.5%
|
71.1%
|
10.6%
|
57.2%
|
69.6%
|
10.6%
|
55.6%
|
70.8%
|
10.6%
|
|
|
IEA (FC)
|
42.6%
|
30.6%
|
6.2%
|
44.4%
|
29.5%
|
5.5%
|
43.5%
|
28.9%
|
5.6%
|
42.8%
|
30.4%
|
6.2%
|
44.4%
|
29.2%
|
5.5%
|
|
Interest Income / Funding
|
2Q24 | 1Q25 |
|
2Q25 |
|
Jun 24
|
|
Jun 25
|
||||||||
|
S/ millions
|
Average
|
|
|
Average
|
|
|
Average
|
|
|
Average
|
Average
|
|||||
|
Balance
|
Expense | Yields |
Balance
|
Expense |
Yields |
Balance
|
Expense |
Yields |
Balance
|
Expense
|
Yields
|
Balance
|
Expense
|
Yields
|
||
|
Total (LC + FC)
|
||||||||||||||||
|
Deposits
|
149,914
|
738
|
2.0%
|
159,731
|
620
|
1.6%
|
156,171
|
541
|
1.4%
|
149,839
|
1,518
|
2.0%
|
158,283
|
1,160
|
1.5%
|
|
|
BCRP + Due to Banks
|
17,851
|
268
|
6.0%
|
17,683
|
266
|
6.0%
|
17,107
|
265
|
6.2%
|
18,952
|
532
|
5.6%
|
16,825
|
532
|
6.3%
|
|
|
Bonds and Notes
|
17,747
|
200
|
4.5%
|
15,830
|
168
|
4.2%
|
13,252
|
193
|
5.8%
|
16,274
|
398
|
4.9%
|
14,690
|
362
|
4.9%
|
|
|
Others
|
2,392
|
261
|
43.6%
|
2,754
|
269
|
39.1%
|
4,632
|
307
|
26.5%
|
2,427
|
519
|
42.8%
|
4,291
|
576
|
26.8%
|
|
|
Total Funding
|
187,904
|
1,467
|
3.1%
|
195,998
|
1,323
|
2.7%
|
191,162
|
1,306
|
2.7%
|
187,492
|
2,967
|
3.2%
|
194,089
|
2,630
|
2.7%
|
|
|
Funding (LC)
|
49.5%
|
51.7%
|
3.3%
|
51.7%
|
53.4%
|
2.8%
|
52.4%
|
51.9%
|
2.7%
|
49.7%
|
51.8%
|
3.3%
|
51.1%
|
52.7%
|
2.8%
|
|
|
Funding (FC)
|
50.5%
|
48.3%
|
3.0%
|
48.3%
|
46.6%
|
2.6%
|
47.6%
|
48.1%
|
2.8%
|
50.3%
|
48.2%
|
3.0%
|
48.9%
|
47.3%
|
2.6%
|
|
|
NIM(1)
|
227,162
|
3,469
|
6.1%
|
238,436
|
3,572
|
6.0%
|
233,762
|
3,616
|
6.2%
|
226,443
|
6,893
|
6.1%
|
236,038
|
7,187
|
6.1%
|
|
|
NIM (LC)
|
57.4%
|
76.9%
|
8.2%
|
55.6%
|
76.8%
|
8.3%
|
56.5%
|
78.0%
|
8.5%
|
57.2%
|
77.3%
|
8.2%
|
55.6%
|
77.4%
|
8.5%
|
|
|
NIM (FC)
|
42.6%
|
23.1%
|
3.3%
|
44.4%
|
23.2%
|
3.1%
|
43.5%
|
22.0%
|
3.1%
|
42.8%
|
22.7%
|
3.2%
|
44.4%
|
22.6%
|
3.1%
|
|
(1)
|
Unlike the NIM figure calculated according to the formula in Appendix 12.8, the NIM presented in this table includes “Financial Expense associated with the
insurance and reinsurance activity, net”.
|
 |
|
| |
Earnings Release 2Q / 2025
|
Analysis of 2Q25 Consolidated Results
|
|
04. Net Interest income (NII)
|
 |
|
| |
Earnings Release 2Q / 2025
|
Analysis of 2Q25 Consolidated Results
|
| 05 |
Portfolio Quality and Provisions
|
|
Portfolio quality ratios have reported substantial and continuous
improvements over the last year, driven by strengthened risk management measures and supported by improvements in payment performance and in the Peruvian economy.
QoQ, the drop in NPLs at BCP Stand-alone was fueled primarily by debt payments in Wholesale. At
Mibanco, the reduction in NPLs was driven by a decrease in overdue loans. In this context, the NPL ratio dropped 14 bps and 102 bps QoQ and YoY respectively to stand at 5.0% at quarter-end.
QoQ, provisions dropped, fueled by BCP Stand-Alone and mainly through (i) an improvement in
payment performance in Wholesale Banking, and secondarily (ii) through risk model calibrations in Individuals. This evolution was partially offset by growth in provisions at Mibanco, which
reported a shift in the portfolio mix. In this context, the cost of risk remained stable QoQ but fell 141 bps YoY to stand at 1.6% for 2Q25.
|
|
5.1
|
Portfolio Quality
|
|
Loan Portfolio quality and Delinquency ratios
|
As of
|
% change
|
|||
|
S/000
|
2Q24
|
1Q25
|
2Q25
|
QoQ
|
YoY
|
|
Total loans (Quarter-end balance)
|
146,946,546
|
141,196,646
|
140,961,978
|
-0.2%
|
-4.1%
|
|
Write-offs
|
994,556
|
716,585
|
581,373
|
-18.9%
|
-41.5%
|
|
Internal overdue loans (IOLs)
|
6,230,761
|
5,206,395
|
5,044,212
|
-3.1%
|
-19.0%
|
|
Internal overdue loans over 90-days
|
4,760,837
|
4,232,843
|
4,171,379
|
-1.5%
|
-12.4%
|
|
Refinanced loans
|
2,555,135
|
2,001,282
|
1,947,709
|
-2.7%
|
-23.8%
|
|
Non-performing loans (NPLs)
|
8,785,896
|
7,207,677
|
6,991,921
|
-3.0%
|
-20.4%
|
|
IOL ratio
|
4.2%
|
3.7%
|
3.6%
|
-11 bps
|
-66 bps
|
|
IOL over 90-days ratio
|
3.2%
|
3.0%
|
3.0%
|
-4 bps
|
-28 bps
|
|
NPL ratio
|
6.0%
|
5.1%
|
5.0%
|
-14 bps
|
-102 bps
|
 |
|
|
|
|
|
| |
| |
Earnings Release 2Q / 2025
|
Analysis of 2Q25 Consolidated Results
|
|
05. Portfolio Quality and Provisions
|
|
NPL Ratio for Total Loans
|
|
|
|
•
|
Mibanco, where the NPL ratio fell 32 bps, driven mainly by a drop in NPL loan volumes and secondarily by loan growth.
|
|
NPL Ratio for Total Loans at BCP (1)
|
|
|
|
|
•
|
Mibanco, where the NPL ratio decreased 202 bps, driven mainly by a reduction in NPL volumes and secondarily by loan growth.
|
 |
|
|
|
|
|
| |
| |
Earnings Release 2Q / 2025
|
Analysis of 2Q25 Consolidated Results
|
|
05. Portfolio Quality and Provisions
|
|
5.2
|
Provisions and Cost of Risk of the Total Portfolio
|
|
Loan Portfolio Provisions
|
Quarter
|
% change
|
Up to
|
% change
|
||||
|
S/000
|
2Q24
|
1Q25
|
2Q25
|
QoQ
|
YoY
|
Jun 24
|
Jun 25
|
Jun 25 / Jun 24
|
|
Gross provision for credit losses on loan portfolio
|
(1,193,548)
|
(695,733)
|
(683,965)
|
-1.7%
|
-42.7%
|
(2,103,737)
|
(1,379,698)
|
-34.4%
|
|
Recoveries of written-off loans
|
100,177
|
113,840
|
108,806
|
-4.4%
|
8.6%
|
195,667
|
222,646
|
13.8%
|
|
Provision for credit losses on loan portfolio, net of recoveries
|
(1,093,371)
|
(581,893)
|
(575,159)
|
-1.2%
|
-47.4%
|
(1,908,070)
|
(1,157,052)
|
-39.4%
|
|
Cost of risk (1)
|
3.0%
|
1.6%
|
1.6%
|
1 bps
|
-141 bps
|
2.6%
|
1.6%
|
-100 bps
|
|
|
|
Cost of Risk by Subsidiary (1)
|
|
|
YoY, provisions dropped 47.4%, driven by BCP Stand-alone and Mibanco, which reported improvements in payment performance in a context of economic recovery. At BCP Stand-alone, the
decrease in provisions was fueled by the Individuals and SME-Pyme segments, which registered an increase in
lower-risk vintages’ share of total loans. This evolution was partially offset by growth in provisions in Wholesale, which registered an increased in its
balance due to a drop in repayments this quarter. At Mibanco, the reduction was fueled by an improvement in underlying risk as lower-risk vintages gained
traction and currently represent 70% of the portfolio. In this context, the CofR at Credicorp dropped 141 bps YoY to stand at 1.6%.
On a Full-Year basis, provisions fell 39.4%, driven by BCP
Stand-alone and Mibanco and on the tails of the same dynamics seen YoY. The cost of risk at Credicorp fell 100 bps to stand at 1.6%.
|
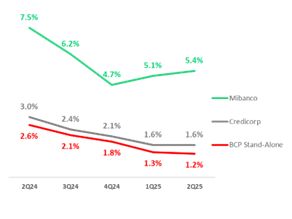 |
|
QoQ Cost of Risk Evolution
|
|
YoY Cost of Risk Evolution
|
|
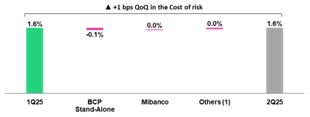 (1) Others include BCP Bolivia, Mibanco Colombia, ASB and eliminations.
|
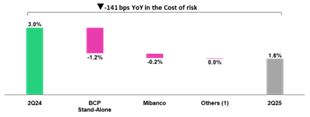 (1) Others include BCP Bolivia, Mibanco Colombia, ASB and eliminations.
|
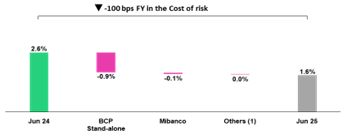
 |
|
|
|
|
|
| |
| |
Earnings Release 2Q / 2025
|
Analysis of 2Q25 Consolidated Results
|
|
05. Portfolio Quality and Provisions
|
|
Loan Portfolio Quality and Delinquency Ratios
|
As of
|
% change
|
|||
|
S/000
|
2Q24
|
1Q25
|
2Q25
|
QoQ
|
YoY
|
|
Total loans (Quarter-end balance)
|
146,946,546
|
141,196,646
|
140,961,978
|
-0.2%
|
-4.1%
|
|
Allowance for loan losses
|
8,350,024
|
7,742,792
|
7,658,595
|
-1.1%
|
-8.3%
|
|
Non-performing loans (NPLs)
|
8,785,896
|
7,207,677
|
6,991,921
|
-3.0%
|
-20.4%
|
|
Allowance for loan losses over Total loans
|
5.7%
|
5.5%
|
5.4%
|
-5 bps
|
-25 bps
|
|
Coverage ratio of NPLs
|
95.0%
|
107.4%
|
109.5%
|
211 bps
|
1449 bps
|
|
Allowance for loan losses
(in S/ millions)
|
|
|
|
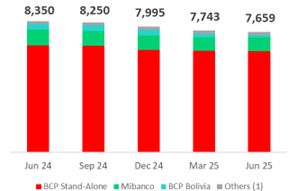 |
QoQ, Allowances for Loan Losses dropped 1.1%, driven mainly by BCP Bolivia and
secondarily by Mortgage at BCP Stand-alone.
YoY, Allowances for Loan Losses dropped 8.3%, fueled mainly by SME-Pyme
at BCP Stand-alone and secondarily by BCP Bolivia.
|
||
|
(1) Others include Mibanco Colombia, ASB and eliminations.
|
|||
|
NPL Coverage Ratio
|
|||
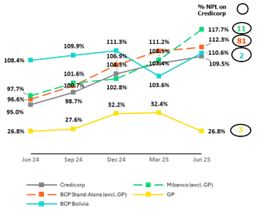 |
The total NPL Coverage ratio at Credicorp stood at 109.5% at the end of 2Q25. If we exclude NPL volumes from
the Government Loans Program (GP), the ratio stands at 112.5%.
QoQ
The total NPL Coverage ratio at Credicorp increased 211 bps, fueled by the evolution at BCP Stand-alone and Mibanco.
Next, we will analyze this evolution by isolating the impact of NPLs from the Government Loans Program, which are backed by ample guarantees that are
being honored satisfactorily.
|
||
 |
|
|
|
|
|
| |
| |
Earnings Release 2Q / 2025
|
Analysis of 2Q25 Consolidated Results
|
|
06
|
Other Income
|
|
|
QoQ, Other Income dropped 0.8%. Other Core Income increased 4.8%, reporting record highs that topped S/1.4 billion, mainly
on the back of strong performance at BCP Stand-alone. Other Non-Core Income posted a relevant gain of S/106 million, related to the exchange of sovereign bonds at BCP Stand-alone.
YoY, Other Income rose 5.4%. Other Core Income expanded 8.1%, driven by growth in fee income from Yape
and transactional products at BCP Stand-alone. Other Non-Core income contracted 6.4%, which was attributable to significant income at BCP Stand-alone and Pacifico in 2Q24.
YTD, Other Income rose 12.9%. Other Core Income increased 11.4%, driven primarily by twofold growth at
Yape and high single- digit expansion in core transactional fees and FX gains at BCP Stand-alone. Other Non-Core Income increased 19.6% mainly due to the consolidation of Banmedica and the exchange
of sovereign bonds.
|
|
|
6.
|
Other Income1
|
|
Other Income (1)
|
Quarter
|
% Change
|
Up to
|
% change
|
||||
|
(S/ 000)
|
2Q24
|
1Q25
|
2Q25
|
QoQ
|
YoY
|
Jun 24
|
Jun 25
|
Jun 25 / Jun 24
|
|
Other Core Income
|
1,296,577
|
1,337,838
|
1,401,569
|
4.8%
|
8.1%
|
2,458,512
|
2,739,407
|
11.4%
|
|
Other Non-Core Income
|
294,753
|
352,378
|
275,804
|
-21.7%
|
-6.4%
|
525,377
|
628,182
|
19.6%
|
|
Total Other Income
|
1,591,330
|
1,690,216
|
1,677,373
|
-0.8%
|
5.4%
|
2,983,889
|
3,367,589
|
12.9%
|
|
6.1.
|
Other Core Income1
|
|
Other Core Income (1)
|
Quarter
|
% Change
|
Up to
|
% change
|
||||
|
(S/ 000)
|
2Q24
|
1Q25
|
2Q25
|
QoQ
|
YoY
|
Jun 24
|
Jun 25
|
Jun 25 / Jun 24
|
|
Fee Income
|
947,228
|
994,024
|
1,024,553
|
3.1%
|
8.2%
|
1,803,793
|
2,018,577
|
11.9%
|
|
Net Gain on Foreign Exchange Transactions
|
349,349
|
343,814
|
377,016
|
9.7%
|
7.9%
|
654,719
|
720,830
|
10.1%
|
|
Total Other Core Income
|
1,296,577
|
1,337,838
|
1,401,569
|
4.8%
|
8.1%
|
2,458,512
|
2,739,407
|
11.4%
|
|
•
|
QoQ, Other Core Income reported solid results to hit a record-high
of S/1.4 billion. Growth in Fee Income will be described in the subsequent section. The Net Gain on Foreign Exchange
Transactions (+9.7%) reflected positive results mainly at BCP Stand-alone, reflecting higher client transactional volumes.
|
|
•
|
YoY, growth was driven mainly by an uptick in Fee Income, which
will be discussed in the subsequent section on fee income at BCP Stand-alone. A secondary driver of growth was the Net Gain on Foreign Exchange Transactions (+7.9%)
at BCP Stand- alone, which was fueled by an increase in transaction volumes across banking segments, on the back of pricing strategies and retail campaigns.
|
|
•
|
YTD, growth was fueled mainly by an uptick in Fee Income, to be
discussed later. The 10.1% increase in the Net Gain on Foreign Exchange Transactions was fueled by BCP Stand-alone,
which has been bolstered by our sustained bet on digital channels and an increase in our share of the FX business as we move to capture robust transactional opportunities from Retail and Wholesale
clients. This performance is proof of BCP’s capacity to innovate the transactional experience and agilely adapt to new market dynamics, which has boosted greater financial inclusion among clients
who previously relied on the informal market.
|
 |
|
|
|
|
|
| |
| |
Earnings Release 2Q / 2025
|
Analysis of 2Q25 Consolidated Results
|
|
06. Other Income
|
|
Fee Income by Subsidiary
|
Quarter
|
% Change
|
Up to
|
% change
|
||||
|
(S/ 000)
|
2Q24
|
1Q25
|
2Q25
|
QoQ
|
YoY
|
Jun 24
|
Jun 25
|
Jun 25 / Jun 24
|
|
BCP Stand-Alone (1)
|
742,354
|
831,427
|
853,720
|
2.7%
|
15.0%
|
1,446,982
|
1,685,147
|
16.5%
|
|
BCP Bolivia (2)
|
21,115
|
12,844
|
14,552
|
13.3%
|
-31.1%
|
35,983
|
27,396
|
-23.9%
|
|
Mibanco
|
21,773
|
28,339
|
27,633
|
-2.5%
|
26.9%
|
45,946
|
55,972
|
21.8%
|
|
Mibanco Colombia
|
11,042
|
9,126
|
12,395
|
35.8%
|
12.3%
|
22,292
|
21,521
|
-3.5%
|
|
Pacífico
|
(2,488)
|
(3,757)
|
(6,287)
|
67.3%
|
152.7%
|
(5,687)
|
(10,044)
|
76.6%
|
|
Prima
|
99,103
|
94,072
|
97,233
|
3.4%
|
-1.9%
|
193,631
|
191,305
|
-1.2%
|
|
ASB
|
15,485
|
13,826
|
12,841
|
-7.1%
|
-17.1%
|
32,547
|
26,667
|
-18.1%
|
|
Credicorp Capital
|
153,482
|
136,264
|
134,297
|
-1.4%
|
-12.5%
|
281,630
|
270,561
|
-3.9%
|
|
Eliminations and Other (3)
|
(114,638)
|
(128,117)
|
(121,831)
|
-4.9%
|
6.3%
|
(249,531)
|
(249,948)
|
0.2%
|
|
Total Net Fee Income
|
947,228
|
994,024
|
1,024,553
|
3.1%
|
8.2%
|
1,803,793
|
2,018,577
|
11.9%
|
|
BCP Stand-alone Fees (*)
|
Quarter
|
% Change
|
Up to
|
% change
|
||||
|
(S/ 000,000)
|
2Q24
|
1Q25
|
2Q25
|
QoQ
|
YoY
|
Jun 24
|
Jun 25
|
Jun 25 / Jun 24
|
|
Payments and transactional services (1)
|
263
|
283
|
287
|
1.3%
|
9.0%
|
535
|
570
|
6.5%
|
|
Yape (2)
|
70
|
121
|
132
|
9.1%
|
88.7%
|
124
|
252
|
103.9%
|
|
Liability and Transactional Accounts (3)
|
190
|
197
|
201
|
2.0%
|
5.6%
|
369
|
398
|
7.7%
|
|
Loan Disbursement (4)
|
101
|
98
|
104
|
6.7%
|
3.1%
|
191
|
202
|
5.9%
|
|
Off-balance sheet
|
55
|
56
|
53
|
-5.9%
|
-3.9%
|
112
|
109
|
-2.9%
|
|
Insurances
|
35
|
48
|
40
|
-17.8%
|
13.9%
|
68
|
88
|
28.3%
|
|
Wealth Management and Corporate Finance
|
18
|
15
|
20
|
32.5%
|
12.8%
|
27
|
35
|
28.5%
|
|
Others (5)
|
11
|
14
|
18
|
30.8%
|
59.5%
|
21
|
32
|
54.1%
|
|
Total
|
743
|
831
|
854
|
2.7%
|
15.0%
|
1,447
|
1,685
|
16.5%
|
|
•
|
Yape, mainly due to Bill Payments and Checkout.
|
|
•
|
Core Business, represented by accounting lines with more recurring and stable results, showed improved
performance, mainly driven by Loan disbursements, in line with recovery in structural commercial loans. To a lesser extent,
Payment and transactional services, as well as Liability and transactional accounts, contributed to growth through an uptick in transactional
activity.
|
|
•
|
Wealth Management and Corporate Finance, due to extraordinary income in the month of April from structuring and
advisory fees.
|
|
•
|
Yape, which accounted for 56% of growth in fee income, boosted by Bill Payments and Merchant fees.
|
 |
|
|
|
|
|
| |
| |
Earnings Release 2Q / 2025
|
Analysis of 2Q25 Consolidated Results
|
|
06. Other Income
|
|
•
|
Core businesses, where commission growth was mainly driven by (i) Payment
and transactional services, which accounted for 21% of the increase, rose on the back of higher billing in credit and debit cards, and (ii) Liability and
transactional accounts, which contributed 10% of the growth, associated with higher volumes of interbank and international transfers, as well as an increase in current account openings.
|
|
•
|
Yape, which accounted for 54% of the increase in fee income. The most mature functionalities, such as Bill
Payments, Merchant fees, and Top-Ups were the main contributors, while new solutions like Checkout, Yape for Businesses, and Remittances are showing significant progress.
|
|
•
|
Core businesses, through, in order of impact, (i) Payments and services, which
fueled 15% of the growth in fee income through an uptick in transactions with credit and debit cards. Merchant fees for credit and debit card transactions have been rising at double-digit rates
(CAGR); this growth, however, has been partially attenuated by an increase in fees paid for the loyalty program and incentives, and (ii) Liability and transactional
accounts, which rose on the back of Wires and Transfers (+8.9%) and Current Accounts (+12.5%) and through the same dynamics seen YoY; these accounts represented 12% of total growth in fee
income over the period.
|
|
•
|
Insurance, which fueled 8% of the growth in fee income on the back of regularizations with Pacifico.
|
|
Other Non-Core Income
|
Quarter
|
% change
|
Up to
|
% change
|
||||
|
(S/ 000)
|
2Q24
|
1Q25
|
2Q25
|
QoQ
|
YoY
|
Jun 24
|
Jun 25
|
Jun 25 / Jun 24
|
|
Net Gain on Securities
|
92,711
|
(28,149)
|
179,174
|
-736.5%
|
93.3%
|
154,456
|
151,025
|
-2.2%
|
|
Net Gain from Associates (1)
|
28,728
|
24,068
|
6,556
|
-72.8%
|
-77.2%
|
61,023
|
30,624
|
-49.8%
|
|
Net Gain of Derivatives Held for Trading (2)
|
41,748
|
18,499
|
21,418
|
15.8%
|
-48.7%
|
81,732
|
39,917
|
-51.2%
|
|
Net Gain from Exchange Differences
|
(7,933)
|
15,959
|
10,195
|
-36.1%
|
-228.5%
|
(13,554)
|
26,154
|
-293.0%
|
|
Other Non-operative Income
|
139,499
|
322,001
|
58,461
|
-81.8%
|
-58.1%
|
241,720
|
380,462
|
57.4%
|
|
Total Other Non-Core Income
|
294,753
|
352,378
|
275,804
|
-21.7%
|
-6.4%
|
525,377
|
628,182
|
19.6%
|
|
Other Non-Core Income
|
Other Non-Core Income
|
||
|
QoQ evolution
|
YoY evolution
|
||
|
(millions of soles)
|
(millions of soles)
|
||
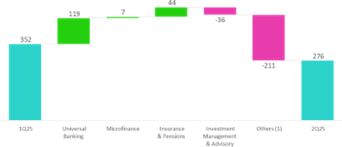 |
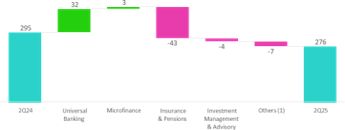 |
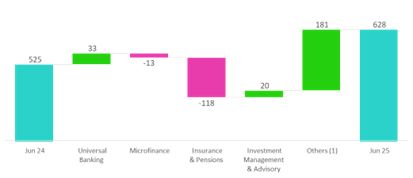
 |
|
|
|
|
|
| |
| |
Earnings Release 2Q / 2025
|
Analysis of 2Q25 Consolidated Results
|
|
06. Other Income
|
|
•
|
Other Income: in Others, due to the extraordinary gain associated
with the consolidation of Banmedica from 1Q25 of S/236 million.
|
|
•
|
Net gain from associates: at Pacifico, which experienced a change in
accounting after the acquisition of Banmedica; currently, the results for corporate health insurance and medical services are consolidated in the Insurance Underwriting Result and Medical Services
line rather than in the gain from associates line.
|
|
•
|
Other income: due to a 2Q24 base effect, where significant gains were recorded in (ii) BCP
Stand-alone, driven primarily by the sale of real estate, and in (ii) Pacifico, due to a provision reversal.
|
|
•
|
Net gain from associates: at Pacifico, in line with the same factors that drove the QoQ
analysis.
|
|
•
|
Net gain (loss) on Derivatives Held for Trading: due to a 2Q24 base effect, when stronger results were recorded in (i) Credicorp Capital, driven by trading strategies implemented in Colombia and Chile, and (ii) ASB, due to gains from
foreign exchange hedging derivatives.
|
|
•
|
Other Income: in Others, due to an extraordinary gain for the acquisition of Banmedica.
|
|
•
|
Net Gain (Loss) from Exchange Difference: at ASB, driven by the same factors seen in the
YoY analysis.
|
|
•
|
Net Gain (Loss) on Securities: where higher income at BCP Stand-alone, related to a
sovereign bond exchange, was offset by Pacífico and Others, in line with the QoQ analysis.
|
 |
|
|
|
|
|
| |
| |
Earnings Release 2Q / 2025
|
Analysis of 2Q25 Consolidated Results
|
|
07
|
Insurance Underwriting and Medical Services Results
|
|
|
QoQ, the Insurance Underwriting Result rose 6.6%, driven primarily by (i) the Life Business via a drop in Insurance Service
Expenses, which registered a decrease in claims in Credit Life and D&S lines, and (ii) by the EPS business.
YoY and YTD, results increased 11.2% and 14.4% respectively on the back of growth in (i) the Life Business, through a drop in Insurance Service expenses in Individual
Life; and growth in income in Credit Life, (ii) P & C, fueled by an increase in Insurance Income Services in Personal Lines and a reduction in expenses in Cars, and (iii) the EPS business.
|
|
Insurance Underwriting Results
|
Quarterly
|
% Change
|
Up to
|
%Change
|
|||||
|
S/millions
|
2Q24
|
1Q25
|
2Q25
|
QoQ
|
YoY
|
Jun 24
|
Jun 25
|
Jun 25 / Jun 24
|
|
|
Total
|
Insurance Service Income
|
909.1
|
987.9
|
1,185.6
|
20.0%
|
30.4%
|
1,847.1
|
2,173.5
|
17.7%
|
|
Insurance Service Expenses
|
(496.1)
|
(571.8)
|
(738.8)
|
29.2%
|
48.9%
|
(972.3)
|
(1,310.6)
|
34.8%
|
|
|
Reinsurance Results
|
(97.5)
|
(87.0)
|
(96.0)
|
10.3%
|
-1.6%
|
(280.2)
|
(182.9)
|
-34.7%
|
|
|
Insurance Undewrwriting Result
|
315.5
|
329.1
|
350.9
|
6.6%
|
11.2%
|
594.6
|
680.0
|
14.4%
|
|
|
P&C
|
Insurance Service Income
|
454.0
|
490.0
|
480.0
|
-2.1%
|
5.7%
|
922.3
|
970.0
|
5.2%
|
|
Insurance Service Expenses
|
(302.0)
|
(325.3)
|
(298.7)
|
-8.2%
|
-1.1%
|
(539.9)
|
(624.0)
|
15.6%
|
|
|
Reinsurance Results
|
(70.2)
|
(72.4)
|
(88.7)
|
22.5%
|
26.3%
|
(220.2)
|
(161.1)
|
-26.8%
|
|
|
Insurance Undewrwriting Result
|
81.8
|
92.3
|
92.6
|
0.3%
|
13.2%
|
162.2
|
185.0
|
14.0%
|
|
|
Life
|
Insurance Service Income
|
445.5
|
332.9
|
330.9
|
-0.6%
|
-25.7%
|
883.6
|
663.8
|
-24.9%
|
|
Insurance Service Expenses
|
(205.3)
|
(112.3)
|
(79.0)
|
-29.6%
|
-61.5%
|
(437.2)
|
(191.3)
|
-56.2%
|
|
|
Reinsurance Results
|
(23.4)
|
(13.3)
|
(7.6)
|
-43.0%
|
-67.5%
|
(50.4)
|
(20.9)
|
-58.5%
|
|
|
Insurance Undewrwriting Result
|
216.8
|
207.2
|
244.3
|
17.9%
|
12.7%
|
396.0
|
451.5
|
14.0%
|
|
|
Crediseguros
|
Insurance Service Income
|
16.0
|
22.9
|
13.3
|
-42.0%
|
-17.0%
|
50.4
|
36.1
|
-28.3%
|
|
Insurance Service Expenses
|
5.9
|
(5.8)
|
(4.2)
|
-28.5%
|
-170.3%
|
(5.6)
|
(10.0)
|
78.2%
|
|
|
Reinsurance Results
|
(10.1)
|
(8.3)
|
(3.8)
|
-54.3%
|
-62.4%
|
(18.6)
|
(12.1)
|
-34.7%
|
|
|
Insurance Undewrwriting Result
|
11.8
|
8.7
|
5.3
|
-39.3%
|
-55.2%
|
26.2
|
14.0
|
-46.6%
|
|
|
EPS
|
Insurance Service Income
|
0.0
|
130.1
|
383.3
|
194.5%
|
n.a
|
0.0
|
513.4
|
n.a.
|
|
Insurance Service Expenses
|
0.0
|
(122.9)
|
(357.3)
|
190.7%
|
n.a
|
0.0
|
(480.2)
|
n.a.
|
|
|
Reinsurance Results
|
0.0
|
(0.4)
|
(1.3)
|
194.7%
|
n.a
|
0.0
|
(1.7)
|
n.a.
|
|
|
Insurance Undewrwriting Result
|
0.0
|
6.8
|
24.7
|
263.1%
|
n.a
|
0.0
|
31.5
|
n.a.
|
|
|
Insurance Service Income
|
Insurance Service Expenses
|
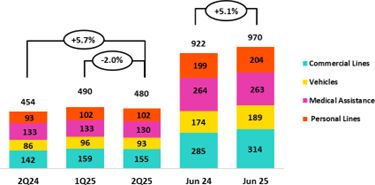 |
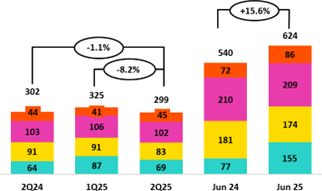 |
 |
|
|
|
|
|
| |
| |
Earnings Release 2Q / 2025
|
Analysis of 2Q25 Consolidated Results
|
|
07. Insurance Underwriting and Medical Services Results
|
|
•
|
Insurance Service Income registered a slight decline of 2.0% with was driven mainly by (i) Commercial Lines and Medical Assistance,
which dropped due to a reduction in premiums for renewals, which were impacted by seasonality, and (ii) Cars, where more Reserves for Current Risks were set aside, in line with growth
in premium turnover.
|
|
•
|
Insurance Service Expenses dropped 8.2%, fueled by (i) Commercial Lines, which reported a reduction in claims in Fire and Third Party
Liability risks, and (ii) Vehicles, via a drop in claims and release from onerous contracts.
|
|
•
|
The Reinsurance Result deteriorated, fueled primarily by a decrease in claims recovered from the reinsurance in Commercial Lines.
|
|
•
|
Insurance Service Income increased 5.7%, driven mainly by (i) Commercial Lines, which reported an increase in premiums allotted to the
period due to new sales and an uptick in renewals, and (ii) Personal Lines, through the card protection product, which registered growth in sales through the bancassurance channel, and
(iii) Vehicles, via an uptick in sales through Yape.
|
|
•
|
Insurance Service Expenses dropped 1.1%, fueled primarily by Vehicles via a drop in claims and releases from onerous contracts.
|
|
•
|
The Reinsurance Result deteriorated, driven mainly by an increase in ceded premiums in Commercial Lines.
|
|
Insurance Service Income
|
Insurance Service Expenses
|
|
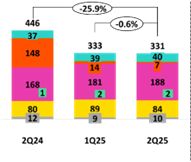 |
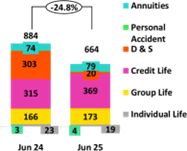 |
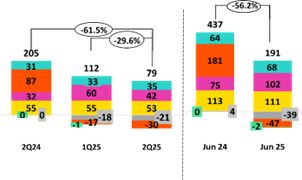 |
|
•
|
Insurance Service Income dropped 0.6%, driven primarily by (i) D&S, through a drop in regularization of premiums under SISCO VII,
and (ii) Group Life, via a reduction in insurance for high-risk occupations (SCTR), which was attributable to seasonality. The aforementioned was mitigated by the evolution of Credit
Life, which registered growth in premiums through Bancassurance and Alliances.
|
|
•
|
Insurance Service Expenses dropped 29.6%, due primarily to (i) Credit Life, which reported a reduction in expenses for claims in the
BCP Channel (Yape) and Mibanco, and (ii) D&S, which registered an increase in releases of reserves for claims under SISCO VII.
|
|
•
|
The Reinsurance Result improved, fueled mainly by Group Life, which reported growth in claims recovered from reinsurers.
|
|
•
|
Insurance Service Income decreased 25.7%. This evolution was driven mainly by the D&S line, given that the company was not awarded
tranches of SISCO VIII in 2025 (vs participation under SISCO VII in 2024). The impact of this decline was partially attenuated by Credit Life, which registered an increase in premiums
allotted to the period via the Bancassurance and Alliances channels.
|
|
•
|
Insurance Service Expenses dropped 61.5%, driven primarily by (i) D&S, in line with no contract award under SISCO VIII, and (ii)
Individual Life, which reported a drop in claims. These dynamics were partially offset by Credit Life, which reported an uptick in underwriting expenses in Alliances.
|
|
•
|
The Reinsurance Result improved, mainly on the back of D&S, which registered a reduction in ceded premiums.
|
 |
|
|
|
|
|
| |
| |
Earnings Release 2Q / 2025
|
Analysis of 2Q25 Consolidated Results
|
|
07. Insurance Underwriting and Medical Services Results
|
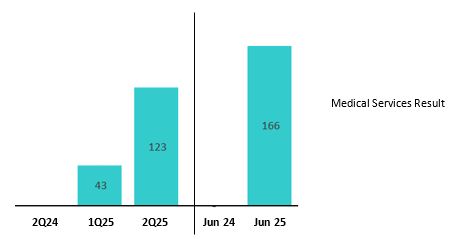
 |
|
|
|
|
|
| |
| |
Earnings Release 2Q / 2025
|
Analysis of 2Q25 Consolidated Results
|
| 08 |
Operating Expenses
|
|
Operating expenses rose 11.4% YTD, driven primarily by core
businesses at BCP Stand-alone and innovation portfolio initiatives at Credicorp. Core business expenses at BCP Stand-alone rose due to (i) higher expenses for Employee salaries and
benefits, which was driven by growth in provisions for variable compensation and an increase in head counts; and (ii) an increas e in administrative expenses, mainly at Pacifico,
which reflects the 100% consolidation of operations at Empresas Banmédica, and at BCP Stand-alone, which registered an uptick in cloud use due to growth in the transactions volume
among increasingly digitalized clients. Expenses for innovation portfolio initiatives at Credicorp rose 15.0%.
|
|
Operating expenses
|
Quarter |
% change
|
Up to
|
% change
|
||||
|
S/000
|
2Q24
|
1Q25
|
2Q25
|
QoQ
|
YoY
|
Jun 24
|
Jun 25
|
Jun 25 / Jun 24
|
|
Salaries and employees benefits
|
1,141,823
|
1,361,690
|
1,262,520
|
-7.3%
|
10.6%
|
2,248,892
|
2,624,210
|
16.7%
|
|
Administrative and general expenses
|
947,558
|
869,834
|
965,994
|
11.1%
|
1.9%
|
1,769,306
|
1,835,828
|
3.8%
|
|
Depreciation and amortization
|
172,204
|
203,766
|
212,662
|
4.4%
|
23.5%
|
347,350
|
416,428
|
19.9%
|
|
Association in participation (1)
|
9,200
|
6,799
|
371
|
-94.5%
|
-96.0%
|
18,047
|
7,170
|
-60.3%
|
|
Operating expenses
|
2,270,785
|
2,442,089
|
2,441,547
|
0.0%
|
7.5%
|
4,383,595
|
4,883,636
|
11.4%
|
| • |
Growth in Salaries and Employee Benefits, which was driven mainly by (i) BCP Stand-alone, fueled primarily by growth in expenses for provisions for
variable compensation and secondarily by an uptick in hiring for new projects, and (ii) Mibanco and Pacifico, which reported growth in compensation.
|
| • |
An increase in Administrative and General Expenses, which was driven by Pacífico and BCP Stand-alone. At Pacifico, growth was mainly spurred by a
change in the consolidation perimeter following Credicorp’s acquisition of the 50% share held by Empresas Banmédica in the joint venture with Pacifico Compañía de Seguros y
Reaseguros S.A., effective March 2025. At BCP Stand-alone, the volume of transactions through digital channels rose, which led to higher expenses for cloud use and other
IT-related activities.
|
|
Administrative and General Expenses
|
Quarter
|
% change
|
Up to
|
% change
|
||||
|
S/000
|
2Q24
|
1Q25
|
2Q25
|
QoQ
|
YoY
|
1H24
|
1H25
|
1H25 / 1H24
|
|
IT expenses and IT third-party services
|
294,997
|
302,029
|
324,083
|
7.3%
|
9.9%
|
577,902
|
626,112
|
8.3%
|
|
Advertising
|
134,007
|
85,390
|
112,027
|
31.2%
|
-16.4%
|
191,741
|
197,417
|
3.0%
|
|
Taxes and contributions
|
94,448
|
83,347
|
86,321
|
3.6%
|
-8.6%
|
187,335
|
169,668
|
-9.4%
|
|
Audit Services, Consulting and professional fees
|
75,845
|
71,072
|
92,086
|
29.6%
|
21.4%
|
134,837
|
163,158
|
21.0%
|
|
Transport and communications
|
60,225
|
52,810
|
58,391
|
10.6%
|
-3.0%
|
114,289
|
111,201
|
-2.7%
|
|
Repair and maintenance
|
34,598
|
31,635
|
37,886
|
19.8%
|
9.5%
|
67,236
|
69,521
|
3.4%
|
|
Agents' Fees
|
29,375
|
26,102
|
28,067
|
7.5%
|
-4.5%
|
56,763
|
54,169
|
-4.6%
|
|
Services by third-party
|
35,950
|
21,436
|
26,634
|
24.2%
|
-25.9%
|
64,365
|
48,070
|
-25.3%
|
|
Leases of low value and short-term
|
31,002
|
33,177
|
34,937
|
5.3%
|
12.7%
|
61,467
|
68,114
|
10.8%
|
|
Miscellaneous supplies
|
24,700
|
19,383
|
18,192
|
-6.1%
|
-26.3%
|
43,353
|
37,575
|
-13.3%
|
|
Security and protection
|
16,544
|
16,946
|
16,940
|
0.0%
|
2.4%
|
32,447
|
33,886
|
4.4%
|
|
Subscriptions and quotes
|
24,220
|
18,330
|
19,773
|
7.9%
|
-18.4%
|
41,392
|
38,103
|
-7.9%
|
|
Electricity and water
|
13,614
|
10,275
|
12,513
|
21.8%
|
-8.1%
|
25,350
|
22,788
|
-10.1%
|
|
Electronic processing
|
6,016
|
7,635
|
7,762
|
1.7%
|
29.0%
|
13,764
|
15,397
|
11.9%
|
|
Insurance
|
7,370
|
11,719
|
16,441
|
40.3%
|
123.1%
|
12,542
|
28,160
|
124.5%
|
|
Cleaning
|
5,629
|
6,558
|
7,014
|
7.0%
|
24.6%
|
11,373
|
13,572
|
19.3%
|
|
Others
|
59,018
|
71,990
|
66,927
|
-7.0%
|
13.4%
|
133,150
|
138,917
|
4.3%
|
|
Total
|
947,558
|
869,834
|
965,994
|
11.1%
|
1.9%
|
1,769,306
|
1,835,828
|
3.8%
|
 |
|
|
|
|
|
| |
| |
Earnings Release 2Q / 2025
|
Analysis of 2Q25 Consolidated Results
|
|
08. Operating Expenses
|
|
Operating Expenses (1)
|
Quarter |
% change
|
Up to
|
% change
|
||||
|
S/ 000
|
2Q24
|
1Q25
|
2Q25
|
QoQ
|
YoY
|
1H24
|
1H25
|
1H25 / 1H24
|
|
Operating Expenses Ex Innovation
|
1,986,433
|
2,138,640
|
2,123,767
|
-0.7%
|
6.9%
|
3,843,400
|
4,262,407
|
10.9%
|
|
Innovation Portfolio (2)
|
284,352
|
303,449
|
317,780
|
4.7%
|
11.8%
|
540,195
|
621,229
|
15.0%
|
|
Total Operating Expenses
|
2,270,785
|
2,442,089
|
2,441,547
|
0.0%
|
7.5%
|
4,383,595
|
4,883,637
|
11.4%
|
| (1) |
Management figures.
|
| (2) |
Includes innovation portfolio initiatives in subsidiaries and Krealo.
|
| • |
Core business expenses excluding IT
|
| • |
Growth in expenses for Salaries and Employee Benefits due to (i) provisions for variable compensation, in line with higher results, and (ii) an
increase in headcount.
|
| • |
Technology expenses (IT)
|
| • |
More personnel with specialized digital capacities were hired with above-average salaries, in line with strategic project execution.
|
| • |
Growth in expenses for the use of data processing servers, which reflects growth in the volume of transactions through digital channels as clients
become increasingly digitalized. Total monetary transactions through digital channels rose 58.2% and 68.2%, respectively.
|
 |
|
|
|
|
|
| |
| |
Earnings Release 2Q / 2025
|
Analysis of 2Q25 Consolidated Results
|
| 09 |
Operating Efficiency
|
|
YTD, the efficiency ratio deteriorated 143 bps as growth in operating expenses outpaced the expansion
reported for operating income. This evolution was in line with an increase in expenses for the core business at BCP Stand-alone and for innovation initiatives at the Credicorp
level.
|
|
Subsidiary
|
Quarter
|
% change
|
As of
|
% change
|
||||
|
2Q24
|
1Q25
|
2Q25
|
QoQ
|
YoY
|
1H24
|
1H25
|
1H25 / 1H24
|
|
|
BCP Stand-alone
|
37.1%
|
37.7%
|
38.3%
|
70 bps
|
130 bps
|
36.1%
|
38.0%
|
190 bps
|
|
BCP Bolivia
|
58.2%
|
69.6%
|
67.3%
|
-230 bps
|
910 bps
|
58.1%
|
68.8%
|
1070 bps
|
|
Mibanco Peru
|
51.0%
|
52.9%
|
52.0%
|
-90 bps
|
100 bps
|
52.1%
|
52.4%
|
30 bps
|
|
Mibanco Colombia
|
78.9%
|
70.6%
|
65.5%
|
-520 bps
|
-1340 bps
|
82.1%
|
67.9%
|
-1420 bps
|
|
Pacífico
|
27.5%
|
31.5%
|
37.5%
|
600 bps
|
1000 bps
|
27.6%
|
44.6%
|
1700 bps
|
|
Prima AFP
|
52.1%
|
54.4%
|
51.4%
|
-310 bps
|
-80 bps
|
51.3%
|
52.9%
|
160 bps
|
|
Credicorp
|
44.2%
|
45.7%
|
44.2%
|
-160 bps
|
0 bps
|
43.5%
|
44.9%
|
143 bps
|
 |
|
|
|
|
|
| |
| |
Earnings Release 2Q / 2025
|
Analysis of 2Q25 Consolidated Results
|
| 10 |
Regulatory Capital
|
|
The Regulatory Capital Ratio at Credicorp was 135% higher than the regulatory minimum.
IFRS CET1 at BCP Stand-alone rose 51 bps YoY to stand at 12.56%, which is above our appetite of
11%. Growth was driven by an uptick in Retained Earnings, which was attributable to business growth and partially offset by an increase in operating RWAS, which was fueled
by growth in the bank’s margin.
Mibanco’s IFRS CET1 stood at 16.73%, which was aligned with our internal appetite of 15%. This
evolution was driven by a drop in operating RWAs, which was offset by a decrease in Retained earnings, which fell on the back of dividend payments.
|
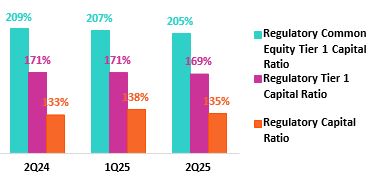
|
|
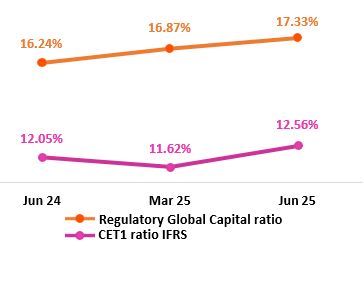
 |
|
|
|
|
|
| |
| |
Earnings Release 2Q / 2025
|
Analysis of 2Q25 Consolidated Results
|
|
10.Regulatory Capital
|
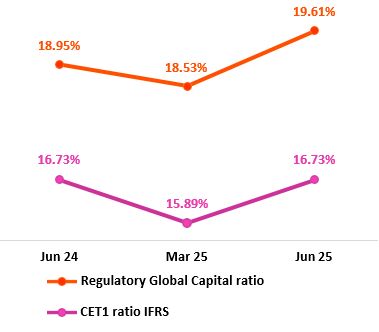
 |
|
|
|
|
|
| |
| |
Earnings Release 2Q / 2025
|
Analysis of 2Q25 Consolidated Results
|
| 11 |
Economic Outlook
|
|
In 2Q25, GDP grew around 3.0% YoY, supported by high terms of trade, a continued recovery in formal
employment, and inflation comfortably within the BCRP’s target range. The slowdown compared to 1Q25 was mainly due to weaker performance in primary sectors
(mining, fishing, and agriculture).}
Inflation rose slightly, closing the quarter at 1.7% YoY (compared to 1.3% YoY in1Q25), marking
seven consecutive months below the midpoint of the target range (1%–3%). Meanwhile, in its July meeting, the BCRP decided to keep the reference interest
rate unchanged at 4.50%.
According to the BCRP, the exchange rate closed 2Q25 at USDPEN 3.54. Thus, the sol appreciated
3.5% compared to the end of 1Q25 and 6.0% compared to the end of 4Q24 (USDPEN 3.77).
|
| Peru |
2019
|
2020
|
2021
|
2022
|
2023
|
2024
|
2025 (4)
|
|
GDP (US$ Millions)
|
236,517
|
209,723
|
229,791
|
248,403
|
272,221
|
295,160
|
319,637
|
|
Real GDP (% change)
|
2.2
|
-10.9
|
13.4
|
2.8
|
-0.4
|
3.3
|
3.2
|
|
GDP per capita (US$)
|
7,361
|
6,428
|
6,956
|
7,438
|
8,072
|
8,671
|
9,305
|
|
Domestic demand (% change)
|
2.9
|
-9.3
|
13.9
|
2.4
|
-1.1
|
4.0
|
4.8
|
|
Gross fixed investment (as % GDP)
|
22
|
21
|
25
|
25
|
23
|
23
|
23
|
|
Financial system loan without Reactiva (% change) (1)
|
6.4
|
-4.3
|
12.6
|
9.7
|
2.8
|
1.3
|
7.0
|
|
Inflation, end of period (2)
|
1.9
|
2.0
|
6.4
|
8.5
|
3.2
|
2.0
|
2.0
|
|
Reference Rate, end of period
|
2.25
|
0.25
|
2.50
|
7.50
|
6.75
|
5.00
|
4.25
|
|
Exchange rate, end of period
|
3.31
|
3.62
|
3.99
|
3.81
|
3.71
|
3.76
|
3.65
|
|
Exchange rate, (% change) (3)
|
1.8%
|
-9.3%
|
-10.3%
|
4.5%
|
2.7%
|
-1.3%
|
2.8%
|
|
Fiscal balance (% GDP)
|
-1.6
|
-8.7
|
-2.5
|
-1.7
|
-2.7
|
-3.5
|
-2.8
|
|
Public Debt (as % GDP)
|
26
|
34
|
35
|
33
|
32
|
32
|
32
|
|
Trade balance (US$ Millions)
|
6,893
|
8,098
|
15,115
|
10,331
|
17,150
|
24,081
|
28,500
|
|
(As % GDP)
|
2.9%
|
3.9%
|
6.6%
|
4.2%
|
6.3%
|
8.2%
|
8.9%
|
|
Exports
|
47,995
|
42,822
|
63,114
|
66,339
|
67,108
|
76,172
|
86,000
|
|
Imports
|
41,102
|
34,724
|
47,999
|
56,009
|
49,958
|
52,091
|
57,500
|
|
Current account balance (As % GDP)
|
-0.7%
|
0.8%
|
-2.2%
|
-4.0%
|
0.3%
|
2.2%
|
1.8%
|
|
Net international reserves (US$ Millions)
|
68,316
|
74,707
|
78,495
|
71,883
|
71,033
|
78,987
|
86,000
|
|
(As % GDP)
|
28.9%
|
35.6%
|
34.2%
|
28.9%
|
26.1%
|
26.8%
|
26.9%
|
|
(As months of imports)
|
20
|
26
|
20
|
15
|
17
|
18
|
18
|
|
Sources: INEI, BCRP y SBS.
|
|
| (1) |
Financial System, Current Exchange Rate, End of Period
|
| (2) |
Inflation target: 1% - 3%
|
| (3) |
Negative % change indicates depreciation.
|
| (4) |
Grey area indicate estimates by BCP Economic Research as of August 2025
|
 |
|
|
|
|
|
| |
| |
Earnings Release 2Q / 2025
|
Analysis of 2Q25 Consolidated Results
|
|
11. Economic Outlook
|
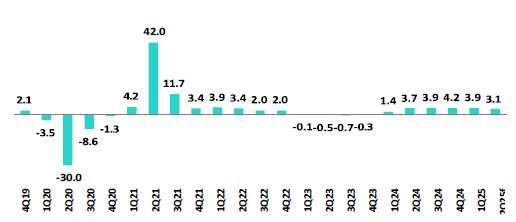
|
|
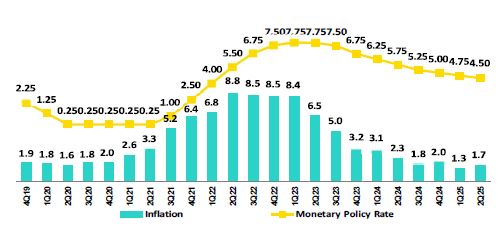
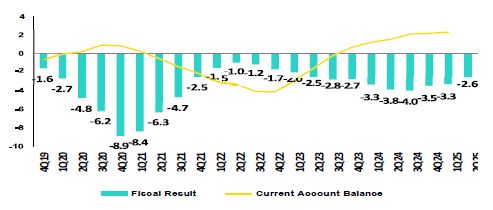
|
|
 |
|
|
|
|
|
| |
| |
Earnings Release 2Q / 2025
|
Analysis of 2Q25 Consolidated Results
|
|
11. Economic Outlook
|
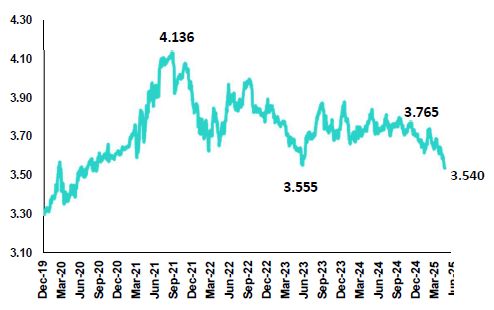
 |
|
|
|
|
|
| |
| |
Earnings Release 2Q / 2025
|
Analysis of 2Q25 Consolidated Results
|
|
Safe Harbor for Forward-Looking Statements
|
|
•
|
The occurrence of natural disasters or political or social instability in Peru;
|
|
•
|
The adequacy of the dividends that our subsidiaries are able to pay to us, which may affect our ability to pay dividends
to shareholders and corporate expenses;
|
|
•
|
Performance of, and volatility in, financial markets, including Latin-American and other markets;
|
|
•
|
The frequency, severity and types of insured loss events;
|
|
•
|
Fluctuations in interest rate levels;
|
|
•
|
Foreign currency exchange rates, including the Sol/US Dollar exchange rate;
|
|
•
|
Deterioration in the quality of our loan portfolio;
|
|
•
|
Increasing levels of competition in Peru and other markets in which we operate;
|
|
•
|
Developments and changes in laws and regulations affecting the financial sector and adoption of new international
guidelines;
|
|
•
|
Changes in the policies of central banks and/or foreign governments;
|
|
•
|
Effectiveness of our risk management policies and of our operational and security systems;
|
|
•
|
Losses associated with counterparty exposures;
|
|
•
|
The scope of the coronavirus (“COVID-19”) outbreak, actions taken to contain the COVID-19 and related economic effects
from such actions and our ability to maintain adequate staffing; and
|
|
•
|
Changes in Bermuda laws and regulations applicable to so-called non-resident entities.
|
 |
|
|
|
|
|
| |
| |
Earnings Release 2Q / 2025
|
Analysis of 2Q25 Consolidated Results
|
|
12
|
Appendix
|
|
12.1. Evolution of Loans in Average Daily Balances
|
46
|
||
|
12.2. Loan Portfolio Quality
|
46
|
||
|
12.3. Net Interest Income (NII)
|
51
|
||
|
12.4. Net Interest Margin (NIM) and Risk Adjusted NIM
|
50
|
||
|
12.5. Physical Point of Contact
|
46
|
||
|
12.6. Regulatory Capital
|
51
|
||
|
12.7. Financial Statements and Ratios by Business
|
55
|
||
|
|
12.7.1. Credicorp Consolidated
|
55
|
|
|
12.7.2. Credicorp Stand-alone
|
57
|
||
|
12.7.3. BCP Consolidated
|
58
|
||
|
12.7.4. BCP Stand-alone
|
60
|
||
|
12.7.5. BCP Bolivia
|
62
|
||
|
12.7.6. Mibanco
|
63
|
||
|
12.7.7. Prima AFP
|
64
|
||
|
12.7.8. Grupo Pacifico
|
65
|
||
|
12.7.9. Investment Management and Advisory
|
67
|
||
|
12.8. Table of Calculations
|
68
|
||
|
12.9. Glossary of terms
|
69
|
||
 |
|
|
|
|
|
|
| |
Earnings Release 2Q / 2025
|
Analysis of 2Q25 Consolidated Results
|
|
12. Appendix
|
| 12.1. |
Evolution of Loans in Average Daily Balances
|
|
Total Loans
(S/ millions)
|
As of
|
Volume change
|
% change
|
% Part. in total loans
|
||||||
|
Jun 24
|
Mar 25
|
Jun 25
|
QoQ
|
YoY
|
QoQ
|
YoY
|
Jun 24
|
Mar 25
|
Jun 25
|
|
|
BCP Stand-alone
|
117,591
|
118,771
|
119,142
|
371
|
1,551
|
0.3%
|
1.3%
|
81.8%
|
82.6%
|
82.4%
|
|
Wholesale Banking
|
53,814
|
54,548
|
54,096
|
-452
|
283
|
-0.8%
|
0.5%
|
37.4%
|
37.9%
|
37.4%
|
|
Corporate
|
32,393
|
32,977
|
32,206
|
-771
|
-188
|
-2.3%
|
-0.6%
|
22.5%
|
22.9%
|
22.3%
|
|
Middle - Market
|
21,420
|
21,571
|
21,891
|
320
|
470
|
1.5%
|
2.2%
|
14.9%
|
15.0%
|
15.1%
|
|
Retail Banking
|
63,778
|
64,223
|
65,046
|
823
|
1,268
|
1.3%
|
2.0%
|
44.4%
|
44.6%
|
45.0%
|
|
SME - Business
|
7,528
|
7,590
|
7,521
|
-68
|
-7
|
-0.9%
|
-0.1%
|
5.2%
|
5.3%
|
5.2%
|
|
SME - Pyme
|
16,282
|
15,940
|
15,922
|
-18
|
-360
|
-0.1%
|
-2.2%
|
11.3%
|
11.1%
|
11.0%
|
|
Mortgage
|
21,257
|
21,870
|
22,439
|
569
|
1,182
|
2.6%
|
5.6%
|
14.8%
|
15.2%
|
15.5%
|
|
Consumer
|
12,724
|
12,961
|
13,207
|
246
|
483
|
1.9%
|
3.8%
|
8.9%
|
9.0%
|
9.1%
|
|
Credit Card
|
5,987
|
5,862
|
5,957
|
94
|
-30
|
1.6%
|
-0.5%
|
4.2%
|
4.1%
|
4.1%
|
|
Mibanco
|
12,815
|
12,147
|
12,514
|
366
|
-301
|
3.0%
|
-2.4%
|
8.9%
|
8.4%
|
8.7%
|
|
Mibanco Colombia
|
1,746
|
1,832
|
1,889
|
57
|
143
|
3.1%
|
8.2%
|
1.2%
|
1.3%
|
1.3%
|
|
Bolivia
|
9,645
|
9,469
|
9,537
|
69
|
-108
|
0.7%
|
-1.1%
|
6.7%
|
6.6%
|
6.6%
|
|
ASB Bank Corp.
|
1,909
|
1,644
|
1,560
|
-84
|
-349
|
-5.1%
|
-18.3%
|
1.3%
|
1.1%
|
1.1%
|
|
BAP's total loans
|
143,705
|
143,863
|
144,642
|
779
|
936
|
0.5%
|
0.7%
|
100.0%
|
100.0%
|
100.0%
|
| (1) |
Includes Special accounts, and other banking.
|
| (2) |
Portfolio Management Figures. Non-audited figures.
|
| 12.2. |
Loan Portfolio Quality
|
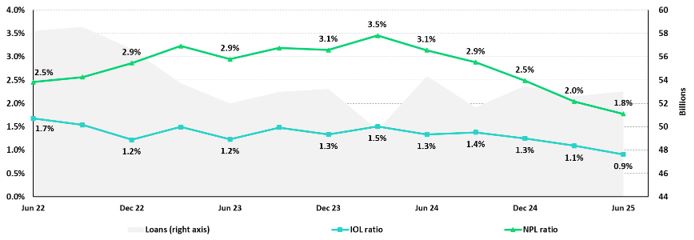
 |
|
|
|
|
|
|
| |
Earnings Release 2Q / 2025
|
Analysis of 2Q25 Consolidated Results
|
|
12. Appendix
|
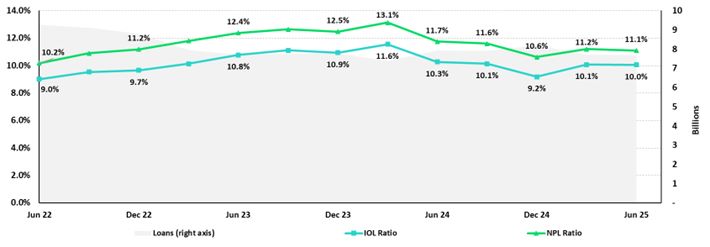
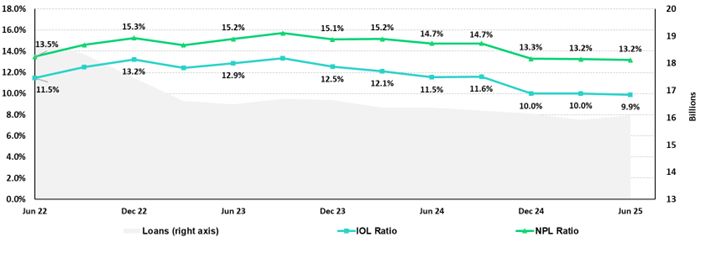
 |
|
|
|
|
|
|
| |
Earnings Release 2Q / 2025
|
Analysis of 2Q25 Consolidated Results
|
|
12. Appendix
|
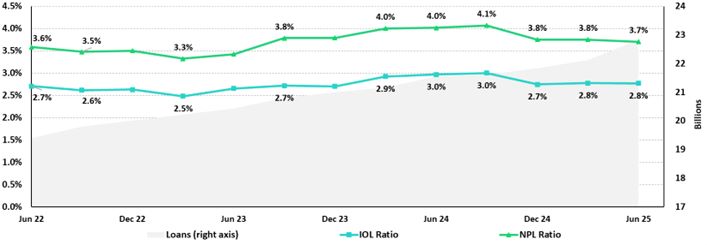
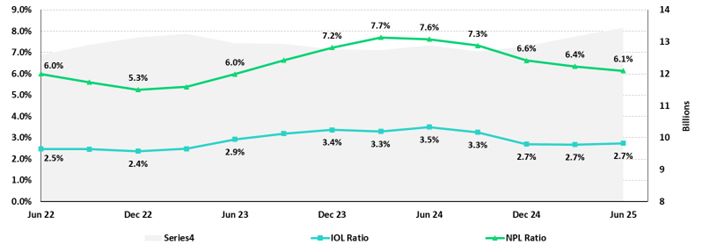
 |
|
|
|
|
|
|
| |
Earnings Release 2Q / 2025
|
Analysis of 2Q25 Consolidated Results
|
|
12. Appendix
|
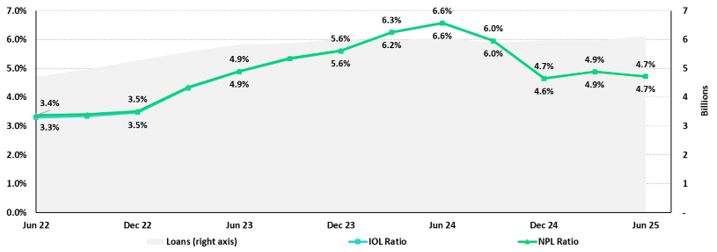
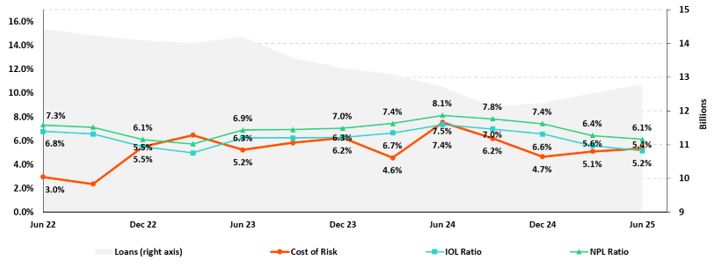
 |
|
|
|
|
|
|
| |
Earnings Release 2Q / 2025
|
Analysis of 2Q25 Consolidated Results
|
|
12. Appendix
|
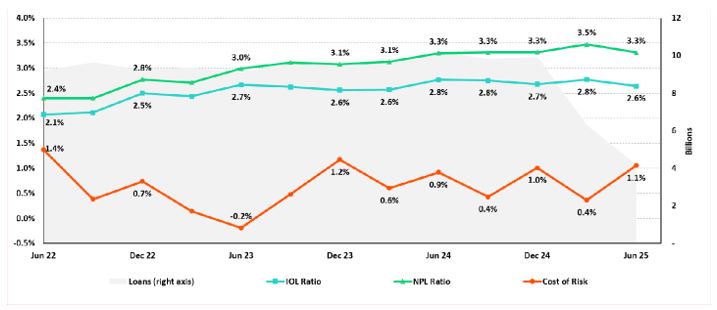
 |
|
|
|
|
|
|
| |
Earnings Release 2Q / 2025
|
Analysis of 2Q25 Consolidated Results
|
|
12. Appendix
|
| 12.3. |
Net Interest Income (NII)
|
|
Net interest income
S/000
|
Quarter
|
% change
|
Up to
|
% Change
|
||||
|
2Q24
|
1Q25
|
2Q25
|
QoQ
|
YoY
|
Jun 24
|
Jun 25
|
Jun 25 / Jun 24
|
|
|
Interest income
|
4,935,238
|
4,894,790
|
4,922,292
|
0.6%
|
-0.3%
|
9,861,164
|
9,817,082
|
-0.4%
|
|
Interest on loans
|
3,921,374
|
3,847,640
|
3,840,725
|
-0.2%
|
-2.1%
|
7,790,166
|
7,688,365
|
-1.3%
|
|
Dividends on investments
|
10,136
|
25,109
|
22,923
|
-8.7%
|
126.2%
|
20,997
|
48,033
|
128.8%
|
|
Interest on deposits with banks
|
319,829
|
344,622
|
342,323
|
-0.7%
|
7.0%
|
654,288
|
686,945
|
5.0%
|
|
Interest on securities
|
657,897
|
657,872
|
647,186
|
-1.6%
|
-1.6%
|
1,340,972
|
1,305,058
|
-2.7%
|
|
Other interest income
|
26,002
|
19,547
|
69,135
|
253.7%
|
165.9%
|
54,741
|
88,681
|
62.0%
|
|
Interest expense
|
1,466,774
|
1,322,778
|
1,306,921
|
-1.2%
|
-10.9%
|
2,966,577
|
2,629,699
|
-11.4%
|
|
Interest expense (excluding Net Insurance Financial Expenses)
|
1,342,088
|
1,187,156
|
1,167,866
|
-1.6%
|
-13.0%
|
2,719,887
|
2,355,023
|
-13.4%
|
|
Interest on deposits
|
738,010
|
619,613
|
541,014
|
-12.7%
|
-26.7%
|
1,517,536
|
1,160,627
|
-23.5%
|
|
Interest on borrowed funds
|
267,285
|
266,202
|
265,710
|
-0.2%
|
-0.6%
|
532,169
|
531,913
|
0.0%
|
|
Interest on bonds and subordinated notes
|
200,739
|
168,024
|
193,125
|
14.9%
|
-3.8%
|
397,369
|
361,150
|
-9.1%
|
|
Other interest expense
|
136,054
|
133,317
|
168,017
|
26.0%
|
23.5%
|
272,813
|
301,333
|
10.5%
|
|
Net Insurance Financial Expenses
|
124,686
|
135,622
|
139,055
|
2.5%
|
11.5%
|
246,690
|
274,676
|
11.3%
|
|
Net interest, similar income and expenses
|
3,468,464
|
3,572,012
|
3,615,371
|
1.2%
|
4.2%
|
6,894,587
|
7,187,383
|
4.2%
|
|
Provision for credit losses on loan portfolio, net of recoveries
|
1,093,371
|
581,893
|
575,159
|
-1.2%
|
-47.4%
|
1,908,070
|
1,157,052
|
-39.4%
|
|
Net interest, similar income and expenses, after provision for
credit losses on loan portfolio
|
2,375,093
|
2,990,119
|
3,040,212
|
1.7%
|
28.0%
|
4,986,517
|
6,030,331
|
20.9%
|
|
Average interest earning assets
|
227,161,179
|
238,435,117
|
233,761,957
|
-2.0%
|
2.9%
|
226,444,444
|
236,038,086
|
4.2%
|
|
Net interest margin (1)
|
6.3%
|
6.2%
|
6.4%
|
20 bps
|
9 bps
|
6.3%
|
6.3%
|
1 bps
|
|
Risk-adjusted Net interest margin (1)
|
4.4%
|
5.2%
|
5.4%
|
20 bps
|
104 bps
|
4.6%
|
5.3%
|
72 bps
|
|
Net provisions for loan losses / Net interest income (1)
|
31.5%
|
16.3%
|
15.9%
|
-38 bps
|
-1561 bps
|
27.7%
|
16.1%
|
-1157 bps
|
| (1) |
Annualized. For further detail on the NIM calculation due to IFRS17, please refer to Annex 12.8.
|
| 12.4. |
Net Interest Margin (NIM) and Risk-Adjusted NIM by Subsidiary
|
|
NIM Breakdown
|
BCP Stand-alone
|
Mibanco
|
BCP Bolivia
|
Credicorp
|
|
2Q24
|
6.08%
|
13.61%
|
3.03%
|
6.33%
|
|
1Q25
|
5.80%
|
13.94%
|
2.85%
|
6.22%
|
|
2Q25
|
6.00%
|
14.38%
|
2.57%
|
6.42%
|
|
Risk-Adjusted NIM
Breakdown
|
BCP
Stand-alone
|
Mibanco
|
BCP
Bolivia
|
Credicorp
|
|
2Q24
|
4.30%
|
7.67%
|
2.25%
|
4.40%
|
|
1Q25
|
4.98%
|
10.14%
|
2.62%
|
5.24%
|
|
2Q25
|
5.22%
|
10.34%
|
1.89%
|
5.44%
|
 |
|
|
|
|
|
|
| |
Earnings Release 2Q / 2025
|
Analysis of 2Q25 Consolidated Results
|
|
|
| 12.5. |
Physical Point of contact
|
|
Physical Point of Contact (1)
|
As of
|
Change (units)
|
|||
|
(Units)
|
Jun 24
|
Mar 25
|
Jun 25
|
QoQ
|
YoY
|
|
Branches (2)
|
650
|
648
|
649
|
1
|
-1
|
|
ATMs
|
2,737
|
2,787
|
2,763
|
(24)
|
26
|
|
Agents
|
11,328
|
12,448
|
12,386
|
(62)
|
1,058
|
|
Total
|
14,715
|
15,883
|
15,798
|
(85)
|
1,083
|
|
(1)
|
Includes Physical Point of Contact of BCP Stand-Alone, Mibanco and BCP Bolivia
|
|
(2)
|
Includes Banco de la Nacion branches, which in June 24 were 36, in March 25 were 36 and in June 25
were 36
|
| 12.6. |
Regulatory Capital
|
|
Regulatory
Capital and Capital Adequacy Ratios
|
As of
|
Change%
|
|||
|
S(000)
|
Jun 24
|
Mar 25
|
Jun 25
|
QoQ
|
YoY
|
|
Capital Stock
|
1,318,993
|
1,318,993
|
1,318,993
|
-
|
-
|
|
Treasury Stocks
|
(208,918)
|
(209,845)
|
(209,845)
|
0.0%
|
0.4%
|
|
Capital Surplus
|
172,303
|
124,148
|
133,387
|
7.4%
|
-22.6%
|
|
Legal and Other Capital reserves
|
28,008,038
|
32,792,830
|
29,602,851
|
-9.7%
|
5.7%
|
|
Minority interest
|
518,838
|
476,695
|
474,990
|
-0.4%
|
-8.5%
|
|
Current and Accumulated Earnings (1)
|
3,914,339
|
3,410,505
|
5,123,469
|
50.2%
|
30.9%
|
|
Unrealized Gains or Losses (2)
|
(936,472)
|
(462,800)
|
(246,716)
|
-46.7%
|
-73.7%
|
|
Goodwill
|
(763,671)
|
(1,698,492)
|
(1,692,823)
|
-0.3%
|
121.7%
|
|
Intangible Assets (3)
|
(2,151,581)
|
(2,590,377)
|
(2,655,440)
|
2.5%
|
23.4%
|
|
Deductions in Common Equity Tier 1 instruments (4)
|
(685,466)
|
(38,573)
|
(73,488)
|
90.5%
|
-89.3%
|
|
Subordinated Debt
|
5,896,957
|
7,892,454
|
7,240,645
|
-8.3%
|
22.8%
|
|
Loan loss reserves (5)
|
2,041,564
|
1,972,285
|
1,972,667
|
0.0%
|
-3.4%
|
|
Deductions in Tier 2 instruments (6)
|
(973,281)
|
(751,236)
|
(1,289,380)
|
71.6%
|
32.5%
|
|
Total Regulatory Capital (A)
|
36,151,641
|
42,236,587
|
39,699,311
|
-6.0%
|
9.8%
|
|
Total Regulatory Common Equity Tier 1 Capital (B)
|
29,186,401
|
33,123,084
|
31,775,379
|
-4.1%
|
8.9%
|
|
Total Regulatory Tier 1 Capital (C)
|
29,186,145
|
33,123,084
|
31,775,379
|
-4.1%
|
8.9%
|
|
Total Regulatory Capital Requirement (D)
|
27,146,595
|
30,571,363
|
29,484,940
|
-3.6%
|
8.6%
|
|
Total Regulatory Common Equity Tier 1 Capital Requirement (E)
|
13,975,808
|
15,997,614
|
15,535,244
|
-2.9%
|
11.2%
|
|
Total Regulatory Tier 1 Capital Requirement (F)
|
17,108,445
|
19,424,645
|
18,788,044
|
-3.3%
|
9.8%
|
|
Regulatory Capital Ratio (A) / (D)
|
133%
|
138%
|
135%
|
(351)
|
147 bps
|
|
Regulatory Common Equity Tier 1 Capital Ratio (B) / (E)
|
209%
|
207%
|
205%
|
(251)
|
-430 bps
|
|
Regulatory Tier 1 Capital Ratio (C) / (F)
|
171%
|
171%
|
169%
|
(140)
|
-147 bps
|
|
(1)
|
Earnings include Banco de Crédito del Perú and Mibanco Perú. Losses include all subsidiaries.
|
|
(2)
|
Gains include Investment Grade Government Bonds and Peruvian Central Bank Certificates of
Deposits. Losses include all bonds.
|
|
(3)
|
Different to Goodwill. Includes Diferred Tax Assets.
|
|
(4)
|
Investments in Equity.
|
|
(5)
|
Up to 1.25% of total risk-weighted assets of Banco de Crédito del Perú, Solución Empresa
Administradora Hipotecaria, Mibanco and Atlantic Security Bank.
|
|
(6)
|
Investments in Tier 2 Subordinated Debt.
|
 |
|
|
|
|
|
|
| |
Earnings Release 2Q / 2025
|
Analysis of 2Q25 Consolidated Results
|
|
|
|
Regulatory Capital
|
Quarter
|
Change %
|
|||
|
(S/ thousand)
|
Jun 24
|
Mar 25
|
Jun 25
|
QoQ
|
YoY
|
|
Capital Stock
|
12,973,175
|
12,973,175
|
12,973,175
|
0.0%
|
0.0%
|
|
Reserves
|
6,591,330
|
6,124,302
|
6,125,452
|
0.0%
|
-7.1%
|
|
Accumulated earnings
|
3,920,795
|
3,418,149
|
5,129,250
|
50.1%
|
30.8%
|
|
Loan loss reserves (1)
|
1,749,878
|
1,740,158
|
1,757,305
|
1.0%
|
0.4%
|
|
Subordinated Debt
|
5,171,850
|
7,152,600
|
6,552,700
|
-8.4%
|
26.7%
|
|
Unrealized Profit or Losses
|
(621,417)
|
(341,947)
|
(200,969)
|
-41.2%
|
-67.7%
|
|
Investment in subsidiaries and others, net of unrealized profit and net income in
subsidiaries
|
(2,465,969)
|
(2,310,402)
|
(2,380,842)
|
3.0%
|
-3.5%
|
|
Intangibles
|
(1,303,792)
|
(1,509,701)
|
(1,549,091)
|
2.6%
|
18.8%
|
|
Goodwill
|
(122,083)
|
(122,083)
|
(122,083)
|
0.0%
|
0.0%
|
|
Total Regulatory Capital
|
25,893,766
|
27,124,251
|
28,284,896
|
4.3%
|
9.2%
|
|
Tier 1 Common Equity (2)
|
18,972,038
|
18,231,493
|
19,974,891
|
9.6%
|
5.3%
|
|
Regulatory Tier 1 Capital (3)
|
18,972,038
|
18,231,493
|
19,974,891
|
9.6%
|
5.3%
|
|
Regulatory Tier 2 Capital (4)
|
6,921,728
|
8,892,758
|
8,310,005
|
-6.6%
|
20.1%
|
|
Total risk-weighted assets
|
Quarter
|
% Change
|
|||
|
(S/ thousand)
|
Jun 24
|
Mar 25
|
Jun 25
|
QoQ
|
YoY
|
|
Market risk-weighted assets
|
3,300,703
|
3,903,493
|
4,400,226
|
12.7%
|
33.3%
|
|
Credit risk-weighted assets
|
138,806,587
|
138,028,766
|
139,386,096
|
1.0%
|
0.4%
|
|
Operational risk-weighted assets
|
17,335,423
|
18,895,091
|
19,384,021
|
2.6%
|
11.8%
|
|
Total
|
159,442,714
|
160,827,350
|
163,170,343
|
1.5%
|
2.3%
|
|
Capital requirement
|
Quarter
|
% Change
|
|||
|
(S/ thousand)
|
Jun 24
|
Mar 25
|
Jun 25
|
QoQ
|
YoY
|
|
Market risk capital requirement
|
330,070
|
390,349
|
440,023
|
12.7%
|
33.3%
|
|
Credit risk capital requirement
|
12,492,593
|
13,802,877
|
13,938,610
|
1.0%
|
11.6%
|
|
Operational risk capital requirement
|
1,733,542
|
1,889,509
|
1,938,402
|
2.6%
|
11.8%
|
|
Additional capital requirements
|
5,709,468
|
7,057,150
|
7,142,933
|
1.2%
|
25.1%
|
|
Total
|
20,265,673
|
23,139,885
|
23,459,967
|
1.4%
|
15.8%
|
|
Capital ratios under Local Regulation
|
|
Quarter
|
% Change
|
||
|
Jun 24
|
Mar 25
|
Jun 25
|
QoQ
|
YoY
|
|
|
Common Equity Tier 1 ratio
|
11.90%
|
11.34%
|
12.24%
|
91 bps
|
34 bps
|
|
Tier 1 Capital ratio
|
11.90%
|
11.34%
|
12.24%
|
91 bps
|
34 bps
|
|
Regulatory Global Capital ratio
|
16.24%
|
16.87%
|
17.33%
|
47 bps
|
109 bps
|
 |
|
|
|
|
|
|
| |
Earnings Release 2Q / 2025
|
Analysis of 2Q25 Consolidated Results
|
|
|
|
Regulatory Capital
|
As of
|
% Change
|
|||
|
(S/ thousand)
|
Jun 24
|
Mar 25
|
Jun 25
|
QoQ
|
YoY
|
|
Capital Stock
|
1,840,606
|
1,840,606
|
1,840,606
|
0.0%
|
0.0%
|
|
Reserves
|
334,650
|
365,847
|
365,847
|
0.0%
|
9.3%
|
|
Accumulated earnings
|
356,449
|
168,090
|
238,272
|
41.8%
|
-33.2%
|
|
Loan loss reserves (1)
|
150,127
|
149,412
|
153,732
|
2.9%
|
2.4%
|
|
Perpetual subordinated debt
|
-
|
-
|
-
|
n.a
|
n.a.
|
|
Subordinated debt
|
167,000
|
267,000
|
261,000
|
-2.2%
|
56.3%
|
|
Unrealidez Profit or Losses
|
(600)
|
(4,037)
|
3,035
|
-175.2%
|
-605.6%
|
|
Investment in subsidiaries and others, net of unrealized profit and net income
in subsidiaries
|
(288)
|
(295)
|
(148)
|
-49.7%
|
-48.5%
|
|
Intangibles
|
(123,177)
|
(119,759)
|
(124,515)
|
4.0%
|
1.1%
|
|
Goodwill
|
(139,180)
|
(139,180)
|
(139,180)
|
0.0%
|
0.0%
|
|
Total Regulatory Capital
|
2,585,586
|
2,527,685
|
2,598,649
|
2.8%
|
0.5%
|
|
Tier Common Equity (2)
|
2,268,460
|
2,111,272
|
2,183,917
|
3.4%
|
-3.7%
|
|
Regulatory Tier 1 Capital (3)
|
2,268,460
|
2,111,272
|
2,183,917
|
3.4%
|
-3.7%
|
|
Regulatory Tier 2 Capital (4)
|
317,127
|
416,412
|
414,732
|
-0.4%
|
30.8%
|
|
Total risk-weighted assets
|
As of
|
% change
|
|||
|
(S/ thousand)
|
Jun 24
|
Mar 25
|
Jun 25
|
QoQ
|
YoY
|
|
Market risk-weighted assets
|
249,120
|
225,498
|
193,276
|
-14.3%
|
-22.4%
|
|
Credit risk-weighted assets
|
11,811,650
|
11,793,102
|
12,139,570
|
2.9%
|
2.8%
|
|
Operational risk-weighted assets
|
1,584,653
|
1,623,262
|
920,354
|
-43.3%
|
-41.9%
|
|
Total
|
13,645,422
|
13,641,862
|
13,253,200
|
-2.8%
|
-2.9%
|
|
Capital requirement
|
As of
|
% change
|
|||
|
(S/ thousand)
|
Jun 24
|
Mar 25
|
Jun 25
|
QoQ
|
YoY
|
|
Market risk capital requirement
|
24,912
|
22,550
|
19,328
|
-14.3%
|
-22.4%
|
|
Credit risk capital requirement
|
1,063,048
|
1,179,310
|
1,213,957
|
2.9%
|
14.2%
|
|
Operational risk capital requirement
|
158,465
|
162,326
|
92,035
|
-43.3%
|
-41.9%
|
|
Additional capital requirements
|
159,457
|
176,897
|
182,094
|
2.9%
|
14.2%
|
|
Total
|
1,405,883
|
1,541,083
|
1,507,414
|
-2.2%
|
7.2%
|
|
Capital ratios under Local Regulation
|
As of
|
% change
|
|||
|
Jun 24
|
Mar 25
|
Jun 25
|
QoQ
|
YoY
|
|
|
Common Equity Tier 1 Ratio
|
16.62%
|
15.48%
|
16.48%
|
100 bps
|
-15 bps
|
|
Tier 1 Capital ratio
|
16.62%
|
15.48%
|
16.48%
|
100 bps
|
-15 bps
|
|
Regulatory Global Capital Ratio
|
18.95%
|
18.53%
|
19.61%
|
108 bps
|
66 bps
|
 |
|
|
|
|
|
|
| |
Earnings Release 2Q / 2025
|
Analysis of 2Q25 Consolidated Results
|
|
|
|
Common Equity Tier 1 IFRS
|
As of
|
% Change
|
|||
|
(S/ thousand)
|
Jun 24
|
Mar 25
|
Jun 25
|
QoQ
|
YoY
|
|
Capital and reserves
|
19,052,262
|
18,585,234
|
18,586,384
|
0.0%
|
-2.4%
|
|
Retained earnings
|
4,674,213
|
4,176,630
|
5,926,516
|
41.9%
|
26.8%
|
|
Unrealized gains (losses)
|
(97,152)
|
140,002
|
282,927
|
102.1%
|
-391.2%
|
|
Goodwill and intangibles
|
(1,694,308)
|
(1,706,438)
|
(1,739,625)
|
1.9%
|
2.7%
|
|
Investments in subsidiaries
|
(2,602,553)
|
(2,416,979)
|
(2,463,279)
|
1.9%
|
-5.4%
|
|
Total
|
19,332,463
|
18,778,449
|
20,592,923
|
9.7%
|
6.5%
|
|
Adjusted RWAs IFRS
|
160,418,064
|
161,628,694
|
163,938,888
|
1.4%
|
2.2%
|
|
Adjusted Credit RWAs IFRS
|
139,781,938
|
138,830,109
|
140,154,641
|
1.0%
|
0.3%
|
|
Others
|
20,636,126
|
22,798,584
|
23,784,246
|
4.3%
|
15.3%
|
|
CET1 ratio IFRS
|
12.05%
|
11.62%
|
12.56%
|
94 bps
|
51 bps
|
|
Common Equity Tier 1 IFRS
|
As of
|
% Change
|
|||
|
(S/ thousand)
|
Jun 24
|
Mar 25
|
Jun 25
|
QoQ
|
YoY
|
|
Capital and reserves
|
2,703,385
|
2,734,582
|
2,734,582
|
0.0%
|
1.2%
|
|
Retained earnings
|
(26,918)
|
(247,483)
|
(202,552)
|
-18.2%
|
652.5%
|
|
Unrealized gains (losses)
|
(3,821)
|
(4,257)
|
2,712
|
-163.7%
|
-171.0%
|
|
Goodwill and intangibles
|
(355,382)
|
(292,948)
|
(296,719)
|
1.3%
|
-16.5%
|
|
Investments in subsidiaries
|
(281)
|
(299)
|
(152)
|
-49.1%
|
-45.8%
|
|
Total
|
2,316,984
|
2,189,595
|
2,237,872
|
2.2%
|
-3.4%
|
|
Adjusted RWAs IFRS
|
13,852,449
|
13,782,186
|
13,378,616
|
-2.9%
|
-3.4%
|
|
Adjusted Credit RWAs IFRS
|
12,013,076
|
11,933,425
|
12,264,985
|
2.8%
|
2.1%
|
|
Others
|
1,839,373
|
1,848,760
|
1,113,630
|
-39.8%
|
-39.5%
|
|
CET1 ratio IFRS
|
16.73%
|
15.89%
|
16.73%
|
84 bps
|
0 bps
|
 |
|
|
| |
Earnings Release 2Q / 2025
|
Analysis of 2Q25 Consolidated Results
|
| 12.7. |
Financial Statements and Ratios by Business
|
|
12.7.1.
|
Credicorp Consolidated
|
|
|
As of
|
% change
|
|||
|
|
Jun 24
|
Mar 25
|
Jun 25
|
QoQ
|
YoY
|
|
ASSETS
|
|
|
|
|
|
|
Cash and due from banks
|
|
|
|
|
|
|
Non-interest bearing
|
7,705,769
|
7,015,098
|
7,266,155
|
3.6%
|
-5.7%
|
|
Interest bearing
|
27,157,901
|
37,521,839
|
34,206,000
|
-8.8%
|
26.0%
|
|
Total cash and due from banks
|
34,863,670
|
44,536,937
|
41,472,155
|
-6.9%
|
19.0%
|
|
|
|
|
|
|
|
|
Cash collateral, reverse repurchase agreements and securities borrowing
|
1,777,491
|
1,835,893
|
4,593,501
|
150.2%
|
158.4%
|
|
Fair value through profit or loss investments
|
4,282,606
|
5,149,628
|
4,819,230
|
-6.4%
|
12.5%
|
|
Fair value through other comprehensive income investments
|
39,156,806
|
41,705,253
|
37,852,722
|
-9.2%
|
-3.3%
|
|
Amortized cost investments
|
8,986,734
|
8,749,729
|
8,931,495
|
2.1%
|
-0.6%
|
|
|
|
|
|
|
|
|
Loans
|
146,946,546
|
141,196,646
|
140,961,978
|
-0.2%
|
-4.1%
|
|
Current
|
140,715,785
|
135,990,251
|
135,917,766
|
-0.1%
|
-3.4%
|
|
Internal overdue loans
|
6,230,761
|
5,206,395
|
5,044,212
|
-3.1%
|
-19.0%
|
|
Less - allowance for loan losses
|
(8,350,024)
|
(7,742,792)
|
(7,658,595)
|
-1.1%
|
-8.3%
|
|
Loans, net
|
138,596,522
|
133,453,854
|
133,303,383
|
-0.1%
|
-3.8%
|
|
|
|
|
|
|
|
|
Financial assets designated at fair value through profit or loss
|
891,335
|
871,626
|
904,621
|
3.8%
|
1.5%
|
|
Property, plant and equipment, net
|
1,792,615
|
2,681,862
|
2,646,168
|
-1.3%
|
47.6%
|
|
Due from customers on acceptances
|
473,382
|
639,749
|
559,370
|
-12.6%
|
18.2%
|
|
Investments in associates
|
712,728
|
1,002
|
43,199
|
4211.3%
|
-93.9%
|
|
Intangible assets and goodwill, net
|
3,295,236
|
4,420,422
|
4,444,424
|
0.5%
|
34.9%
|
|
Reinsurance contract assets
|
959,661
|
976,832
|
949,932
|
-2.8%
|
-1.0%
|
|
Other assets (1)
|
12,278,373
|
9,049,787
|
8,510,166
|
-6.0%
|
-30.7%
|
|
|
|
|
|
|
|
|
Total Assets
|
248,067,159
|
254,072,574
|
249,030,366
|
-2.0%
|
0.4%
|
|
|
|
|
|
||
|
LIABILITIES AND EQUITY
|
|
|
|
|
|
|
Deposits and obligations
|
|
|
|
|
|
|
Non-interest bearing
|
43,190,989
|
49,620,679
|
45,734,508
|
-7.8%
|
5.9%
|
|
Interest bearing
|
108,780,995
|
107,998,403
|
108,988,826
|
0.9%
|
0.2%
|
|
Total deposits and obligations
|
151,971,984
|
157,619,082
|
154,723,334
|
-1.8%
|
1.8%
|
|
|
|
|
|
||
|
Payables from repurchase agreements and securities lending
|
7,689,689
|
10,158,614
|
11,265,393
|
10.9%
|
46.5%
|
|
BCRP instruments
|
5,542,892
|
7,064,476
|
5,096,459
|
-27.9%
|
-8.1%
|
|
Repurchase agreements with third parties
|
2,077,638
|
2,872,797
|
5,974,353
|
108.0%
|
187.6%
|
|
Repurchase agreements with customers
|
69,159
|
221,341
|
194,581
|
-12.1%
|
181.4%
|
|
|
|
|
|
||
|
Due to banks and correspondents
|
12,620,346
|
10,899,579
|
11,152,813
|
2.3%
|
-11.6%
|
|
Bonds and notes issued
|
17,953,508
|
14,391,733
|
12,112,403
|
-15.8%
|
-32.5%
|
|
Banker’s acceptances outstanding
|
473,382
|
639,749
|
559,370
|
-12.6%
|
18.2%
|
|
Insurance contract liability
|
12,814,831
|
13,725,052
|
13,804,935
|
0.6%
|
7.7%
|
|
Financial liabilities at fair value through profit or loss
|
811,015
|
736,192
|
840,022
|
14.1%
|
3.6%
|
|
Other liabilities
|
10,707,332
|
9,487,673
|
9,497,596
|
0.1%
|
-11.3%
|
|
|
|
|
|
||
|
Total Liabilities
|
215,042,087
|
217,657,674
|
213,955,866
|
-1.7%
|
-0.5%
|
|
|
|
|
|
||
|
Net equity
|
32,413,767
|
35,843,202
|
34,459,012
|
-3.9%
|
6.3%
|
|
Capital stock
|
1,318,993
|
1,318,993
|
1,318,993
|
0.0%
|
0.0%
|
|
Treasury stock
|
(208,918)
|
(209,845)
|
(209,845)
|
0.0%
|
0.4%
|
|
Capital surplus
|
172,303
|
124,149
|
133,388
|
7.4%
|
-22.6%
|
|
Reserves
|
28,008,038
|
32,792,830
|
29,602,851
|
-9.7%
|
5.7%
|
|
Other reserves
|
267,987
|
33,460
|
19,199
|
-42.6%
|
-92.8%
|
|
Retained earnings
|
2,855,364
|
1,783,615
|
3,594,426
|
101.5%
|
25.9%
|
|
|
|
|
|
||
|
Non-controlling interest
|
611,305
|
571,698
|
615,488
|
7.7%
|
0.7%
|
|
|
|
|
|
||
|
Total Net Equity
|
33,025,072
|
36,414,900
|
35,074,500
|
-3.7%
|
6.2%
|
|
|
|
|
|
||
|
Total liabilities and equity
|
248,067,159
|
254,072,574
|
249,030,366
|
-2.0%
|
0.4%
|
|
|
|
|
|
||
|
Off-balance sheet
|
164,970,468
|
144,439,635
|
144,197,254
|
-0.2%
|
-12.6%
|
|
Total performance bonds, stand-by and L/Cs.
|
20,671,941
|
20,843,657
|
21,026,042
|
0.9%
|
1.7%
|
|
Undrawn credit lines, advised but not committed
|
90,965,846
|
79,021,358
|
75,858,566
|
-4.0%
|
-16.6%
|
|
Total derivatives (notional) and others
|
53,332,681
|
44,574,620
|
47,312,646
|
6.1%
|
-11.3%
|
 |
|
|
|||
|
|
| |
Earnings Release 2Q / 2025
|
Analysis of 2Q25 Consolidated Results
|
|
Quarter
|
% change
|
Up to
|
% change
|
|||||
|
|
2Q24
|
2Q25
|
2Q25
|
QoQ
|
YoY
|
Jun 24
|
Jun 25
|
Jun 25 / Jun 24
|
|
Interest income and expense
|
|
|
|
|
|
|
|
|
|
Interest and similar income
|
4,935,238
|
4,894,790
|
4,922,292
|
0.6%
|
-0.3%
|
9,861,164
|
9,817,082
|
-0.4%
|
|
Interest and similar expenses
|
(1,466,774)
|
(1,322,778)
|
(1,306,921)
|
-1.2%
|
-10.9%
|
(2,966,577)
|
(2,629,699)
|
-11.4%
|
|
Net interest, similar income and expenses
|
3,468,464
|
3,572,012
|
3,615,371
|
1.2%
|
4.2%
|
6,894,587
|
7,187,383
|
4.2%
|
|
Provision for credit losses on loan portfolio
|
(1,193,548)
|
(695,733)
|
(683,965)
|
-1.7%
|
-42.7%
|
(2,103,737)
|
(1,379,698)
|
-34.4%
|
|
Recoveries of written-off loans
|
100,177
|
113,840
|
108,806
|
-4.4%
|
8.6%
|
195,667
|
222,646
|
13.8%
|
|
Provision for credit losses on loan portfolio, net of recoveries
|
(1,093,371)
|
(581,893)
|
(575,159)
|
-1.2%
|
-47.4%
|
(1,908,070)
|
(1,157,052)
|
-39.4%
|
|
Net interest, similar income and expenses, after provision for
credit losses on loan portfolio
|
2,375,093
|
2,990,119
|
3,040,212
|
1.7%
|
28.0%
|
4,986,517
|
6,030,331
|
20.9%
|
|
|
|
|
|
|
||||
|
Other income
|
|
|
|
|
||||
|
Fee income
|
947,228
|
994,024
|
1,024,553
|
3.1%
|
8.2%
|
1,803,793
|
2,018,577
|
11.9%
|
|
Net gain on foreign exchange transactions
|
349,349
|
343,814
|
377,016
|
9.7%
|
7.9%
|
654,719
|
720,830
|
10.1%
|
|
Net loss on securities
|
92,711
|
(28,149)
|
179,174
|
-736.5%
|
93.3%
|
154,456
|
151,025
|
-2.2%
|
|
Net gain from associates
|
28,728
|
24,068
|
6,556
|
-72.8%
|
-77.2%
|
61,023
|
30,624
|
-49.8%
|
|
Net gain (loss) on derivatives held for trading
|
41,748
|
18,499
|
21,418
|
15.8%
|
-48.7%
|
81,732
|
39,917
|
-51.2%
|
|
Net gain (loss) from exchange differences
|
(7,933)
|
15,959
|
10,195
|
-36.1%
|
-228.5%
|
(13,554)
|
26,154
|
-293.0%
|
|
Others
|
139,499
|
322,001
|
58,461
|
-81.8%
|
-58.1%
|
241,720
|
380,462
|
57.4%
|
|
Total other income
|
1,591,330
|
1,690,216
|
1,677,373
|
-0.8%
|
5.4%
|
2,983,889
|
3,367,589
|
12.9%
|
|
Insurance underwriting result
|
|
|
|
|
||||
|
Insurance Service Result
|
407,666
|
416,106
|
446,835
|
7.4%
|
9.6%
|
866,663
|
862,941
|
-0.4%
|
|
Reinsurance Result
|
(92,166)
|
(86,972)
|
(95,962)
|
10.3%
|
4.1%
|
(272,101)
|
(182,934)
|
-32.8%
|
|
Total insurance underwriting result
|
315,500
|
329,134
|
350,873
|
6.6%
|
11.2%
|
594,562
|
680,007
|
14.4%
|
|
|
|
|
|
|
||||
|
Medical services result
|
|
|
|
|
||||
|
Sales of medical services
|
-
|
78,121
|
473,746
|
506.4%
|
n.a.
|
-
|
551,867
|
n.a.
|
|
Cost of sales of medical services
|
-
|
(35,432)
|
(350,427)
|
889.0%
|
n.a.
|
-
|
(385,859)
|
n.a.
|
|
Total medical services result
|
-
|
42,689
|
123,319
|
188.9%
|
n.a.
|
-
|
166,008
|
n.a.
|
|
|
|
|
|
|
||||
|
Total Expenses
|
|
|
|
|
||||
|
Salaries and employee benefits
|
(1,141,823)
|
(1,361,690)
|
(1,262,520)
|
-7.3%
|
10.6%
|
(2,248,892)
|
(2,624,210)
|
16.7%
|
|
Administrative, general and tax expenses
|
(947,558)
|
(869,834)
|
(965,994)
|
11.1%
|
1.9%
|
(1,769,306)
|
(1,835,828)
|
3.8%
|
|
Depreciation and amortization
|
(172,204)
|
(203,766)
|
(212,662)
|
4.4%
|
23.5%
|
(347,350)
|
(416,428)
|
19.9%
|
|
Impairment loss on goodwill
|
-
|
-
|
-
|
n.a.
|
n.a.
|
-
|
-
|
n.a.
|
|
Association in participation
|
(9,200)
|
(6,799)
|
(371)
|
-94.5%
|
-96.0%
|
(18,047)
|
(7,170)
|
-60.3%
|
|
Other expenses
|
(124,420)
|
(90,785)
|
(188,763)
|
107.9%
|
51.7%
|
(224,092)
|
(279,548)
|
24.7%
|
|
Total expenses
|
(2,395,205)
|
(2,532,874)
|
(2,630,310)
|
3.8%
|
9.8%
|
(4,607,687)
|
(5,163,184)
|
12.1%
|
|
|
|
|
|
|
||||
|
Profit before income tax
|
1,886,718
|
2,519,284
|
2,561,467
|
1.7%
|
35.8%
|
3,957,281
|
5,080,751
|
28.4%
|
|
|
|
|
|
|
||||
|
Income tax
|
(519,344)
|
(704,469)
|
(696,969)
|
-1.1%
|
34.2%
|
(1,047,810)
|
(1,401,438)
|
33.7%
|
|
|
|
|
|
|
||||
|
Net profit
|
1,367,374
|
1,814,815
|
1,864,498
|
2.7%
|
36.4%
|
2,909,471
|
3,679,313
|
26.5%
|
|
Non-controlling interest
|
28,278
|
37,118
|
42,483
|
14.5%
|
50.2%
|
58,718
|
79,601
|
35.6%
|
|
Net profit attributable to Credicorp
|
1,339,096
|
1,777,697
|
1,822,015
|
2.5%
|
36.1%
|
2,850,753
|
3,599,712
|
26.3%
|
 |
|
|
|||
|
|
| |
Earnings Release 2Q / 2025
|
Analysis of 2Q25 Consolidated Results
|
|
12.7.2.
|
Credicorp Stand-alone
|
|
|
As of
|
% change
|
|||
|
|
Jun 24
|
Mar 25
|
Jun 25
|
QoQ
|
YoY
|
|
ASSETS
|
|
|
|
|
|
|
Cash and cash equivalents
|
265,981
|
399,817
|
399,817
|
0.0%
|
50.3%
|
|
At fair value through profit or loss
|
-
|
-
|
-
|
n.a.
|
n.a.
|
|
Fair value through other comprehensive income investments
|
1,455,030
|
1,232,139
|
109,057
|
-91.1%
|
-92.5%
|
|
In subsidiaries and associates investments
|
36,415,839
|
39,435,439
|
38,318,421
|
-2.8%
|
5.2%
|
|
Investments at amortized cost
|
668,698
|
686,418
|
686,418
|
0.0%
|
2.6%
|
|
Other assets
|
1,560
|
250,990
|
9,359
|
-96.3%
|
n.a.
|
|
Total Assets
|
38,807,108
|
42,004,803
|
38,578,179
|
-8.2%
|
-0.6%
|
|
|
|
|
|
|
|
|
LIABILITIES AND NET SHAREHOLDERS' EQUITY
|
|
|
|
|
|
|
Due to banks, correspondents and other entities
|
-
|
-
|
-
|
n.a.
|
n.a.
|
|
Bonds and notes issued
|
1,859,959
|
1,796,058
|
-
|
n.a.
|
n.a.
|
|
Other liabilities
|
214,061
|
276,279
|
150,294
|
-45.6%
|
-29.8%
|
|
Total Liabilities
|
2,074,020
|
2,072,337
|
150,294
|
-92.7%
|
-92.8%
|
|
|
|
|
|
|
|
|
NET EQUITY
|
|
|
|
||
|
Capital stock
|
1,318,993
|
1,318,993
|
1,318,993
|
0.0%
|
0.0%
|
|
Capital Surplus
|
384,542
|
384,542
|
384,542
|
0.0%
|
0.0%
|
|
Reserve
|
27,689,804
|
32,291,005
|
28,465,226
|
-11.8%
|
2.8%
|
|
Unrealized results
|
40,503
|
(245,864)
|
(323,985)
|
n.a.
|
n.a.
|
|
Retained earnings
|
7,299,246
|
6,183,790
|
8,583,109
|
38.8%
|
17.6%
|
|
Total net equity
|
36,733,088
|
39,932,466
|
38,427,885
|
-3.8%
|
4.6%
|
|
|
|
|
|
|
|
|
Total Liabilities And Equity
|
38,807,108
|
42,004,803
|
38,578,179
|
-8.2%
|
-0.6%
|
|
|
Quarter
|
% Change
|
Up to
|
% Change
|
||||
|
|
2Q24
|
1Q25
|
2Q25
|
QoQ
|
YoY
|
Jun 24
|
Jun 25
|
Jun 25 / Jun 24
|
|
Interest income
|
|
|
|
|
|
|
|
|
|
Net share of the income from investments in subsidiaries and associates
|
1,899,078
|
1,660,468
|
2,490,226
|
50.0%
|
31.1%
|
3,456,472
|
4,150,694
|
20.1%
|
|
Interest and similar income
|
28,052
|
21,312
|
19,281
|
-9.5%
|
-31.3%
|
46,777
|
40,593
|
-13.2%
|
|
Net gain on financial assets at fair value through profit or loss
|
-
|
-
|
-
|
n.a.
|
n.a.
|
1,234
|
-
|
n.a.
|
|
Total income
|
1,927,130
|
1,681,780
|
2,509,507
|
49.2%
|
30.2%
|
3,504,483
|
4,191,287
|
19.6%
|
|
|
|
|
|
|
|
|
||
|
Interest and similar expense
|
(13,508)
|
(13,129)
|
(11,388)
|
-13.3%
|
-15.7%
|
(27,073)
|
(24,517)
|
-9.4%
|
|
Administrative and general expenses
|
(5,115)
|
(4,958)
|
(5,211)
|
5.1%
|
1.9%
|
(9,916)
|
(10,169)
|
2.6%
|
|
Total expenses
|
(18,623)
|
(18,087)
|
(16,599)
|
-8.2%
|
-10.9%
|
(36,989)
|
(34,686)
|
-6.2%
|
|
|
|
|
|
|
|
|
||
|
Operating income
|
1,908,507
|
1,663,693
|
2,492,908
|
49.8%
|
30.6%
|
3,467,494
|
4,156,601
|
19.9%
|
|
|
|
|
|
|
|
|
||
|
Results from exchange differences
|
(2,830)
|
65
|
(3,468)
|
n.a.
|
22.5%
|
(2,737)
|
(3,403)
|
24.3%
|
|
Other, net
|
(29)
|
(295)
|
(121)
|
n.a.
|
n.a.
|
n.a.
|
n.a.
|
n.a.
|
|
|
|
|
|
|
|
|
||
|
Profit before income tax
|
1,905,648
|
1,663,463
|
2,489,319
|
49.6%
|
30.6%
|
3,464,839
|
4,152,782
|
19.9%
|
|
Income tax
|
(51,879)
|
(45,071)
|
(52,310)
|
n.a.
|
0.8%
|
(94,983)
|
(97,381)
|
2.5%
|
|
Net income
|
1,853,769
|
1,618,392
|
2,437,009
|
50.6%
|
31.5%
|
3,369,856
|
4,055,401
|
20.3%
|
|
|
|
|
|
|||||
|
Double Leverage Ratio
|
99.1%
|
98.8%
|
99.7%
|
96 bps
|
58 bps
|
99.1%
|
99.7%
|
58 bps
|
 |
|
|
| |
Earnings Release 2Q / 2025
|
Analysis of 2Q25 Consolidated Results
|
|
12.7.3
|
BCP Consolidated
|
(S/ Thousands, IFRS)
|
|
As of
|
% change
|
|||
|
|
Jun 24
|
Mar 25
|
Jun 25
|
QoQ
|
YoY
|
|
ASSETS
|
|
|
|
|
|
|
Cash and due from banks
|
|
|
|
|
|
|
Non-interest bearing
|
5,464,859
|
5,330,664
|
5,990,377
|
12.4%
|
9.6%
|
|
Interest bearing
|
26,093,132
|
35,977,823
|
32,653,406
|
-9.2%
|
25.1%
|
|
Total cash and due from banks
|
31,557,991
|
41,308,487
|
38,643,783
|
-6.5%
|
22.5%
|
|
|
|
|
|
|
|
|
Cash collateral, reverse repurchase agreements and securities borrowing
|
839,649
|
776,081
|
574,653
|
-26.0%
|
-31.6%
|
|
|
|
|
|
|
|
|
Fair value through profit or loss investments
|
439,004
|
537,503
|
617,368
|
14.9%
|
40.6%
|
|
Fair value through other comprehensive income investments
|
22,661,943
|
24,940,660
|
21,881,734
|
-12.3%
|
-3.4%
|
|
Amortized cost investments
|
8,321,181
|
8,134,166
|
8,262,941
|
1.6%
|
-0.7%
|
|
|
|
|
|
|
|
|
Loans
|
132,958,919
|
131,470,639
|
133,011,844
|
1.2%
|
0.0%
|
|
Current
|
127,103,518
|
126,570,181
|
128,218,187
|
1.3%
|
0.9%
|
|
Internal overdue loans
|
5,855,401
|
4,900,458
|
4,793,657
|
-2.2%
|
-18.1%
|
|
Less - allowance for loan losses
|
(7,799,646)
|
(7,323,541)
|
(7,310,931)
|
-0.2%
|
-6.3%
|
|
Loans, net
|
125,159,273
|
124,147,098
|
125,700,913
|
1.3%
|
0.4%
|
|
|
|
|
|
|
|
|
Property, furniture and equipment, net (1)
|
1,490,388
|
1,643,626
|
1,604,393
|
-2.4%
|
7.6%
|
|
Due from customers on acceptances
|
473,382
|
639,749
|
559,370
|
-12.6%
|
18.2%
|
|
Investments in associates
|
26,754
|
24,738
|
22,452
|
-9.2%
|
-16.1%
|
|
Other assets (2)
|
11,820,436
|
8,045,520
|
6,811,768
|
-15.3%
|
-42.4%
|
|
|
|
|
|
|
|
|
Total Assets
|
202,790,001
|
210,197,628
|
204,679,375
|
-2.6%
|
0.9%
|
|
|
|
|
|
|
|
|
Liabilities and Equity
|
|
|
|
|
|
|
Deposits and obligations
|
|
|
|
|
|
|
Non-interest bearing
|
41,187,095
|
46,181,912
|
44,615,769
|
-3.4%
|
8.3%
|
|
Interest bearing
|
96,391,919
|
100,410,686
|
102,043,442
|
1.6%
|
5.9%
|
|
Total deposits and obligations
|
137,579,014
|
146,592,598
|
146,659,211
|
0.0%
|
6.6%
|
|
|
|
|
|
|
|
|
Payables from repurchase agreements and securities lending
|
6,095,858
|
7,892,912
|
5,968,190
|
-24.4%
|
-2.1%
|
|
BCRP instruments
|
5,542,892
|
7,064,476
|
5,096,459
|
-27.9%
|
-8.1%
|
|
Repurchase agreements with third parties
|
552,966
|
828,436
|
871,731
|
5.2%
|
57.6%
|
|
|
|
|
|
|
|
|
Due to banks and correspondents
|
12,141,299
|
10,314,235
|
10,402,291
|
0.9%
|
-14.3%
|
|
Bonds and notes issued
|
14,284,148
|
10,759,498
|
10,170,286
|
-5.5%
|
-28.8%
|
|
Banker’s acceptances outstanding
|
473,382
|
639,749
|
559,370
|
-12.6%
|
18.2%
|
|
Financial liabilities at fair value through profit or loss
|
468,746
|
367,988
|
387,867
|
5.4%
|
-17.3%
|
|
Other liabilities (3)
|
7,978,251
|
10,599,135
|
5,604,105
|
-47.1%
|
-29.8%
|
|
Total Liabilities
|
179,020,698
|
187,166,115
|
179,751,320
|
-4.0%
|
0.4%
|
|
|
|
|
|
|
|
|
Net equity
|
23,624,852
|
22,896,863
|
24,790,836
|
8.3%
|
4.9%
|
|
Capital stock
|
12,679,794
|
12,679,794
|
12,679,794
|
0.0%
|
0.0%
|
|
Reserves
|
6,372,468
|
5,905,440
|
5,906,590
|
0.0%
|
-7.3%
|
|
Unrealized gains and losses
|
(95,961)
|
141,193
|
284,780
|
101.7%
|
n.a.
|
|
Retained earnings
|
4,668,551
|
4,170,436
|
5,919,672
|
41.9%
|
26.8%
|
|
|
|
|
|
|
|
|
Non-controlling interest
|
144,451
|
134,650
|
137,219
|
1.9%
|
-5.0%
|
|
|
|
|
|
|
|
|
Total Net Equity
|
23,769,303
|
23,031,513
|
24,928,055
|
8.2%
|
4.9%
|
|
|
|
|
|
|
|
|
Total liabilities and equity
|
202,790,001
|
210,197,628
|
204,679,375
|
-2.6%
|
0.9%
|
|
|
|
|
|
|
|
|
Off-balance sheet
|
152,205,005
|
136,896,925
|
139,056,539
|
1.6%
|
-8.6%
|
|
Total performance bonds, stand-by and L/Cs.
|
20,008,285
|
20,571,287
|
20,908,399
|
1.6%
|
4.5%
|
|
Undrawn credit lines, advised but not committed
|
79,567,802
|
72,392,139
|
71,484,467
|
-1.3%
|
-10.2%
|
|
Total derivatives (notional) and others
|
52,628,918
|
43,933,499
|
46,663,673
|
6.2%
|
-11.3%
|
 |
|
|
| |
Earnings Release 2Q / 2025
|
Analysis of 2Q25 Consolidated Results
|
|
|
Quarter
|
% change
|
Up to
|
% Change
|
||||
|
|
2Q24
|
1Q25
|
2Q25
|
QoQ
|
YoY
|
Jun 24
|
Jun 25
|
Jun 25 / Jun 24
|
|
Interest income and expense
|
|
|
|
|
|
|
||
|
Interest and similar income
|
4,321,539
|
4,260,384
|
4,309,923
|
1.2%
|
-0.3%
|
8,600,440
|
8,570,307
|
-0.4%
|
|
Interest and similar expense (1)
|
(1,101,415)
|
(975,337)
|
(953,011)
|
-2.3%
|
-13.5%
|
(2,221,073)
|
(1,928,348)
|
-13.2%
|
|
Interest income and expense
|
3,220,124
|
3,285,047
|
3,356,912
|
2.2%
|
4.2%
|
6,379,367
|
6,641,959
|
4.1%
|
|
|
|
|
|
|
|
|
|
|
|
Provision for credit losses on loan portfolio
|
(1,117,597)
|
(648,883)
|
(633,987)
|
-2.3%
|
-43.3%
|
(1,961,748)
|
(1,282,870)
|
-34.6%
|
|
Recoveries of written-off loans
|
95,174
|
108,978
|
105,024
|
-3.6%
|
10.3%
|
185,972
|
214,002
|
15.1%
|
|
Provision for credit losses on loan portfolio, net of recoveries
|
(1,022,423)
|
(539,905)
|
(528,963)
|
-2.0%
|
-48.3%
|
(1,775,776)
|
(1,068,868)
|
-39.8%
|
|
|
|
|
|
|
|
|
|
|
|
Net interest, similar income and expenses, after provision for credit losses on loan portfolio
|
2,197,701
|
2,745,142
|
2,827,949
|
3.0%
|
28.7%
|
4,603,591
|
5,573,091
|
21.1%
|
|
|
|
|
|
|
|
|
|
|
|
Other income
|
|
|
|
|
|
|
|
|
|
Fee income
|
764,394
|
860,089
|
881,866
|
2.5%
|
15.4%
|
1,494,094
|
1,741,955
|
16.6%
|
|
Net gain on foreign exchange transactions
|
291,722
|
305,799
|
349,277
|
14.2%
|
19.7%
|
553,604
|
655,076
|
18.3%
|
|
Net gain (loss) on securities
|
33,920
|
11,361
|
121,126
|
n.a.
|
n.a.
|
23,391
|
132,487
|
n.a.
|
|
Net gain on derivatives held for trading
|
21,197
|
14,635
|
30,207
|
106.4%
|
42.5%
|
39,153
|
44,842
|
14.5%
|
|
Net loss (gain) from exchange differences
|
723
|
784
|
7,541
|
n.a.
|
n.a.
|
7,249
|
8,325
|
14.8%
|
|
Others
|
74,705
|
23,975
|
30,424
|
26.9%
|
-59.3%
|
131,641
|
54,399
|
-58.7%
|
|
Total other income
|
1,186,661
|
1,216,643
|
1,420,441
|
16.8%
|
19.7%
|
2,249,132
|
2,637,084
|
17.2%
|
|
|
|
|
|
|
|
|
|
|
|
Total expenses
|
|
|
|
|
|
|
|
|
|
Salaries and employee benefits
|
(821,206)
|
(979,534)
|
(951,711)
|
-2.8%
|
15.9%
|
(1,616,775)
|
(1,931,245)
|
19.5%
|
|
Administrative expenses
|
(712,685)
|
(628,741)
|
(732,854)
|
16.6%
|
2.8%
|
(1,342,699)
|
(1,361,595)
|
1.4%
|
|
Depreciation and amortization (2)
|
(140,270)
|
(168,136)
|
(176,020)
|
4.7%
|
25.5%
|
(282,540)
|
(344,156)
|
21.8%
|
|
Other expenses
|
(63,530)
|
(53,526)
|
(57,092)
|
6.7%
|
-10.1%
|
(116,504)
|
(110,618)
|
-5.1%
|
|
Total expenses
|
(1,737,691)
|
(1,829,937)
|
(1,917,677)
|
4.8%
|
10.4%
|
(3,358,518)
|
(3,747,614)
|
11.6%
|
|
|
|
|
|
|
|
|
|
|
|
Profit before income tax
|
1,646,671
|
2,131,848
|
2,330,713
|
9.3%
|
41.5%
|
3,494,205
|
4,462,561
|
27.7%
|
|
|
|
|
|
|
|
|
|
|
|
Income tax
|
(399,971)
|
(549,462)
|
(576,345)
|
4.9%
|
44.1%
|
(862,549)
|
(1,125,807)
|
30.5%
|
|
|
|
|
|
|
|
|
|
|
|
Net profit
|
1,246,700
|
1,582,386
|
1,754,368
|
10.9%
|
40.7%
|
2,631,656
|
3,336,754
|
26.8%
|
|
Non-controlling interest
|
(1,749)
|
(4,721)
|
(5,135)
|
8.8%
|
193.6%
|
(6,379)
|
(9,856)
|
54.5%
|
|
Net profit attributable to BCP Consolidated
|
1,244,951
|
1,577,665
|
1,749,233
|
10.9%
|
40.5%
|
2,625,277
|
3,326,898
|
26.7%
|
|
|
|
Quarter
|
|
Change
|
|
|
|
2Q24
|
1Q25
|
2Q25
|
QoQ
|
YoY
|
|
Profitability
|
|
|
|
|
|
|
ROAA (1)(2)
|
2.5%
|
3.0%
|
3.4%
|
37 bps
|
88 bps
|
|
ROAE (1)(2)
|
21.7%
|
25.8%
|
29.3%
|
354 bps
|
767 bps
|
|
Net interest margin (1)(2)
|
6.77%
|
6.48%
|
6.73%
|
25 bps
|
-3 bps
|
|
Risk-adjusted Net interest margin (1)(2)
|
4.62%
|
5.42%
|
5.67%
|
25 bps
|
105 bps
|
|
Funding cost (1)(2)(3)
|
2.63%
|
2.20%
|
2.20%
|
0 bps
|
-43 bps
|
|
|
|
|
|
|
|
|
Loan portfolio quality
|
|
|
|
|
|
|
Internal overdue ratio
|
4.4%
|
3.7%
|
3.6%
|
-12 bps
|
-80 bps
|
|
NPL ratio
|
6.3%
|
5.2%
|
5.0%
|
-18 bps
|
-126 bps
|
|
Coverage ratio of IOLs
|
133.2%
|
149.4%
|
152.5%
|
307 bps
|
1931 bps
|
|
Coverage ratio of NPLs
|
93.6%
|
107.5%
|
109.8%
|
232 bps
|
1625 bps
|
|
Cost of risk (4)
|
3.1%
|
1.6%
|
1.6%
|
-4 bps
|
-154 bps
|
|
|
|
|
|
|
|
|
Operating efficiency
|
|
|
|
|
|
|
Operating expenses / Total income (5)
|
39.0%
|
39.8%
|
40.2%
|
45 bps
|
127 bps
|
|
Operating expenses / Total average assets (1)(2)(5)
|
3.4%
|
3.4%
|
3.6%
|
21 bps
|
23 bps
|
 |
|
|
| |
Earnings Release 2Q / 2025
|
Analysis of 2Q25 Consolidated Results
|
|
12.7.4.
|
BCP Stand-alone
|
|
|
As of
|
% change
|
|||
|
|
Jun 24
|
Mar 25
|
Jun 25
|
QoQ
|
YoY
|
|
ASSETS
|
|
|
|
|
|
|
Cash and due from banks
|
|
|
|
|
|
|
Non-interest bearing
|
4,832,098
|
4,776,238
|
5,338,286
|
11.8%
|
10.5%
|
|
Interest bearing
|
25,834,580
|
34,709,343
|
31,838,979
|
-8.3%
|
23.2%
|
|
Total cash and due from banks
|
30,666,678
|
39,485,581
|
37,177,265
|
-5.8%
|
21.2%
|
|
|
|
|
|
|
|
|
Cash collateral, reverse repurchase agreements and securities borrowing
|
839,649
|
776,081
|
574,653
|
-26.0%
|
-31.6%
|
|
|
|
|
|
|
|
|
Fair value through profit or loss investments
|
439,004
|
537,503
|
617,368
|
14.9%
|
40.6%
|
|
Fair value through other comprehensive income investments
|
19,504,805
|
21,877,682
|
19,097,277
|
-12.7%
|
-2.1%
|
|
Amortized cost investments
|
8,258,140
|
8,072,234
|
8,169,062
|
1.2%
|
-1.1%
|
|
|
|
|
|
|
|
|
Loans
|
121,055,851
|
119,378,598
|
120,998,975
|
1.4%
|
0.0%
|
|
Current
|
116,139,749
|
115,180,766
|
116,868,257
|
1.5%
|
0.6%
|
|
Internal overdue loans
|
4,916,102
|
4,197,832
|
4,130,718
|
-1.6%
|
-16.0%
|
|
Less - allowance for loan losses
|
(6,809,141)
|
(6,453,864)
|
(6,418,672)
|
-0.5%
|
-5.7%
|
|
Loans, net
|
114,246,710
|
112,924,734
|
114,580,303
|
1.5%
|
0.3%
|
|
|
|
|
|
|
|
|
Property, furniture and equipment, net (1)
|
1,250,424
|
1,428,475
|
1,395,819
|
-2.3%
|
11.6%
|
|
Due from customers on acceptances
|
473,382
|
639,749
|
559,370
|
-12.6%
|
18.2%
|
|
Investments in associates
|
2,613,220
|
2,431,259
|
2,478,728
|
2.0%
|
-5.1%
|
|
Other assets (2)
|
10,988,530
|
7,642,354
|
6,772,832
|
-11.4%
|
-38.4%
|
|
|
|
|
|
|
|
|
Total Assets
|
189,280,542
|
195,815,652
|
191,422,677
|
-2.2%
|
1.1%
|
|
|
|
|
|
|
|
|
Liabilities and Equity
|
|
|
|
|
|
|
Deposits and obligations
|
|
|
|
|
|
|
Non-interest bearing
|
41,171,770
|
46,158,361
|
44,639,208
|
-3.3%
|
8.4%
|
|
Interest bearing
|
85,955,135
|
89,206,307
|
91,339,219
|
2.4%
|
6.3%
|
|
Total deposits and obligations
|
127,126,905
|
135,364,668
|
135,978,427
|
0.5%
|
7.0%
|
|
|
|
|
|
|
|
|
Payables from repurchase agreements and securities lending
|
5,526,878
|
7,070,379
|
5,227,145
|
-26.1%
|
-5.4%
|
|
BCRP instruments
|
4,973,913
|
6,241,943
|
4,355,414
|
-30.2%
|
-12.4%
|
|
Repurchase agreements with third parties
|
552,965
|
828,436
|
871,731
|
5.2%
|
57.6%
|
|
|
|
|
|
|
|
|
Due to banks and correspondents
|
10,892,721
|
9,007,034
|
8,935,346
|
-0.8%
|
-18.0%
|
|
Bonds and notes issued
|
13,711,522
|
10,350,044
|
9,772,249
|
-5.6%
|
-28.7%
|
|
Due from customers on acceptances
|
473,382
|
639,749
|
559,370
|
-12.6%
|
18.2%
|
|
Financial liabilities at fair value through profit or loss
|
468,746
|
367,988
|
387,867
|
5.4%
|
-17.3%
|
|
Other liabilities (3)
|
7,451,061
|
10,113,925
|
5,766,446
|
-43.0%
|
-22.6%
|
|
Total Liabilities
|
165,651,215
|
172,913,787
|
166,626,850
|
-3.6%
|
0.6%
|
|
|
|
|
|
|
|
|
|
|
|
|
|
|
|
Net equity
|
23,629,323
|
22,901,866
|
24,795,827
|
8.3%
|
4.9%
|
|
Capital stock
|
12,679,794
|
12,679,794
|
12,679,794
|
0.0%
|
0.0%
|
|
Reserves
|
6,372,468
|
5,905,440
|
5,906,590
|
0.0%
|
-7.3%
|
|
Unrealized gains and losses
|
(97,152)
|
140,002
|
282,927
|
n.a.
|
n.a.
|
|
Retained earnings
|
4,674,213
|
4,176,630
|
5,926,516
|
41.9%
|
26.8%
|
|
|
|
|
|
|
|
|
|
|
|
|
|
|
|
Total Net Equity
|
23,629,323
|
22,901,866
|
24,795,827
|
8.3%
|
4.9%
|
|
|
|
|
|
|
|
|
Total liabilities and equity
|
189,280,538
|
195,815,653
|
191,422,677
|
-2.2%
|
1.1%
|
|
|
|
|
|
|
|
|
Off-balance sheet
|
147,994,313
|
133,060,043
|
135,664,961
|
2.0%
|
-8.3%
|
|
Total performance bonds, stand-by and L/Cs.
|
20,008,285
|
20,571,287
|
20,908,399
|
1.6%
|
4.5%
|
|
Undrawn credit lines, advised but not committed
|
77,032,694
|
69,917,928
|
68,251,113
|
-2.4%
|
-11.4%
|
|
Total derivatives (notional) and others
|
50,953,334
|
42,570,828
|
46,505,449
|
9.2%
|
-8.7%
|
 |
|
|
| |
Earnings Release 2Q / 2025
|
Analysis of 2Q25 Consolidated Results
|
|
|
Quarter
|
% Change
|
Up to
|
% Change
|
||||
|
|
2Q24
|
1Q25
|
2Q25
|
QoQ
|
YoY
|
Jun 24
|
Jun 25
|
Jun 25 / Jun 24
|
|
Interest income and expense
|
|
|
|
|
|
|
||
|
Interest and similar income
|
3,565,956
|
3,519,001
|
3,535,213
|
0.5%
|
-0.9%
|
7,088,663
|
7,054,214
|
-0.5%
|
|
Interest and similar expenses (1)
|
(904,173)
|
(814,465)
|
(783,739)
|
-3.8%
|
-13.3%
|
(1,815,872)
|
(1,598,204)
|
-12.0%
|
|
Interest income and expense
|
2,661,783
|
2,704,536
|
2,751,474
|
1.7%
|
3.4%
|
5,272,791
|
5,456,010
|
3.5%
|
|
|
|
|
|
|
|
|
|
|
|
Provision for credit losses on loan portfolio
|
(844,236)
|
(467,002)
|
(441,020)
|
-5.6%
|
-47.8%
|
(1,501,620)
|
(908,022)
|
-39.5%
|
|
Recoveries of written-off loans
|
64,914
|
84,839
|
81,258
|
-4.2%
|
25.2%
|
120,234
|
166,097
|
38.1%
|
|
Provision for credit losses on loan portfolio, net of recoveries
|
(779,322)
|
(382,163)
|
(359,762)
|
-5.9%
|
-53.8%
|
(1,381,386)
|
(741,925)
|
-46.3%
|
|
|
|
|
|
|
|
|
|
|
|
Net interest, similar income and expenses, after provision for credit losses on loan
portfolio
|
1,882,461
|
2,322,373
|
2,391,712
|
3.0%
|
27.1%
|
3,891,405
|
4,714,085
|
21.1%
|
|
|
|
|
|
|
|
|
|
|
|
Other income
|
|
|
|
|
|
|
|
|
|
Fee income
|
742,354
|
831,427
|
853,720
|
2.7%
|
15.0%
|
1,446,982
|
1,685,147
|
16.5%
|
|
Net gain on foreign exchange transactions
|
289,381
|
303,693
|
347,077
|
14.3%
|
19.9%
|
548,440
|
650,770
|
18.7%
|
|
Net gain on securities
|
66,080
|
100,397
|
215,491
|
114.6%
|
226.1%
|
144,061
|
315,888
|
119.3%
|
|
Net gain (loss) from associates
|
2,647
|
1,509
|
1,352
|
-10.4%
|
-48.9%
|
2,112
|
2,861
|
35.5%
|
|
Net gain on derivatives held for trading
|
17,151
|
13,752
|
35,945
|
161.4%
|
109.6%
|
35,877
|
49,697
|
38.5%
|
|
Net loss (gain) from exchange differences
|
6,109
|
1,549
|
1,622
|
4.7%
|
-73.4%
|
15,096
|
3,171
|
-79.0%
|
|
Others
|
72,302
|
23,180
|
27,968
|
20.7%
|
-61.3%
|
117,289
|
51,148
|
-56.4%
|
|
Total other income
|
1,196,024
|
1,275,507
|
1,483,175
|
16.3%
|
24.0%
|
2,309,857
|
2,758,682
|
19.4%
|
|
|
|
|
|
|
|
|
|
|
|
Total expenses
|
|
|
|
|
|
|
|
|
|
Salaries and employee benefits
|
(623,526)
|
(745,935)
|
(721,895)
|
-3.2%
|
15.8%
|
(1,212,270)
|
(1,467,830)
|
21.1%
|
|
Administrative expenses
|
(637,878)
|
(562,439)
|
(655,997)
|
16.6%
|
2.8%
|
(1,193,067)
|
(1,218,436)
|
2.1%
|
|
Depreciation and amortization (2)
|
(117,218)
|
(145,142)
|
(152,670)
|
5.2%
|
30.2%
|
(236,243)
|
(297,812)
|
26.1%
|
|
Other expenses
|
(57,643)
|
(48,353)
|
(51,591)
|
6.7%
|
-10.5%
|
(103,597)
|
(99,944)
|
-3.5%
|
|
Total expenses
|
(1,436,265)
|
(1,501,869)
|
(1,582,153)
|
5.3%
|
10.2%
|
(2,745,177)
|
(3,084,022)
|
12.3%
|
|
|
|
|
|
|
|
|
|
|
|
Profit before income tax
|
1,642,220
|
2,096,011
|
2,292,734
|
9.4%
|
39.6%
|
3,456,085
|
4,388,745
|
27.0%
|
|
Income tax
|
(397,170)
|
(517,741)
|
(542,848)
|
4.8%
|
36.7%
|
(828,840)
|
(1,060,589)
|
28.0%
|
|
Net profit
|
1,245,050
|
1,578,270
|
1,749,886
|
10.9%
|
40.5%
|
2,627,245
|
3,328,156
|
26.7%
|
|
Non-controlling interest
|
|
|
|
|
|
|
|
|
|
Net profit attributable to BCP
|
1,245,050
|
1,578,270
|
1,749,886
|
10.9%
|
40.5%
|
2,627,245
|
3,328,156
|
26.7%
|
|
|
Quarter
|
Change
|
|||
|
|
2Q24
|
1Q25
|
2Q25
|
QoQ
|
YoY
|
|
Profitability
|
|
|
|
|
|
|
ROAA (1)(2)
|
2.7%
|
3.2%
|
3.6%
|
40 bps
|
94 bps
|
|
ROAE (1)(2)
|
21.7%
|
25.8%
|
29.3%
|
354 bps
|
767 bps
|
|
Net interest margin (1)(2)
|
6.08%
|
5.80%
|
6.00%
|
21 bps
|
-8 bps
|
|
Risk-adjusted Net interest margin (1)(2)
|
4.30%
|
4.98%
|
5.22%
|
24 bps
|
92 bps
|
|
Funding cost (1)(2)(3)
|
2.34%
|
1.99%
|
1.95%
|
-4 bps
|
-39 bps
|
|
|
|
|
|
|
|
|
Loan portfolio quality
|
|
|
|
|
|
|
Internal overdue ratio
|
4.1%
|
3.5%
|
3.4%
|
-10 bps
|
-65 bps
|
|
NPL ratio
|
6.0%
|
5.0%
|
4.9%
|
-17 bps
|
-117 bps
|
|
Coverager rattio of IOLs
|
138.5%
|
153.7%
|
155.4%
|
165 bps
|
1688 bps
|
|
Coverage ratio of NPLs
|
93.3%
|
107.6%
|
109.3%
|
178 bps
|
1600 bps
|
|
Cost of risk (4)
|
2.6%
|
1.3%
|
1.2%
|
-8 bps
|
-144 bps
|
|
|
|
|
|
|
|
|
Operating efficiency
|
|
|
|
|
|
|
Operating expenses / Total income (5)
|
37.1%
|
37.7%
|
38.3%
|
66 bps
|
128 bps
|
|
Operating expenses / Total average assets (1)(2)(5)
|
3.0%
|
3.0%
|
3.2%
|
21 bps
|
21 bps
|
 |
|
|
| |
Earnings Release 2Q / 2025
|
Analysis of 2Q25 Consolidated
Results
|
|
12.7.5.
|
BCP Bolivia
|
| As of |
% change |
||||
|
|
Jun 24
|
Mar 25
|
Jun 25
|
QoQ
|
YoY
|
|
ASSETS
|
|
|
|
|
|
|
Cash and due from banks
|
2,385,328
|
1,646,883
|
1,218,865
|
-26.0%
|
-48.9%
|
|
Investments
|
1,495,591
|
1,248,084
|
685,760
|
-45.1%
|
-54.1%
|
|
Loans
|
10,228,586
|
6,293,810
|
4,189,040
|
-33.4%
|
-59.0%
|
|
Current
|
9,891,230
|
6,075,092
|
4,050,247
|
-33.3%
|
-59.1%
|
|
Internal overdue loans
|
282,934
|
174,431
|
110,562
|
-36.6%
|
-60.9%
|
|
Refinanced loans
|
54,422
|
44,287
|
28,231
|
-36.3%
|
-48.1%
|
|
Less - allowance for loan losses
|
(365,686)
|
(226,534)
|
(153,555)
|
-32.2%
|
-58.0%
|
|
Loans, net
|
9,862,900
|
6,067,276
|
4,035,485
|
-33.5%
|
-59.1%
|
|
Property, furniture and equipment, net
|
67,289
|
81,105
|
52,161
|
-35.7%
|
-22.5%
|
|
Other assets
|
370,700
|
210,298
|
194,583
|
-7.5%
|
-47.5%
|
|
Total assets
|
14,181,808
|
9,253,646
|
6,186,854
|
-33.1%
|
-56.4%
|
|
|
|
|
|
|
|
|
LIABILITIES AND NET SHAREHOLDERS' EQUITY
|
|
|
|
|
|
|
Deposits and obligations
|
12,327,706
|
7,971,085
|
5,195,468
|
-34.8%
|
-57.9%
|
|
Due to banks and correspondents
|
-
|
-
|
-
|
n.a.
|
n.a.
|
|
Bonds and subordinated debt
|
167,652
|
97,465
|
64,048
|
-34.3%
|
-61.8%
|
|
Other liabilities
|
703,718
|
475,663
|
374,043
|
-21.4%
|
-46.8%
|
|
Total liabilities
|
13,199,076
|
8,544,213
|
5,633,559
|
-34.1%
|
-57.3%
|
|
|
|
|
|
|
|
|
Net equity
|
982,732
|
709,433
|
553,295
|
-22.0%
|
-43.7%
|
|
|
|
|
|
|
|
|
TOTAL LIABILITIES AND NET EQUITY
|
14,181,808
|
9,253,646
|
6,186,854
|
-33.1%
|
-56.4%
|
|
|
Quarter
|
% change
|
Up to
|
% Change
|
||||
|
|
2Q24
|
1Q25
|
2Q25
|
QoQ
|
YoY
|
Jun 24
|
Jun 25
|
Jun 25 / Jun 24
|
|
Interests income, net
|
91,048
|
71,066
|
41,983
|
-40.9%
|
-53.9%
|
177,896
|
113,049
|
-36.5%
|
|
Provisions for doubtful accounts receivable, net of recoveries
|
(23,466)
|
(5,743)
|
(11,042)
|
92.3%
|
-52.9%
|
(38,119)
|
(16,785)
|
-56.0%
|
|
Net interest income after provisions
|
67,582
|
65,323
|
30,941
|
-52.6%
|
-54.2%
|
139,777
|
96,264
|
-31.1%
|
|
Non financial income
|
91,766
|
60,815
|
30,938
|
-49.1%
|
-66.3%
|
154,514
|
91,753
|
-40.6%
|
|
Total expenses
|
(98,349)
|
(93,862)
|
(44,737)
|
-52.3%
|
-54.5%
|
(199,771)
|
(138,599)
|
-30.6%
|
|
Translation result
|
(236)
|
3,768
|
2,934
|
-22.1%
|
n.a.
|
(399)
|
6,702
|
n.a.
|
|
Income tax
|
(27,725)
|
(11,817)
|
(5,846)
|
-50.5%
|
-78.9%
|
(40,727)
|
(17,663)
|
-56.6%
|
|
Net profit
|
33,038
|
24,227
|
14,230
|
-41.3%
|
-56.9%
|
53,394
|
38,457
|
-28.0%
|
|
|
Quarter
|
% change
|
Up to
|
% Change
|
||||
|
|
2Q24
|
1Q25
|
2Q25
|
QoQ
|
YoY
|
Jun 24
|
Jun 25
|
Jun 25 / Jun 24
|
|
Efficiency ratio
|
58.2%
|
69.6%
|
67.3%
|
-233 bps
|
910 bps
|
58.1%
|
68.8%
|
1062 bps
|
|
ROAE
|
14.0%
|
11.3%
|
9.0%
|
-228 bps
|
-503 bps
|
11.4%
|
9.9%
|
-155 bps
|
|
L/D ratio
|
83.0%
|
79.0%
|
80.6%
|
167 bps
|
-234 bps
|
|||
|
IOL ratio
|
2.8%
|
2.8%
|
2.6%
|
-13 bps
|
-13 bps
|
|||
|
NPL ratio
|
3.3%
|
3.5%
|
3.3%
|
-16 bps
|
1 bps
|
|||
|
Coverage of IOLs
|
129.2%
|
129.9%
|
138.9%
|
902 bps
|
964 bps
|
|||
|
Coverage of NPLs
|
108.4%
|
103.6%
|
110.6%
|
706 bps
|
224 bps
|
|||
|
Branches
|
46
|
46
|
46
|
0.0%
|
0.0%
|
|||
|
Agentes
|
1,350
|
1,848
|
2,056
|
11.3%
|
52.3%
|
|||
|
ATMs
|
315
|
314
|
314
|
0.0%
|
-0.3%
|
|||
|
Employees
|
1,745
|
1,859
|
1,897
|
2.0%
|
8.7%
|
|||
 |
|
|
|
|
|
|
| |
Earnings Release 2Q / 2025
|
Analysis of 2Q25 Consolidated Results
|
|
12. Appendix
|
| 12.7.6. |
Mibanco
|
|
As of
|
% change
|
||||
|
Jun 24
|
Mar 25
|
Jun 25
|
QoQ
|
YoY
|
|
|
ASSETS
|
|||||
|
Cash and due from banks
|
1,017,485
|
1,931,908
|
1,668,841
|
-13.6%
|
64.0%
|
|
Investments
|
3,220,179
|
3,124,911
|
2,878,335
|
-7.9%
|
-10.6%
|
|
Total loans
|
12,705,605
|
12,525,099
|
12,785,249
|
2.1%
|
0.6%
|
|
Current
|
11,672,954
|
11,719,353
|
12,004,020
|
2.4%
|
2.8%
|
|
Internal overdue loans
|
934,676
|
698,528
|
659,287
|
-5.6%
|
-29.5%
|
|
Refinanced
|
97,975
|
107,218
|
121,942
|
13.7%
|
24.5%
|
|
Allowance for loan losses
|
(984,286)
|
(864,812)
|
(887,976)
|
2.7%
|
-9.8%
|
|
Net loans
|
11,721,319
|
11,660,287
|
11,897,273
|
2.0%
|
1.5%
|
|
Property, plant and equipment, net
|
132,122
|
127,401
|
126,975
|
-0.3%
|
-3.9%
|
|
Other assets
|
890,770
|
719,368
|
715,448
|
-0.5%
|
-19.7%
|
|
Total assets
|
16,981,875
|
17,563,875
|
17,286,872
|
-1.6%
|
1.8%
|
|
LIABILITIES AND NET SHAREHOLDERS' EQUITY
|
|||||
|
Deposits and obligations
|
10,531,506
|
11,330,151
|
10,836,660
|
-4.4%
|
2.9%
|
|
Due to banks and correspondents
|
2,107,877
|
1,763,462
|
2,309,869
|
31.0%
|
9.6%
|
|
Bonds and subordinated debt
|
572,626
|
409,454
|
398,037
|
-2.8%
|
-30.5%
|
|
Other liabilities
|
1,097,220
|
1,577,966
|
1,207,564
|
-23.5%
|
10.1%
|
|
Total liabilities
|
14,309,229
|
15,081,033
|
14,752,130
|
-2.2%
|
3.1%
|
|
Net equity
|
2,672,646
|
2,482,842
|
2,534,742
|
2.1%
|
-5.2%
|
|
TOTAL LIABILITIES AND NET SHAREHOLDERS' EQUITY
|
16,981,875
|
17,563,875
|
17,286,872
|
-1.6%
|
1.8%
|
|
Quarter
|
% change
|
Up to
|
% change
|
|||||
|
2Q24
|
1Q25
|
2Q25
|
QoQ
|
YoY
|
Jun 24
|
Jun 25
|
Jun 25 / Jun 24
|
|
|
Net interest income
|
556,858
|
579,900
|
604,031
|
4.2%
|
8.5%
|
1,103,129
|
1,183,931
|
7.3%
|
|
Provision for loan losses, net of recoveries
|
(242,774)
|
(158,212)
|
(169,741)
|
7.3%
|
-30.1%
|
(393,499)
|
(327,953)
|
-16.7%
|
|
Net interest income after provisions
|
314,084
|
421,688
|
434,290
|
3.0%
|
38.3%
|
709,630
|
855,978
|
20.6%
|
|
Non-financial income
|
26,399
|
32,815
|
37,492
|
14.3%
|
42.0%
|
67,086
|
70,307
|
4.8%
|
|
Total expenses
|
(301,850)
|
(327,944)
|
(335,792)
|
2.4%
|
11.2%
|
(613,578)
|
(663,736)
|
8.2%
|
|
Translation result
|
(85)
|
(749)
|
(79)
|
-89.5%
|
-7.1%
|
(1,057)
|
(828)
|
-21.7%
|
|
Income taxes
|
(2,834)
|
(31,423)
|
(33,369)
|
6.2%
|
1077.5%
|
(33,794)
|
(64,792)
|
91.7%
|
|
Net income
|
35,714
|
94,387
|
102,542
|
8.6%
|
187.1%
|
128,287
|
196,929
|
53.5%
|
|
Quarter
|
% change
|
Up to
|
% change
|
|||||
|
2Q24
|
1Q25
|
2Q25
|
QoQ
|
YoY
|
Jun 24
|
Jun 25
|
Jun 25 / Jun 24
|
|
|
Efficiency ratio
|
51.0%
|
52.9%
|
52.0%
|
-88 bps
|
98 bps
|
52.1%
|
52.4%
|
30 bps
|
|
ROAE
|
5.4%
|
14.7%
|
16.3%
|
169 bps
|
1096 bps
|
9.1%
|
15.1%
|
609 bps
|
|
ROAE incl. Goowdill
|
5.1%
|
13.9%
|
15.5%
|
158 bps
|
1036 bps
|
8.6%
|
14.4%
|
574 bps
|
|
L/D ratio
|
120.6%
|
110.5%
|
118.0%
|
743 bps
|
-266 bps
|
|||
|
IOL ratio
|
7.4%
|
5.6%
|
5.2%
|
-42 bps
|
-220 bps
|
|||
|
NPL ratio
|
8.1%
|
6.4%
|
6.1%
|
-32 bps
|
-202 bps
|
|||
|
Coverage of IOLs
|
105.3%
|
123.8%
|
134.7%
|
1088 bps
|
2938 bps
|
|||
|
Coverage of NPLs
|
95.3%
|
107.3%
|
113.7%
|
633 bps
|
1835 bps
|
|||
|
Branches (1)
|
285
|
283
|
284
|
1
|
-1
|
|||
|
Employees
|
10,107
|
9,679
|
9,756
|
77
|
-351
|
|||
|
(1)
|
Includes Banco de la Nacion branches, which in June 24 were 36, in March 25 were 36 and in
June 25 were 36.
|
 |
|
|
|
|
|
|
| |
Earnings Release 2Q / 2025
|
Analysis of 2Q25 Consolidated Results
|
|
12. Appendix
|
| 12.7.7. |
Prima AFP
|
|
As of
|
% change
|
||||
|
Jun 24
|
Mar 25
|
Jun 25
|
QoQ
|
YoY
|
|
|
Cash and due from banks
|
55,243
|
132,293
|
5,582
|
-95.8%
|
-89.9%
|
|
Non-interest bearing
|
8,333
|
2,244
|
3,876
|
72.7%
|
-53.5%
|
|
Interest bearing
|
46,910
|
130,049
|
1,706
|
-98.7%
|
-96.4%
|
|
Fair value through profit or loss investments
|
374,810
|
302,482
|
361,646
|
19.6%
|
-3.5%
|
|
Fair value through other comprehensive income investments
|
1,035
|
1,968
|
1,405
|
-28.6%
|
35.7%
|
|
Property, plant and equipment, net
|
8,704
|
6,233
|
5,751
|
-7.7%
|
-33.9%
|
|
Other Assets
|
227,174
|
214,822
|
212,969
|
-0.9%
|
-6.3%
|
|
Total Assets
|
666,966
|
657,798
|
587,353
|
-10.7%
|
-11.9%
|
|
Due to banks and correspondents
|
6
|
29
|
11
|
-62.1%
|
83.3%
|
|
Lease payable
|
5,172
|
2,745
|
2,401
|
-12.5%
|
-53.6%
|
|
Other liabilities
|
182,283
|
265,049
|
153,573
|
-42.1%
|
-15.8%
|
|
Total Liabilities
|
187,461
|
267,823
|
155,985
|
-41.8%
|
-16.8%
|
|
Capital stock
|
40,505
|
40,505
|
40,505
|
0.0%
|
0.0%
|
|
Reserves
|
20,243
|
20,243
|
20,243
|
0.0%
|
0.0%
|
|
Other reserves
|
330
|
445
|
681
|
53.0%
|
106.4%
|
|
Retained earnings
|
344,510
|
304,310
|
304,309
|
0.0%
|
-11.7%
|
|
Net Income for the Period
|
73,917
|
24,472
|
65,630
|
168.2%
|
-11.2%
|
|
Total Liabilities and Equity
|
666,966
|
657,798
|
587,353
|
-10.7%
|
-11.9%
|
|
Quarter
|
% change
|
Up to
|
% change
|
|||||
|
2Q24
|
1Q25
|
2Q25
|
QoQ
|
YoY
|
Jun 24
|
Jun 25
|
Jun 25 / Jun 24
|
|
|
Financial income
|
816
|
1,481
|
557
|
-62.4%
|
-31.7%
|
2,463
|
2,038
|
-17.3%
|
|
Financial expenses
|
(779)
|
(453)
|
(518)
|
14.3%
|
-33.5%
|
(1,246)
|
(971)
|
-22.1%
|
|
Interest income, net
|
37
|
1,028
|
39
|
n.a.
|
5.4%
|
1,217
|
1,067
|
-12.3%
|
|
Fee income
|
99,103
|
94,072
|
97,233
|
3.4%
|
-1.9%
|
193,630
|
191,305
|
-1.2%
|
|
Net gain (loss) on securities
|
3,516
|
(7,380)
|
8,618
|
n.a.
|
n.a.
|
n.a.
|
n.a.
|
n.a.
|
|
Net gain (loss) from exchange differences
|
(351)
|
250
|
202
|
n.a.
|
n.a.
|
n.a.
|
n.a.
|
n.a.
|
|
Other income
|
1,210
|
206
|
463
|
124.8%
|
-61.7%
|
1,385
|
669
|
-51.7%
|
|
Salaries and employee benefits
|
(22,740)
|
(23,431)
|
(24,878)
|
6.2%
|
9.4%
|
(45,702)
|
(48,309)
|
5.7%
|
|
Administrative expenses
|
(22,218)
|
(21,577)
|
(18,206)
|
-15.6%
|
-18.1%
|
(40,753)
|
(39,783)
|
-2.4%
|
|
Depreciation and amortization
|
(6,560)
|
(6,870)
|
(6,970)
|
1.5%
|
6.3%
|
(13,166)
|
(13,840)
|
5.1%
|
|
Other expenses
|
(604)
|
(165)
|
(594)
|
n.a.
|
-1.7%
|
(933)
|
(759)
|
-18.6%
|
|
Profit before income tax
|
51,393
|
36,133
|
55,907
|
54.7%
|
8.8%
|
105,134
|
92,040
|
-12.5%
|
|
Income tax
|
(14,489)
|
(11,661)
|
(14,749)
|
26.5%
|
1.8%
|
(31,217)
|
(26,410)
|
-15.4%
|
|
Net profit
|
36,904
|
24,472
|
41,158
|
68.2%
|
11.5%
|
73,917
|
65,630
|
-11.2%
|
|
Quarter
|
Change
|
Up to
|
% change
|
|||||
|
2Q24
|
1Q25
|
2Q25
|
QoQ
|
YoY
|
Jun 24
|
Jun 25
|
Jun 25 / Jun 24
|
|
|
ROE
|
32.0%
|
22.6%
|
40.1%
|
1747 bps
|
807 bps
|
30.2%
|
28.9%
|
-124 bps
|
|
Net Interest Margin
|
0.0%
|
1.0%
|
0.0%
|
-92 bps
|
1 bps
|
0.6%
|
0.5%
|
-3 bps
|
|
Efficiency Ratio
|
52.2%
|
54.4%
|
51.4%
|
-306 bps
|
-80 bps
|
51.3%
|
52.9%
|
158 bps
|
|
Operating Expenses / Total Average Assets
|
28.4%
|
31.5%
|
32.2%
|
62 bps
|
372 bps
|
28.3%
|
32.7%
|
443 bps
|
|
Prima
|
System
|
Share %
|
Prima
|
System
|
Share %
|
|
|
1Q25
|
1Q25
|
1Q25
|
2Q25
|
2Q25
|
2Q25
|
|
|
AUMs (S/ Millions)
|
31,702
|
107,622
|
29%
|
32,943
|
113,513
|
29%
|
|
Affiliates (S/ Millions)
|
2,338,126
|
9,928,899
|
24%
|
2,339,871
|
10,049,438
|
23%
|
|
Collections (S/ Millions)
|
1,085
|
4,158
|
26%
|
1,121
|
4,348
|
26%
|
 |
|
| |
Earnings Release 2Q / 2025
|
Analysis of 2Q25 Consolidated Results
|
|
12. Appendix
|
| 12.7.8. |
Grupo Pacifico
|
|
|
As of |
% Change
|
||||
|
Jun 24
|
Mar 25
|
Jun 25
|
QoQ
|
YoY
|
||
|
Total assets
|
17,027,499
|
20,203,139
|
20,049,143
|
-0.8%
|
17.7%
|
|
|
Total Invesment (1)
|
12,823,140
|
14,117,211
|
14,228,488
|
0.8%
|
11.0%
|
|
|
Total Liabilities
|
14,044,909
|
16,280,582
|
16,007,803
|
-1.7%
|
14.0%
|
|
|
Net equity
|
2,967,599
|
3,177,756
|
3,341,104
|
5.1%
|
12.6%
|
|
|
Quarter
|
% Change
|
Up to
|
% change
|
||||||
|
2Q24
|
1Q25
|
2Q25
|
QoQ
|
YoY
|
Jun 24
|
Jun 25
|
Jun 25 / Jun 24
|
||
|
Insurance Service Result
|
286,987
|
279,931
|
342,243
|
22.3%
|
19.3%
|
628,781
|
622,174
|
-1.1%
|
|
|
Reinsurance Result
|
(95,236)
|
(94,861)
|
(107,333)
|
13.1%
|
12.7%
|
(275,289)
|
(202,194)
|
-26.6%
|
|
|
Insurance underwriting result
|
191,751
|
185,070
|
234,910
|
26.9%
|
22.5%
|
353,492
|
419,980
|
18.8%
|
|
|
Sale of medical services
|
-
|
78,267
|
474,732
|
506.6%
|
n.a.
|
-
|
552,999
|
n.a.
|
|
|
Cost of sales of medical services
|
-
|
(35,393)
|
(351,512)
|
893.2%
|
n.a.
|
-
|
(386,905)
|
n.a.
|
|
|
Medical services result
|
-
|
42,874
|
123,220
|
187.4%
|
n.a.
|
-
|
166,094
|
n.a.
|
|
|
Interest income
|
197,175
|
238,213
|
234,866
|
-1.4%
|
19.1%
|
416,720
|
473,079
|
13.5%
|
|
|
Interest Expenses
|
(131,448)
|
(145,698)
|
(156,502)
|
7.4%
|
19.1%
|
(260,562)
|
(302,200)
|
16.0%
|
|
|
Interest expenses attributable to insurance
activities
|
(124,686)
|
(135,622)
|
(139,054)
|
2.5%
|
11.5%
|
(246,690)
|
(274,676)
|
11.3%
|
|
|
Net Interest Income
|
65,727
|
92,515
|
78,364
|
-15.3%
|
19.2%
|
156,158
|
170,879
|
9.4%
|
|
|
Fee Income and Gain in FX
|
(2,262)
|
(4,151)
|
(6,397)
|
54.1%
|
182.8%
|
(5,524)
|
(10,548)
|
90.9%
|
|
|
Other Income No Core:
|
|||||||||
|
Net gain (loss) from exchange differences
|
(1,817)
|
(351)
|
488
|
-239.0%
|
-126.9%
|
(1,999)
|
137
|
-106.9%
|
|
|
Net loss on securities and associates
|
24,856
|
(34,396)
|
(15,390)
|
-55.3%
|
-161.9%
|
48,078
|
(49,786)
|
-203.6%
|
|
|
Other Income not operational
|
44,208
|
26,264
|
34,343
|
30.8%
|
-22.3%
|
73,959
|
60,607
|
-18.1%
|
|
|
Other Income
|
64,985
|
(12,634)
|
13,043
|
-203.2%
|
-79.9%
|
114,514
|
409
|
-99.6%
|
|
|
Operating expenses
|
(75,397)
|
(105,415)
|
(161,499)
|
53.2%
|
114.2%
|
(151,571)
|
(266,914)
|
76.1%
|
|
|
Other expenses
|
(29,351)
|
(3,837)
|
(25,822)
|
573.0%
|
-12.0%
|
(34,330)
|
(29,659)
|
-13.6%
|
|
|
Total Expenses
|
(104,748)
|
(109,252)
|
(187,321)
|
71.5%
|
78.8%
|
(185,901)
|
(296,573)
|
59.5%
|
|
|
Income tax
|
(23,596)
|
(16,052)
|
(37,568)
|
134.0%
|
59.2%
|
(27,391)
|
(53,620)
|
95.8%
|
|
|
Net income
|
194,119
|
182,521
|
224,649
|
23.1%
|
15.7%
|
410,872
|
407,170
|
-0.9%
|
|
| (1) |
Excluding investments in real estate.
|
| (i) |
private health insurance managed by Grupo Pacifico and included in its Financial Statements in each of the accounting lines;
|
| (ii) |
corporate health insurance (dependent workers); and
|
| (iii) |
medical services.
|
 |
|
| |
Earnings Release 2Q / 2025
|
Analysis of 2Q25 Consolidated Results
|
|
12. Appendix
|
| 12.7.9. |
Investment Management & Advisory *
|
|
Investment Management & Advisory *
|
Quarter
|
% change
|
Up to
|
% Change
|
||||
|
S/ 000
|
2Q24
|
1Q25
|
2Q25
|
QoQ
|
YoY
|
Jun 24
|
Jun 25
|
Jun 25 / Jun 24
|
|
Net interest income
|
5,278
|
10,441
|
13,978
|
33.9%
|
164.8%
|
11,737
|
24,419
|
108.1%
|
|
Other income
|
255,814
|
264,926
|
232,110
|
-12.4%
|
-9.3%
|
489,204
|
497,036
|
22.2%
|
|
Fee income
|
168,823
|
150,272
|
147,138
|
-2.1%
|
-12.8%
|
313,921
|
297,410
|
22.5%
|
|
Net gain on foreign exchange transactions
|
19,083
|
15,069
|
21,497
|
42.7%
|
12.7%
|
31,720
|
36,566
|
9.7%
|
|
Net gain on sales of securities
|
45,641
|
41,192
|
64,298
|
56.1%
|
40.9%
|
100,212
|
105,490
|
-13.6%
|
|
Derivative Result
|
20,551
|
3,864
|
(8,789)
|
-327.5%
|
-142.8%
|
42,579
|
(4,925)
|
-184.3%
|
|
Result from exposure to the exchange rate
|
(4,378)
|
12,599
|
4,870
|
-61.3%
|
-211.2%
|
(17,351)
|
17,469
|
-155.1%
|
|
Other income
|
6,094
|
41,930
|
3,096
|
-92.6%
|
-49.2%
|
18,123
|
45,026
|
0.1%
|
|
Operating expenses (1)
|
(172,693)
|
(202,074)
|
(183,696)
|
-9.1%
|
6.4%
|
(352,784)
|
(385,770)
|
6.6%
|
|
Operating income
|
88,399
|
73,293
|
62,392
|
-14.9%
|
-29.4%
|
148,157
|
135,685
|
31.7%
|
|
Income taxes
|
(23,942)
|
(11,098)
|
(11,686)
|
5.3%
|
-51.2%
|
(34,885)
|
(22,784)
|
112.1%
|
|
Non-controlling interest
|
(2,426)
|
152
|
167
|
9.9%
|
-106.9%
|
150
|
319
|
-108.1%
|
|
Net income
|
66,883
|
62,043
|
50,539
|
-18.5%
|
-24.4%
|
113,122
|
112,582
|
15.6%
|
| (1) |
Includes: Salaries and employee’s benefits + Administrative expenses + Assigned expenses +
Depreciation and amortization + Tax and contributions + Other expenses.
|
 |
|
| |
Earnings Release 2Q / 2025
|
Analysis of 2Q25 Consolidated Results
|
|
12. Appendix
|
| 12.8. |
Table of calculations
|
|
Table of
calculations (1)
|
||
|
Pr
 ofitability ofitability |
Interest earning assets
|
Cash and due from banks+Total investments +Cash collateral, reverse repurchase agreements and securities borrowing+Loans |
|
Funding
|
Deposits and obligations+Due to banks and correspondents+BCRP instruments +Repurchase agreements with clients and third parties+Bonds and notes issued |
|
|
Net Interest Margin (NIM)
|
Net Interest Income (excluding Net Insurance Financial Expenses) Average Interest Earning Assets |
|
|
Risk-adjusted Net
Interest Margin (Risk-
adjusted NIM)
|
Annualized Net Interest Income (excluding Net Insurance Financial Expenses)-Annualized Provisions ) Average period end and period beginning interest earning assets |
|
|
Funding cost
|
Interest Expense (Does not Include Net Insurance Financial Expenses) Average Funding |
|
|
Core income
|
Net Interest Income+Fee Income+Net Gain on Foreign exchange transactions |
|
|
Other core income
|
Fee Income+Net Gain on Foreign exchange transactions |
|
|
Other non-core income
|
Net Gain Securities+Net Gain from associates+Net Gain of derivatives held for trading +Net Gain from exchange differences+Other non operative income |
|
|
Return on average assets (ROA)
|
Annualized Net Income attributable to Credicorp Average Assets |
|
|
Return on average equity (ROE)
|
Annualized Net Income attributable to Credicorp Average Net Equity |
|
|
|
Internal overdue ratio
|
(Internal overdue loans) Total Loans |
|
Non – performing loans ratio (NPL
ratio)
|
(Internal overdue loans+Refinanced loans) Total Loans |
|
|
Coverage ratio of internal overdue
loans
|
Allowance for loans losses Internal overdue loans |
|
|
Coverage ratio of non – performing loans
|
Allowance for loans losses Non-performing loans |
|
|
Cost of risk
|
Annualized provision for credit losses on loans portfolio, net of
recoveries Average Total Loans |
|
|
|
Operating expenses
|
Salaries and employees benefits+Administrtive expenses+Depreciation and amortization +Association in participation +Acquisition cost |
|
Operating Income
|
Net interest, similar income, and expenses+Fee income+Net gain on foreign exchange transactions +Net gain from associates+Net gain on derivatives held for
trading+Net gain from echange differences+ Net Insurance Underwriting Results |
|
|
Efficiency ratio
|
Salaries and employee benefits + Administrative expenses + Depreciation and amortization
+ Association in participation
Net interest, similar income and expenses + Fee Income + Net gain on foreign
exchange transactions + Net gain from associates+Net gain on derivatives held for trading
+ Result on exchange differences+Insurance Underwriting Result
|
|
|
|
Liquidity Coverage ratio
|
Total High Quality Liquid Assets + Min(Total Inflow 30 days; 75% * Total Outflow 30 days)
Total Outflow 30 days
|
|
Regulatory Capital ratio
|
Regulatory Capital (Risk -weighted assets) |
|
|
Tier 1 ratio
|
Tier 1(2) Risk -weighted assets |
|
|
Common Equity Tier 1 ratio (3)
|
Capital+Reserves -100% of applicable deductions (4)+ Retained Earnings+Unrealized gains or losses Risk -weighted assets |
|
| (1) |
Averages are determined as the average of period-beginning and period-ending balances.
|
| (2) |
Includes investment in subsidiaries, goodwill, intangibles, and deferred tax that rely on future
profitability.
|
|
(3)
|
Common Equity Tier 1 = Capital Stock + Reserves + Accumulated earnings – Unrealized profits
or losses - 100% deductions (investment in subsidiaries, goodwill, intangible assets, and deferred tax assets based on
future returns).
|
| (4) |
Includes investment in subsidiaries, goodwill, intangible assets, and deferred taxes based on
future returns.
|
 |
|
| |
Earnings Release 2Q / 2025
|
Analysis of 2Q25 Consolidated Results
|
|
12. Appendix
|
| 12.9. |
Glossary of terms
|
|
Term
|
Definition
|
|||
|
AFP
|
Administradora de Fondo de Pensiones or Private Pension Funds Administrators
|
|||
|
BCRP
|
Banco Central de Reserva del Perú or Peruvian Central Bank
|
|||
|
Financially Included
|
Stock of financially included clients through BCP since 2020. New clients with
BCP
savings accounts or new Yape affiliates that: (i) Do not have debt in the
financial system nor other BCP products in the 12 months prior to their inclusion,
and (ii) Have performed at least 3 monthly transactions on average through any
BCP channel in the last 3 months
|
|||
|
GMV
|
Gross Merchant Volume
|
|||
|
Government Program Loans ("GP" or "GP Loans")
|
Loan Portfolio related to Reactiva Peru, FAE-Mype and Impulso Myperu programs
to respond quickly and effectively to liquidity needs and maintain the payment chain
|
|||
|
MAU
|
Monthly Active Users
|
|||
|
MEF
|
Ministry of Economy and Finance of Peru
|
|||
|
TPV
|
Total Payment Volume
|
 |