Value of | ||||||||||||
Initial Fixed | ||||||||||||
$100 | ||||||||||||
Average | Investment | |||||||||||
Summary | Summary | Average | Based on | |||||||||
Compensation | Compensation | Compensation | Compensation | Total | ||||||||
Table Total for | Actually Paid to | Table Total for | Actually Paid to | Shareholder | ||||||||
PEO | PEO | Non-PEO NEOs | Non-PEO NEOs | Return | Net Loss | |||||||
Year(1) |
| ($)(2) |
| ($)(3)(6) |
| ($)(4) |
| ($)(5)(6) |
| ($)(7) |
| ($)(In Thousands) |
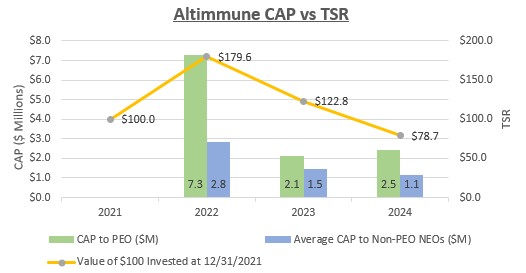
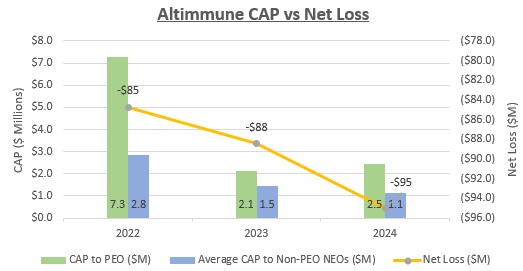
2024 | 6,090,462 | 2,452,764 | 2,439,817 | 1,129,399 | 78.71 | 95,059 | ||||||
2023 | 5,482,089 | 2,105,333 | 2,590,486 | 1,469,468 | 122.82 | 88,447 | ||||||
2022 | 2,880,424 | 7,276,760 | 1,158,382 | 2,830,638 | 179.59 | 84,713 |
| (1) | The PEO is Vipin Garg (CEO) for each of the years presented. The Non-PEO NEOs for each of the years presented are listed below: |
| ● | For 2024 – M. Scott Harris (CMO) and M. Scot Roberts (CSO) |
| ● | For 2023 – M. Scott Harris (CMO) and Raymond M. Jordt (CBO) |
| ● | For 2022 – Richard Eisenstadt (former CFO), M. Scott Harris (CMO) and M. Scot Roberts (CSO) |
| (2) | The dollar amounts reported in this column are the amounts of total compensation reported for the PEO in the “Total” column of the SCT in the applicable fiscal year. |
| (3) | In accordance with Item 402 (v) of Regulation S-K, the following adjustments were made to determine the CAP to our PEO during fiscal year 2024, which consisted solely of adjustments to the PEO’s equity awards: |
Compensation Actually Paid | 2024 | ||
SCT – Total Compensation | $ | 6,090,462 | |
Adjustments: | |||
Deduct - amounts reported under the "Stock Awards" column in the SCT | (1,560,896) | ||
Deduct - amounts reported under the "Option Awards" column in the SCT | (3,536,567) | ||
Add - year-end fair value of outstanding and unvested equity awards granted in the covered fiscal year | 3,893,882 | ||
Add - change in fair value of outstanding and unvested equity awards granted in prior fiscal years | (1,518,441) | ||
Add - change in fair value as of the vesting date of equity awards granted in prior fiscal years that vested in the covered fiscal year | (915,676) | ||
Total Equity Adjustments | (3,637,698) | ||
CAP | $ | 2,452,764 | |
| (4) | The dollar amounts reported in this column represent the average of the amounts reported for the Non-PEO NEOs in the “Total” column of the SCT in the applicable fiscal year. |
| (5) | In accordance with Item 402 (v) of Regulation S-K, the following adjustments were made to determine the average CAP to our Non-PEO NEOs during fiscal year 2024, which consisted solely of adjustments to the Non-PEO NEOs’ equity awards: |
Compensation Actually Paid | 2024 | ||
SCT – Total Compensation | $ | 2,439,817 | |
Adjustments: | |||
Deduct - amounts reported under the "Stock Awards" column in the SCT | (541,952) | ||
Deduct - amounts reported under the "Option Awards" column in the SCT | (1,228,016) | ||
Add - year-end fair value of outstanding and unvested equity awards granted in the covered fiscal year | 1,352,054 | ||
Add - change in fair value of outstanding and unvested equity awards granted in prior fiscal years | (555,603) | ||
Add - change in fair value as of the vesting date of equity awards granted in prior fiscal years that vested in the covered fiscal year | (336,901) | ||
Total Equity Adjustments | (1,310,418) | ||
CAP | $ | 1,129,399 | |
| (6) | The fair value of stock options reported for CAP was determined using a Black-Scholes option pricing model consistent with our accounting for equity-based compensation. The fair value of restricted stock was determined based on the closing price of our common stock as of the applicable dates. |
| (7) | Total Shareholder Return (TSR) represents the measurement period value of an investment of $100 in our stock on December 31, 2021, and then valued again on each of December 31, 2022, 2023 and 2024. |
Value of | ||||||||||||
Initial Fixed | ||||||||||||
$100 | ||||||||||||
Average | Investment | |||||||||||
Summary | Summary | Average | Based on | |||||||||
Compensation | Compensation | Compensation | Compensation | Total | ||||||||
Table Total for | Actually Paid to | Table Total for | Actually Paid to | Shareholder | ||||||||
PEO | PEO | Non-PEO NEOs | Non-PEO NEOs | Return | Net Loss | |||||||
Year(1) |
| ($)(2) |
| ($)(3)(6) |
| ($)(4) |
| ($)(5)(6) |
| ($)(7) |
| ($)(In Thousands) |
2024 | 6,090,462 | 2,452,764 | 2,439,817 | 1,129,399 | 78.71 | 95,059 | ||||||
2023 | 5,482,089 | 2,105,333 | 2,590,486 | 1,469,468 | 122.82 | 88,447 | ||||||
2022 | 2,880,424 | 7,276,760 | 1,158,382 | 2,830,638 | 179.59 | 84,713 |
| (1) | The PEO is Vipin Garg (CEO) for each of the years presented. The Non-PEO NEOs for each of the years presented are listed below: |
| ● | For 2024 – M. Scott Harris (CMO) and M. Scot Roberts (CSO) |
| ● | For 2023 – M. Scott Harris (CMO) and Raymond M. Jordt (CBO) |
| ● | For 2022 – Richard Eisenstadt (former CFO), M. Scott Harris (CMO) and M. Scot Roberts (CSO) |
| (3) | In accordance with Item 402 (v) of Regulation S-K, the following adjustments were made to determine the CAP to our PEO during fiscal year 2024, which consisted solely of adjustments to the PEO’s equity awards: |
Compensation Actually Paid | 2024 | ||
SCT – Total Compensation | $ | 6,090,462 | |
Adjustments: | |||
Deduct - amounts reported under the "Stock Awards" column in the SCT | (1,560,896) | ||
Deduct - amounts reported under the "Option Awards" column in the SCT | (3,536,567) | ||
Add - year-end fair value of outstanding and unvested equity awards granted in the covered fiscal year | 3,893,882 | ||
Add - change in fair value of outstanding and unvested equity awards granted in prior fiscal years | (1,518,441) | ||
Add - change in fair value as of the vesting date of equity awards granted in prior fiscal years that vested in the covered fiscal year | (915,676) | ||
Total Equity Adjustments | (3,637,698) | ||
CAP | $ | 2,452,764 | |
| (5) | In accordance with Item 402 (v) of Regulation S-K, the following adjustments were made to determine the average CAP to our Non-PEO NEOs during fiscal year 2024, which consisted solely of adjustments to the Non-PEO NEOs’ equity awards: |
Compensation Actually Paid | 2024 | ||
SCT – Total Compensation | $ | 2,439,817 | |
Adjustments: | |||
Deduct - amounts reported under the "Stock Awards" column in the SCT | (541,952) | ||
Deduct - amounts reported under the "Option Awards" column in the SCT | (1,228,016) | ||
Add - year-end fair value of outstanding and unvested equity awards granted in the covered fiscal year | 1,352,054 | ||
Add - change in fair value of outstanding and unvested equity awards granted in prior fiscal years | (555,603) | ||
Add - change in fair value as of the vesting date of equity awards granted in prior fiscal years that vested in the covered fiscal year | (336,901) | ||
Total Equity Adjustments | (1,310,418) | ||
CAP | $ | 1,129,399 | |