Pay vs Performance Disclosure - USD ($)
|
12 Months Ended |
Apr. 30, 2025 |
Apr. 30, 2024 |
Apr. 30, 2023 |
Apr. 30, 2022 |
Apr. 30, 2021 |
| Pay vs Performance Disclosure |
|
|
|
|
|
| Pay vs Performance Disclosure, Table |
| | | | | | | | | | | | | | | | | | | | | | | | | | | | | | | | | | | | |
Fiscal Year |
Summary Compensation Table Total for Current PEO (a) ($) |
Summary Compensation Table Total for Former PEO (a) ($) |
Compensation Actually Paid to Current PEO (a) (b) (c) ($) |
Compensation Actually Paid to Former PEO (a) (b) (c) ($) |
Average Summary Compensation Table Total for Non-PEO NEOs (a) ($) |
Average Compensation Actually Paid to Non-PEO NEOs (a)(b) (c) ($) | | Value of Initial Fixed $100 Investment Based On: (d) |
Net Income (loss) (in millions) |
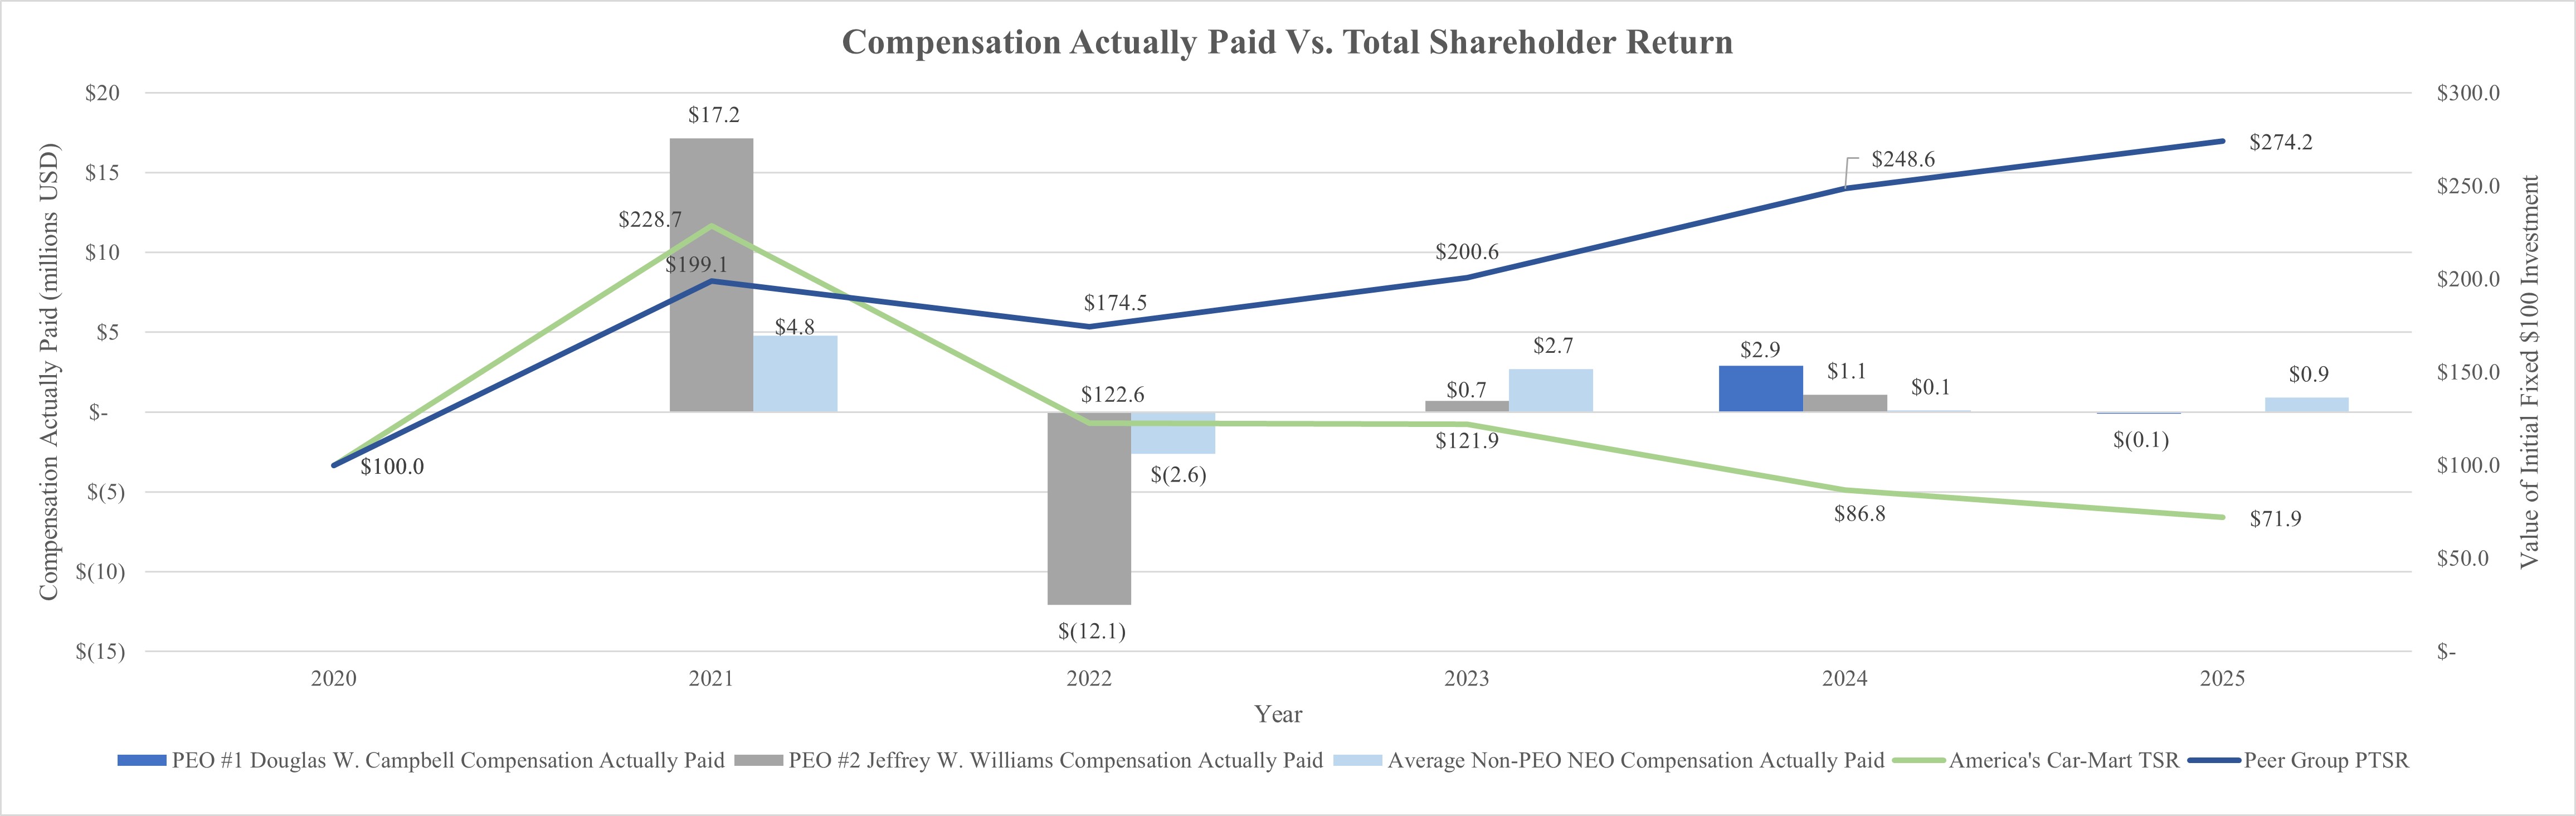
SG&A per Average Customer (e) | | Total Shareholder Return ($) | Peer Group Total Shareholder Return ($) | | | 2025 | $ | 1,553,513 | N/A | $ | (145,647) | N/A | $ | 991,226 | $ | 880,744 | | $ | 71.9 | $ | 274.2 | $ | 17.9 | $ | 1,823 | | | 2024 | $ | 8,446,835 | $ | 1,156,721 | $ | 2,889,896 | $ | 1,072,413 | $ | 633,239 | $ | 149,988 | | $ | 86.8 | $ | 248.6 | $ | (31.4) | $ | 1,735 | | | 2023 | N/A | $ | 928,554 | N/A | $ | 683,679 | $ | 1,918,019 | $ | 2,676,532 | | $ | 121.9 | $ | 200.6 | $ | 20.4 | $ | 1,778 | | | 2022 | N/A | $ | 948,093 | N/A | $ | (12,096,573) | $ | 523,772 | $ | (2,611,365) | | $ | 122.6 | $ | 174.5 | $ | 95.0 | $ | 1,672 | | | 2021 | N/A | $ | 797,506 | N/A | $ | 17,578,077 | $ | 440,770 | $ | 4,752,059 | | $ | 228.7 | $ | 199.1 | $ | 104.8 | $ | 1,541 | |
|
|
|
|
|
| Company Selected Measure Name |
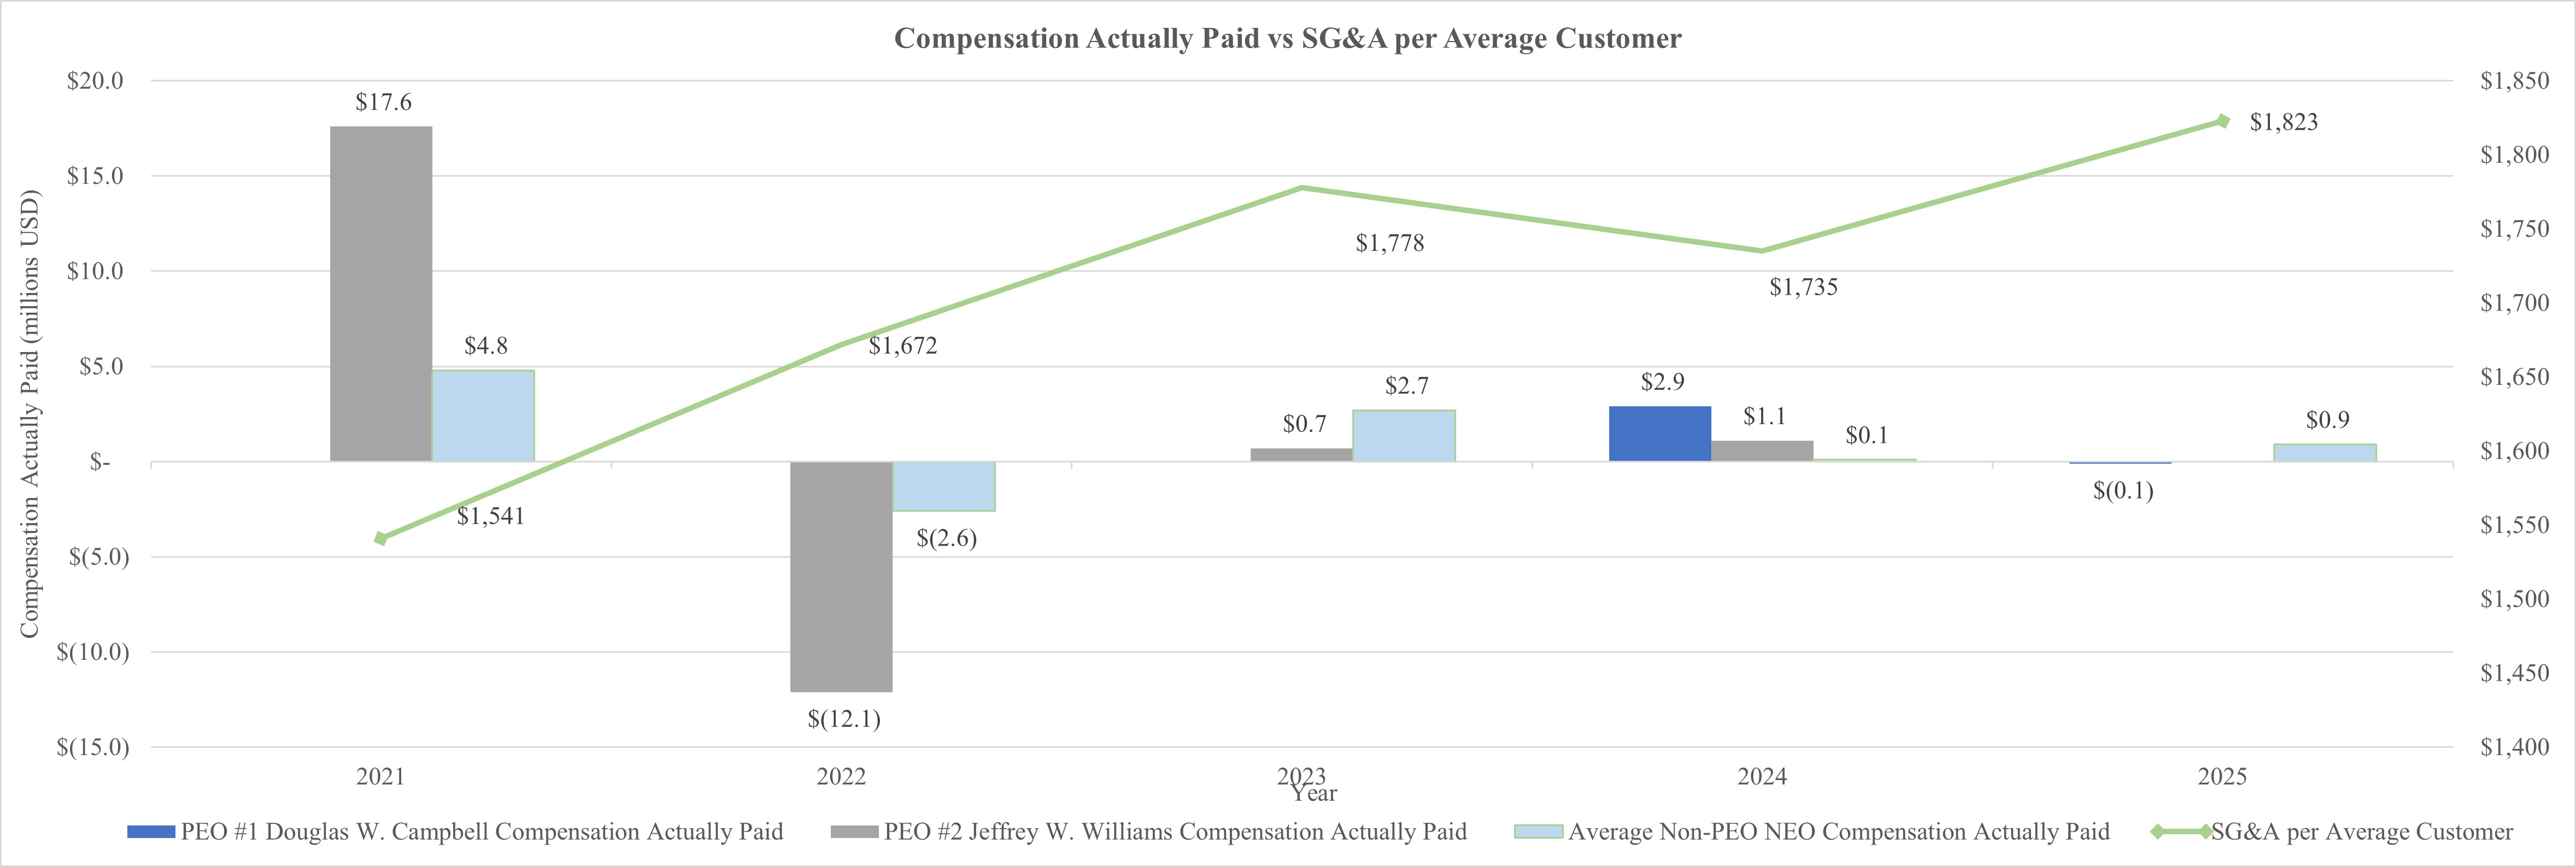
selling, general and administrative (“SG&A”) expense per average customer
|
|
|
|
|
| Named Executive Officers, Footnote |
Douglas W. Campbell was our PEO for fiscal years 2025 and 2024 beginning October 1, 2023. Jeffrey A. Williams was our PEO for fiscal years 2021 through 2024 ending September 30, 2024. Mr. Williams served as Chief Executive Officer Emeritus for the remainder of fiscal year 2024. The non-PEO NEOs reflected in the tabular disclosure above represent the following individuals: | | | | | | | | | | | | | | | | Fiscal 2021 | Fiscal 2022 | Fiscal 2023 | Fiscal 2024 | Fiscal 2025 | | Vickie D. Judy | Vickie D. Judy | Vickie D. Judy | Vickie D. Judy | Vickie D. Judy | | Leonard L. Walthall | Leonard L. Walthall | Douglas W. Campbell | | Jamie Z. Fischer | | Leonard L. Walthall | | |
|
|
|
|
|
| Peer Group Issuers, Footnote |
The amounts set forth in the “Peer Group Total Shareholder Return” column of the Pay Versus Performance Table are based on a customized peer group made up of automotive dealership companies composed of the common stock of Asbury Automotive Group, Inc.; AutoNation, Inc.; CarMax, Inc.; Copart, Inc.; Group 1 Automotive, Inc.; Lithia Motors, Inc.; Penske Automotive Group, Inc.; Rush Enterprises, Inc.; and Sonic Automotive, Inc. for the period of five fiscal years commencing on May 1, 2020 and ending on April 30, 2025. We utilized this peer group in the stock performance graph required by Item 201(e) of Regulation S-K included in our Annual Report on Form 10-K for the year ended April 30, 2025. The comparison assumes $100 was invested for the period starting May 1, 2020, through the end of the listed year in the Company and in the weighted average of the peer group above, respectively. Historical stock performance is not necessarily indicative of future stock performance.
|
|
|
|
|
| Adjustment To PEO Compensation, Footnote |
PEO SCT Total to CAP Reconciliation
| | | | | | | | | | | | | | | | | |
Fiscal Year |
Summary Compensation Table Total for Current PEO |
Exclusion of Change in Pension Value for Current PEO |
Exclusion of Stock Awards and Option Awards for Current PEO |
Inclusion of Equity Values for Current PEO |
Compensation Actually Paid to Current PEO | | | 2025 | $ | 1,553,513 | $ | - | $ | - | $ | (1,699,160) | $ | (145,647) | | 2024 | $ | 8,446,835 | $ | - | $ | (7,135,076) | $ | 1,618,137 | $ | 2,889,896 | | 2023 | N/A | N/A | N/A | N/A | N/A | | 2022 | N/A | N/A | N/A | N/A | N/A | | 2021 | N/A | N/A | N/A | N/A | N/A |
| | | | | | | | | | | | | | | | | |
Fiscal Year |
Summary Compensation Table Total for Former PEO |
Exclusion of Change in Pension Value for Former PEO |
Exclusion of Stock Awards and Option Awards for Former PEO |
Inclusion of Equity Values for Former PEO |
Compensation Actually Paid to Former PEO | | | 2025 | N/A | N/A | N/A | N/A | N/A | | 2024 | $ | 1,156,721 | $ | - | $ | - | $ | (84,309) | $ | 1,072,413 | | 2023 | $ | 928,554 | $ | - | $ | - | $ | (244,875) | $ | 683,679 | | 2022 | $ | 948,093 | $ | - | $ | - | $ | (13,044,666) | $ | (12,096,573) | | 2021 | $ | 797,506 | $ | - | $ | - | $ | 16,780,571 | $ | 17,578,077 |
Inclusion of Equity Values for PEOs
| | | | | | | | | | | | | | | | | | | | |
Fiscal Year |
Year-End Fair Value of Equity Awards Granted During Year That Remained Unvested as of Last Day of Year for Current PEO |
Change in Fair Value from Last Day of Prior Year to Last Day of Year of Unvested Equity Awards Granted in a Prior Year for Current PEO |
Vesting-Date Fair Value of Equity Awards Granted During Year that Vested During Year for Current PEO |
Change in Fair Value from Last Day of Prior Year to Vesting Date of Equity Awards Granted in a Prior Year that Vested During Year for Current PEO |
Fair Value at Last Day of Prior Year of Equity Awards Forfeited During Year for Current PEO |
Total - Inclusion of Equity Values for Current PEO | | 2025 | $ | - | $ | (971,772) | $ | - | $ | (727,388) | $ | - | $ | (1,699,160) | | 2024 | $ | 2,782,921 | $ | (1,442,693) | $ | - | $ | 277,909 | $ | - | $ | 1,618,137 | | 2023 | N/A | N/A | N/A | N/A | N/A | N/A | | 2022 | N/A | N/A | N/A | N/A | N/A | N/A | | 2021 | N/A | N/A | N/A | N/A | N/A | N/A |
| | | | | | | | | | | | | | | | | | | | |
Fiscal Year |
Year-End Fair Value of Equity Awards Granted During Year That Remained Unvested as of Last Day of Year for Former PEO |
Change in Fair Value from Last Day of Prior Year to Last Day of Year of Unvested Equity Awards Granted in a Prior Year for Former PEO |
Vesting-Date Fair Value of Equity Awards Granted During Year that Vested During Year for Former PEO |
Change in Fair Value from Last Day of Prior Year to Vesting Date of Equity Awards Granted in a Prior Year that Vested During Year for Former PEO |
Fair Value at Last Day of Prior Year of Equity Awards Forfeited During Year for Former PEO |
Total - Inclusion of Equity Values for Former PEO | | 2025 | N/A | N/A | N/A | N/A | N/A | N/A | | 2024 | $ | - | $ | (411,470) | $ | - | $ | 327,162 | $ | — | $ | (84,309) | | 2023 | $ | - | $ | (103,106) | $ | - | $ | (141,769) | $ | — | $ | (244,875) | | 2022 | $ | - | $ | (12,105,106) | $ | - | $ | (939,560) | $ | — | $ | (13,044,666) | | 2021 | $ | - | $ | 16,034,174 | $ | - | $ | 746,397 | $ | — | $ | 16,780,571 |
|
|
|
|
|
| Non-PEO NEO Average Total Compensation Amount |
$ 991,226
|
$ 633,239
|
$ 1,918,019
|
$ 523,772
|
$ 440,770
|
| Non-PEO NEO Average Compensation Actually Paid Amount |
$ 880,744
|
149,988
|
2,676,532
|
(2,611,365)
|
4,752,059
|
| Adjustment to Non-PEO NEO Compensation Footnote |
Average Non-PEO NEOs SCT Total to CAP Reconciliation
| | | | | | | | | | | | | | | | | |
Fiscal Year |
Average Summary Compensation Table Total for Non-PEO NEOs |
Average Exclusion of Change in Pension Value for Non-PEO NEOs |
Average Exclusion of Stock Awards and Option Awards for Non-PEO NEOs |
Average Inclusion of Equity Values for Non-PEO NEOs |
Average Compensation Actually Paid to Non-PEO NEOs | | | 2025 | $ | 991,226 | $ | - | $ | (275,005) | $ | 164,523 | $ | 880,744 | | 2024 | $ | 633,239 | $ | - | $ | - | $ | (483,251) | $ | 149,988 | | 2023 | $ | 1,918,019 | $ | - | $ | (1,235,867) | $ | 1,994,380 | $ | 2,676,532 | | 2022 | $ | 523,772 | $ | - | $ | - | $ | (3,135,136) | $ | (2,611,365) | | 2021 | $ | 440,770 | $ | - | $ | - | $ | 4,311,289 | $ | 4,752,059 |
The amounts reported in the “Inclusion of Equity Values” columns in the tables above are derived from the amounts set forth in the following tables: Average Inclusion of Equity Values for Non-PEO NEOs
| | | | | | | | | | | | | | | | | | | | |
Fiscal Year |
Average Year-End Fair Value of Equity Awards Granted During Year That Remained Unvested as of Last Day of Year for Non-PEO NEOs |
Average Change in Fair Value from Last Day of Prior Year to Last Day of Year of Unvested Equity Awards Granted in a Prior Year for Non-PEO NEOs |
Average Vesting-Date Fair Value of Equity Awards Granted During Year that Vested During Year for Non-PEO NEOs |
Average Change in Fair Value from Last Day of Prior Year to Vesting Date of Equity Awards Granted in a Prior Year that Vested During Year for Non-PEO NEOs |
Average Fair Value at Last Day of Prior Year of Equity Awards Forfeited During Year for Non-PEO NEOs |
Total - Average Inclusion of Equity Values for Non-PEO NEOs | | 2025 | $ | 272,641 | $ | (55,150) | $ | - | $ | (52,968) | $ | - | $ | 164,523 | | 2024 | $ | - | $ | (425,135) | $ | - | $ | (58,116) | $ | - | $ | (483,251) | | 2023 | $ | 2,049,466 | $ | (7,384) | $ | - | $ | (47,703) | $ | - | $ | 1,994,380 | | 2022 | $ | - | $ | (2,665,356) | $ | - | $ | (469,780) | $ | - | $ | (3,135,136) | | 2021 | $ | - | $ | 3,938,090 | $ | - | $ | 373,199 | $ | - | $ | 4,311,289 |
|
|
|
|
|
| Compensation Actually Paid vs. Total Shareholder Return |
|
|
|
|
|
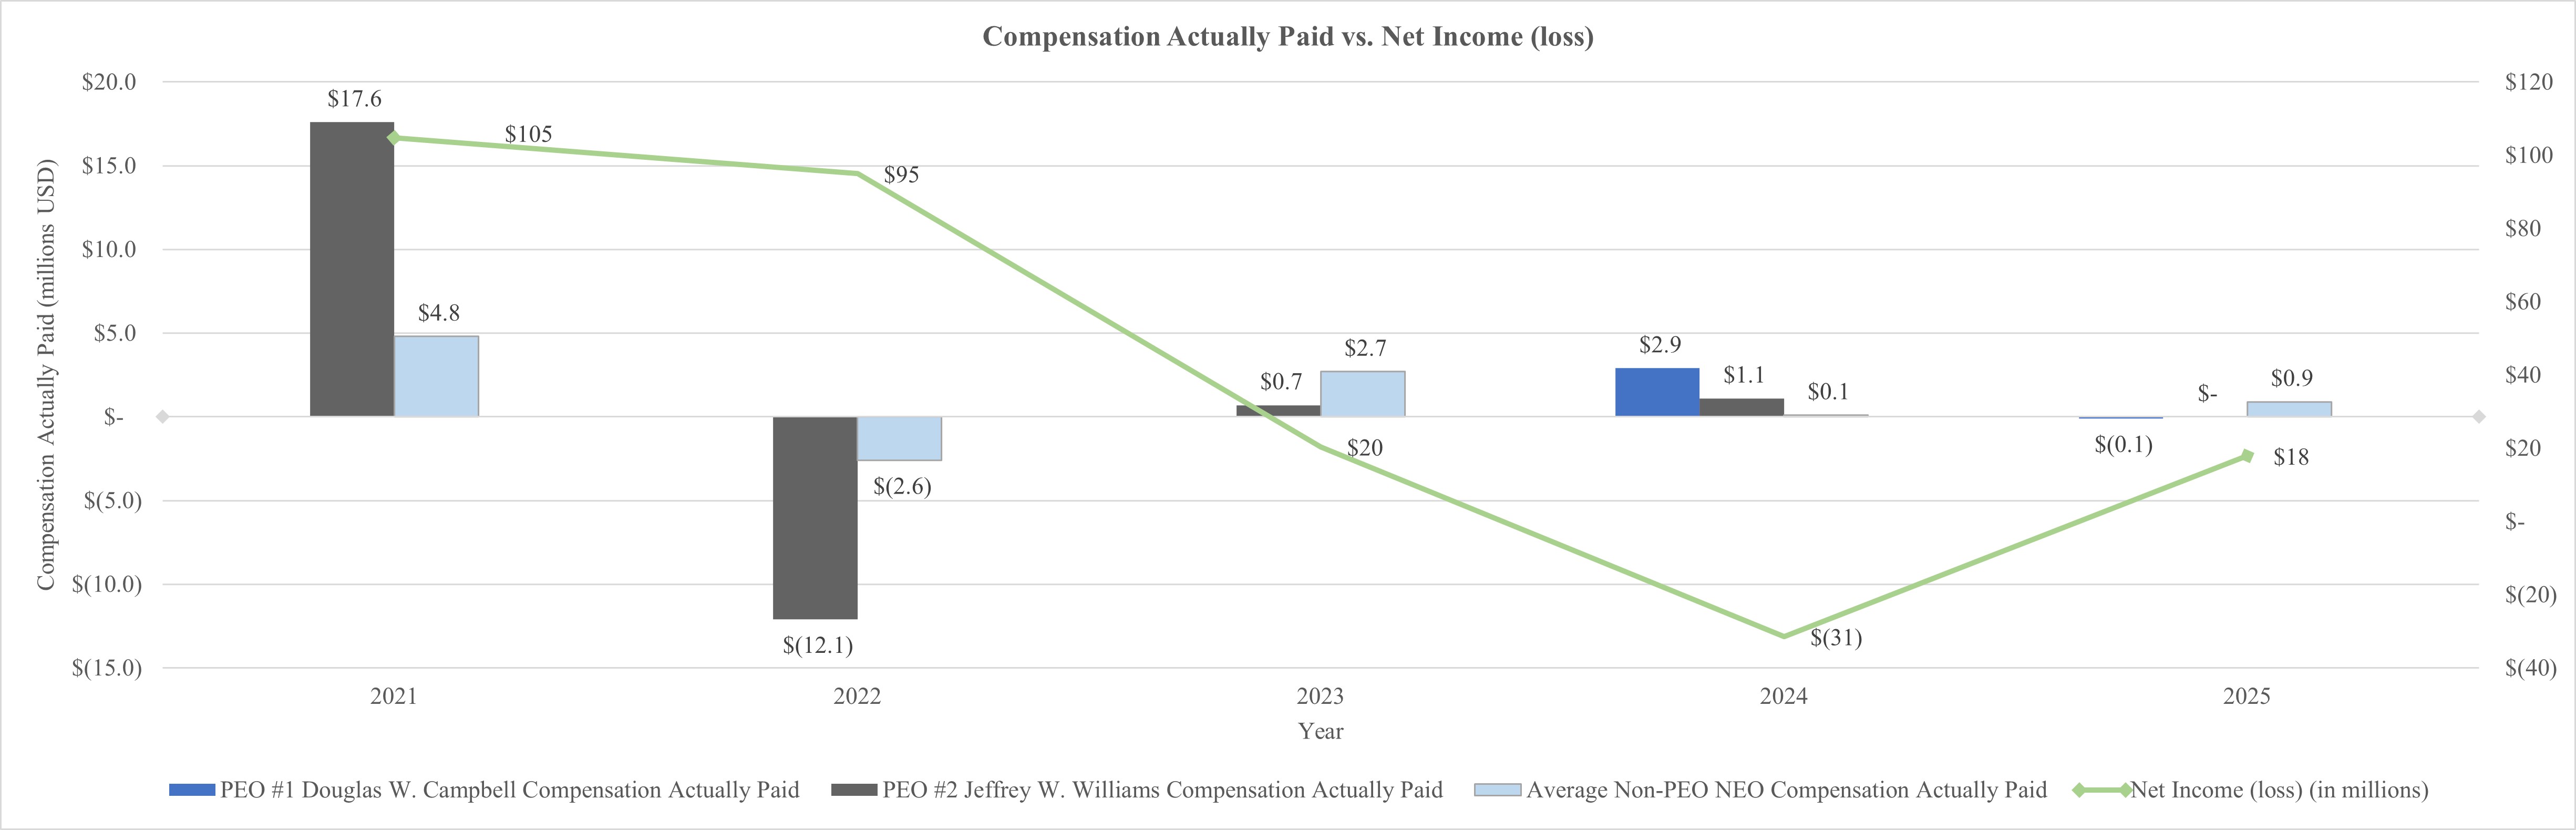
| Compensation Actually Paid vs. Net Income |
|
|
|
|
|
| Compensation Actually Paid vs. Company Selected Measure |
|
|
|
|
|
| Total Shareholder Return Vs Peer Group |
|
|
|
|
|
| Tabular List, Table |
| | | Earnings per share | Return on equity | Selling, general and administrative expense per average customer |
|
|
|
|
|
| Total Shareholder Return Amount |
$ 71.9
|
86.8
|
121.9
|
122.6
|
228.7
|
| Peer Group Total Shareholder Return Amount |
274.2
|
248.6
|
200.6
|
174.5
|
199.1
|
| Net Income (Loss), Including Portion Attributable to Noncontrolling Interest |
$ 17,900,000
|
$ (31,400,000)
|
$ 20,400,000
|
$ 95,000,000.0
|
$ 104,800,000
|
| Company Selected Measure Amount |
1,823
|
1,735
|
1,778
|
1,672
|
1,541
|
| Additional 402(v) Disclosure |
The amounts reported in this column have been calculated in accordance with Item 402(v) of Regulation S-K and do not reflect compensation actually earned, realized, or received by the Company’s named executive officers. These amounts reflect the amounts reported in the total compensation column of the Summary Compensation Table on page 27 of this proxy statement, with certain adjustments as described in footnote (c) below. Compensation actually paid (“CAP”) reflects the exclusions and inclusions of certain amounts for the PEO and the Non-PEO NEOs as set forth in the tables below. Equity values are calculated in accordance with FASB ASC Topic 718. Amounts reported in the “Exclusion of Stock Awards” and “Option Awards” columns of the following tables are the totals (or, in the case of the Non-PEO NEOs, the average of the totals) from the “Stock Awards” and “Option Awards” columns set forth in the Summary Compensation Table (“SCT”). Amounts in the “Inclusion of Stock Awards and Option Awards” columns are calculated in accordance with Item 402(v) of Regulation S-K.We determined selling, general and administrative (“SG&A”) expense per average customer to be the most important financial performance measure used to link Company performance to compensation actually paid to our PEO and Non-PEO NEOs for our fiscal year ended April 30, 2025. SG&A expense per average customer is computed by dividing year to date selling, general and administrative expense by the average number of active customer accounts during the period. SG&A expense per average customer may not have been the most important financial performance measure for prior fiscal years, and we may determine a different financial performance measure to be the most important in future years.
|
|
|
|
|
| Current PEO [Member] |
|
|
|
|
|
| Pay vs Performance Disclosure |
|
|
|
|
|
| PEO Total Compensation Amount |
$ 1,553,513
|
$ 8,446,835
|
|
|
|
| PEO Actually Paid Compensation Amount |
$ (145,647)
|
2,889,896
|
|
|
|
| Former PEO [Member] |
|
|
|
|
|
| Pay vs Performance Disclosure |
|
|
|
|
|
| PEO Total Compensation Amount |
|
1,156,721
|
$ 928,554
|
$ 948,093
|
$ 797,506
|
| PEO Actually Paid Compensation Amount |
|
$ 1,072,413
|
$ 683,679
|
$ (12,096,573)
|
$ 17,578,077
|
| Douglas W. Campbell [Member] |
|
|
|
|
|
| Pay vs Performance Disclosure |
|
|
|
|
|
| PEO Name |
Douglas W. Campbell
|
Douglas W. Campbell
|
|
|
|
| Jeffrey A. Williams [Member] |
|
|
|
|
|
| Pay vs Performance Disclosure |
|
|
|
|
|
| PEO Name |
|
Jeffrey A. Williams
|
Jeffrey A. Williams
|
Jeffrey A. Williams
|
Jeffrey A. Williams
|
| PEO | Current PEO [Member] | Aggregate Pension Adjustments Service Cost |
|
|
|
|
|
| Pay vs Performance Disclosure |
|
|
|
|
|
| Adjustment to Compensation, Amount |
$ 0
|
$ 0
|
|
|
|
| PEO | Current PEO [Member] | Aggregate Grant Date Fair Value of Equity Award Amounts Reported in Summary Compensation Table |
|
|
|
|
|
| Pay vs Performance Disclosure |
|
|
|
|
|
| Adjustment to Compensation, Amount |
0
|
(7,135,076)
|
|
|
|
| PEO | Current PEO [Member] | Equity Awards Adjustments, Excluding Value Reported in Compensation Table |
|
|
|
|
|
| Pay vs Performance Disclosure |
|
|
|
|
|
| Adjustment to Compensation, Amount |
(1,699,160)
|
1,618,137
|
|
|
|
| PEO | Current PEO [Member] | Year-end Fair Value of Equity Awards Granted in Covered Year that are Outstanding and Unvested |
|
|
|
|
|
| Pay vs Performance Disclosure |
|
|
|
|
|
| Adjustment to Compensation, Amount |
0
|
2,782,921
|
|
|
|
| PEO | Current PEO [Member] | Year-over-Year Change in Fair Value of Equity Awards Granted in Prior Years That are Outstanding and Unvested |
|
|
|
|
|
| Pay vs Performance Disclosure |
|
|
|
|
|
| Adjustment to Compensation, Amount |
(971,772)
|
(1,442,693)
|
|
|
|
| PEO | Current PEO [Member] | Vesting Date Fair Value of Equity Awards Granted and Vested in Covered Year |
|
|
|
|
|
| Pay vs Performance Disclosure |
|
|
|
|
|
| Adjustment to Compensation, Amount |
0
|
0
|
|
|
|
| PEO | Current PEO [Member] | Change in Fair Value as of Vesting Date of Prior Year Equity Awards Vested in Covered Year |
|
|
|
|
|
| Pay vs Performance Disclosure |
|
|
|
|
|
| Adjustment to Compensation, Amount |
(727,388)
|
277,909
|
|
|
|
| PEO | Current PEO [Member] | Prior Year End Fair Value of Equity Awards Granted in Any Prior Year that Fail to Meet Applicable Vesting Conditions During Covered Year |
|
|
|
|
|
| Pay vs Performance Disclosure |
|
|
|
|
|
| Adjustment to Compensation, Amount |
$ 0
|
0
|
|
|
|
| PEO | Former PEO [Member] | Aggregate Pension Adjustments Service Cost |
|
|
|
|
|
| Pay vs Performance Disclosure |
|
|
|
|
|
| Adjustment to Compensation, Amount |
|
0
|
$ 0
|
$ 0
|
$ 0
|
| PEO | Former PEO [Member] | Aggregate Grant Date Fair Value of Equity Award Amounts Reported in Summary Compensation Table |
|
|
|
|
|
| Pay vs Performance Disclosure |
|
|
|
|
|
| Adjustment to Compensation, Amount |
|
0
|
0
|
0
|
0
|
| PEO | Former PEO [Member] | Equity Awards Adjustments, Excluding Value Reported in Compensation Table |
|
|
|
|
|
| Pay vs Performance Disclosure |
|
|
|
|
|
| Adjustment to Compensation, Amount |
|
(84,309)
|
(244,875)
|
(13,044,666)
|
16,780,571
|
| PEO | Former PEO [Member] | Year-end Fair Value of Equity Awards Granted in Covered Year that are Outstanding and Unvested |
|
|
|
|
|
| Pay vs Performance Disclosure |
|
|
|
|
|
| Adjustment to Compensation, Amount |
|
0
|
0
|
0
|
0
|
| PEO | Former PEO [Member] | Year-over-Year Change in Fair Value of Equity Awards Granted in Prior Years That are Outstanding and Unvested |
|
|
|
|
|
| Pay vs Performance Disclosure |
|
|
|
|
|
| Adjustment to Compensation, Amount |
|
(411,470)
|
(103,106)
|
(12,105,106)
|
16,034,174
|
| PEO | Former PEO [Member] | Vesting Date Fair Value of Equity Awards Granted and Vested in Covered Year |
|
|
|
|
|
| Pay vs Performance Disclosure |
|
|
|
|
|
| Adjustment to Compensation, Amount |
|
0
|
0
|
0
|
0
|
| PEO | Former PEO [Member] | Change in Fair Value as of Vesting Date of Prior Year Equity Awards Vested in Covered Year |
|
|
|
|
|
| Pay vs Performance Disclosure |
|
|
|
|
|
| Adjustment to Compensation, Amount |
|
327,162
|
(141,769)
|
(939,560)
|
746,397
|
| PEO | Former PEO [Member] | Prior Year End Fair Value of Equity Awards Granted in Any Prior Year that Fail to Meet Applicable Vesting Conditions During Covered Year |
|
|
|
|
|
| Pay vs Performance Disclosure |
|
|
|
|
|
| Adjustment to Compensation, Amount |
|
0
|
0
|
0
|
0
|
| Non-PEO NEO | Measure:: 1 |
|
|
|
|
|
| Pay vs Performance Disclosure |
|
|
|
|
|
| Name |
Earnings per share
|
|
|
|
|
| Non-PEO NEO | Measure:: 2 |
|
|
|
|
|
| Pay vs Performance Disclosure |
|
|
|
|
|
| Name |
Return on equity
|
|
|
|
|
| Non-PEO NEO | Measure:: 3 |
|
|
|
|
|
| Pay vs Performance Disclosure |
|
|
|
|
|
| Name |
Selling, general and administrative expense per average customer
|
|
|
|
|
| Non-PEO NEO | Aggregate Pension Adjustments Service Cost |
|
|
|
|
|
| Pay vs Performance Disclosure |
|
|
|
|
|
| Adjustment to Compensation, Amount |
$ 0
|
0
|
0
|
0
|
0
|
| Non-PEO NEO | Aggregate Grant Date Fair Value of Equity Award Amounts Reported in Summary Compensation Table |
|
|
|
|
|
| Pay vs Performance Disclosure |
|
|
|
|
|
| Adjustment to Compensation, Amount |
(275,005)
|
0
|
(1,235,867)
|
0
|
0
|
| Non-PEO NEO | Equity Awards Adjustments, Excluding Value Reported in Compensation Table |
|
|
|
|
|
| Pay vs Performance Disclosure |
|
|
|
|
|
| Adjustment to Compensation, Amount |
164,523
|
(483,251)
|
1,994,380
|
(3,135,136)
|
4,311,289
|
| Non-PEO NEO | Year-end Fair Value of Equity Awards Granted in Covered Year that are Outstanding and Unvested |
|
|
|
|
|
| Pay vs Performance Disclosure |
|
|
|
|
|
| Adjustment to Compensation, Amount |
272,641
|
0
|
2,049,466
|
0
|
0
|
| Non-PEO NEO | Year-over-Year Change in Fair Value of Equity Awards Granted in Prior Years That are Outstanding and Unvested |
|
|
|
|
|
| Pay vs Performance Disclosure |
|
|
|
|
|
| Adjustment to Compensation, Amount |
(55,150)
|
(425,135)
|
(7,384)
|
(2,665,356)
|
3,938,090
|
| Non-PEO NEO | Vesting Date Fair Value of Equity Awards Granted and Vested in Covered Year |
|
|
|
|
|
| Pay vs Performance Disclosure |
|
|
|
|
|
| Adjustment to Compensation, Amount |
0
|
0
|
0
|
0
|
0
|
| Non-PEO NEO | Change in Fair Value as of Vesting Date of Prior Year Equity Awards Vested in Covered Year |
|
|
|
|
|
| Pay vs Performance Disclosure |
|
|
|
|
|
| Adjustment to Compensation, Amount |
(52,968)
|
(58,116)
|
(47,703)
|
(469,780)
|
373,199
|
| Non-PEO NEO | Prior Year End Fair Value of Equity Awards Granted in Any Prior Year that Fail to Meet Applicable Vesting Conditions During Covered Year |
|
|
|
|
|
| Pay vs Performance Disclosure |
|
|
|
|
|
| Adjustment to Compensation, Amount |
$ 0
|
$ 0
|
$ 0
|
$ 0
|
$ 0
|