v3.25.2
Shareholder Report
6 Months Ended
Jun. 30, 2025
USD ($)
Holding
Shareholder Report [Line Items]  
Document Type N-CSRS
Amendment Flag false
Registrant Name FORUM FUNDS
Entity Central Index Key 0000315774
Entity Investment Company Type N-1A
Document Period End Date Jun. 30, 2025
C000012485  
Shareholder Report [Line Items]  
Fund Name Lisanti Small Cap Growth Fund
Trading Symbol ASCGX
Annual or Semi-Annual Statement [Text Block] This semi-annual shareholder report contains important information about the Lisanti Small Cap Growth Fund for the period of January 1, 2025, to June 30, 2025.
Shareholder Report Annual or Semi-Annual Semi-Annual Shareholder Report
Additional Information [Text Block]

This semi-annual shareholder report contains important information about the Lisanti Small Cap Growth Fund for the period of January 1, 2025, to June 30, 2025. You can find additional information about the Fund at https://lisantismallcap.com/investing-in-the-fund. You can also request this information by contacting us at (800) 441-7031.

Additional Information Phone Number (800) 441-7031
Additional Information Website https://lisantismallcap.com/investing-in-the-fund
Expenses [Text Block]

What were the Fund's costs for the last six months

(based on a hypothetical $10,000 investment)

Fund Name
Costs of a $10,000 investment
Costs paid as a percentage of a $10,000 investment
Lisanti Small Cap Growth Fund
$74
1.52%
Expenses Paid, Amount $ 74
Expense Ratio, Percent 1.52%
Factors Affecting Performance [Text Block]

How did the Fund perform in the last six months

The small cap market was volatile in the first part of the year, as investors digested the potential impact of “Liberation Day” on April 2, 2025 and the April 9, 2025 announcement of a 90-day pause in the implementation of most tariffs to allow time for negotiations with major trading partners. As the tariffs were paused, and exceptions to the tariffs began to be announced, markets calmed and the small cap market rebounded in the second quarter, as earnings were not as bad as investors feared. The outperformance was centered around companies who reported earnings growth stronger than investors expected. 


As growth investors, we are overweight Health Care, Information Technology, Industrials and Consumer Discretionary relative to the Russell 2000 Index and underweight Financials. Those sector weights drove performance, as did our focus on higher growth stocks, which tend to have higher valuations than the average small cap holding. Thus, the portfolio declined more than the benchmark during the first quarter but outperformed during the second quarter as the market rebounded; for the first half of the year, it underperformed its benchmark. 


We took advantage of the volatility in the spring to purchase companies with strong growth prospects at what we believe will prove to be bargain prices. We continue to focus on companies that have multiple idiosyncratic drivers of growth and a focus on improving profitability. 

Performance Past Does Not Indicate Future [Text] The Fund’s past performance is not a good predictor of how the Fund will perform in the future.
Line Graph [Table Text Block]
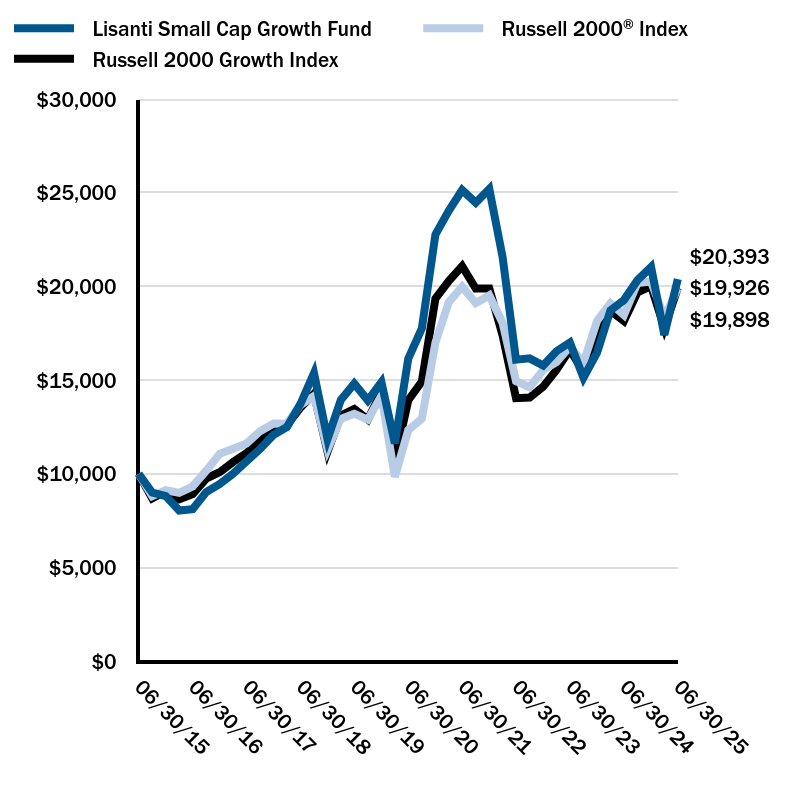
Growth of 10K Chart
Date
Lisanti Small Cap Growth Fund
Russell 2000® Index
Russell 2000 Growth Index
06/30/15
$10,000
$10,000
$10,000
09/30/15
$9,000
$8,808
$8,694
12/31/15
$8,815
$9,125
$9,069
03/31/16
$8,040
$8,986
$8,645
06/30/16
$8,115
$9,327
$8,925
09/30/16
$9,033
$10,171
$9,748
12/31/16
$9,460
$11,069
$10,096
03/31/17
$10,006
$11,342
$10,636
06/30/17
$10,672
$11,621
$11,103
09/30/17
$11,333
$12,280
$11,793
12/31/17
$12,089
$12,690
$12,334
03/31/18
$12,500
$12,680
$12,617
06/30/18
$13,728
$13,663
$13,530
09/30/18
$15,379
$14,151
$14,277
12/31/18
$11,859
$11,293
$11,186
03/31/19
$13,942
$12,940
$13,104
06/30/19
$14,813
$13,211
$13,464
09/30/19
$13,922
$12,894
$12,902
12/31/19
$14,899
$14,175
$14,372
03/31/20
$11,626
$9,835
$10,669
06/30/20
$16,152
$12,335
$13,932
09/30/20
$17,767
$12,944
$14,929
12/31/20
$22,773
$17,005
$19,349
03/31/21
$24,038
$19,164
$20,292
06/30/21
$25,149
$19,987
$21,087
09/30/21
$24,472
$19,115
$19,895
12/31/21
$25,206
$19,524
$19,898
03/31/22
$21,573
$18,055
$17,385
06/30/22
$16,095
$14,951
$14,038
09/30/22
$16,163
$14,624
$14,072
12/31/22
$15,785
$15,534
$14,653
03/31/23
$16,543
$15,960
$15,543
06/30/23
$17,011
$16,790
$16,639
09/30/23
$15,137
$15,929
$15,421
12/31/23
$16,473
$18,164
$17,387
03/31/24
$18,725
$19,105
$18,705
06/30/24
$19,273
$18,479
$18,159
09/30/24
$20,339
$20,192
$19,687
12/31/24
$21,037
$20,260
$20,022
03/31/25
$17,419
$18,340
$17,796
06/30/25
$20,393
$19,898
$19,926
Average Annual Return [Table Text Block]
 
One Year
Five Year
Ten Year
Lisanti Small Cap Growth Fund
5.81%
4.77%
7.39%
Russell 2000® Index
7.68%
10.04%
7.12%
Russell 2000 Growth Index
9.73%
7.42%
7.14%
No Deduction of Taxes [Text Block] The graph and table do not reflect the deduction of taxes that a shareholder would pay on Fund distributions or redemption of Fund shares.
Performance Table Market Index Changed [Text Block] Effective May 1, 2024, the Fund changed its primary benchmark from the Russell 2000 Growth Index to the Russell 2000 Index due to regulatory requirements. The Fund retained the Russell 2000 Growth Index as a secondary benchmark because the Russell 2000 Growth Index more closely aligns with the Fund’s investment strategies and investment restrictions. 
Prior Market Index Comparison [Text Block] The Fund retained the Russell 2000 Growth Index as a secondary benchmark
Updated Performance Information Location [Text Block]  
AssetsNet $ 16,833,230
Holdings Count | Holding 93
Advisory Fees Paid, Amount $ 19,121
InvestmentCompanyPortfolioTurnover 200.00%
Additional Fund Statistics [Text Block]

Fund Statistics

Total Net Assets
$16,833,230
# of Portfolio Holdings
93
Portfolio Turnover Rate
200%
Investment Advisory Fees (Net of fees waived)
$19,121
Holdings [Text Block]

Sector Weightings

(% total investments)*

Group By Industry Chart
Value
Value
Industrials
25.0%
Information Technology
24.5%
Health-Care
18.7%
Consumer Discretionary
16.2%
Financials
4.8%
Consumer Staples
3.8%
Materials
2.8%
Communication Services
2.5%
Energy
1.5%
Utilities
0.2%

* excluding cash equivalents

Asset Class Weightings 

(% total investments)

Group By Asset Type Chart
Value
Value
Common Stock
98.7%
Money Market Fund
1.3%
Largest Holdings [Text Block]

Top Ten Holdings 

(% total  investments)*

Credo Technology Group Holding, Ltd.
2.59%
Magnite, Inc.
2.51%
Lumentum Holdings, Inc.
2.23%
National Vision Holdings, Inc.
2.16%
Boot Barn Holdings, Inc.
2.16%
Sterling Infrastructure, Inc.
2.02%
ARS Pharmaceuticals, Inc.
2.02%
Commvault Systems, Inc.
1.88%
American Superconductor Corp.
1.84%
Construction Partners, Inc., Class A
1.83%

* excluding cash equivalents