| ASX RELEASE Westpac Banking Corporation Level 18, 275 Kent Street Sydney, NSW, 2000 14 August 2025 WESTPAC 3Q25 INVESTOR DISCUSSION PACK Following are Westpac’s 3Q25 slides covering financial performance, capital, credit quality and funding for the three months ended 30 June 2025. For further information: Hayden Cooper Justin McCarthy Group Head of Media Relations General Manager, Investor Relations and Corporate & Business Development 0402 393 619 0422 800 321 This document has been authorised for release by Tim Hartin, Company Secretary. |
| © Westpac Banking Corporation ABN 33 007 457 141 3Q25 INVESTOR DISCUSSION PACK FOR THE 3 MONTHS ENDED 30 JUNE 2025 This document should be read in conjunction with Westpac’s June 2025 Pillar 3 Report. All amounts are in Australian dollars. |
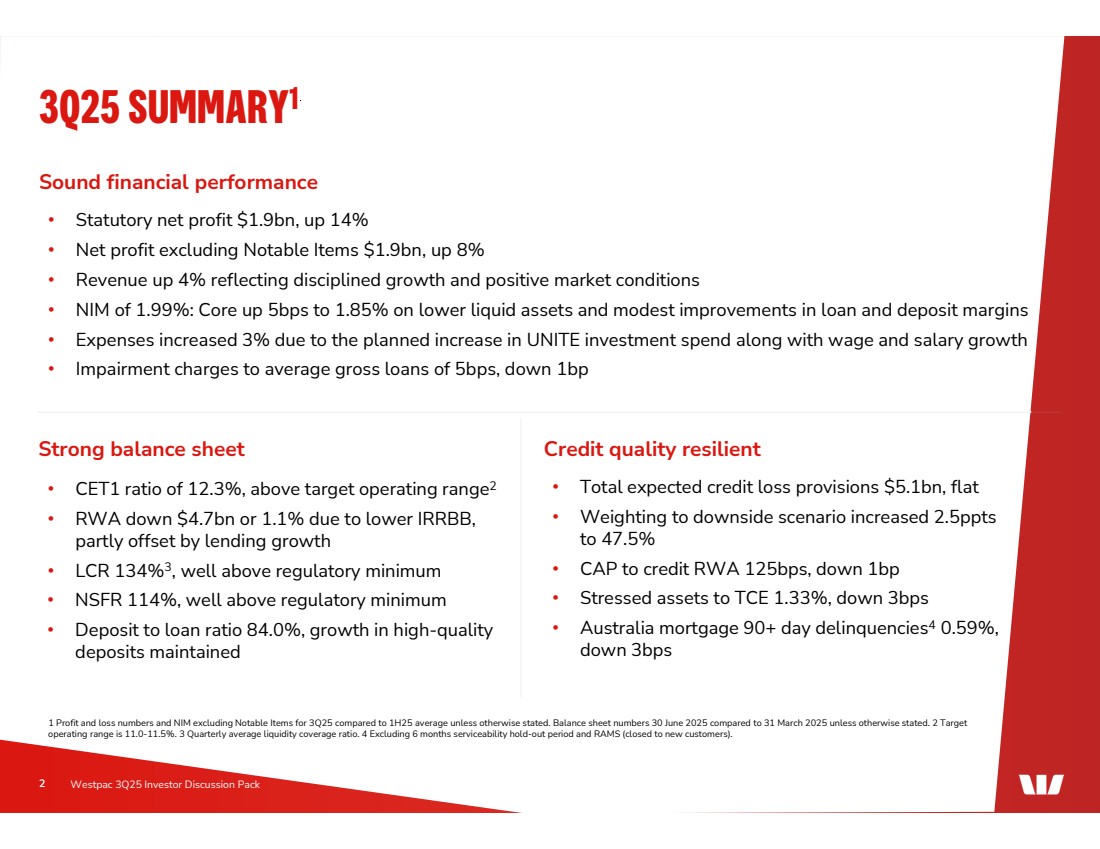
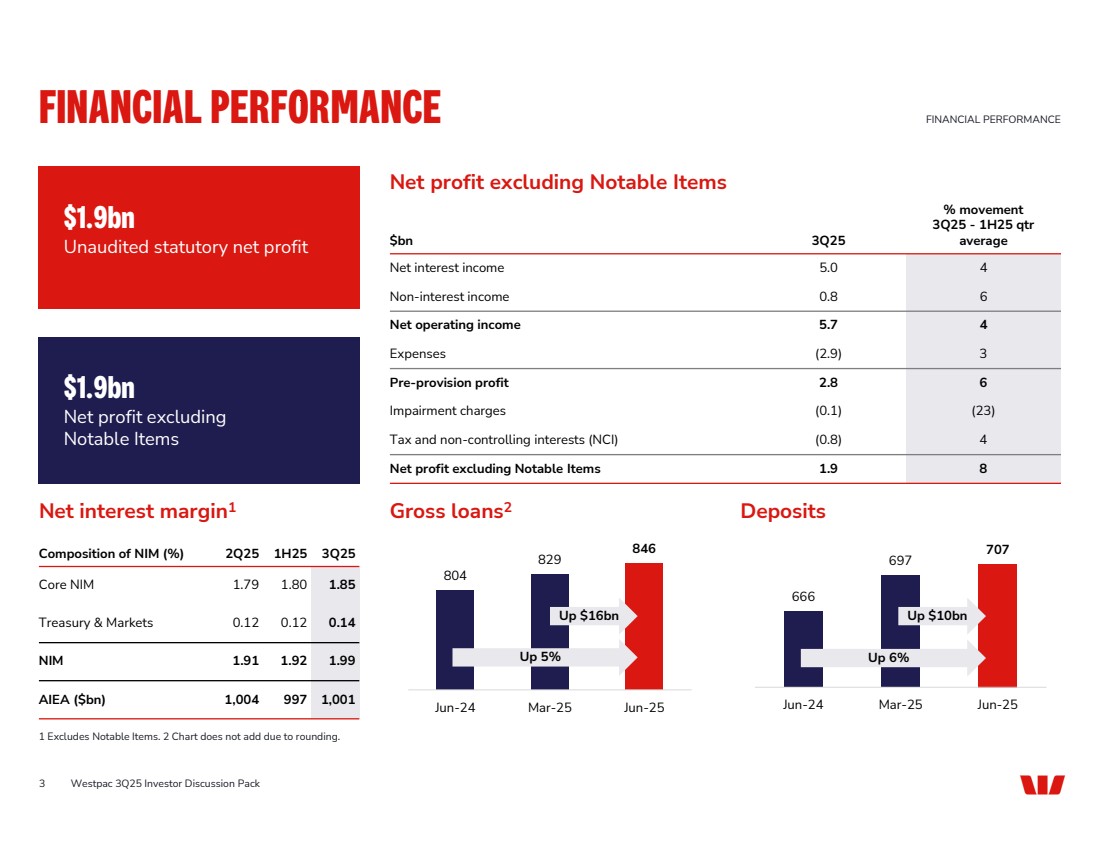
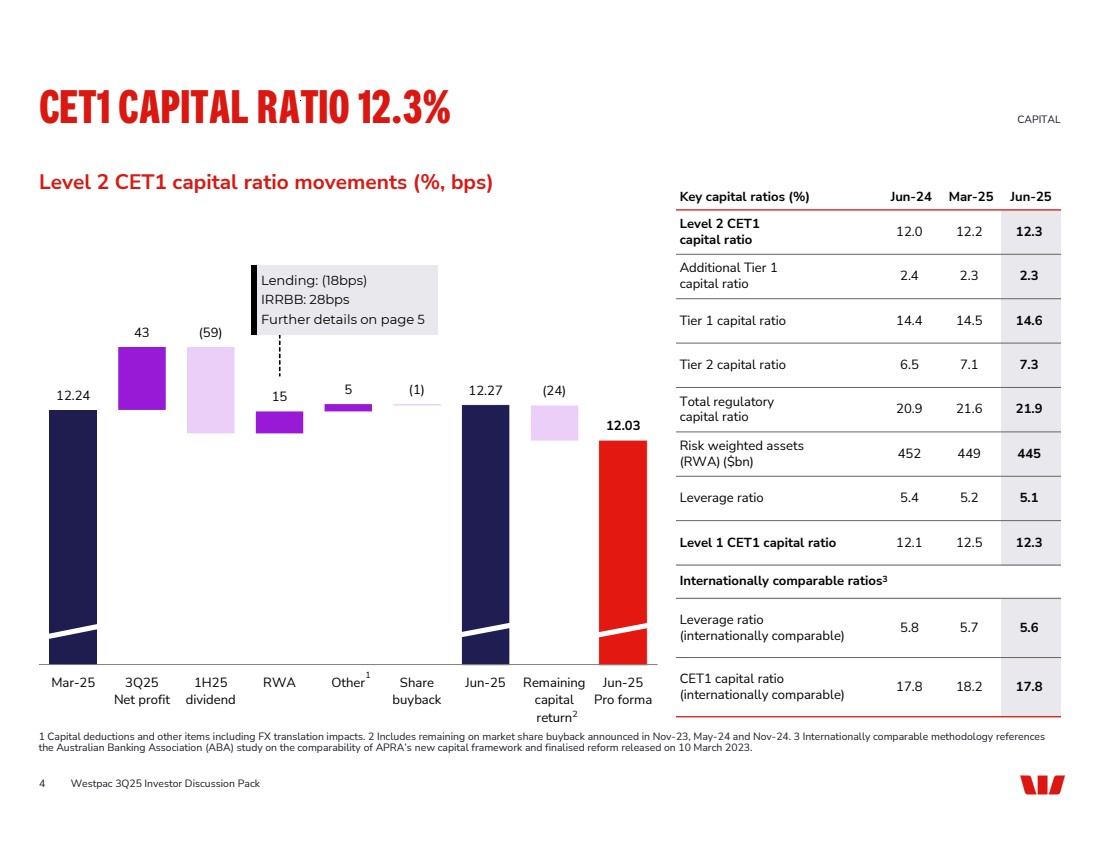
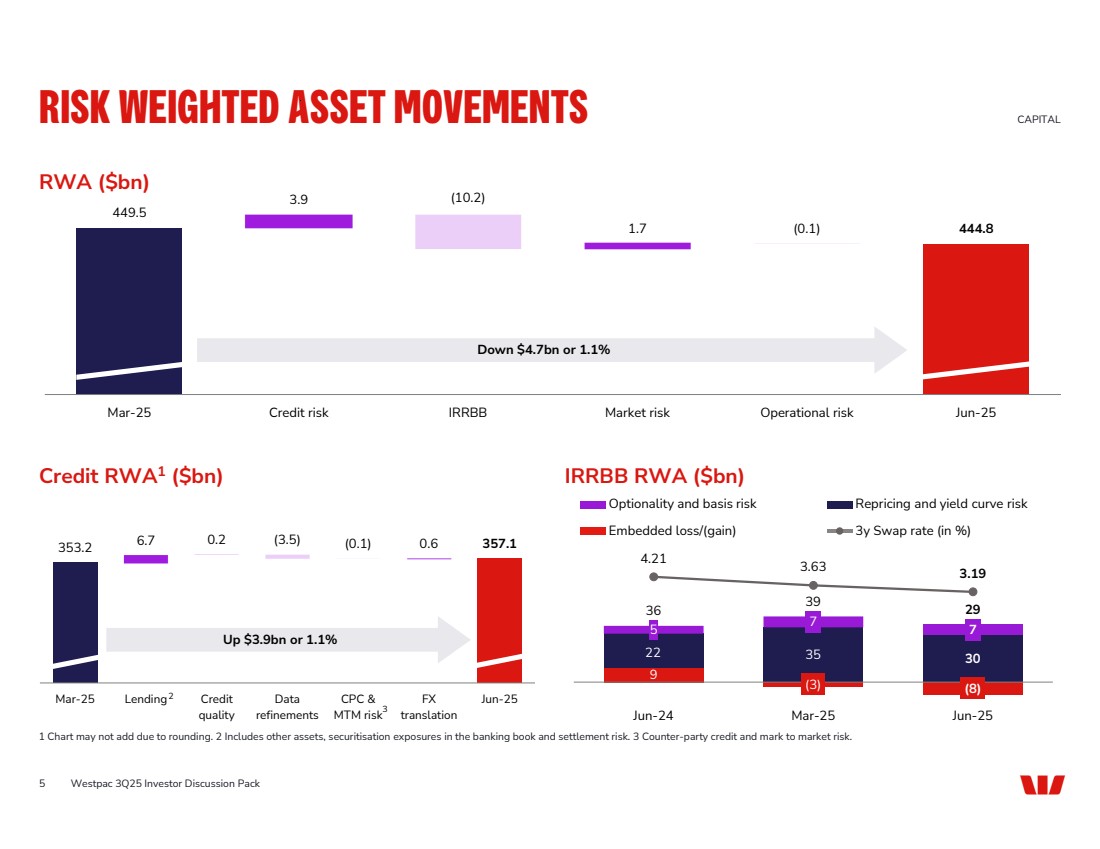
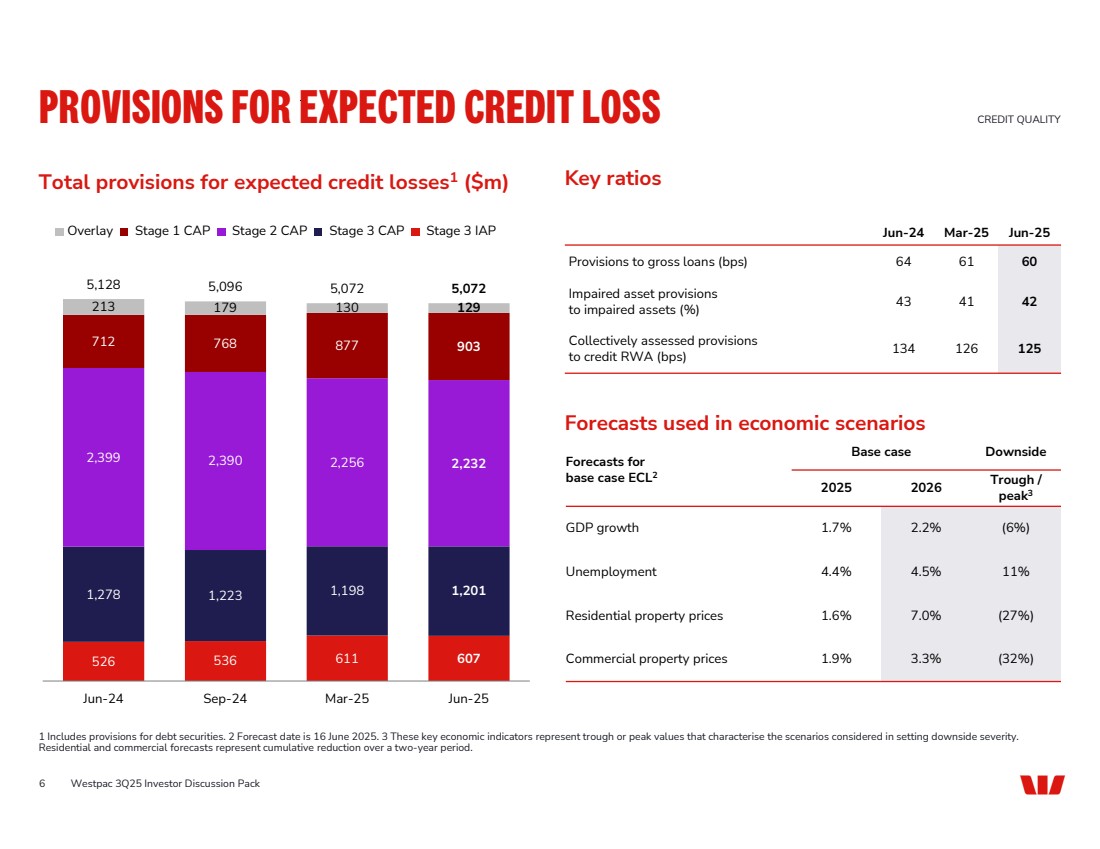
| 3Q25 SUMMARY1 1 Profit and loss numbers and NIM excluding Notable Items for 3Q25 compared to 1H25 average unless otherwise stated. Balance sheet numbers 30 June 2025 compared to 31 March 2025 unless otherwise stated. 2 Target operating range is 11.0-11.5%. 3 Quarterly average liquidity coverage ratio. 4 Excluding 6 months serviceability hold-out period and RAMS (closed to new customers). Sound financial performance • Statutory net profit $1.9bn, up 14% • Net profit excluding Notable Items $1.9bn, up 8% • Revenue up 4% reflecting disciplined growth and positive market conditions • NIM of 1.99%: Core up 5bps to 1.85% on lower liquid assets and modest improvements in loan and deposit margins • Expenses increased 3% due to the planned increase in UNITE investment spend along with wage and salary growth • Impairment charges to average gross loans of 5bps, down 1bp • CET1 ratio of 12.3%, above target operating range2 • RWA down $4.7bn or 1.1% due to lower IRRBB, partly offset by lending growth • LCR 134%3, well above regulatory minimum • NSFR 114%, well above regulatory minimum • Deposit to loan ratio 84.0%, growth in high-quality deposits maintained • Total expected credit loss provisions $5.1bn, flat • Weighting to downside scenario increased 2.5ppts to 47.5% • CAP to credit RWA 125bps, down 1bp • Stressed assets to TCE 1.33%, down 3bps • Australia mortgage 90+ day delinquencies4 0.59%, down 3bps Strong balance sheet Credit quality resilient 2 Westpac 3Q25 Investor Discussion Pack |
| Net interest margin1 Gross loans2 Deposits Westpac 3Q25 Investor Discussion Pack FINANCIAL PERFORMANCE FINANCIAL PERFORMANCE 1 Excludes Notable Items. 2 Chart does not add due to rounding. Net profit excluding Notable Items Excluding Notable Items $1.9bn Net profit excluding Notable Items $1.9bn Unaudited statutory net profit % movement 3Q25 - 1H25 qtr $bn 3Q25 average Net interest income 5.0 4 Non-interest income 0.8 6 Net operating income 5.7 4 Expenses (2.9) 3 Pre-provision profit 2.8 6 Impairment charges (0.1) (23) Tax and non-controlling interests (NCI) (0.8) 4 Net profit excluding Notable Items 1.9 8 3 Composition of NIM (%) 2Q25 1H25 3Q25 Core NIM 1.79 1.80 1.85 Treasury & Markets 0.12 0.12 0.14 NIM 1.91 1.92 1.99 AIEA ($bn) 1,004 997 1,001 804 829 846 Jun-24 Mar-25 Jun-25 666 697 707 Jun-24 Mar-25 Jun-25 Up 5% Up 6% Up $16bn Up $10bn |
| 12.24 43 15 5 12.27 12.03 (59) (1) (24) Mar-25 3Q25 Net profit 1H25 dividend RWA Other Share buyback Jun-25 Remaining capital return Jun-25 Pro forma Key capital ratios (%) Jun-24 Mar-25 Jun-25 12.0 12.2 12.3 Level 2 CET1 capital ratio 2.4 2.3 2.3 Additional Tier 1 capital ratio Tier 1 capital ratio 14.4 14.5 14.6 Tier 2 capital ratio 6.5 7.1 7.3 20.9 21.6 21.9 Total regulatory capital ratio 452 449 445 Risk weighted assets (RWA) ($bn) Leverage ratio 5.4 5.2 5.1 Level 1 CET1 capital ratio 12.1 12.5 12.3 Internationally comparable ratios3 5.8 5.7 5.6 Leverage ratio (internationally comparable) 17.8 18.2 17.8 CET1 capital ratio (internationally comparable) Level 2 CET1 capital ratio movements (%, bps) CET1 CAPITAL RATIO 12.3% CAPITAL 1 Capital deductions and other items including FX translation impacts. 2 Includes remaining on market share buyback announced in Nov-23, May-24 and Nov-24. 3 Internationally comparable methodology references the Australian Banking Association (ABA) study on the comparability of APRA’s new capital framework and finalised reform released on 10 March 2023. 1 Lending: (18bps) IRRBB: 28bps Further details on page 5 Westpac 3Q25 Investor Discussion Pack 2 4 |
| (0.1) 449.5 3.9 1.7 444.8 (10.2) Mar-25 Credit risk IRRBB Market risk Operational risk Jun-25 RWA ($bn) Credit RWA1 ($bn) IRRBB RWA ($bn) 9 (3) (8) 22 35 30 5 7 7 36 39 29 4.21 3.63 3.19 -4 -3 -2 -1 0 1 2 3 4 -10 0 10 20 30 40 50 60 70 Jun-24 Mar-25 Jun-25 RISK WEIGHTED ASSET MOVEMENTS CAPITAL 1 Chart may not add due to rounding. 2 Includes other assets, securitisation exposures in the banking book and settlement risk. 3 Counter-party credit and mark to market risk. 353.2 6.7 0.2 (3.5) (0.1) 0.6 357.1 Mar-25 Lending Credit quality Data refinements CPC & MTM risk FX translation Jun-25 Up $3.9bn or 1.1% Down $4.7bn or 1.1% 3 Westpac 3Q25 Investor Discussion Pack Optionality and basis risk Embedded loss/(gain) Repricing and yield curve risk 3y Swap rate (in %) 5 2 |
| 526 536 611 607 1,278 1,223 1,198 1,201 2,399 2,390 2,256 2,232 712 768 877 903 213 179 130 129 5,128 5,096 5,072 5,072 Jun-24 Sep-24 Mar-25 Jun-25 Overlay Stage 1 CAP Stage 2 CAP Stage 3 CAP Stage 3 IAP Base case Downside Forecasts for base case ECL2 Trough / peak3 2025 2026 GDP growth 1.7% 2.2% (6%) Unemployment 4.4% 4.5% 11% Residential property prices 1.6% 7.0% (27%) Commercial property prices 1.9% 3.3% (32%) Total provisions for expected credit losses1 ($m) Key ratios PROVISIONS FOR EXPECTED CREDIT LOSS CREDIT QUALITY 1 Includes provisions for debt securities. 2 Forecast date is 16 June 2025. 3 These key economic indicators represent trough or peak values that characterise the scenarios considered in setting downside severity. Residential and commercial forecasts represent cumulative reduction over a two-year period. Jun-24 Mar-25 Jun-25 Provisions to gross loans (bps) 64 61 60 43 41 42 Impaired asset provisions to impaired assets (%) 134 126 125 Collectively assessed provisions to credit RWA (bps) Westpac 3Q25 Investor Discussion Pack Forecasts used in economic scenarios 6 |
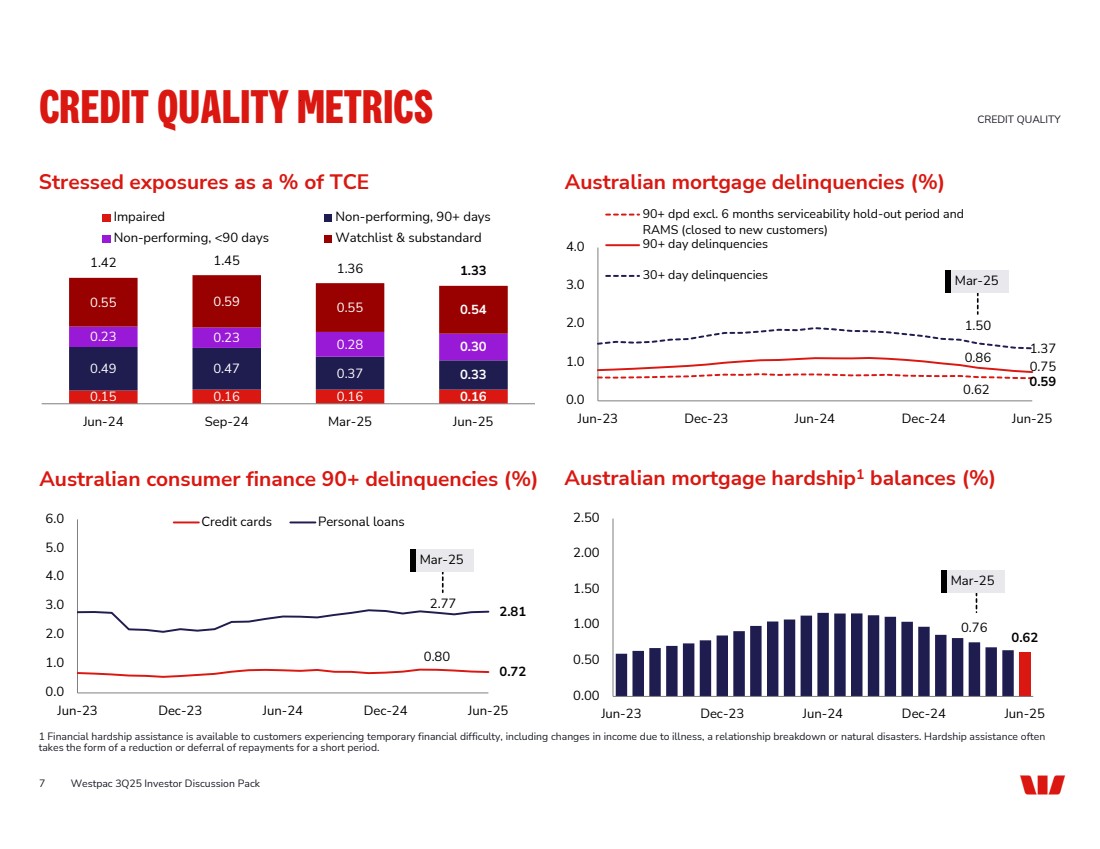
| 0.62 0.59 0.86 0.75 1.50 1.37 0.0 1.0 2.0 3.0 4.0 Jun-23 Dec-23 Jun-24 Dec-24 Jun-25 90+ dpd excl. 6 months serviceability hold-out period and RAMS (closed to new customers) 90+ day delinquencies 30+ day delinquencies 0.80 0.72 2.77 2.81 0.0 1.0 2.0 3.0 4.0 5.0 6.0 Jun-23 Dec-23 Jun-24 Dec-24 Jun-25 Credit cards Personal loans 0.15 0.16 0.16 0.16 0.49 0.47 0.37 0.33 0.23 0.23 0.28 0.30 0.55 0.59 0.55 0.54 1.42 1.45 1.36 1.33 Jun-24 Sep-24 Mar-25 Jun-25 Impaired Non-performing, 90+ days Non-performing, <90 days Watchlist & substandard Australian mortgage delinquencies (%) Australian consumer finance 90+ delinquencies (%) Stressed exposures as a % of TCE CREDIT QUALITY METRICS CREDIT QUALITY 1 Financial hardship assistance is available to customers experiencing temporary financial difficulty, including changes in income due to illness, a relationship breakdown or natural disasters. Hardship assistance often takes the form of a reduction or deferral of repayments for a short period. Westpac 3Q25 Investor Discussion Pack Australian mortgage hardship1 balances (%) Mar-25 Mar-25 Mar-25 0.76 0.62 0.00 0.50 1.00 1.50 2.00 2.50 Jun-23 Dec-23 Jun-24 Dec-24 Jun-25 7 |
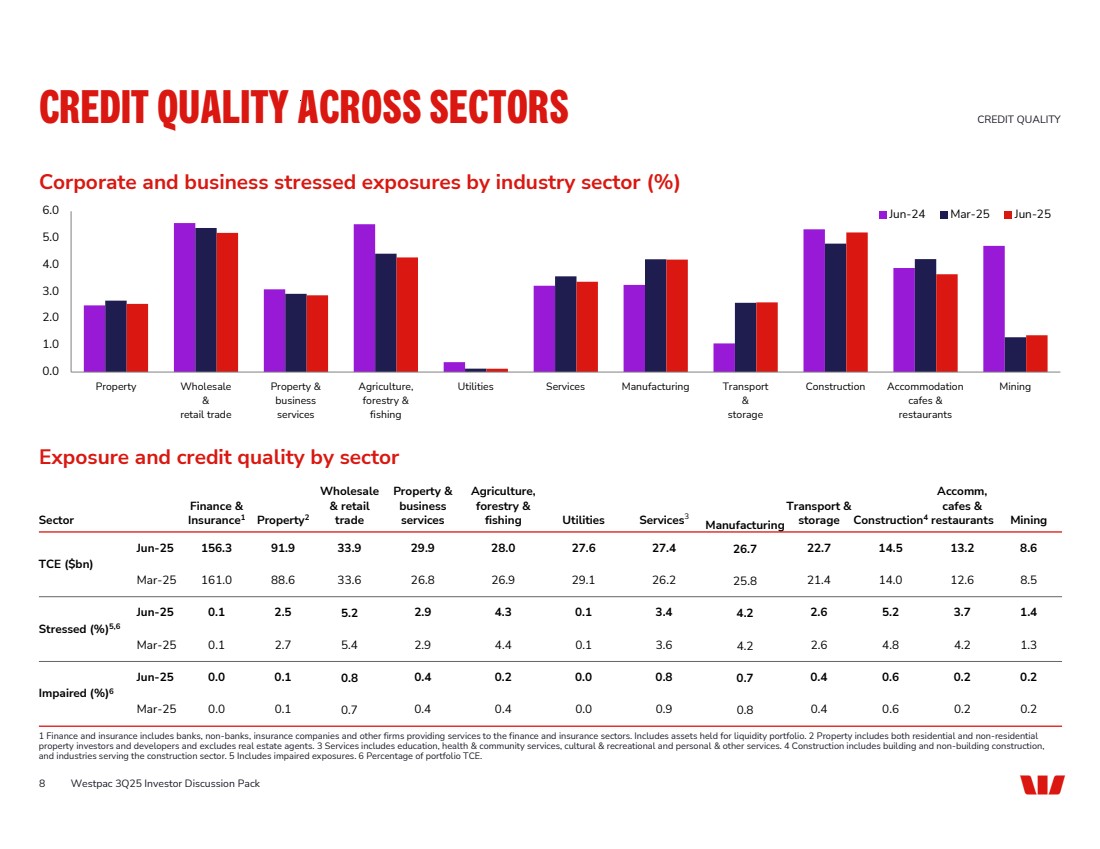
| 0.0 1.0 2.0 3.0 4.0 5.0 6.0 Property Wholesale & retail trade Property & business services Agriculture, forestry & fishing Utilities Services Manufacturing Transport & storage Construction Accommodation cafes & restaurants Mining Jun-24 Mar-25 Jun-25 Corporate and business stressed exposures by industry sector (%) Exposure and credit quality by sector Mining Accomm, cafes & Construction restaurants 4 Transport & Services Manufacturing storage Utilities 3 Agriculture, forestry & fishing Property & business services Wholesale & retail Property trade 2 Finance & Insurance Sector 1 Jun-25 156.3 91.9 33.9 29.9 28.0 27.6 27.4 26.7 22.7 14.5 13.2 8.6 TCE ($bn) Mar-25 161.0 88.6 33.6 26.8 26.9 29.1 26.2 25.8 21.4 14.0 12.6 8.5 Jun-25 0.1 2.5 5.2 2.9 4.3 0.1 3.4 4.2 2.6 5.2 3.7 1.4 Stressed (%)5,6 Mar-25 0.1 2.7 5.4 2.9 4.4 0.1 3.6 4.2 2.6 4.8 4.2 1.3 Jun-25 0.0 0.1 0.8 0.4 0.2 0.0 0.8 0.7 0.4 0.6 0.2 0.2 Impaired (%)6 Mar-25 0.0 0.1 0.7 0.4 0.4 0.0 0.9 0.8 0.4 0.6 0.2 0.2 CREDIT QUALITY ACROSS SECTORS CREDIT QUALITY 1 Finance and insurance includes banks, non-banks, insurance companies and other firms providing services to the finance and insurance sectors. Includes assets held for liquidity portfolio. 2 Property includes both residential and non-residential property investors and developers and excludes real estate agents. 3 Services includes education, health & community services, cultural & recreational and personal & other services. 4 Construction includes building and non-building construction, and industries serving the construction sector. 5 Includes impaired exposures. 6 Percentage of portfolio TCE. 8 Westpac 3Q25 Investor Discussion Pack |
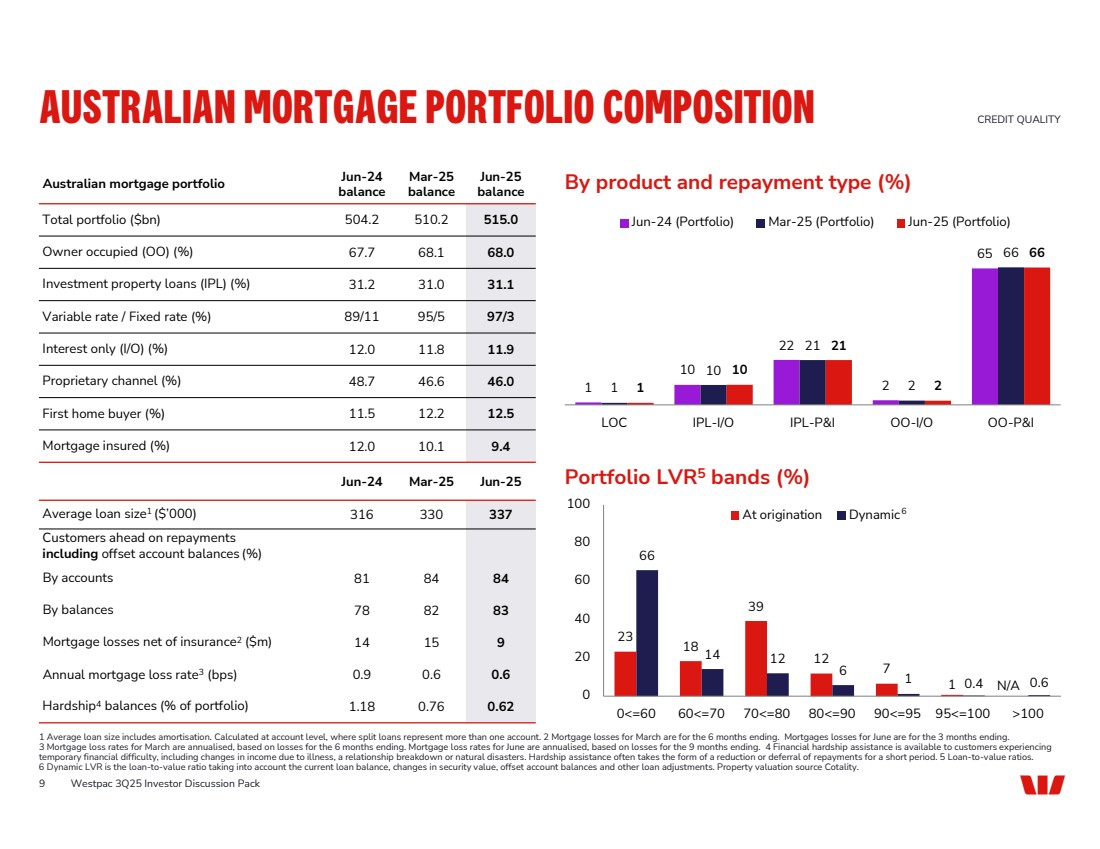
| Jun-25 balance Mar-25 balance Jun-24 balance Australian mortgage portfolio Total portfolio ($bn) 504.2 510.2 515.0 Owner occupied (OO) (%) 67.7 68.1 68.0 Investment property loans (IPL) (%) 31.2 31.0 31.1 Variable rate / Fixed rate (%) 89/11 95/5 97/3 Interest only (I/O) (%) 12.0 11.8 11.9 Proprietary channel (%) 48.7 46.6 46.0 First home buyer (%) 11.5 12.2 12.5 Mortgage insured (%) 12.0 10.1 9.4 Jun-24 Mar-25 Jun-25 Average loan size 316 330 337 1 ($’000) Customers ahead on repayments including offset account balances (%) By accounts 81 84 84 By balances 78 82 83 Mortgage losses net of insurance 14 15 9 2 ($m) Annual mortgage loss rate 0.9 0.6 0.6 3 (bps) Hardship 1.18 0.76 0.62 4 balances (% of portfolio) AUSTRALIAN MORTGAGE PORTFOLIO COMPOSITION CREDIT QUALITY 1 Average loan size includes amortisation. Calculated at account level, where split loans represent more than one account. 2 Mortgage losses for March are for the 6 months ending. Mortgages losses for June are for the 3 months ending. 3 Mortgage loss rates for March are annualised, based on losses for the 6 months ending. Mortgage loss rates for June are annualised, based on losses for the 9 months ending. 4 Financial hardship assistance is available to customers experiencing temporary financial difficulty, including changes in income due to illness, a relationship breakdown or natural disasters. Hardship assistance often takes the form of a reduction or deferral of repayments for a short period. 5 Loan-to-value ratios. 6 Dynamic LVR is the loan-to-value ratio taking into account the current loan balance, changes in security value, offset account balances and other loan adjustments. Property valuation source Cotality. 9 Westpac 3Q25 Investor Discussion Pack By product and repayment type (%) Portfolio LVR5 bands (%) 1 10 22 2 65 1 10 21 2 66 1 10 21 2 66 LOC IPL-I/O IPL-P&I OO-I/O OO-P&I Jun-24 (Portfolio) Mar-25 (Portfolio) Jun-25 (Portfolio) 23 18 39 12 7 1 66 14 12 6 1 0.4 0.6 0 20 40 60 80 100 0<=60 60<=70 70<=80 80<=90 90<=95 95<=100 >100 At origination Dynamic6 N/A |
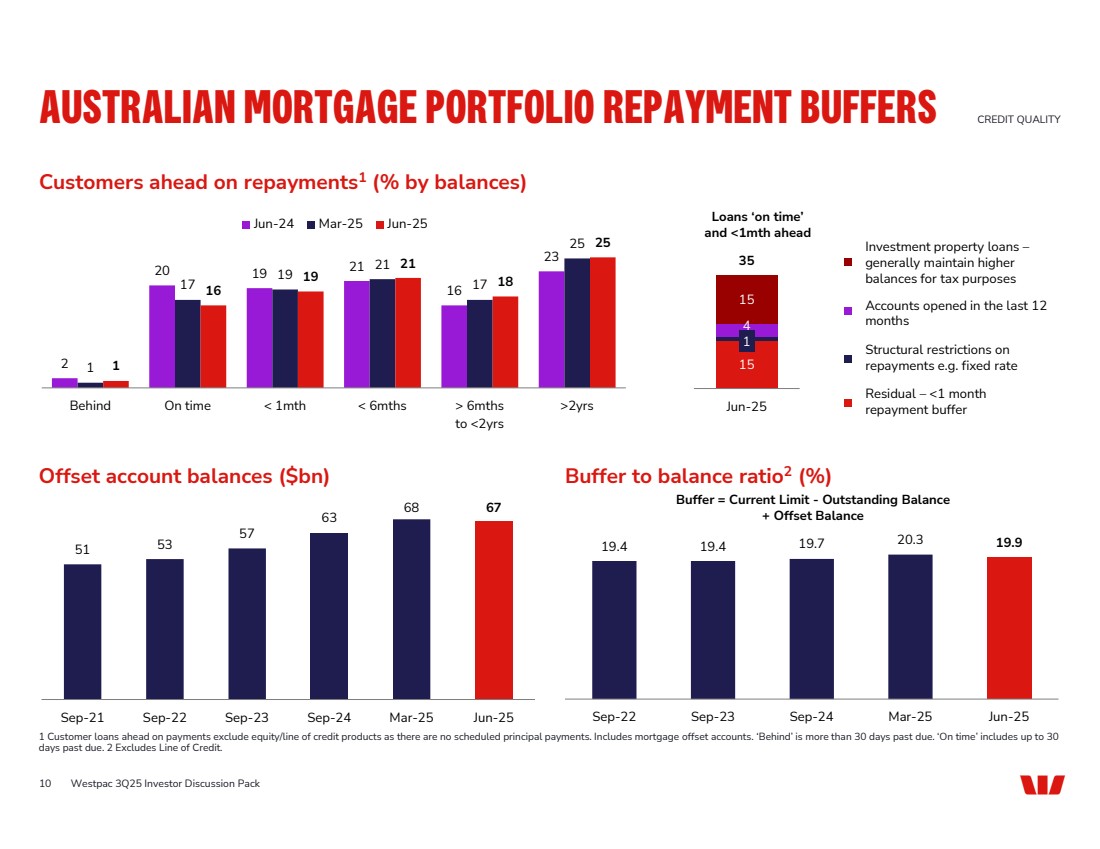
| 10 Customers ahead on repayments1 (% by balances) Offset account balances ($bn) Buffer to balance ratio2 (%) Westpac 3Q25 Investor Discussion Pack AUSTRALIAN MORTGAGE PORTFOLIO REPAYMENT BUFFERS CREDIT QUALITY 1 Customer loans ahead on payments exclude equity/line of credit products as there are no scheduled principal payments. Includes mortgage offset accounts. ‘Behind’ is more than 30 days past due. ‘On time’ includes up to 30 days past due. 2 Excludes Line of Credit. 15 1 4 15 35 Jun-25 Investment property loans – generally maintain higher balances for tax purposes Accounts opened in the last 12 months Structural restrictions on repayments e.g. fixed rate Residual – <1 month repayment buffer Loans ‘on time’ and <1mth ahead 19.4 19.4 19.7 20.3 19.9 Sep-22 Sep-23 Sep-24 Mar-25 Jun-25 Buffer = Current Limit - Outstanding Balance + Offset Balance 51 53 57 63 68 67 Sep-21 Sep-22 Sep-23 Sep-24 Mar-25 Jun-25 2 20 19 21 16 23 1 17 19 21 17 25 1 16 19 21 18 25 Behind On time < 1mth < 6mths > 6mths to <2yrs >2yrs Jun-24 Mar-25 Jun-25 |
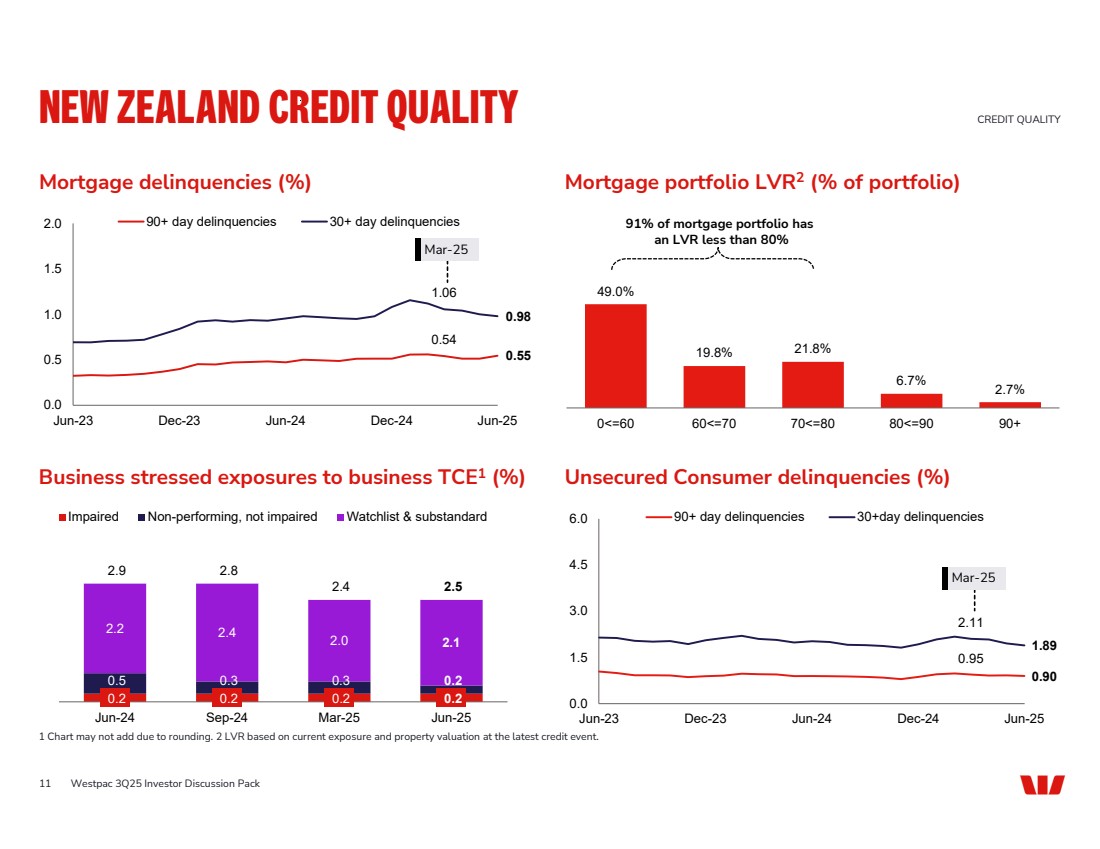
| 0.54 0.55 1.06 0.98 0.0 0.5 1.0 1.5 2.0 Jun-23 Dec-23 Jun-24 Dec-24 Jun-25 90+ day delinquencies 30+ day delinquencies Mortgage delinquencies (%) Mortgage portfolio LVR2 (% of portfolio) Business stressed exposures to business TCE1 (%) Unsecured Consumer delinquencies (%) NEW ZEALAND CREDIT QUALITY CREDIT QUALITY 1 Chart may not add due to rounding. 2 LVR based on current exposure and property valuation at the latest credit event. 49.0% 19.8% 21.8% 6.7% 2.7% 0<=60 60<=70 70<=80 80<=90 90+ 0.2 0.2 0.2 0.2 0.5 0.3 0.3 0.2 2.2 2.4 2.0 2.1 2.9 2.8 2.4 2.5 Jun-24 Sep-24 Mar-25 Jun-25 Impaired Non-performing, not impaired Watchlist & substandard 0.95 0.90 2.11 1.89 0.0 1.5 3.0 4.5 6.0 Jun-23 Dec-23 Jun-24 Dec-24 Jun-25 90+ day delinquencies 30+day delinquencies 91% of mortgage portfolio has an LVR less than 80% Westpac 3Q25 Investor Discussion Pack Mar-25 Mar-25 11 |
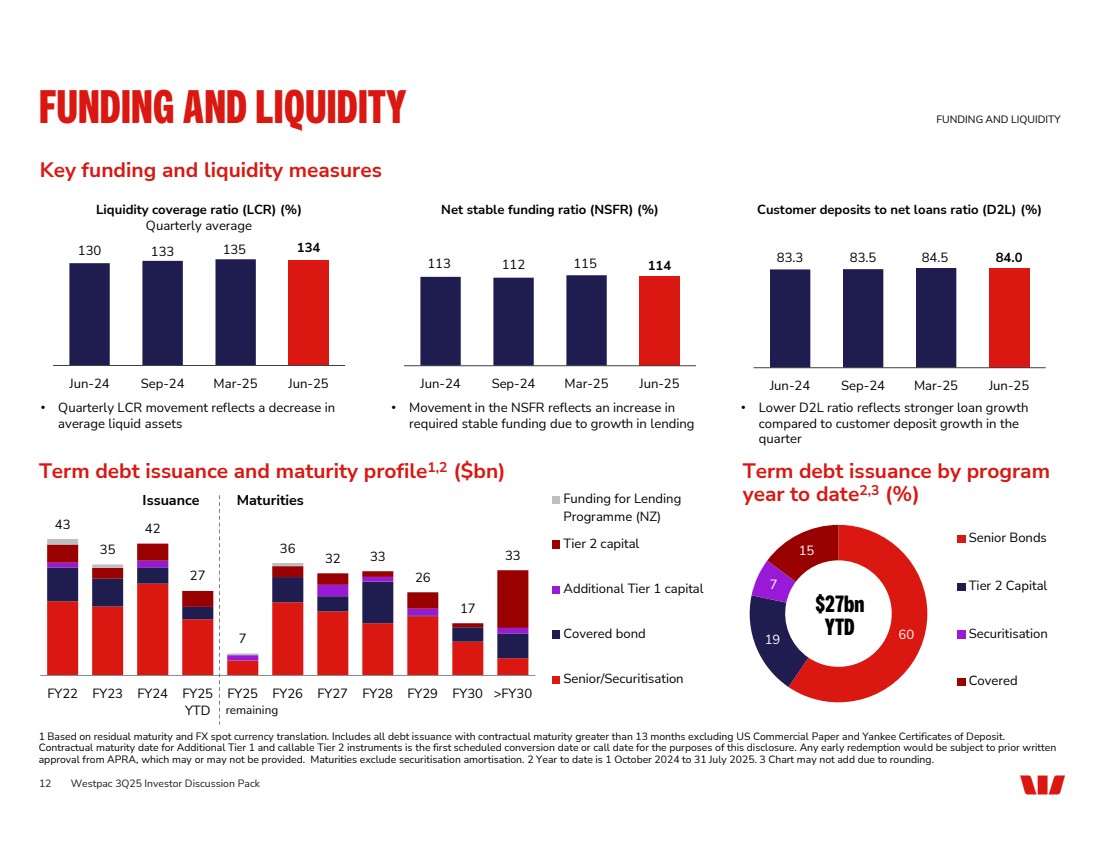
| Term debt issuance and maturity profile1,2 ($bn) FUNDING AND LIQUIDITY 1 Based on residual maturity and FX spot currency translation. Includes all debt issuance with contractual maturity greater than 13 months excluding US Commercial Paper and Yankee Certificates of Deposit. Contractual maturity date for Additional Tier 1 and callable Tier 2 instruments is the first scheduled conversion date or call date for the purposes of this disclosure. Any early redemption would be subject to prior written approval from APRA, which may or may not be provided. Maturities exclude securitisation amortisation. 2 Year to date is 1 October 2024 to 31 July 2025. 3 Chart may not add due to rounding. Key funding and liquidity measures Liquidity coverage ratio (LCR) (%) Quarterly average Net stable funding ratio (NSFR) (%) Customer deposits to net loans ratio (D2L) (%) • Quarterly LCR movement reflects a decrease in average liquid assets • Lower D2L ratio reflects stronger loan growth compared to customer deposit growth in the quarter • Movement in the NSFR reflects an increase in required stable funding due to growth in lending Term debt issuance by program year to date2,3 (%) 12 Westpac 3Q25 Investor Discussion Pack 130 133 135 134 Jun-24 Sep-24 Mar-25 Jun-25 113 112 115 114 Jun-24 Sep-24 Mar-25 Jun-25 83.3 83.5 84.5 84.0 Jun-24 Sep-24 Mar-25 Jun-25 FUNDING AND LIQUIDITY 43 35 42 27 7 36 32 33 26 17 33 FY22 FY23 FY24 FY25 YTD FY25 FY26 FY27 FY28 FY29 FY30 >FY30 Funding for Lending Programme (NZ) Tier 2 capital Additional Tier 1 capital Covered bond Senior/Securitisation 60 19 7 15 Senior Bonds Tier 2 Capital Securitisation Covered Issuance Maturities remaining $27bn YTD |
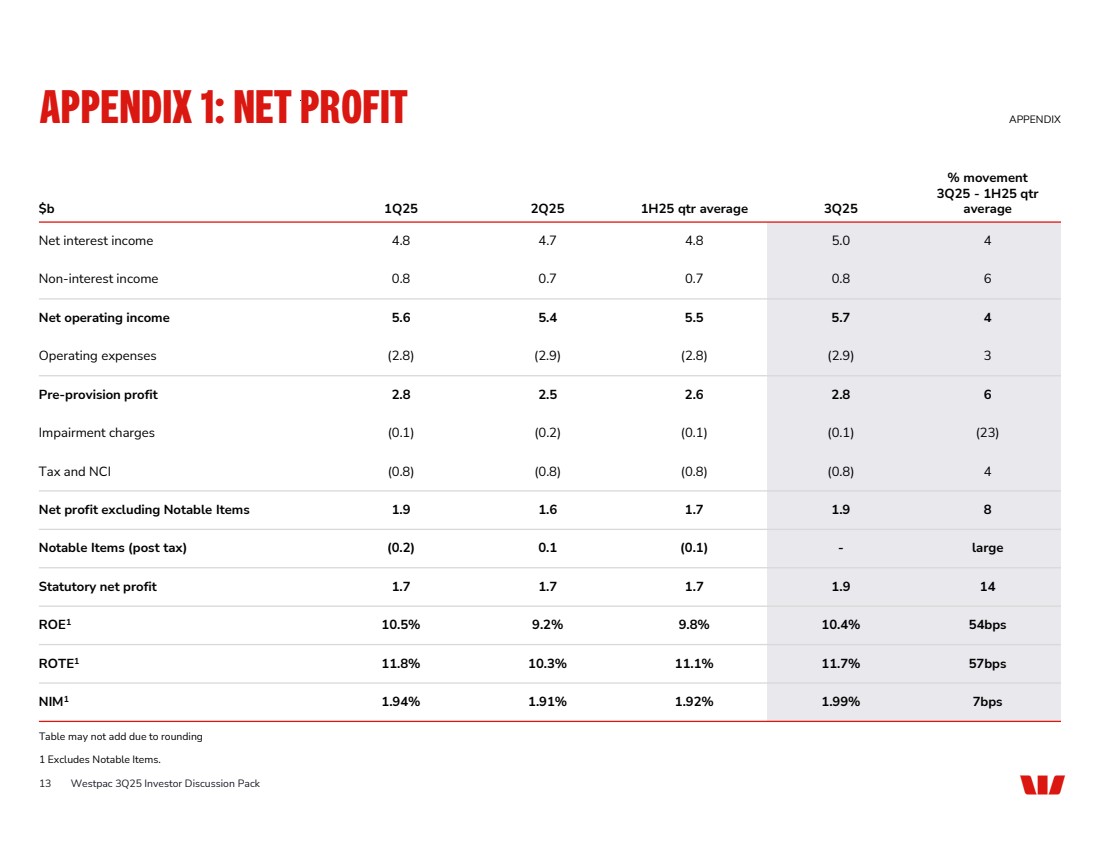
| Table may not add due to rounding 1 Excludes Notable Items. APPENDIX 1: NET PROFIT APPENDIX % movement 3Q25 - 1H25 qtr $b 1Q25 2Q25 1H25 qtr average 3Q25 average Net interest income 4.8 4.7 4.8 5.0 4 Non-interest income 0.8 0.7 0.7 0.8 6 Net operating income 5.6 5.4 5.5 5.7 4 Operating expenses (2.8) (2.9) (2.8) (2.9) 3 Pre-provision profit 2.8 2.5 2.6 2.8 6 Impairment charges (0.1) (0.2) (0.1) (0.1) (23) Tax and NCI (0.8) (0.8) (0.8) (0.8) 4 Net profit excluding Notable Items 1.9 1.6 1.7 1.9 8 Notable Items (post tax) (0.2) 0.1 (0.1) - large Statutory net profit 1.7 1.7 1.7 1.9 14 ROE 10.5% 9.2% 9.8% 10.4% 54bps 1 ROTE 11.8% 10.3% 11.1% 11.7% 57bps 1 NIM 1.94% 1.91% 1.92% 1.99% 7bps 1 13 Westpac 3Q25 Investor Discussion Pack |
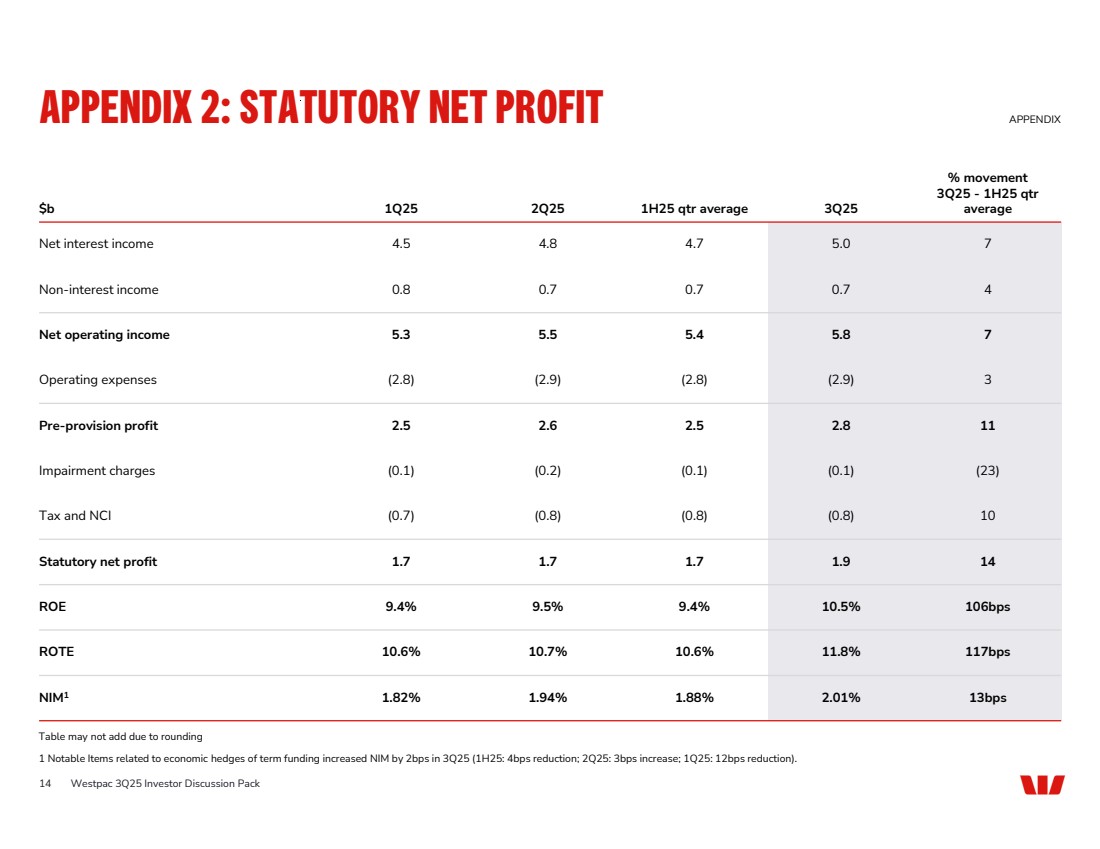
| APPENDIX 2: STATUTORY NET PROFIT APPENDIX % movement 3Q25 - 1H25 qtr $b 1Q25 2Q25 1H25 qtr average 3Q25 average Net interest income 4.5 4.8 4.7 5.0 7 Non-interest income 0.8 0.7 0.7 0.7 4 Net operating income 5.3 5.5 5.4 5.8 7 Operating expenses (2.8) (2.9) (2.8) (2.9) 3 Pre-provision profit 2.5 2.6 2.5 2.8 11 Impairment charges (0.1) (0.2) (0.1) (0.1) (23) Tax and NCI (0.7) (0.8) (0.8) (0.8) 10 Statutory net profit 1.7 1.7 1.7 1.9 14 ROE 9.4% 9.5% 9.4% 10.5% 106bps ROTE 10.6% 10.7% 10.6% 11.8% 117bps NIM 1.82% 1.94% 1.88% 2.01% 13bps 1 14 Westpac 3Q25 Investor Discussion Pack Table may not add due to rounding 1 Notable Items related to economic hedges of term funding increased NIM by 2bps in 3Q25 (1H25: 4bps reduction; 2Q25: 3bps increase; 1Q25: 12bps reduction). |
| AIEA Average interest earning assets CAP Collectively assessed provisions CET1 capital ratio Common equity tier one capital ratio LCR Liquidity coverage ratio NIM Net interest margin NSFR Net stable funding ratio ROE Return on average equity ROTE Return on average tangible equity RWA Risk weighted assets TCE Total committed exposures APPENDIX 3: ABBREVIATIONS Westpac 3Q25 Investor Discussion Pack APPENDIX 15 |
| INVESTOR RELATIONS TEAM – CONTACT US CONTACT US INVESTOR RELATIONS CONTACT SHARE REGISTRY CONTACT For all shareholding enquiries relating to: • Address details and communication preferences • Updating bank account details, and participation in the dividend reinvestment plan For all matters relating to Westpac’s strategy, performance and results 1800 804 255 westpac@cm.mpms.mufg.com au.investorcentre.mpms.mufg.com +61 2 9178 2977 investorrelations@westpac.com.au westpac.com.au/investorcentre Westpac 3Q25 Investor Discussion Pack Lucy Wilson Head of Corporate Reporting and ESG Catherine Garcia Head of Investor Relations, Institutional Arthur Petratos Manager, Shareholder Services Laura Babaic Graduate, Investor Relations Jacqueline Boddy Head of Debt Investor Relations Justin McCarthy General Manager, Investor Relations James Wibberley Manager, Investor Relations Nathan Fontyne Senior Analyst, Investor Relations 16 |

| DISCLAIMER The material contained in this presentation is intended to be general background information on Westpac Banking Corporation (Westpac) and its activities. The information is supplied in summary form and is therefore not necessarily complete. It is not intended that it be relied upon as advice to investors or potential investors, who should consider seeking independent professional advice depending upon their specific investment objectives, financial situation or particular needs. The material contained in this presentation may include information derived from publicly available sources that have not been independently verified. No representation or warranty is made as to the accuracy, completeness or reliability of the information. All amounts are in Australian dollars unless otherwise indicated. This presentation contains statements that constitute “forward-looking statements” within the meaning of Section 21E of the US Securities Exchange Act of 1934. Forward-looking statements are statements that are not historical facts. Forward-looking statements appear in a number of places in this presentation and include statements regarding our intent, belief or current expectations with respect to our business and operations, macro and micro economic and market conditions, results of operations and financial condition, capital adequacy, liquidity and risk management, including, without limitation, future loan loss provisions and financial support to certain borrowers, forecasted economic indicators and performance metric outcomes, indicative drivers, climate- and other sustainability-related statements, commitments, targets, projections and metrics, and other estimated and proxy data. We use words such as ‘will’, ‘may’, ‘expect’, ‘intend’, ‘seek’, ‘would’, ‘should’, ‘could’, ‘continue’, ‘plan’, ‘estimate’, ‘anticipate’, ‘believe’, ‘probability’, ‘indicative’, ‘risk’, ‘aim’, ‘outlook’, ‘forecast’, ‘f’cast’, ‘f’, ‘assumption’, ‘projection’, ‘target’, ‘goal’, ‘guidance’, ‘ambition’, ‘objective’ or other similar words to identify forward-looking statements, or otherwise identify forward-looking statements. These forward-looking statements reflect our current views on future events and are subject to change, certain known and unknown risks, uncertainties and assumptions and other factors which are, in many instances, beyond our control (and the control of our officers, employees, agents and advisors), and have been made based on management’s expectations or beliefs concerning future developments and their potential effect upon us. Forward-looking statements may also be made, verbally or in writing, by members of Westpac’s management or Board in connection with this presentation. Such statements are subject to the same limitations, uncertainties, assumptions and disclaimers set out in this presentation. There can be no assurance that future developments or performance will align with our expectations or that the effect of future developments on us will be those anticipated. Actual results could differ materially from those we expect or which are expressed or implied in forward-looking statements, depending on various factors including, but not limited to, those described in the sections titled ‘Our Operating Environment’ and ‘Risk Management' in our 2024 Annual Report, as well as the section titled ‘Risk Factors’ in our 2025 Interim Financial Results Announcement (each available at www.westpac.com.au). When relying on forward-looking statements to make decisions with respect to us, investors and others should carefully consider such factors and other uncertainties and events. Except as required by law, we assume no obligation to revise or update any forward-looking statements contained in this presentation, whether from new information, future events, conditions or otherwise, after the date of this presentation. We also make statements about our processes and policies (including what they are designed to do) as well as the availability of our systems or product features. Systems, processes and product features can be subject to disruption, and may not always work as intended, so these statements are limited by the factors described in the section titled ‘Risk Management’ in our 2024 Annual Report, as well as the section titled ‘Risk Factors’ in our 2025 Interim Financial Results Announcement DISCLAIMER 17 Westpac 3Q25 Investor Discussion Pack |